Volunteering and Charitable Giving - Community Life Survey 2020/21
Published 29 July 2021
Applies to England

© Crown copyright 2021
This publication is licensed under the terms of the Open Government Licence v3.0 except where otherwise stated. To view this licence, visit nationalarchives.gov.uk/doc/open-government-licence/version/3 or write to the Information Policy Team, The National Archives, Kew, London TW9 4DU, or email: psi@nationalarchives.gov.uk.
Where we have identified any third party copyright information you will need to obtain permission from the copyright holders concerned.
This publication is available at https://www.gov.uk/government/statistics/community-life-survey-202021-volunteering-and-charitable-giving/volunteering-and-charitable-giving-community-life-survey-202021
The Community Life Survey is a household self-completion survey (online, with paper survey for adults not digitally engaged) of adults aged 16+ in England. This chapter summarises results related to volunteering and charitable giving from the 2020/21 survey, which ran from April 2020 to March 2021.
Differences between groups are only reported on in this publication where they are statistically significant i.e. where we can be confident that the differences seen in our sampled respondents reflect the population[footnote 1].
Volunteering participation levels
The Community Life Survey and the Community Life Re-contact Survey both cover participation in volunteering, however they approach the topic from different perspectives.
The Community Life Survey reports the incidence of volunteering among the sample. Respondents are not the same year to year in the Community Life Survey and so the survey only provides a representative snapshot of what proportion of people in the country are volunteering. This allows us year to year to compare the net change in volunteering.
The Community Life Re-contact Survey instead compares survey data from the same respondents over two time periods which allows us to infer the gross change within this sample.
1. Formal volunteering
In the Community Life Survey, formal volunteering refers to those who have given unpaid help to groups or clubs, for example, leading a group, administrative support, mutual aid groups or befriending or mentoring people.
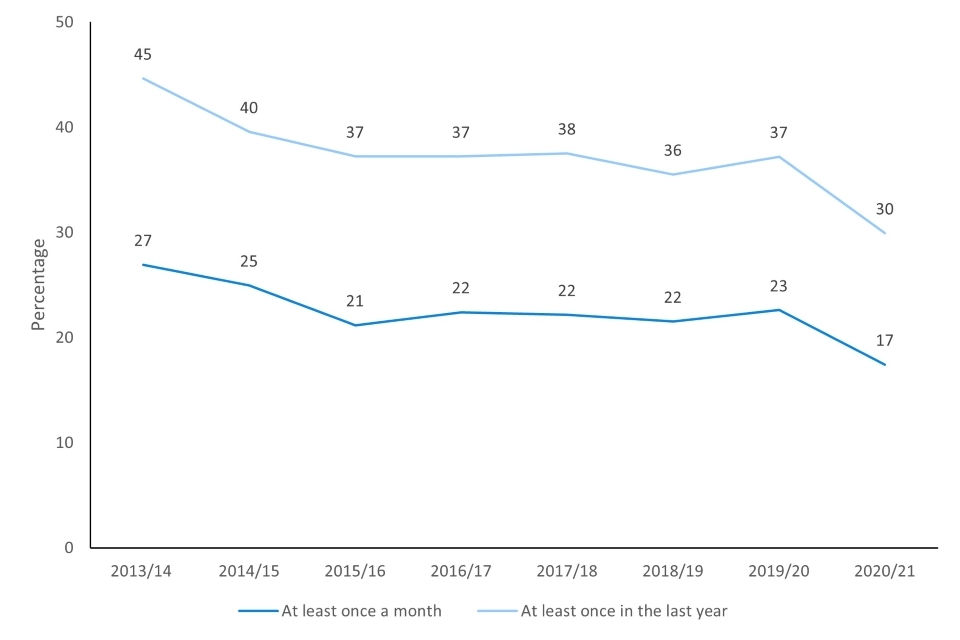
In 2020/21, 17% of respondents (approximately 8 million people in England) took part in formal volunteering at least once a month in the past 12 months, the lowest recorded participation rate since data collection in the CLS. This is lower than 2019/2020 when 23% of adults took part in formal volunteering at least once a month (approximately 11 million people in England).
In 2020/21, 30% of respondents reported taking part in formal volunteering at least once in the last year (approximately 14 million people in England). This is lower than 2019/20 (37%, approximately 17 million people) and in 2013/14 (45%, approximately 21 million people). This participation rate is the lowest recorded by the Community Life Survey.
Figure 5.1 - Participation in formal volunteering, 2013/14 – 2020/21
For formal volunteering at least once a month in the last 12 month:
-
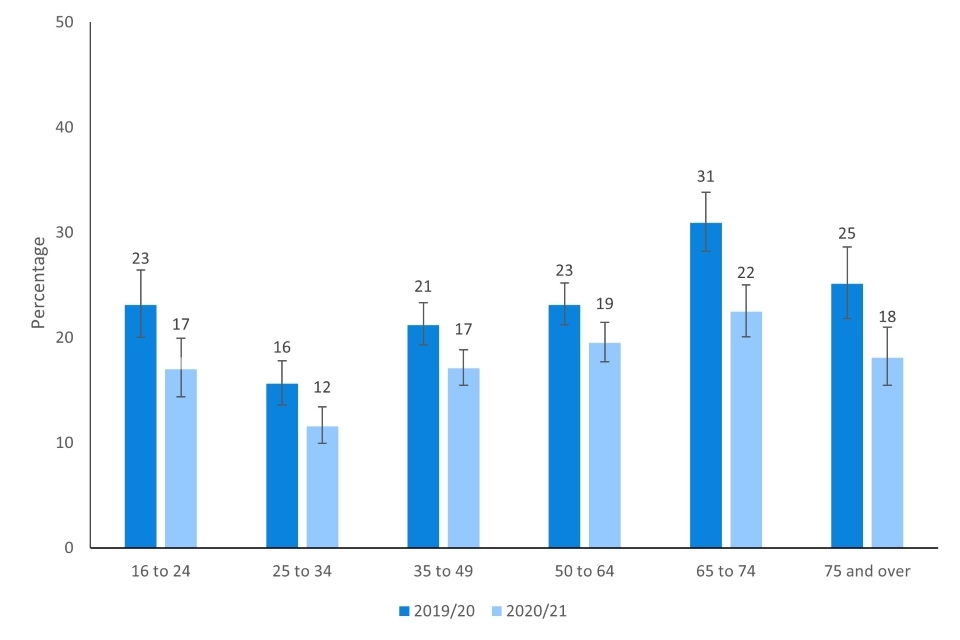
In 2020/21 respondents in the age group 25-34 showed lower participation in volunteering at least once a month compared to respondents in every other age group for formal volunteering (12% vs 17%-22%). Every age group, except respondents aged 50-64 was lower in formal volunteering participation rates at least once a month in 2020/21 than in 2019/20.
-
Respondents from a Black ethnic group (23%) showed higher participation in formal volunteering at least once a month than respondents from an Asian ethnic group (14%). Respondents from a White ethnic group saw a decrease in formal volunteering at least once a month, dropping from 23% in 2019/20 to 18% in 2020/21.
-
Formal volunteering at least once a month was higher for those economically inactive (21%) compared to employed respondents (18%). However, rates for employed respondents who volunteered at least once a month were lower than in 2019/20 (22%). The proportion of economically inactive respondents who volunteered at least once a month was lower in 2020/21 (21%) than in 2019/20 (29%).
-
Those living in rural areas showed higher participation in volunteering than those in urban areas (24% vs 16% at least once a month).
-
Those from the least deprived areas showed higher participation than those from the most deprived areas (23% vs 12% at least once a month). At each quintile of deprivation, there were lower volunteering rates than in 2019/20.
-
No variability was seen between gender, disability or region categories.
Figure 5.2 - Participation in formal volunteering by age group, 2019/20 - 2020/21
For formal volunteering at least once in the last 12 months:
-
In 2020/21 respondents in the age group 25-34 showed lower participation in formal volunteering at least once a year compared to respondents in every other age group except for those 75 and over (23% vs 31-33%). Every age group, except 50 to 64 year olds, was lower in formal volunteering participation rates in 2020/21 than in 2019/20.
-
Volunteering rates for respondents from a White ethnic group who volunteered at least once in the last year dropped from 38% in 2019/20 to 30% in 2020/21.
-
Rates of formal volunteering at least once a year dropped in both employed and economically inactive respondents from 2019/20 to 2020/21 (employed 40% to 33%; economically inactive 41% to 31%).
-
Those living in rural areas showed higher participation in volunteering than those in urban areas (36% vs 29% in the last year).
-
Those from the least deprived areas showed higher participation than those from the most deprived areas (38% vs 22% in the last year).
2. Informal volunteering
In the Community Life Survey, informal volunteering is defined as giving unpaid help to individuals who are not a relative. For example, babysitting or caring for children, keeping in touch with someone who has difficulty getting out and about, or helping out with household tasks such as cleaning, laundry or shopping.
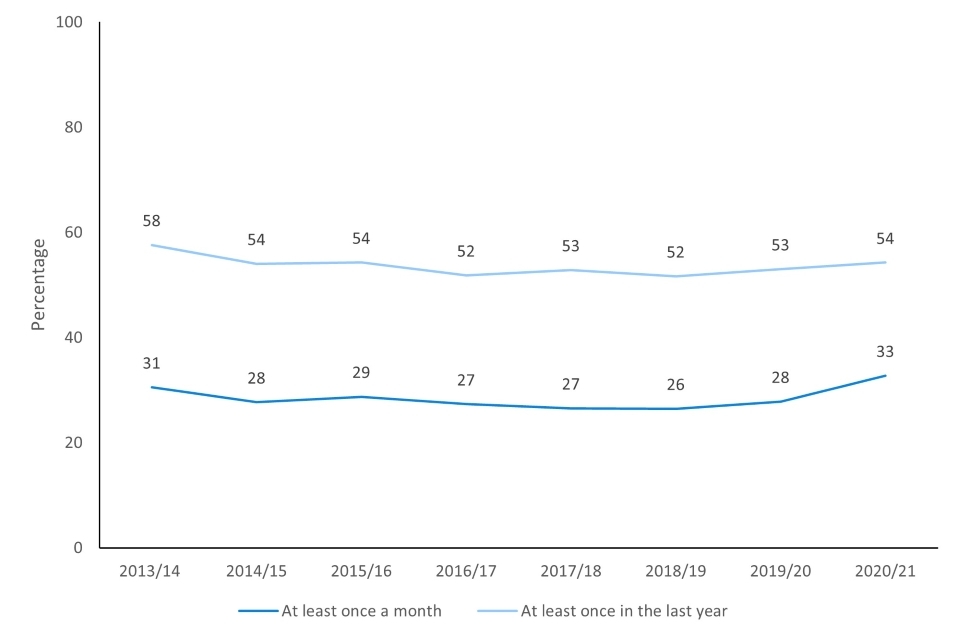
In 2020/21, 33% of respondents (approximately 15 million people in England) had taken part in informal volunteering at least once a month. This proportion is higher than in 2019/20 and the highest recorded since data collection began. In 2020/21, 54% (approximately 25 million people in England) of respondents had taken part at least once in the last year, similar to 2019/20 but lower than in 2013/14 when 58% took part.
Figure 5.3 - Participation in informal volunteering, 2013/14 – 2020/21
For informal volunteering at least once a month in the last 12 month:
-
Informal volunteering at least once a month was more popular for women than men (37% vs 28%). Compared to 2019/20 there has been an increase in both genders informally volunteering at least once a month (men 2019/20 25% vs 2020/21 28% and women 2019/20 31% vs 2020/21 37%). The number of respondents who reported their gender as ‘other’ was too small and so no analysis has been conducted here to avoid being disclosive.
-
There was an increase in informal volunteering from 2019/20 to 2020/21 at least once a month in age groups 25 to 34 (24% to 31%), 35 to 49 (24% to 31%) and 50 to 64 (27% to 34%). Those in the age group 65 to 74 were the more likely to informally volunteer at least once a month (37%) compared to respondents in the age groups 25 to 34 (31%) and 35 to 49 (31%).
-
The proportion of respondents from a White ethnic group informally volunteering at least once a month increased from 2019/20 to 2020/21 (28% to 33%).
-
Those with a long term limiting illness or disability participated more in informal volunteering in the last month than those without (33% vs 28%).
-
Volunteering at least once a month was higher for respondents who were economically inactive (37%) compared to employed respondents (32%). There was an increase in informal volunteering at least once a month for employed respondents (26% to 32%).
-
No variability was seen between regions. However informal volunteering at least once a month increased in the East of England and South East from 2019/20 to 2020/21 (East of England 2019/20, 26%, 2020/21 33%; South East 2019/20 27%, 2020/21 34%)
-
Those living in rural areas showed a higher participation in informal volunteering in the last month than those in urban areas (37% vs 32%).
-
Those from the least deprived areas showed higher participation than those from the most deprived areas in informal volunteering at least once a month (36% vs 30%).
For informal volunteering at least once in the last 12 months:
-
Informal volunteering was more popular for women than men (58% vs 51% in the last year). The number of respondents who reported their gender as ‘other’ was too small and so no analysis has been conducted here to avoid being disclosive.
-
Those living in rural areas showed a higher participation in informal volunteering at least once in the last year (60% vs 53%)
-
The difference in incidence of informal volunteering at least once in the last year is also seen between respondents from the least deprived (60%) and most deprived areas (48%).
3. Formal and informal volunteering
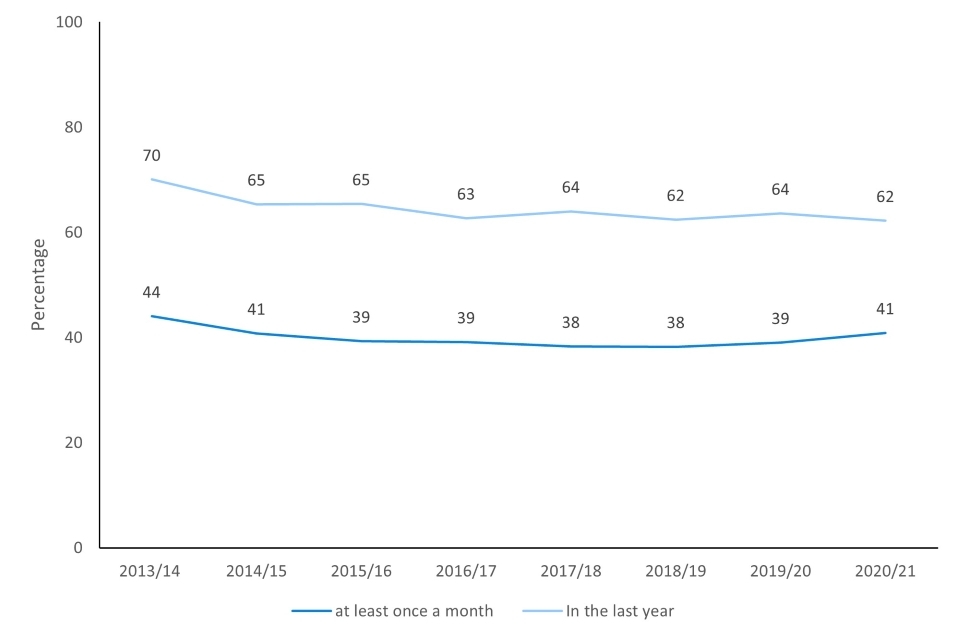
In 2019/20, 41% of respondents (approximately 19 million people in England) had taken part in either formal or informal volunteering at least once a month. This was in line with rates in 2019/20. In the same period, 62% (approximately 28 million people in England) had taken part in either formal or informal volunteering at least once in the last 12 months. This was in line with rates in 2019/20.
Figure 5.4 - Participation in any formal or informal volunteering, 2013/14 – 2020/21
4. Motivators and barriers to volunteering
Respondents who reported volunteering were asked about their reasons for participating in formal volunteering. Those who didn’t volunteer regularly were asked about their barriers to doing so. They were invited to select all responses that applied.
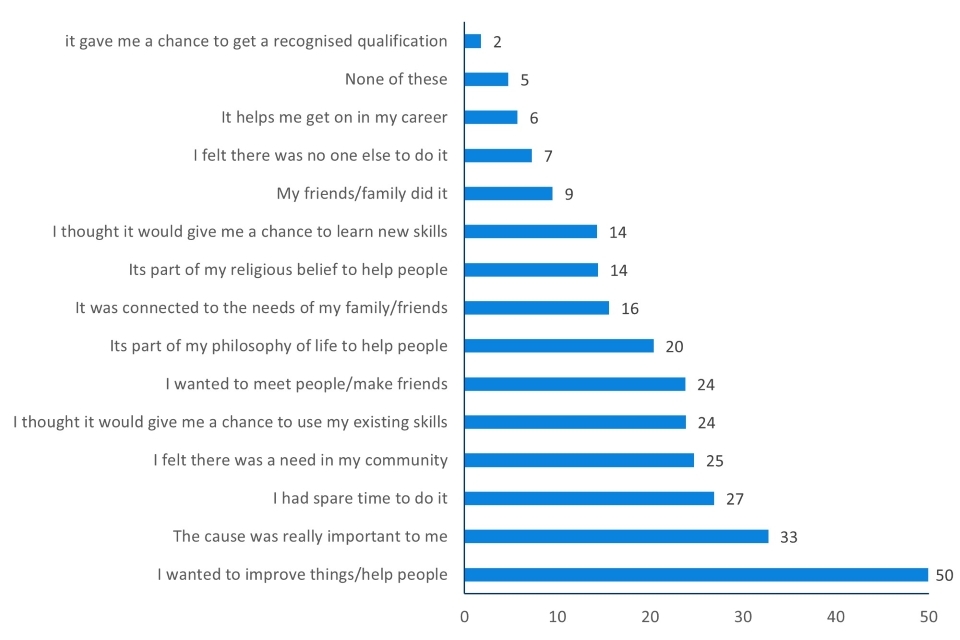
Most common reasons for formal volunteering
-
‘I wanted to improve things/help people’ – 50%
-
‘The cause was really important to me’ – 33%
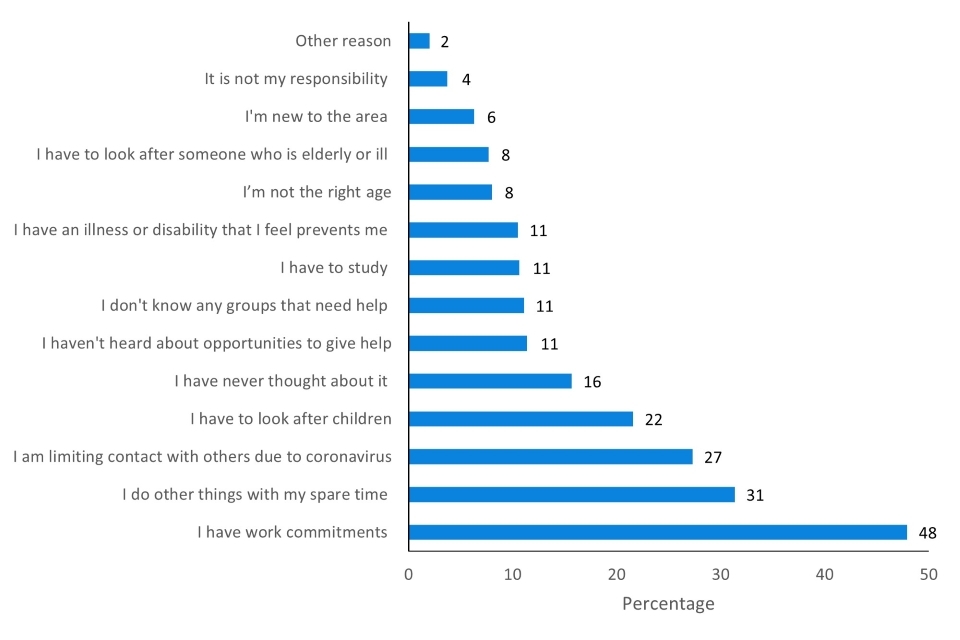
Most common barriers for formal volunteering
-
‘I have work commitments’ – 48%
-
‘I do other things in my spare time’ – 31%
Figure 5.5 shows the percentage for all reasons listed.
Figure 5.5 - Reasons for taking part in formal volunteering, 2020/21
Respondents who did not indicate they had taken part in formal volunteering, or who did formal volunteering less frequently than once a month were asked about their reasons for not volunteering/ not volunteering more frequently. Work commitments, doing other things in their spare time and looking after children were commonly cited as barriers to volunteering.
Having work commitments became less common as a response, decreasing from 53% in 2019/20 to 48% in 2020/21. Additionally, having to look after children was chosen by 22% of respondents in 2020/21, a decrease from 26% in 2019/20. Having other things to do in their spare time was reported less as a barrier in 2020/21 than in 2019/20 (31% compared to 37% respectively). 27% of respondents said they were limiting contact with others due to coronavirus as a barrier to formal volunteering.
Figure 5.6 - Reasons given for not taking part in formal volunteering or not volunteering more frequently, 2020/21
5. Charitable giving
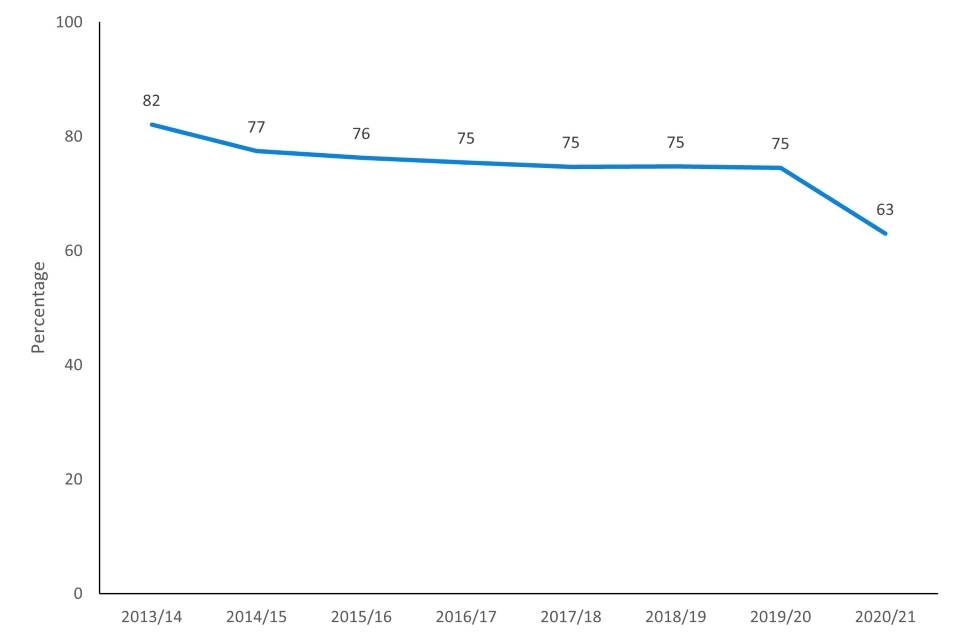
In 2020/21, 63% of respondents (approximately 28 million people in England) said they had given money to charitable causes in the last 4 weeks, a decrease from 2019/20 (75%, approximately 33 million people) and lower still than 2013/14 when 82% (approximately 44 million people) had given to charitable causes. The rate in 2013/14 is higher than all other subsequent survey years. Without comparable data for years prior to this, it is not possible to conclude whether 2013/14 had unusually high levels of charitable giving, or whether this was part of a longer downward trend.
Figure 5.7 - Percentage who gave to charitable causes in the 4 weeks prior to completing the survey, 2013/14 – 2020/21
-
Women were more likely than men to have given to charity in the last 4 weeks (67% vs 59%). The proportion of both men and women giving to charity in the past four weeks prior to interview decreased from 2019/20 to 2020/21 (men 70% to 59% and women 79% to 67%). The number of respondents who reported their gender as ‘other’ was too small and so no analysis has been conducted here to avoid being disclosive.
-
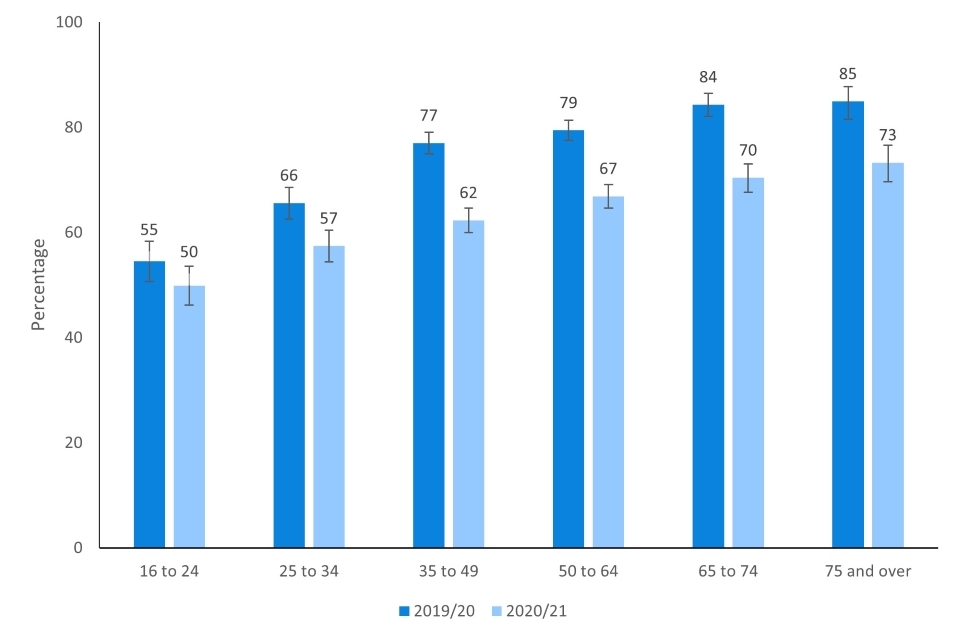
The lowest proportion of charitable giving was from the 16-24 age group (50%) and the highest proportions from the 65-74 and 75+ age groups (70% and 73% respectively). All age groups other than 16 to 24, saw a decrease in the incidence of charitable giving.
Figure 5.8 - Percentage who gave to charitable causes in the 4 weeks prior to completing the survey by age, 2019/20 - 2020/21
-
There was no variability between ethnic groups in terms of charitable giving. Each ethnic group saw a decrease in charitable giving in the last 4 weeks prior to interview in 2020/21 compared to 2019/20. Respondents from a White ethnic group and from an Asian ethnic group were less likely to be involved in charitable giving than in 2019/20 (respondents from a White ethnic group decreased from 75% in 2019/20 to 63% in 2020/21; respondents from an Asian ethnic group decreased from 73% in 2019/20 to 65% in 2020/21).
-
Respondents living in the least deprived areas were more likely to have given to charity in the last 4 weeks (67%) than the most deprived (60%).
-
No variability was seen between disability, rural/urban areas or region categories.
The average amount given was £27 (excluding those who donated £300 or more). In 2020/21, 18% of respondents gave over £50, which was higher than 2019/20 (15%). In addition, 10% of respondents donated £4 or less.
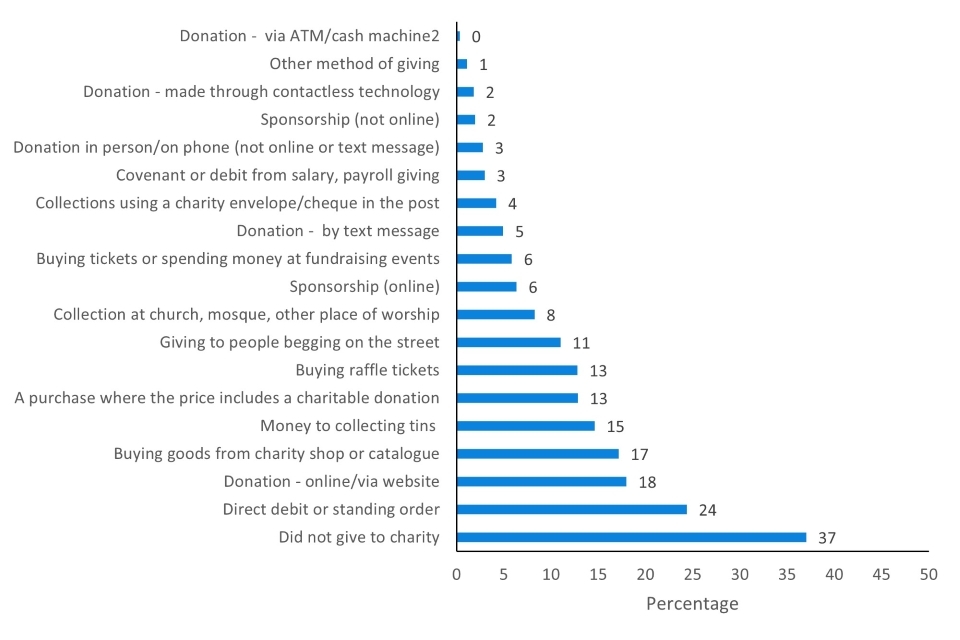
6. Methods of giving to charitable causes
Giving through direct debit or standing order (24%) and donations made online or a website (18%) were the most common methods for donating. This has changed from 2019/20 when the most popular method of donation was collection tins (2019/20 - 28%, 2020/21 - 15%) and through charity shops or catalogues (2019/20 - 28%, 2020/21 - 17%). These changes reflect the restrictions on charity shops and other outlets where collections tins could be situated being opened during the survey year.
Figure 5.9 - Methods of giving to charitable causes in the last four weeks, 2020/21
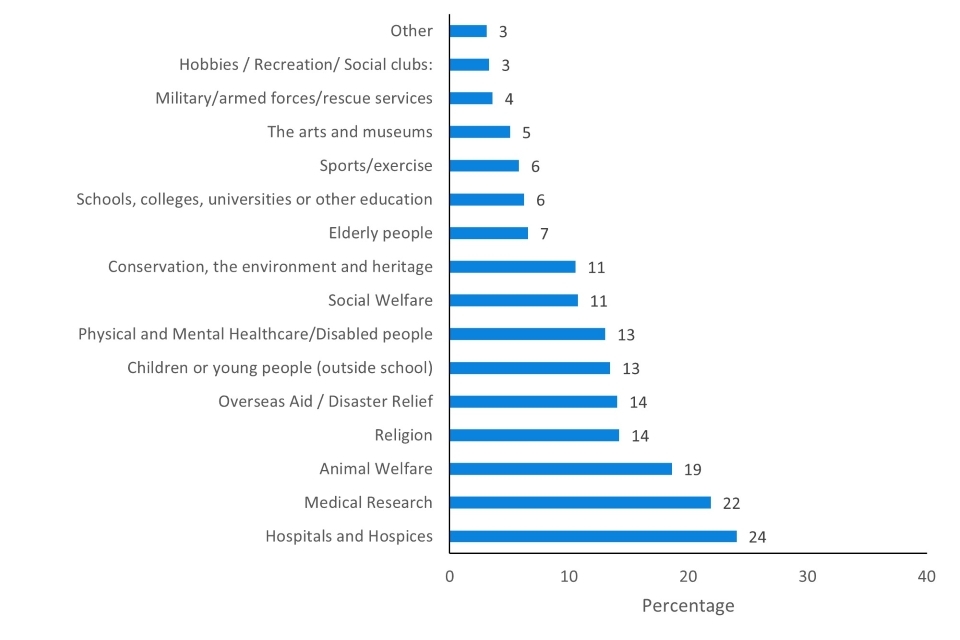
7. Charitable causes donated to
Of those who gave to charitable causes, 24% gave to hospitals and hospices which was in line with 2019/20 rates, 22% gave to medical research which was lower than in 2019/20 (27%) and 19% gave to animal welfare which was in line with 2019/20 rates.
Figure 5.10 - Types of causes given to in the last four weeks, 2020/21
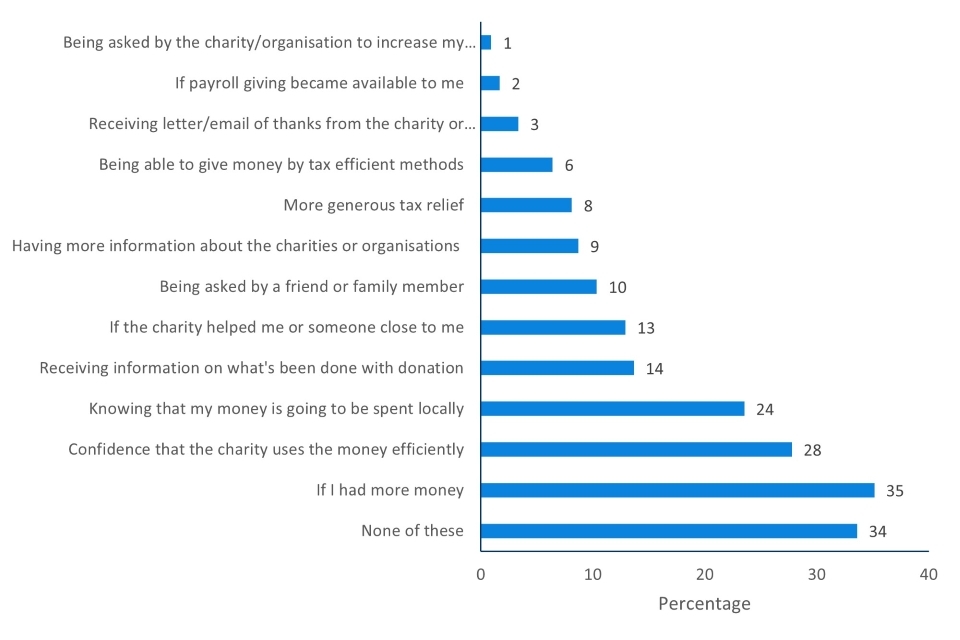
8. Factors which would encourage respondents to give more
When respondents were asked what would either encourage them to start giving to charitable causes, or to increase the amount they currently donate:
- 35% said having more money,
- 28% said having confidence that the charity or organisation uses the money effectively
- 24% said knowing that their money was going to be spent locally.
- 34% said none of the options listed would encourage them to start giving or to give more.
Figure 5.11 - What would make respondents more likely to give to charitable causes or to increase the amount they gave, 2020/21
-
The 95% confidence intervals are indicated by error bars on the charts. They show the range that we are 95% confident the true value for the population falls between. When there is no overlap between the error bars for two or more groups, we can be more confident that the differences between groups represent true differences between these groups in the population. ↩