Community and Engagement Survey 2025/26: Technical Report
Updated 11 August 2026
Applies to England

© Crown copyright 2026
This publication is licensed under the terms of the Open Government Licence v3.0 except where otherwise stated. To view this licence, visit nationalarchives.gov.uk/doc/open-government-licence/version/3 or write to the Information Policy Team, The National Archives, Kew, London TW9 4DU, or email: psi@nationalarchives.gov.uk.
Where we have identified any third party copyright information you will need to obtain permission from the copyright holders concerned.
This publication is available at https://www.gov.uk/government/statistics/community-and-engagement-survey-202526-supplementary-documents/community-and-engagement-survey-202526-technical-report--2
1. Introduction
1.1 Background to the survey
The Community and Engagement Survey (CES) was launched by the Department for Culture, Media and Sport (DCMS) in 2025, with support from the Ministry of Housing, Communities and Local Government (MHCLG). It is designed to provide robust evidence on how people in England engage with their community and with culture, media and live sport and allows respondents’ views to be heard on a range of issues affecting their local area. The CES supports policy development across government and provides evidence for a wide range of stakeholders, including public bodies and the voluntary and community sectors .
The CES was established following a 2024 public consultation on DCMS’ household surveys, which identified opportunities to modernise and streamline two long-standing surveys: the Participation Survey and the Community Life Survey, combining them into a single survey operating in practice as a joint instrument. This integration was intended to improve efficiency and reduce duplication, while also enabling more coherent and consistent outputs across topic areas. The combined design also allows selected questions from both legacy surveys to be asked of a wider sample, providing new analytical opportunities, including the potential for more granular geographic analysis and the ability to explore relationships between community engagement and cultural participation.
The survey captures a broad range of topics, including civic participation, volunteering, social connections, and engagement with cultural and sporting activities. The findings are intended to help government and other organisations understand both levels of engagement and the factors that support or hinder participation, thereby informing policy decisions, programme delivery and evaluation. In particular, the survey provides evidence to support policy areas such as community cohesion, local growth and devolution, as well as investment decisions across cultural and sporting sectors.
The CES continues the use of an Address-Based Online Surveying (ABOS) approach, also known as ‘push-to-web’, whereby a random sample of addresses is invited to participate online, with paper options available to ensure inclusivity. The survey targets people aged 16 and over living in England and is designed to achieve large, nationally representative samples. For 2025/26, the survey incorporates two pathways: a ‘Community’ pathway, broadly incorporating the topics previously covered in the Community Life Survey, and an ‘Engagement’ pathway, incorporating topics previously covered in the Participation Survey.
The target respondent sample sizes for CES 2025/26 were:
-
175,000 for the Community pathway – allowing for data analysis at Local Authority level
-
16,500 for the Engagement pathway – allowing for data analysis at ITL2 Regions level (data from this pathway was merged with the last two quarters of the Participation Survey to produce a sample size large enough for this (see section 5.7 for details).
Figure 1.1: The Community and Engagement Survey flow
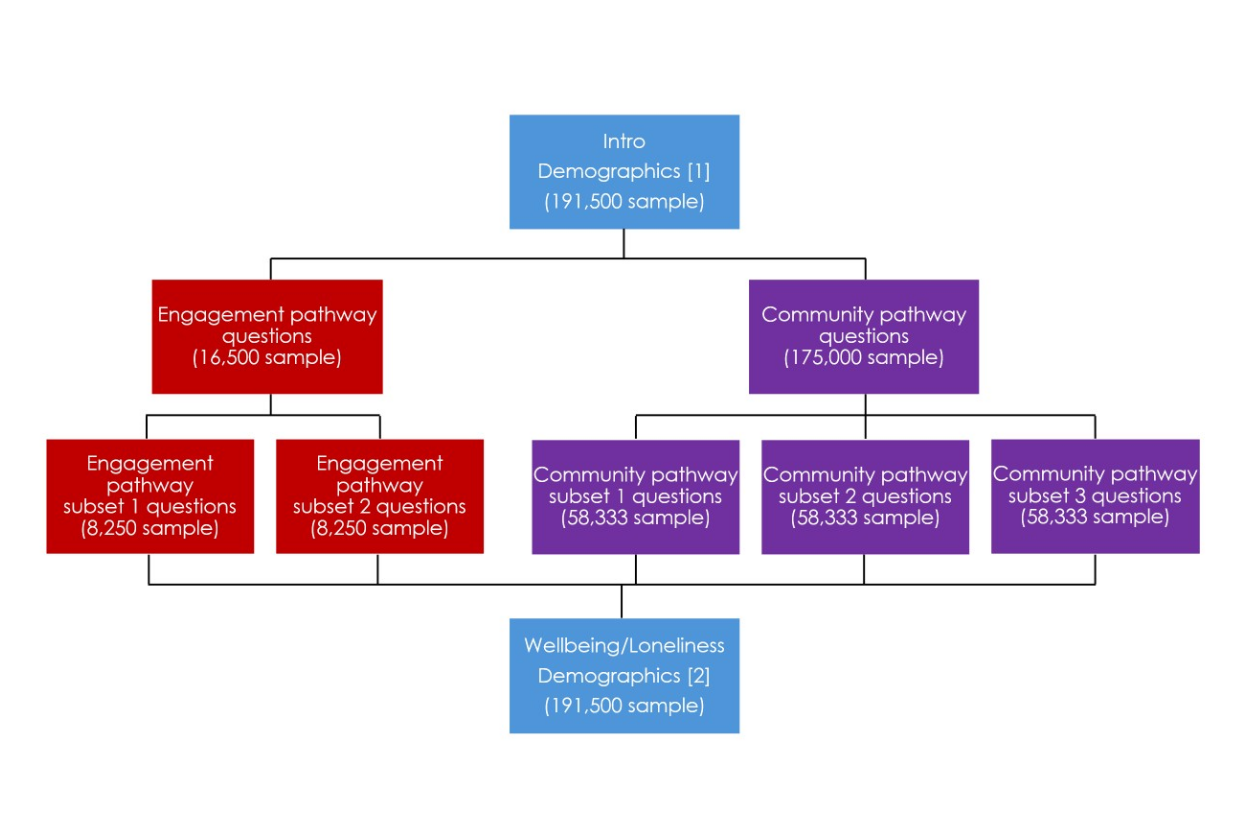
Breakdown of how many respondents were directed across the different survey pathways and subsets of questions.
Fieldwork for the CES was divided into two quarters:
-
Quarter 1: October to December 2025
-
Quarter 2: January to March 2026
Data published for the Engagement pathway 2025/26 has been merged with the final two quarters of the Participation Survey 2025/26:
-
April to June 2025
-
July to September 2025
1.2 Survey objectives
Across both pathways, the key objectives of the CES 2025/26 were as follows:
-
Robust, nationally representative data on behaviours and attitudes within communities that can be used to inform and direct policy and research in these areas.
-
Evidence for policymakers in government, public bodies, voluntary, community and social enterprise (VCSE) sector organisations and other external stakeholders.
-
Measures of loneliness in England.
-
Monitoring and informing government policy and programmes in DCMS and other government departments (OGDs) on engagement with the DCMS sectors.
-
Assessing the variation in engagement with cultural activities across DCMS sectors in England, and the differences in socio-demographics such as location, age and education.
1.3 Survey design
The basic ABOS design for the CES is simple: a stratified random sample of addresses is drawn from the Royal Mail’s postcode address file and an invitation letter is sent to each one, containing username(s) and password(s) plus the URL of the survey website (a QR code is also provided for those who prefer to access via this method).
Sampled individuals can log on using this information and complete the survey similar to other web survey approaches. Once the questionnaire is complete, the specific username and password cannot be used again, ensuring data confidentiality from others with access to this information.
It is usual for at least one reminder to be sent to each sampled address, and it is also usual for an alternative mode (usually a paper questionnaire) to be offered to those who need it or would prefer it. It is typical for this alternative mode to be available only on request at first. However, after non-response to one or more web survey reminders, this alternative mode may be given more prominence.
Paper questionnaires ensure coverage of the offline population and are especially effective with sub-populations that respond to online surveys at lower-than-average levels. However, paper questionnaires have measurement limitations that constrain the design of the online questionnaire and also add considerably to overall cost. For CES, paper questionnaires are used in a limited and targeted way, to optimise rather than maximise response.
2. Sampling
2.1 Sample design: addresses
The address sample design is intrinsically linked to the data collection design (see section 2.3 for details) and was designed to yield a respondent sample that is representative with respect to neighbourhood deprivation level and age group within each of the 296 local authorities, 36 ITL2 regions[footnote 1] and 9 ITL1 regions in England. This approach limits the role of weights in the production of unbiased survey estimates, narrowing confidence intervals compared with other designs.
The design sought a minimum two-quarter respondent sample size of 500 allocated to the Community module per local authority[footnote 2] and 450 allocated to the Engagement module per ITL2 region. Although there were no specific targets per quarter, the sample selection process was designed to ensure that the respondent sample size per local authority and per ITL2 region was approximately the same per quarter.
As a first step, a stratified master sample of 1,706,290 addresses in England was drawn from the Postcode Address File (PAF) ‘residential & small user’ subframe. Of these, 1,595,151 were eligible to issue (eligible = not issued for either the Community Life or Participation Surveys since 2022/23 (unless in the Isles of Scilly or City of London)). Before sampling, the PAF was disproportionately stratified by lower tier local authority (296 strata) and, within local authority, sorted by (i) neighbourhood deprivation level (five groups, each of a similar scale at the national level), (ii) medium layer super output area, (iii) lower layer super output area, (iv) census output area, (v) postcode, and finally (vi) first line of address. This ensured that the master sample of addresses was geodemographically representative within each stratum.
This master sample of addresses was then augmented by data supplier CACI. For each address in the master sample, CACI added the expected number of resident people in each ten-year age band. Although this auxiliary data will have been imperfect, investigations by Verian have shown that it is highly effective at identifying households that include older people. Once this data was attached, the master sample was additionally stratified by expected household age structure based on the CACI data:
(i) any aged 65 or older (28% of the total)
(ii) other addresses (72% of the total)
The conditional sampling probability in each stratum was varied to compensate for (expected) residual variation in response rate that could not be ‘designed out’, given the constraints of budget and timescale. The underlying assumptions for this procedure were initially derived from empirical evidence obtained from the 2024/25 Community Life Survey, but these assumptions were updated for the second quarter sample issue based on evidence from the first quarter sample issue.
Verian initially drew a stratified random sample of 853,208 addresses from the master sample of 1,595,151 and systematically allocated them with equal probability to 24 equal-sized ‘replicates’, each with the same profile and scale (35,550 to 35,551 addresses). The expectation was that only the first 16 replicates would be issued (that is, 568,808 addresses), with the remaining 8 kept back in reserve.
There were four issue points across the six-month 2025/26 survey period: two per quarter, so the expectation was that the next four available replicates in each stratum (local authority) would be activated at each issue point (so, eight per quarter; 16 in the whole survey period). The intention was to carry out a stratum level review towards the end of each quarter to inform the selection of replicates for the following quarter.
For quarter 1, the number of replicates issued per local authority ranged from 6 to 10 with a median of 9 (compared to the expected 8). In total, 322,144 addresses were issued for quarter 1.
Verian decided to re-draw the sample for quarter 2 to make use of updated response rate estimates. A stratified random sample of 643,785 addresses was drawn from the master sample but excluding the 322,144 addresses issued for quarter 1. This sample design differed from the initial sample design because the sampling probability of each address needed to account for the differential probability of being issued for quarter 1.
The addresses sampled for quarter 2 were systematically allocated with equal probability to 12 equal-sized ‘replicates’, each with the same profile and scale (53,692 to 53,693 addresses). The expectation was that only the first 8 replicates would be issued (that is, 429,536 addresses), with the remaining 4 kept back in reserve.
For quarter 2, the number of replicates issued per local authority ranged from 5 to 12 with a median of 8 (as expected). In total, 435,052 addresses were issued for quarter 2, very slightly above the expectation of 429,536.
Table 1 shows the (issued) sample structure with respect to the major ‘design’ strata: neighbourhood deprivation level and expected household age structure.
Table 1: Quarterly address issue by area deprivation quintile group and expected household age structure
| Expected household age structure | Most deprived | 2nd | 3rd | 4th | Least deprived |
|---|---|---|---|---|---|
| Quarter 1 | — | — | — | — | — |
| Any ≥65 | 13,520 | 15,572 | 18,092 | 18,509 | 17,578 |
| Other | 57,906 | 54,551 | 48,409 | 41,444 | 36,563 |
| Quarter 2 | — | — | — | — | — |
| Any ≥65 | 20,137 | 21,330 | 23,573 | 24,192 | 23,160 |
| Other | 86,976 | 73,672 | 62,678 | 53,538 | 45,796 |
| Total | — | — | — | — | — |
| Any ≥65 | 33,657 | 36,902 | 41,665 | 42,701 | 40,738 |
| Other | 144,882 | 128,223 | 111,087 | 94,982 | 82,359 |
2.2 Sample design: individuals within sampled addresses
All resident people aged 16+ were invited to complete the survey. In this way, CES avoided the complexity and risk of selection error associated with remote random sampling within households.
However, for practical reasons, the number of logins provided in the invitation letter was limited. The number of logins was varied between two and four, with this total adjusted in reminder letters to reflect household data provided by prior respondent(s). Addresses that CACI data predicted contained only one person were allocated two logins; addresses predicted to contain two people were allocated three logins; and other addresses were allocated four logins. The mean number of logins per address was 2.77. Paper questionnaires were available to those who are offline, not confident online, or unwilling to complete the survey this way.
Every respondent had a fixed probability of being allocated to either the Community or Engagement module. This probability varied between local authorities but not within local authorities. Web respondents were allocated to one of the two modules at the start of the questionnaire using a script-based randomisation tool. Consequently, module allocation could vary between respondents in the same household. In contrast, paper respondents in the same household were allocated to the same module (i.e. the module was allocated at address level rather than at individual level, but the same kind of randomisation tool was used for the allocation).
2.3 Data collection model
For every sampled address, one of four data collection strategies was selected: ‘WW’, ‘WP’, ‘WWW’ or ‘WWP’. This code summarises the data collection design, showing the number of mailings and type of each mailing: push-to-web (W) or mailing with paper questionnaires (P). For example, ‘WWP’ means two push-to-web mailings and a third mailing with paper questionnaires included alongside the web survey login information. In general, there was a two-week gap between mailings.
The selection of data collection strategy was based on (i) an address-level estimate of how the response level would vary under each of the four designs, (ii) whether the address had been coded by CACI as containing someone aged 65+, (iii) a constant that was broadly equivalent to the overall target number of responses per issued address, and (iv) a random number between 0 and 1.
A randomised controlled trial (‘RCT’) was built into the quarter 1 design to allow evaluation of the impact of proactive provision of paper questionnaires (‘P’ mailings) versus reactive provision and of a two-reminder design versus a single reminder design. The random number between 0 and 1 governed the allocation of addresses to trial cell. Every address had a nonzero probability of allocation to each of the four data collection strategies, but the probability of being allocated to a ‘P’ data collection strategy (‘WP’ or ‘WWP’) was much higher if the address had been coded by CACI as containing someone aged 65+ (70% compared to 10% for other addresses). See the contact strategy trial report for more details.
In quarter 1, 152,340 addresses (47%) were allocated to ‘WW’, 61,369 (19%) to ‘WP’, 94,397 (29%) to ‘WWW’, and 14,038 (4%) to ‘WWP’.
For quarter 2, the address-level estimate of how the response level would vary under each of the four designs (factor (i) in the selection of data collection strategy) was based on trial data from quarter 1 rather than other similar surveys. Another difference was that the random number between 0 and 1 governed the allocation of addresses to proactive or reactive provision of paper questionnaires, not the allocation of addresses to any of the four designs. Every address had a nonzero probability of allocation to proactive provision, but the probability was much higher if the address had been coded by CACI as containing someone aged 65+ (50% compared to 5% for other addresses).
In quarter 2, 172,695 addresses (40%) were allocated to ‘WW’, 49,648 (11%) to ‘WP’, 200,327 (46%) to ‘WWW’, and 12,382 (3%) to ‘WWP’.
Across both quarters, 325,035 addresses (43%) were allocated to ‘WW’, 111,017 (15%) to ‘WP’, 294,724 (39%) to ‘WWW’, and 26,420 (3%) to ‘WWP’.
3. Questionnaire
3.1 Questionnaire development
Questionnaire development and piloting work for CES was undertaken between June and September 2025. The online questionnaire was designed to take approximately 30 minutes to complete and largely consisted of existing questions from the Community Life and Participation Surveys. Merging the two surveys into one did allow for some overlapping demographic questions to be consolidated into two sections asked of all participants, one at the beginning of the survey and another at the end.
Two paper questionnaires – one for the Community pathway and the other for the Engagement pathway – were produced. Both paper versions included the same core questions as the online survey, but modular questions asked to a subset of online participants were omitted due to the complexity and cost of implementing a modular design in a paper questionnaire.
There were four stages of questionnaire design and pilot testing:
-
Cognitive testing of new core questions for the survey
-
Usability testing of the paper questionnaires
-
Pilot Survey testing the online questionnaire script
-
Cognitive testing of strength of belonging to Britain follow-up questions (added for quarter 2)
Full details of the questionnaire development work, including reports from each stage listed above, can be found on the Community and Engagement Survey Methodology page.
3.2 Questionnaire changes between fieldwork quarters
A small number of changes were made to the questionnaire between quarter 1 and quarter 2 of 2025/26:
-
SBeGBBel and SBeGBNotBel - Introduction of questions on strength of belonging or not belonging to Britain.
-
CharServ_other, P_Oth and P_OthPART – Addition of wording to question stem to help with responses given to these ‘other specify’ questions.
-
LocPeopNew, LocHow, LocWant and LocBarr1 – Removal of questions with lower priority to make room for SBeGBBel and SBeGBNotBel questions.
-
LocBarr2 – Introduction of new question as replacement for LocBarr1.
-
STUDY2 – Update to question to match recommended filters.
-
JobProd and JobConf – In the Community pathway, these two questions were changed to only be asked of a subsample.
3.3 Paper questionnaire version error
As outlined in section 3.2, a small number of changes were made to the questionnaires between quarters 1 and 2 of CES 2025/26. Updated paper questionnaires for both the Community pathway and Engagement pathway were produced and checked. Due to a technical error at the print and despatch stage, the older versions were erroneously sent out in the first reminder mailing of quarter 2. Table 2 summarises the volumes of incorrect paper questionnaires sent in this mailing.
Table 2: Old versions of paper questionnaires erroneously mailed out in quarter 2 batch 1 first reminder
| Number of questionnaires in pack | Community version | Engagement version |
|---|---|---|
| 1 | 691 | 44 |
| 2 | 21,524 | 1,695 |
| Total | 43,739 | 3,434 |
Table 3 outlines the specific changes to the paper questionnaires that were made between quarters 1 and 2.
Table 3: Changes to paper questionnaires made between quarters 1 and 2
| Variable | Description | Change |
|---|---|---|
| SBeGBBel (Q22b - Community) | Reasons for sense of belonging to Britain | Added new question for Q2 |
| SBeGBNotBel (Q22c – Community) | Reasons for not feeling sense of belonging to Britain | Added new question for Q2 |
| P_Oth (Q38 – other specify) | Involvement in groups, clubs & organisations last 12 months - other | Additional line for clarity in what is being asked for in ‘other specify’ |
| STUDY/STUDY2 (Q87 – Community; Q83 – Engagement) | Education status | Split out full-time and part-time answer codes |
| JobProd (Q93 - Community) | Job satisfaction attitudes | Question moved to subsample on Community side and removed from paper questionnaire |
| JobConf (Q95 – Community) | Confidence about applying for new jobs | Question moved to subsample on Community side and removed from paper questionnaire |
In total, 3,994 quarter 1 versions of the questionnaire were included in the final quarter 2 dataset.
All subsequent mailings for quarter 2 included the updated paper questionnaires. It was agreed that due to the very limited impact of participants completing the older versions of the questionnaire, no further resolution action was necessary.
3.4 Historical income error
CES 2025/26 contained two questions related to income – individual income and joint individual and partner income. Participants were able to answer using bands for weekly, monthly, or annual income. Whilst preparing the quarter 1 data for CES 2025/26, an error was spotted with the consistency of the income bands across the three time-period options.
The first two monthly income bands mistakenly read as follows:
- Up to £316
- £317 up to £432
For these to be equivalent to the weekly and annual income bands in the questionnaires, the bands should have read:
- Up to £216
- £217 up to £432
Upon further investigation, it became clear that this error was historical and had also been present in the Community Life Survey in 2023/24 and 2024/25.
Reviews of the data showed that the proportion of respondents affected by this error was approximately 1% for each of the individual and joint income questions. This is because it only affected those wishing to answer using monthly income bands who fell into the two lowest income levels.
The decision was made to net the responses to the lowest two income bands across all three time periods. This ensured that the error did not affect the final annual data set.
4. Fieldwork
4.1 Fieldwork dates
Fieldwork for CES 2025/26 was conducted between October 2025 and March 2026, with sample issued on a quarterly basis. Each of the two quarters had two issue points (batches) – at the start of the quarter and approximately five weeks later. The specific fieldwork dates for each quarter are shown in table 4.
Table 4: Fieldwork dates by quarter and batch
| Quarter | Batch | Start date | Close date – online survey | Close date – paper survey |
|---|---|---|---|---|
| Quarter 1 | Batch 1 | 15th October 2025 | 31st December 2025 | 12th January 2026 |
| Batch 2 | 19th November 2025 | 31st December 2025 | 12th January 2026 | |
| Quarter 2 | Batch 1 | 5th January 2026 | 31st March 2026 | 8th April 2026 |
| Batch 2 | 11th February 2026 | 31st March 2026 | 8th April 2026 |
4.2 Contact procedures
All selected addresses were sent an initial invitation letter containing the following information:
-
A brief description of the survey
-
The URL of survey website (used to access the online script)
-
A QR code that can be scanned to access the online survey
-
Log-in details for the expected number of household members
-
An explanation that participants will receive a £10 shopping voucher
-
Information about how to contact Verian in case of any queries
The reverse of the letter featured responses to a series of Frequently Asked Questions.
All partially or non-responding households were sent one reminder letter at the end of the second week of fieldwork. A further targeted second reminder letter was sent to households for which, based on Verian’s ABOS field data from previous studies, this was deemed likely to have the most significant impact. The information contained in the reminder letters was similar to the invitation letters, with slightly modified messaging to reflect each reminder stage. Copies of the letters and the FAQs can be found in the Appendix section.
As well as the online survey, respondents were given the option to complete a paper questionnaire, which consisted of an abridged version of the online survey. Each letter informed respondents that they could request a paper questionnaire by contacting Verian using the email address or freephone telephone number provided, and a cut-off date for paper questionnaire requests was also included on the letters.
In addition, some addresses received up to two paper questionnaires in either the first or second reminder letters. This targeted approach was developed based on historical data Verian has collected through other studies, augmented (in quarter 2) by the results from the contact strategy trial in quarter 1.
If a sampled address requested one or multiple paper questionnaires but were not due to receive them as part of their pre-ordained contact strategy, their next reminder mailing was adjusted to include the number of paper questionnaires required. Additionally, at the end of some batches, a further ad hoc mailing was dispatched to provide paper questionnaires for those requested after the last reminder mailing had been processed.
The first mailing of the first issue release of quarter 2 included a mailing experiment, details of which can be found in the quarter 2 technical note (https://gov.uk/government/statistics/community-and-engagement-survey-january-to-march-2026/community-and-engagement-survey-january-to-march-2026-technical-report).
Details of the volumes of letters and paper questionnaires despatched to sampled addresses for CES 2025/26 can be found in table 5.
Table 5: Volumes of letters and paper questionnaires by quarter and batch
| Letter Type | Quarter 1 Batch 1 | Quarter 1 Batch 2 | Quarter 2 Batch 1 | Quarter 2 Batch 2 | Total |
|---|---|---|---|---|---|
| Invite letter | 142,202 | 179,942 | 214,768 | 220,284 | 757,196 |
| Reminder 1 letter - web only | 110,611 | 139,777 | 182,850 | 189,047 | 622,285 |
| Reminder 1 letter - one paper survey included | 1,156 | 1,297 | 735 | 959 | 4,147 |
| Reminder 1 letter - two paper surveys included | 24,714 | 31,913 | 23,219 | 23,133 | 102,979 |
| Reminder 1 letter - three paper surveys included | 9 | 5 | 0 | 5 | 19 |
| Reminder 1 letter - four paper surveys included | 0 | 2 | 0 | 4 | 6 |
| Reminder 2 letter - web only | 38,050 | 48,770 | 88,667 | 96,497 | 271,984 |
| Reminder 2 letter - one paper survey included | 275 | 467 | 403 | 448 | 1,593 |
| Reminder 2 letter - two paper surveys included | 5,454 | 6,875 | 5,434 | 5,916 | 23,769 |
| Reminder 2 letter - three paper surveys included | 0 | 7 | 20 | 7 | 34 |
| Reminder 2 letter - four paper surveys included | 0 | 2 | 6 | 8 | 16 |
| Ad hoc paper questionnaire mailings - one paper survey included | 62 | 0 | 401 | 273 | 736 |
| Ad hoc paper questionnaire mailings - two paper surveys included | 12 | 0 | 136 | 55 | 203 |
| Ad hoc paper questionnaire mailings - three paper surveys included | 2 | 0 | 14 | 6 | 22 |
| Ad hoc paper questionnaire mailings - four or more paper surveys included | 2 | 0 | 10 | 5 | 17 |
4.3 Survey accessibility
The survey website was designed to be accessible to as many people as possible, taking into account best practice web accessibility guidance. The survey interface included the following accessibility features. Each of the following features meets WCAG2.2 A and AA compliance requirements:
-
All question wording appears in plain black or blue text.
-
Summary descriptor for each question appears in the browser tab and can be read by a screen reader.
-
Use of italics and underline are avoided.
-
Response options are set up so that participants can select anywhere in the answer box or on the wording.
-
Next and Back buttons are placed in the same position on every screen.
-
Accessible designs for single, multi, numeric, open text and grid questions.
4.4 Respondent confidentiality
Each of the letters assured the respondent of confidentiality, by answering the question “Is this survey confidential?” with the following:
“Yes, the information you provide is protected by law and treated as confidential. Your contact details will be kept separate from your answers and will not be passed on to any organisation outside of Verian or supplier organisations who assist in running the survey.
Data from the survey will be shared with DCMS, MHCLG and appointed research contractors for the purpose of producing and publishing statistics and policy development and evaluation. The data shared won’t contain your name or contact details, and no individual or household will be identifiable from the published results.
For more information about how we keep your data safe, you can access the survey privacy policies.”
4.5 Fieldwork performance
In total, 202,018 respondents completed the CES 2025/26 survey – split by the Community pathway 185,678 (Web – 167,621 & Paper – 18,057) and Engagement pathway 16,340 (Web – 14,645 & Paper – 1,695). Following data quality checks (see Chapter 5 for details), 9,774 respondents were removed split by the Community pathway 8,733 (Web – 7,863 & Paper – 870) and Engagement pathway 1,041 (Web – 922 & Paper – 119), leaving 192,244 respondents in the final dataset.
There are two types of response rates that are referred to below:
Household response rate – Percentage of households contacted as part of the survey in which at least one questionnaire was completed.
Individual response rate – Estimated response rate amongst all people that were eligible to complete the survey.
CES 2025/26 achieved a 25.39% conversion rate (responses/sampled addresses), a 27.6% household-level response rate, and an individual-level response rate of 14.6%[footnote 3].
4.6 Survey length
For the online survey, completion times for the Community and Engagement Survey was an overall median of 33:31 and a mean of 36:20, which separated out as a median of 34:09 minutes and a mean of 36:58 minutes for the Community pathway, and a median of 26:42 minutes and a mean of 28:55 minutes for the Engagement pathway. Each respondent will have only completed one of the pathways[footnote 4].
4.7 Incentive system
As a thank you for taking part, all respondents that completed CES received an incentive voucher worth £10.
Online incentives
Participants completing the survey online were provided with details of how to claim their e-voucher at the end of the survey and were directed to the provider website, where they could select from a range of different e-vouchers, including electronic shopping vouchers sent via email, credit to visit heritage sites, or a charitable donation.
In a small number of instances, respondents completing the online survey requested a physical paper voucher as a substitute for their e-voucher. This was due to a lack of confidence in using digital systems to select an e-voucher and use it.
Paper incentives
Respondents who returned the paper questionnaire were also provided with a £10 physical shopping voucher. This voucher was sent in the post and could be used at a variety of high street stores.
Incentives were only provided to respondents who confirmed that all their answers were given honestly and represented their own personal views. Anyone who said ‘No’ or did not answer this question was not given an incentive.
5. Data processing
5.1 Data management
Due to the different structures of the online and paper questionnaires, data management was handled separately for each mode. Online questionnaire data was collected via the web script and, as such, was much more easily accessible. By contrast, paper questionnaires were scanned and converted into an accessible format.
For the final outputs, both sets of interview data were converted into IBM SPSS Statistics, with the online questionnaire structure as a base. The paper questionnaire data was converted to the same structure as the online data so that data from both sources could be combined into a single SPSS file.
5.2 Partial completes
Online respondents were able to exit the survey at any time, and while they could return to complete the survey at a later date, some chose not to do so. Equally respondents completing on paper occasionally left part of the questionnaire blank, for example if they did not wish to answer a particular question or section of the questionnaire.
Partial data can still be useful, providing respondents have answered the substantive questions in the survey. These cases are referred to as usable partial interviews.
Survey responses were checked at several stages to ensure that only usable partial interviews were included. Upon receiving the returned paper questionnaire, the booking-in team removed obviously blank paper questionnaires. Following this, during data processing, rules were set for the paper and online surveys to ensure that respondents had provided sufficient data.
For the online survey, respondents completing the Community pathway had to complete the anti-social behaviour questions for their data to count as valid. For Engagement pathway respondents, completing the last question in the Wellbeing and Loneliness section allowed their data to count as valid. Paper data was judged complete if the respondent answered at least 50% of the questions. For the Engagement paper questionnaire this was Q47 and for the Community paper questionnaire respondents had to reach Q50.
5.3 Validation
Initial checks were carried out to ensure that paper questionnaire data had been correctly scanned and converted to the online questionnaire data structure. For questions common to both questionnaires, the SPSS output was compared to check for any notable differences in distribution and data setup.
Once any structural issues had been corrected, further quality checks were carried out to identify and remove any invalid interviews. The specific checks were as follows:
-
Selecting complete interviews: Any test serials in the dataset (used by researchers prior to survey launch) were removed. Cases were also removed if the respondent reached but did not answer the quality declaration statement (online: QFraud; community paper: Q106; engagement paper Q89). The majority of removals were as a result of respondents saying ‘No’ or not answering the QFraud question (‘…please confirm below that all your answers were given honestly and represent your own personal views’).
-
Duplicate serials check: If any individual serial had been returned in the data multiple times, responses were examined to determine whether this was due to the same person completing multiple times or due to a processing error. If they were found to be valid interviews, a new unique serial number was created, and the data was included in the data file. If the interview was deemed to be a ‘true’ duplicate, the more complete or earlier interview was retained.
-
Duplicate emails check: If multiple interviews used the same contact email address, responses were examined to determine if they were the same person or multiple people using the same email. If the interviews were found to be from the same person, only the most recent interview was retained. In these cases, online completes were prioritised over paper completes due to the higher data quality.
-
Interview quality checks: A set of checks on the data were undertaken to check that the questionnaire was completed in good faith and to a reasonable quality. Several parameters were used:
a. Interview length (online check only)
b. Number of people in household reported in interview(s) vs number of total interviews from household.
c. Whether key questions have valid answers.
d. Whether respondents have habitually selected the same response to all items in a grid question (commonly known as ‘flatlining’) where selecting the same responses would not make sense.
e. How many multi-response questions were answered with only one option ticked.
Following the removal of invalid cases, 192,244 valid cases were left in the final dataset.
5.4 Data checks and edits
Upon completion of the general quality checks described above, more detailed data checks were carried out to ensure that the right questions had been answered according to questionnaire routing. This is generally all correct for all online completes, as routing is programmed into the scripting software, but for paper completes, data edits were required.
There were two main types of data edits, both affecting the paper questionnaire data:
-
Single-response question edits: If a paper questionnaire respondent had mistakenly answered a question that they weren’t supposed to, their response in the data was changed to “-1: Item not applicable”. If a paper questionnaire respondent had neglected to answer a question that they should have, they were assigned a response in the data of “-4: Not answered but should have (paper)”. If a paper questionnaire respondent had ticked more than one box for a single response question they were assigned a response in the data of “-5: Multi-selected for single response (paper)”.
-
Multiple response question edits: If a paper questionnaire respondent had mistakenly answered a question that they weren’t supposed to, their response was set to “-1: Item not applicable”. If a paper questionnaire respondent had neglected to answer a question that they should have, they were assigned a response in the data of “-4[footnote 5]: Not answered but should have (paper)”. Where the respondent had selected both valid answers and an exclusive code such as “None of these”, any valid codes were retained and the exclusive code response was set to “0”.
Other, more specific data edits were also made, as described below:
1. Additional edits to library questions: The question CLIBRARY1Part was formatted differently in the online script and paper questionnaire. In the online script it was set up as one multiple-response question, while in the paper questionnaire it consisted of two separate questions (Q17 and Q22). During data checking, it was found that many paper questionnaire respondents followed the instructions to move on from Q17 and Q22 without ticking the “No” response. To account for this, the following data edits were made:
a. If CFRELIB12 and CPARLI12B were not answered and CNLIWHYA was answered, set CLIBRARY1Part_001 was set to 0 if it was left blank.
b. If CFRELIDIG and CDIGLI12 were not answered and CNLIWHYAD was answered, CLIBRARY1Part_002 was set to 0 if it was left blank.
c. CLIBRARY1Part_003 and CLIBRARY1Part_004 were set to 0 for all paper questionnaire respondents.
2. Additional edits to grid questions: Due to the way the paper questionnaire was set up, additional edits were needed for the following linked grid questions: CARTS1/CARTS1A, CARTS2/CARTS2A, CARTS3/CARTS3A, CARTS4/CARTS4A
5.5 Coding
Post-interview coding was undertaken by members of the Verian coding department. The coding department coded verbatim responses, recorded for ‘other specify’ questions.
For example, if a respondent selected “Other” at CARTS1 and wrote text that said they went to some type of live music event, in the data they would be back-coded as having attended a “a live music event” at CARTS1_006.
Where ‘other specify’ responses could not be back coded to an existing code and where the number of mentions of a particular response was given by at least 2% of those answering the question, new codes were opened to reflect these responses where appropriate – and the relevant responses were coded to these new codes accordingly.
5.6 Data outputs
Once the checks were complete a final SPSS data file was created that only contained valid interviews and edited data. From this dataset, a set of data tables were produced using R.
5.7 Merging Participation Survey data into CES
Data from the CES 2025/26 Engagement pathway was merged with data from the final two quarters of the Participation Survey 2025/26 to provide a sample size of 33,238. This was to ensure that robust analysis could be conducted at ITL2 Regions level . Due to the nature of the CES survey design by asking some participation/engagement questions in the Community path of the survey have allowed us to produce some LA level estimates for these variables by producing derived variables from these cross over variables, however this results to a bias in the latter 6 months due to sample size differences even though the estimates represent the entire April 2025 to March 2026 period.
5.8 Derived variables
The headline-derived variables for both pathways of the 2025/26 CES survey are outlined below. While the underlying variables used to produce the headline variables in the time series tables have varied in their derivation across years due to changes in the questionnaire, the methodology and intended outputs have remained consistent.
-
CLIBRARY1Total_INP - In the last 12 months, engaged with library services in-person at least once
-
CLIBRARY1TotalOR_NET - In the last 12 months, engaged with library services physically OR digitally at least once
-
CLIBDIGTotal_DV - In the last 12 months, accessed library services digitally or online
-
CARTSTotal_NET - In the last 12 months, engaged (attended OR participated) with the arts physically
-
CARTS4Total_NET - In the last 12 months, engaged with the arts digitally at least once
-
CARTSPDTotalOR_NET - In the last 12 months, engaged with the arts physically OR digitally at least once
-
CHERVIS12Total_NET - In the last 12 months, have you visited a heritage site at least once (in your own time, academic study and voluntary)?
-
CDIGHER12Total_NET - In the last 12 months, have you engaged with heritage sector digitally at least once
-
CHERVISDIGTotalOR_NET - In the last 12 months, engaged with heritage physically OR digitally
-
CMUSVISDIGTotalOR_NET - In the last 12 months, engaged with museum or gallery physically OR digitally
-
CMUSONLDIGTotal - In the last 12 months, engaged with museum or gallery digitally
-
SBeNeighTotal - How strongly do you feel you belong to your immediate neighbourhood
-
SPullTotal - Whether agree or disagree that: People in this neighbourhood pull together to improve the neighbourhood
-
STrustTotal - Trust in people living in neighbourhood
-
SlocsatTotal - Satisfaction with local area as a place to live
-
STogethTotal - To what extent do you agree or disagree that this local area is a place where people from different backgrounds get on well together
-
Civpar1Total_DV - Civic participation in last 12 months
-
CivConsultTotal_DV - Any Civic consultation in past 12 months
-
CivrenTotal_DV - Any civic activism in the past 12 months
-
PAffLocTotal - Whether agree or disagree that: You can influence decisions affecting your local area
-
ForvolTotal_DV - Formal volunteering in last 12 months
-
FormonTotal_DV - Formal volunteering at least once a month
-
InfvolTotal_DV - Informal volunteering in last 12 months
-
IhlpmonTotal_DV - Informal volunteering at least once a month
-
InfforTotal_DV - Formal or informal volunteering in the last 12 months
-
InfformTotal_DV - Formal or informal volunteering at least once a month
-
Pride_D1Total - Attitudes regarding pride in local area: I am proud to live in local area
5.9 Standard error
The standard error is useful as a means to calculate confidence intervals.
Survey results are subject to various sources of error that can be divided into two types: systematic error and random error.
Systematic error
Systematic error or bias covers those sources of error that will not average to zero over repeats of the survey. Bias may occur, for example, if a part of the population is excluded from the sampling frame or because respondents to the survey are different from non-respondents with respect to the survey variables. It may also occur if the instrument used to measure a population characteristic is imperfect. Substantial efforts have been made to avoid such systematic errors. For example, the sample has been drawn at random from a comprehensive frame, two modes and multiple reminders have been used to encourage response, and all elements of the questionnaire were thoroughly tested before being used.
Random error
Random error is always present to some extent in survey measurement. If a survey is repeated multiple times minor differences will be present each time due to chance. Over multiple repeats of the same survey these errors will average to zero. The most important component of random error is sampling error, which is the error that arises because the estimate is based on a random sample rather than a full census of the population. The results obtained for a single sample may by chance vary from the true values for the population, but the error would be expected to average to zero over a large number of samples. The amount of between-sample variation depends on both the size of the sample and the sample design. The impact of this random variation is reflected in the confidence intervals presented in the data tables for headline measures.
Random error may also follow from other sources such as variations in respondents’ interpretation of the questions, or variations in the way different interviewers ask questions.
Standard errors for complex sample designs
CES employs a single-stage stratified sample design, and the data is both clustered by address and weighted to compensate for variations in sampling probability as well as for non-response bias. These features will impact upon the standard errors for each survey estimate in a unique way. Generally speaking, stratified sampling will reduce standard errors while data clustering and weighting will increase them. If the complex sample design is ignored, the standard errors will be wrong and usually too narrow.
The confidence intervals published in the annual data tables have been estimated using the svyciprop function of the R survey library, using the “logit” method.
Data considerations
Confidence intervals are important to consider when it comes to analysing the data, especially when drawing out inferences about the target population.
5.10 Missing data
As changes were made to the questionnaire for quarter 2 (see section 3.2 for details), data is set as missing if a respondent was not asked a question because of the changes. An example of this is respondents in quarter 1 would not have answered SBeGBBel or SBeGBNotBel as these questions were only added for quarter 2.
6. Weighting
6.1 Weighting process
A three-step weighting process was used to compensate for differences in both sampling probability and response probability. This was carried out separately for respondents allocated to the Community module and respondents allocated to the Engagement module, but the process was identical. Initially, these weights were produced for each quarter before a combination procedure at the end of the year (described after an outline of the general procedure).
It should be noted that the weighting only corrects for observed bias (for the set of variables included in the weighting matrix) and there is a risk of unobserved bias. Furthermore, the raking algorithm used for the weighting only ensures that the sample margins match the population margins. There is no guarantee that the weights will correct for bias in the relationships between the variables.
General procedure
-
A design weight was created equal to one divided by the product of the address sampling probability and the selected module allocation probability.
-
The expected number of responses per sampled address was modelled as a function of data available at the neighbourhood and address levels at the time of sampling as well as household size data provided by the respondent. The step two weight was equal to the number of people in the household divided by the predicted number of responses.
-
The product of the first two steps was used as the input for the final step to calibrate the sample. The responding sample was calibrated to the most up to date Labour Force Survey (LFS) with respect to (i) sex by age, (ii) educational level by age, (iii) ethnic group, (iv) housing tenure, (v) ITL2 region, (vi) employment status by age, (vii) household size, (viii) presence of children in the household, and (ix) internet use by age. The July to September 2025 edition of the LFS was used to weight the data from quarter 1 and the October to December 2025 edition was used to weight the data from quarter 2.
An equivalent weight was also produced for the (majority) subset of respondents who completed the survey by web. This weight was needed because some items were included in the web questionnaire but not the paper questionnaire.
Combining quarters
The combined (quarter 1 & quarter 2) dataset was further calibrated to ensure that the sex/age distribution within each local authority matched that of the most recent (2024) mid-year population estimates published by ONS, with respect to: men aged 16-34, men aged 35-64, men aged 65+, women aged 16-34, women aged 35-64, and women aged 65+. The published mid-2024 population estimates were adjusted very slightly to ensure no conflict with the national sex/age population totals – based on the Labour Force Surveys used to weight each quarter of data – that were also included in the calibration matrix.
Two further weights were produced; the first to facilitate analysis of variables included in every CES questionnaire (irrespective of pathway); the second to facilitate analysis of variables included in both the CES and the April to September 2025 Participation Survey. The procedure for producing these weights was the same as for the pathway-specific weights described above with the exception that for the second of these weights, the share of weights for each quarter was proportionate to respondent sample size rather than forced to be (approximately) equal.
There are six final weight variables in the dataset for quarterly analysis:
-
Finalweight – mixed mode for variables across both pathways
-
Finalweightweb – web only for variables across both pathways
-
Finalweight_CLS – mixed mode for variables in the Community pathway
-
Finalweightweb_CLS – web only for variables in the Community pathway
-
Finalweight_PS – mixed mode for variables in the Engagement pathway
-
Finalweightweb_PS – web only for variables in the Engagement pathway
There are six final weight variables in the dataset for annual analysis:
-
Annual_finalweight_2025to26 – mixed mode for variables across both pathways
-
Annual_finalweightweb_2025to26 – web only for variables across both pathways
-
Annual_finalweight_CLS – mixed mode for variables in the Community pathway
-
Annual_finalweightweb_CLS – web only for variables in the Community pathway
-
Annual_finalweight_PS – mixed mode for variables in the Engagement pathway
-
Annual_finalweightweb_PS– web only for variables in the Engagement pathway
6.2 Demographic non-response bias assessment
Once weighting is complete, it is possible to compare the demographic distribution of the unweighted sample with that of the weighted sample, treating the latter as a source of benchmarks.
However, because the CES required a geographically disproportionate sample, it is best to account for that before comparison.
In Table 6, each respondent’s weight has been divided by the mean weight for the local authority, allowing us to estimate the relative response rate for each demographic group compared to the average for the local authority. Only two groups have a relative response rate below 70% (Black ethnic group, non-internet users) and there is one group with a relative response rate between 70% and 80% (aged 16-24). All other demographic groups have a relative response rate of more than 80%.
For each demographic variable, a summary error score is also provided. This is the dissimilarity index, approximately equal to the proportion of responses that would have to change category if the unweighted distribution was to be made perfect. In general, a dissimilarity index score of under 5 percentage points is good, between 5 and 10 percentage points is fair, and over 10 percentage points is poor. Six of the variables have a ‘good’ rating and three have a ‘fair’ rating (age group, housing tenure, and educational qualifications). None has a ‘poor’ rating.
Table 6: Relative response rates per category per demographic variable, plus variable level dissimilarity index scores
| Variable (+ DI score) | Category | Relative response rate |
|---|---|---|
| Age band (DI = 5.7%pts) | — | — |
| 16–24 | 70% | |
| 25–34 | 89% | |
| 35–44 | 99% | |
| 45–54 | 101% | |
| 55–64 | 107% | |
| 65–74 | 136% | |
| 75+ | 100% | |
| Sex (DI = 4.0%pts) | — | — |
| Male | 92% | |
| Female | 108% | |
| Housing tenure (DI = 9.3%pts) | — | — |
| Own outright | 130% | |
| Own with mortgage | 89% | |
| Other, mainly renting | 84% | |
| Educational qualifications (DI = 5.1%pts) | — | — |
| Post-degree level qualification(s): level 7+ | 116% | |
| First degree level qualification(s): level 6 | 101% | |
| Sub-degree level HE qualification(s): level 4–5 | 137% | |
| Other qualification(s): level 1–3 | 93% | |
| No qualifications | 85% | |
| Number of adults in household (DI = 3.7%pts) | — | — |
| One adult | 121% | |
| Two adults | 98% | |
| Three or more adults | 91% | |
| Number of children under 16 in household (DI = 2.4%pts) | — | — |
| No children under 16 | 103% | |
| One or more children under 16 | 92% | |
| Ethnic group (DI = 2.9%pts) | — | — |
| White | 103% | |
| Indian | 90% | |
| Pakistani/Bangladeshi | 106% | |
| Black | 63% | |
| Other | 91% | |
| Internet use (DI = 2.8%pts) | — | — |
| Internet use | 103% | |
| No internet use | 60% | |
| Working status (DI = 3.8%pts) | — | — |
| Working | 94% | |
| Not working | 110% |
7. Appendix
7.1 Invitation letter
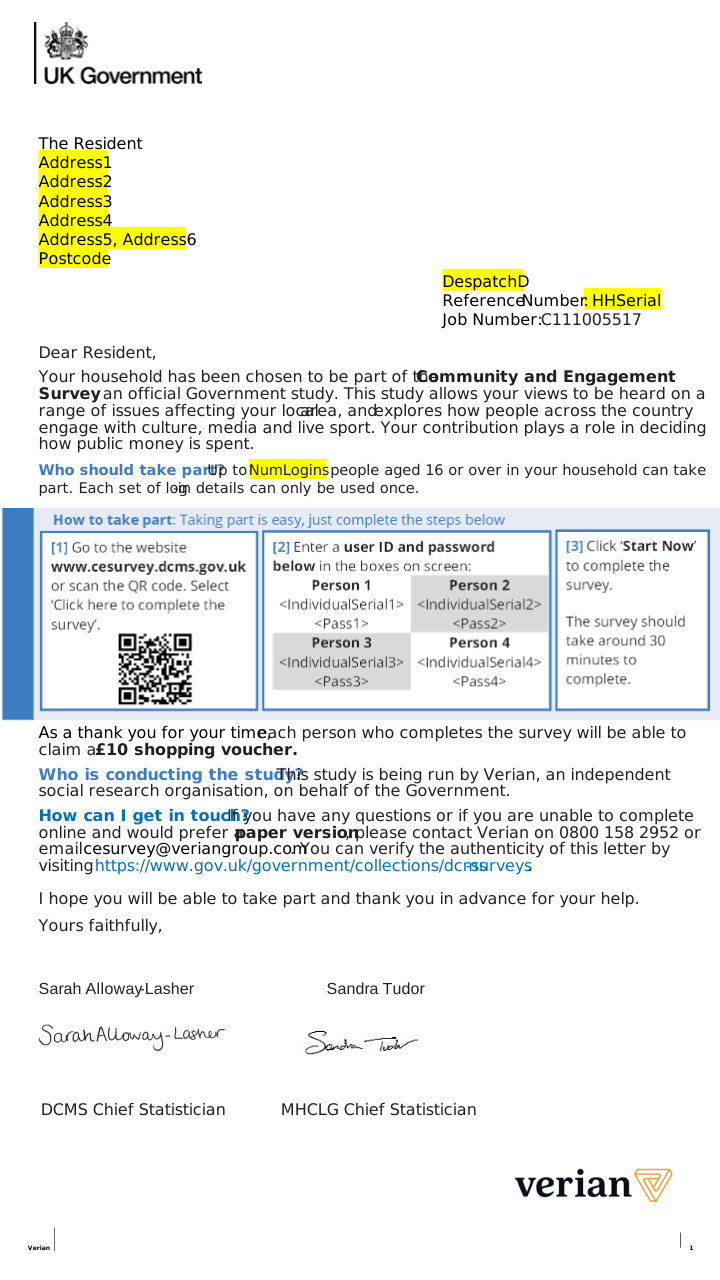
Invitation letter to participate in the survey.
7.2 Reminder letter 1
Copy with paper questionnaire included
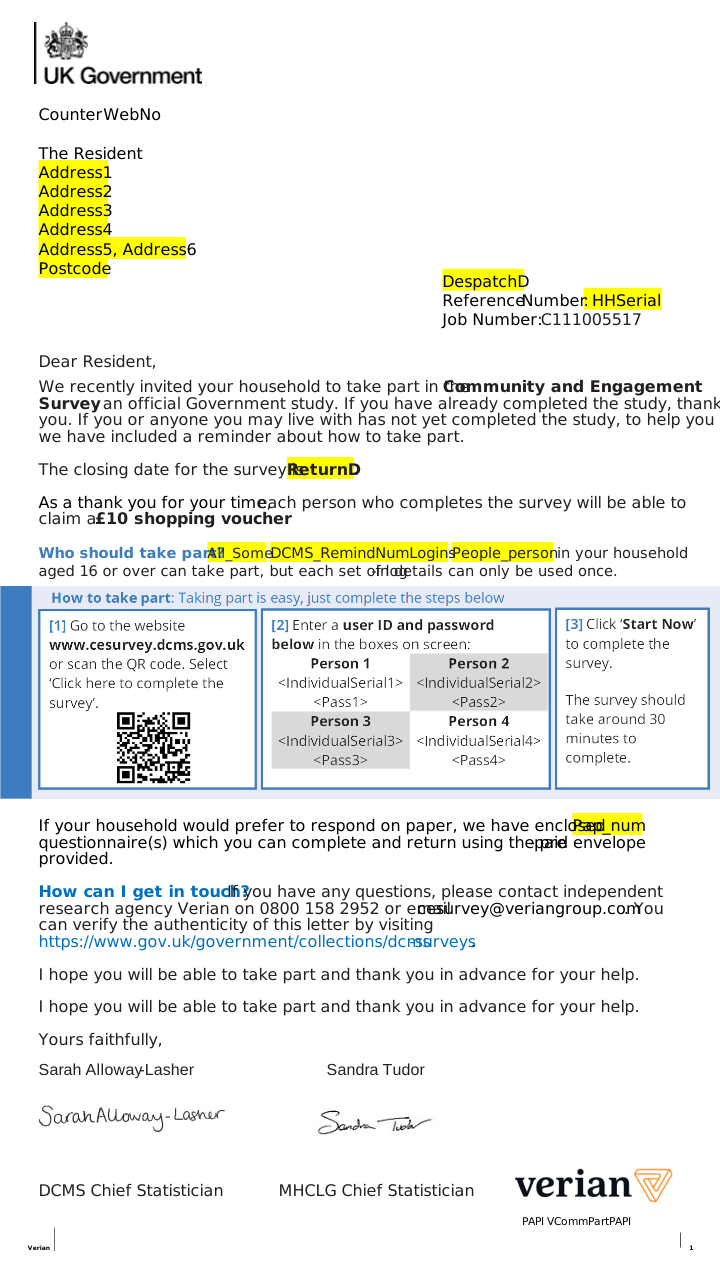
First letter reminding an invited household to participate in the survey (with paper copy / copies of the survey included).
Copy without paper questionnaire included
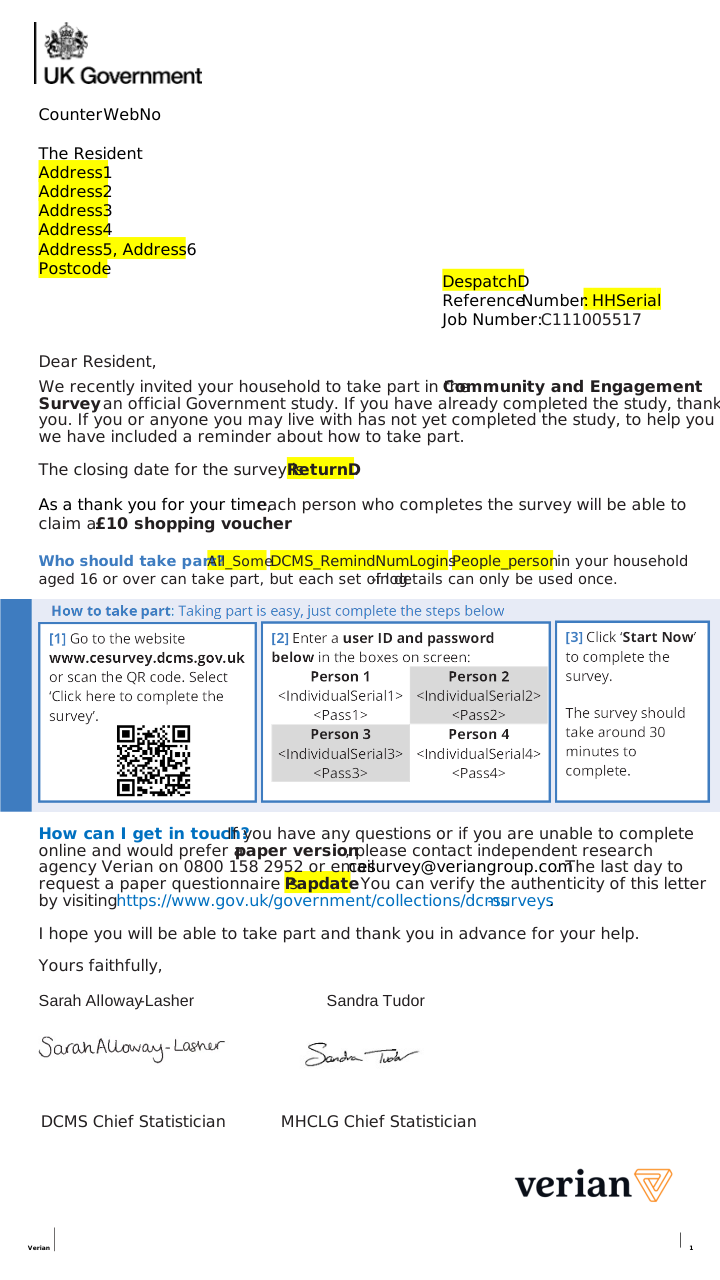
First letter reminding an invited household to participate in the survey (without a paper copy of the survey included).
7.3 Reminder letter 2
Copy with paper questionnaire included
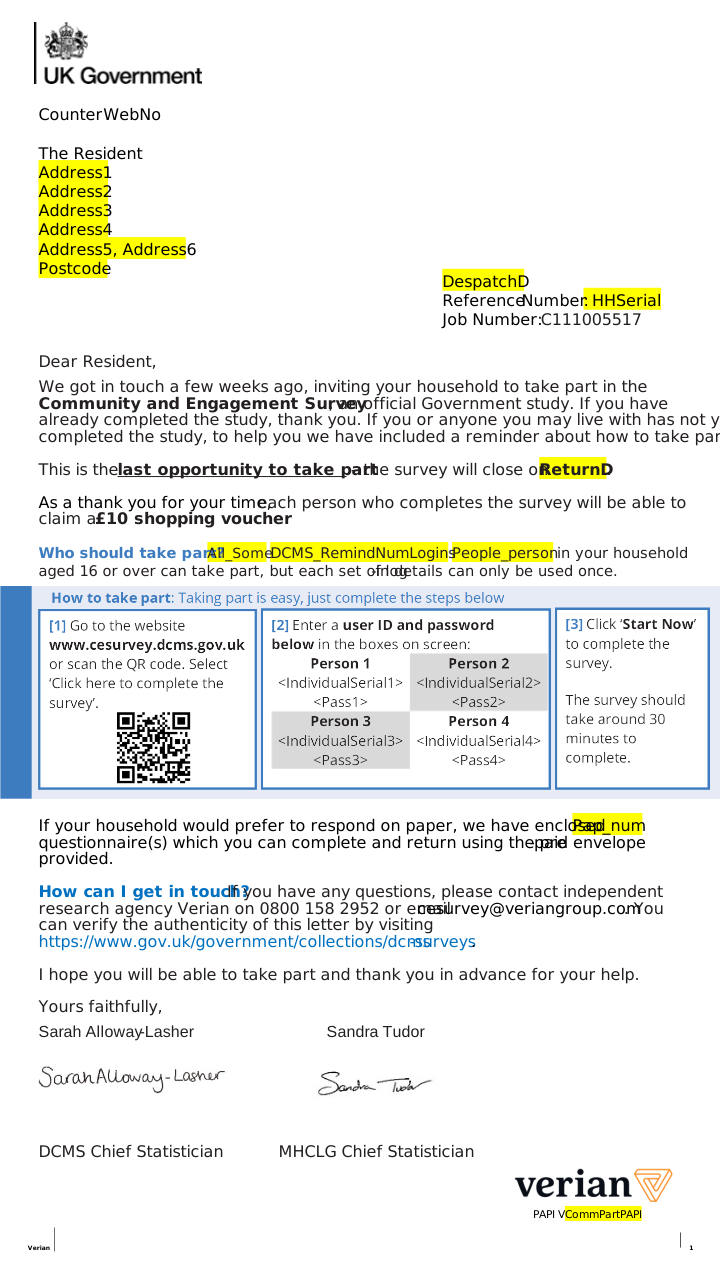
Second letter reminding an invited household to participate in the survey (with paper copy / copies of the survey included).
Copy without paper questionnaire included
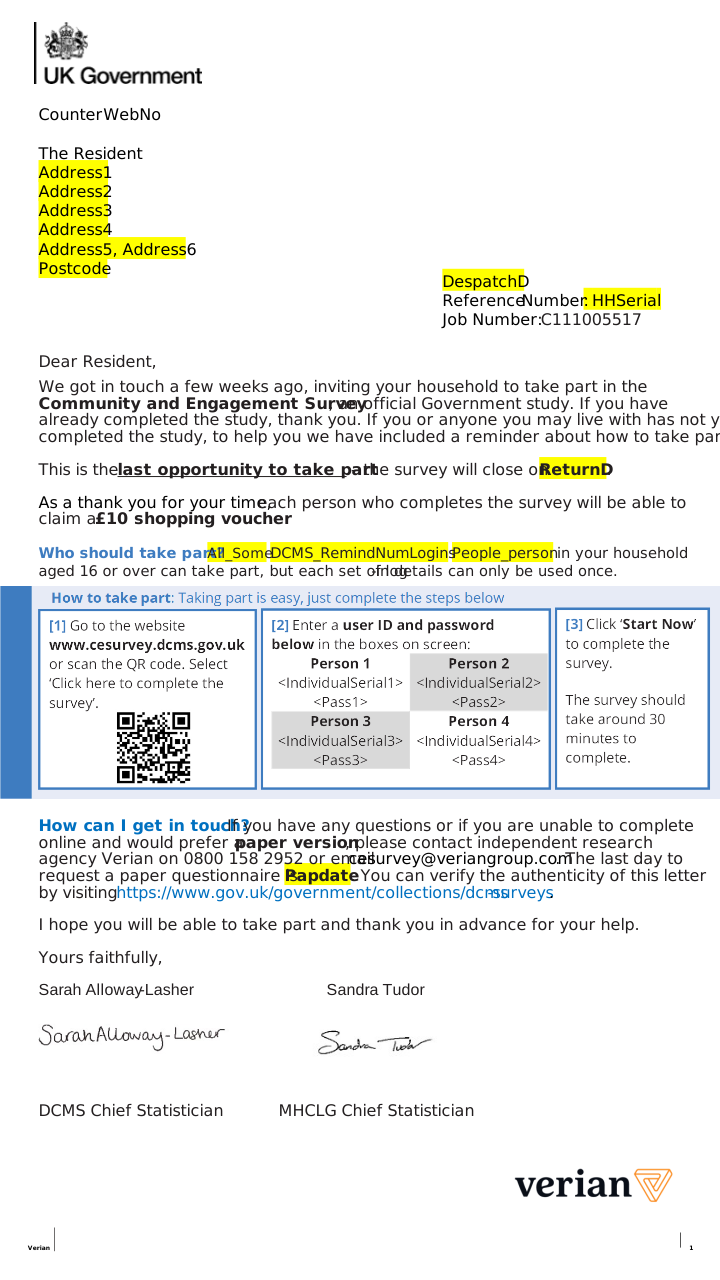
Second letter reminding an invited household to participate in the survey (without a paper copy of the survey included).
7.4 FAQs printed on the reverse of all survey invitation and reminder letters
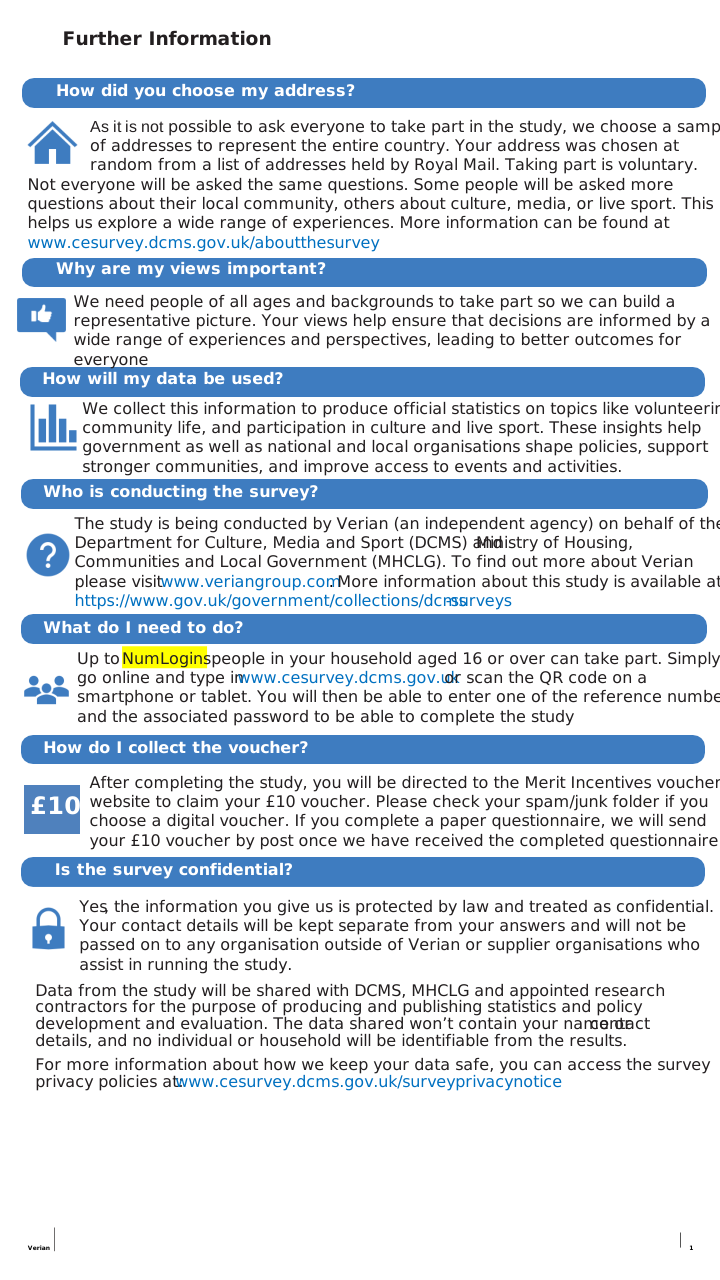
Answers to FAQs which are included on the back of each letter.
7.5 Ad hoc paper questionnaire request letter
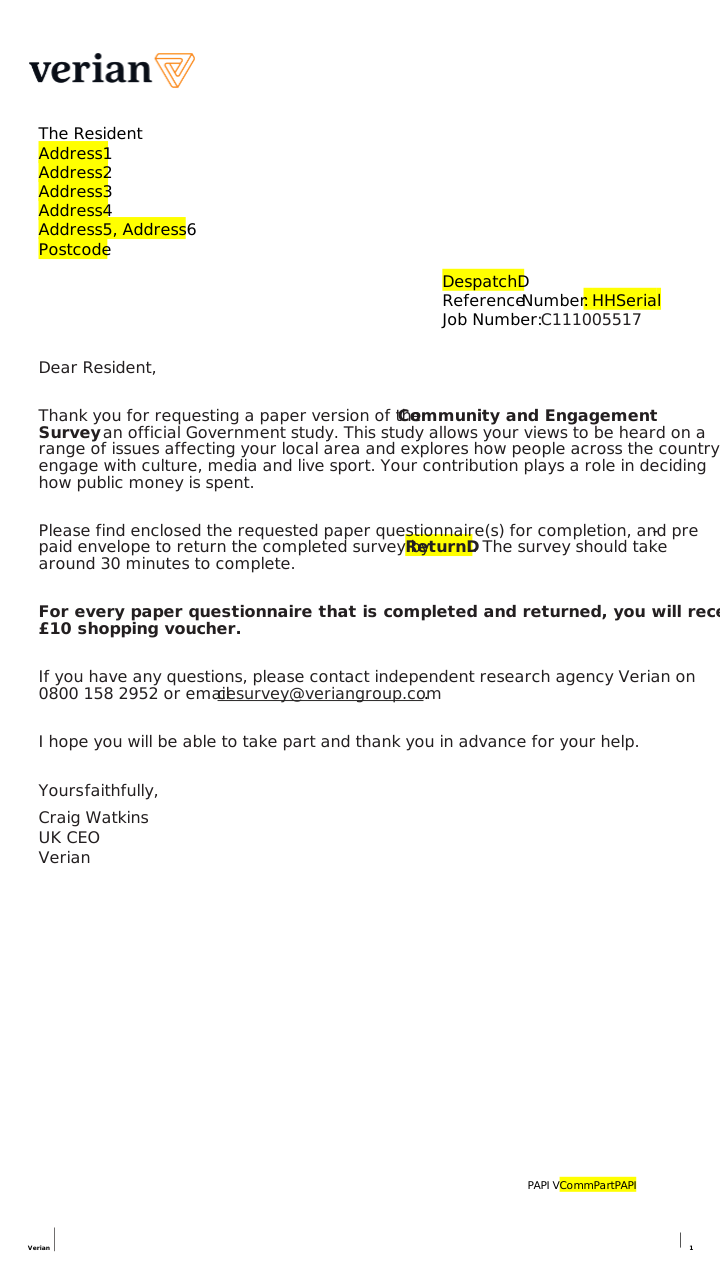
Letter containing paper copy / copies of the survey questionnaire following request for paper copy / copies to complete the survey.
7.6 Postal incentive letter
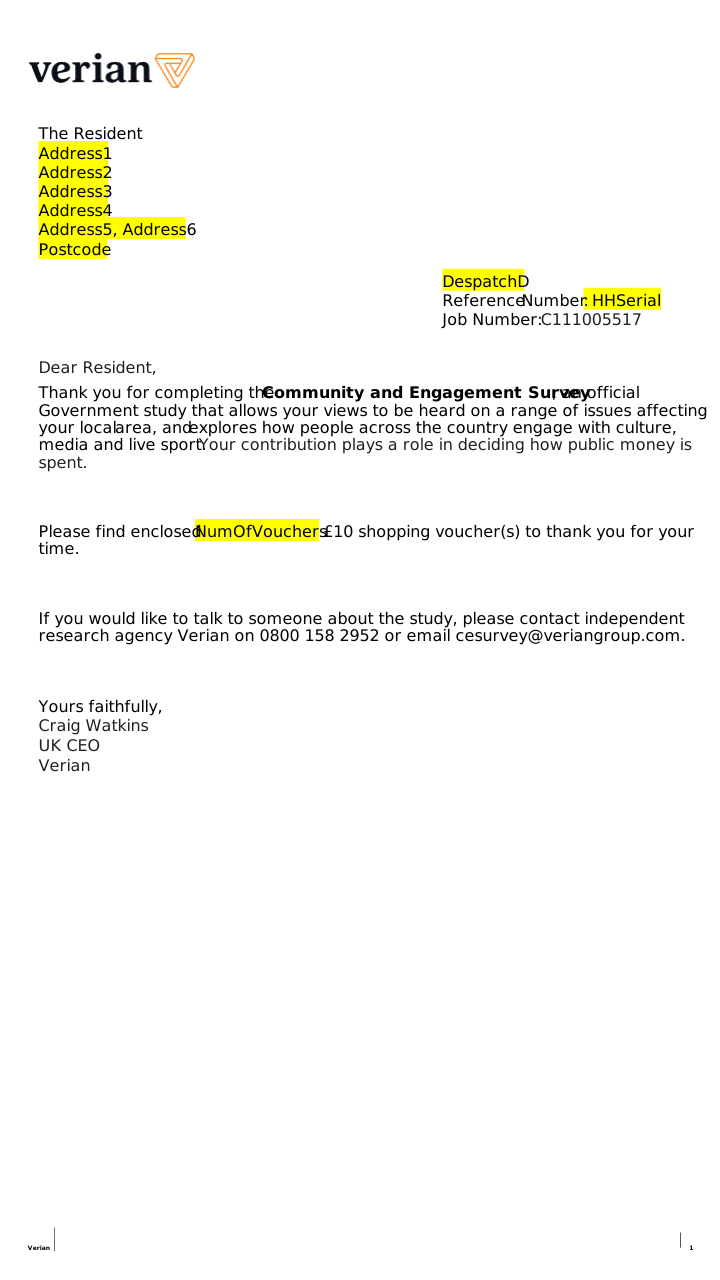
Letter containing reward voucher / vouchers for completing the survey questionnaire.
7.7 Online survey questionnaire
A copy of the online survey questionnaire can be found here.
7.8 Paper questionnaires
A copy of the Community paper questionnaire can be found here.
A copy of the Engagement paper questionnaire can be found here.
-
International Territorial Level (ITL) is a geocode standard for referencing the subdivisions of the United Kingdom for statistical purposes, used by the Office for National Statistics (ONS). Since 1 January 2021, the ONS has encouraged the use of ITL as a replacement to Nomenclature of Territorial Units for Statistics (NUTS), with lookups between NUTS and ITL maintained and published until 2023. ↩
-
There were two exceptions to this rule: a minimum 250 in the City of London, and no minimum in the Isles of Scilly. ↩
-
Response rates were calculated via the standard ABOS method. An estimated 8% of ’residential’ PAF addresses in England are assumed to actually be non-residential (this derived from interviewer administered surveys where this can be checked). The average number of people aged 16+ per residential household, based on the Labour Force Survey, is 1.89. Thus, the response rate formula: Household RR = number of responding households / (number of issued addresses * 0.92); Individual RR = number of responses / (number of issued addresses * 0.92 * 1.89). The conversion rate is the simple ratio of the number of responses to the number of issued addresses. ↩
-
Interview lengths under five minutes for the Community pathway and under four minutes for the Engagement pathway were removed, and they were capped at the 97th percentile. If interviews in the bottom 5% of complete times, they were flagged in the system for the research team to evaluate; if they were flagged for multiple other quality checks, then those interviews were removed. ↩
-
There was one exception to this rule. For the question Assets2: “For each of the following, please indicate whether there is at least one within a 15–20-minute walk from your home, further away but still in your local area, or there is not one in your local area at all”, option K: “Place of worship for my faith or religion, such as a church, mosque, temple” was treated differently. In the Paper questionnaire, if a respondent didn’t provide an answer where they should have, rather than being coded to a -5, they were instead coded into answer code 5: “Not applicable I do not have a religion/faith” (an answer code which was only available for this facility). ↩