Statistical bulletin - Civil Service Statistics: 2026
Published 29 July 2026

© Crown copyright 2026
This publication is licensed under the terms of the Open Government Licence v3.0 except where otherwise stated. To view this licence, visit nationalarchives.gov.uk/doc/open-government-licence/version/3 or write to the Information Policy Team, The National Archives, Kew, London TW9 4DU, or email: psi@nationalarchives.gov.uk.
Where we have identified any third party copyright information you will need to obtain permission from the copyright holders concerned.
This publication is available at https://www.gov.uk/government/statistics/civil-service-statistics-2026/statistical-bulletin-civil-service-statistics-2026
Statistical Enquiries: Toni Clarke
Press Enquiries: Alex Hunt
Next Publication: July 2027
View the Civil Service statistics data browser
1. Overview
This Accredited Official Statistics release presents headline statistics on the UK Civil Service workforce, including breakdowns by demographic characteristics, earnings, grade, and location of civil servants, as at 31 March 2026.
Key Statistics:
Civil Service Statistics 2026 shows that employment stands at 557,825 headcount and 523,795 on a full-time equivalent basis (FTE), as at 31 March 2026 (NB: see section 2 below for more information on our headline measure for monitoring the changing size of the Civil Service workforce). The key headlines show that:
-
54.7% are women, up slightly from 54.6% in 2025.
-
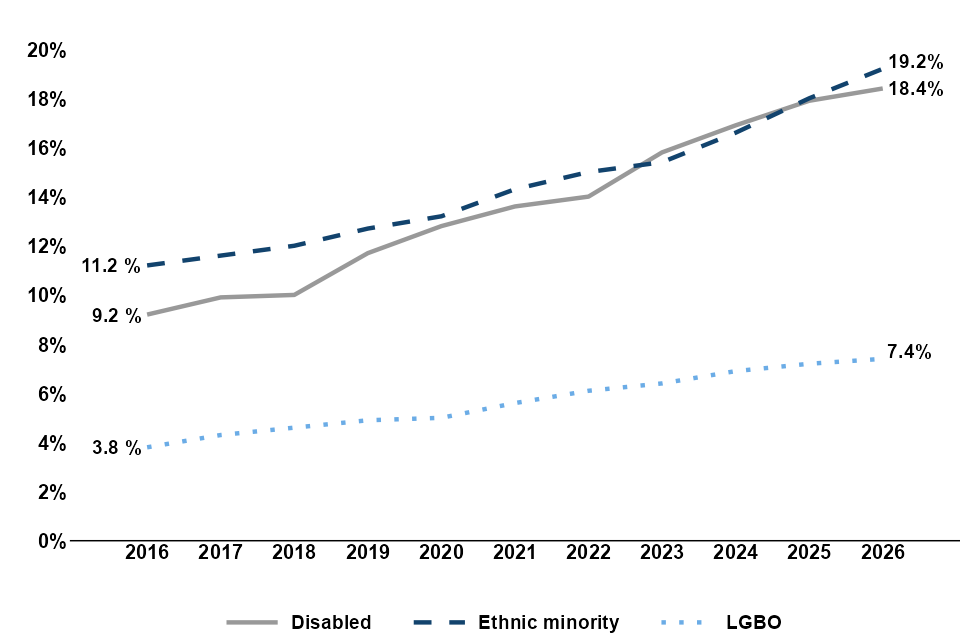
19.2% are from an ethnic minority background, up from 18.0% in 2025.
-
18.4% declare themselves as having a disability, up from 17.9% in 2025.
-
7.4% identify as being lesbian, gay, bisexual or recorded their sexual orientation as ‘other’ (LGBO), up from 7.2% in 2025.
-
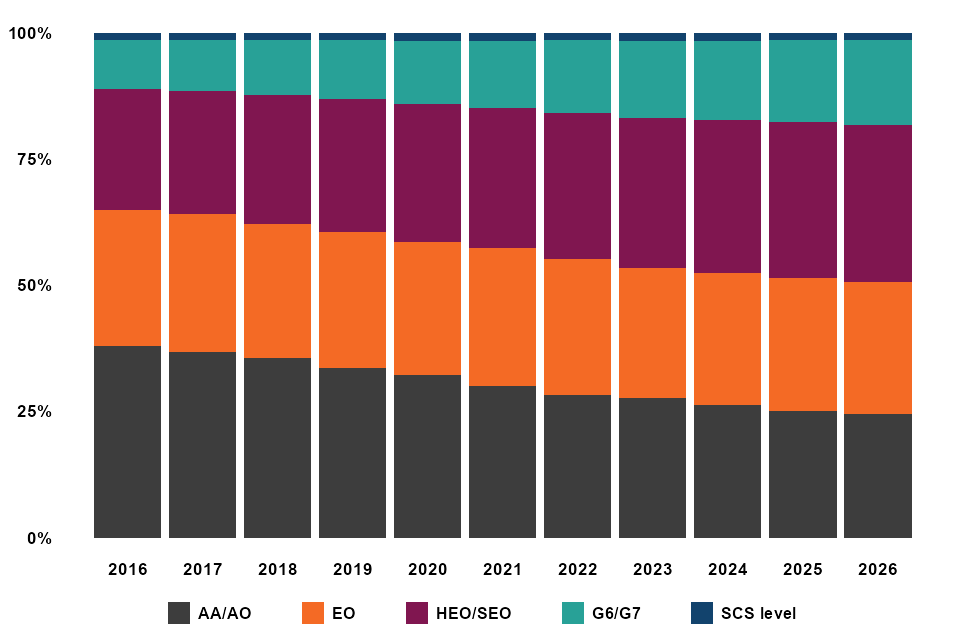
75.5% are working at Executive Officer (EO) grade and above, up from 75.0% in 2025 and up from 62.1% in 2016.
-
The median age of civil servants is 43 years, down from 44 years in 2025.
-
Headcount has increased across all regions except for East England, with the largest increase in North West England (75,330, up from 72,800 in 2025).
-
The median salary is £37,820, up £2,140 (6.0%) from £35,680 in 2025.
-
The median and mean gender pay gap for the Civil Service is 5.7% and 5.8%, down from 6.4% and 6.9% in 2025 respectively.
-
There were 42,855 entrants to the Civil Service in 2025/26, down from 44,310 in 2024/25.
-
There were 37,945 leavers from the Civil Service in 2025/26, down from 38,610 in 2024/25.
Figure 1.1: Representation of ethnic minority, disabled and LGBO civil servants, 2016 to 2026 (see table E1)
2. Civil Service Headcount
Civil Service headcount stands at 557,825 as at 31 March 2026. On a full-time equivalent (FTE) basis, Civil Service employment is 523,795. FTE takes into account part-time workers.
Statistical Note
At the time of release, the latest statistics from the ONS Quarterly Public Sector Employment Survey (QPSES) are also as at 31 March 2026, and show Civil Service employment was 557,635 (523,635 on an FTE basis). The next release of the ONS QPSES is 15 September 2026 and will provide updated Civil Service employment figures as at 30 June 2026. Users should refer to the regular ONS quarterly statistics when monitoring changes in the size of the Civil Service.
Figure 2.1: Civil Service departmental headcount (see table 11)
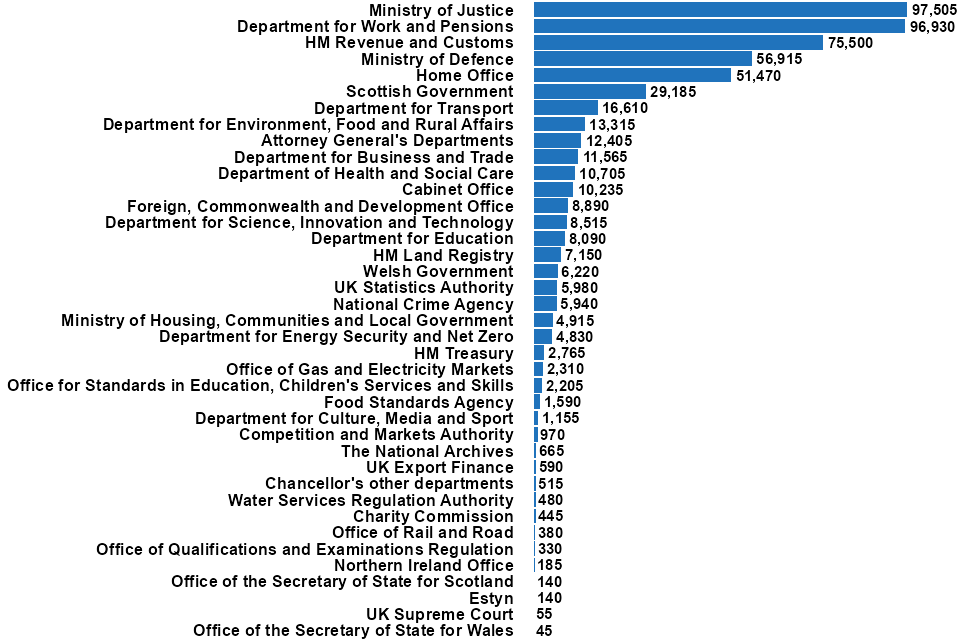
The five largest departments (Ministry of Justice, Department for Work and Pensions, HM Revenue and Customs, Ministry of Defence and Home Office) account for over two-thirds (67.8%) of the workforce.
3. Grade
The Civil Service is becoming more senior in grade.
Just over three quarters (75.5%) of civil servants work at Executive Office (EO) grade and above. This is a slight increase from 75.0% in 2025 and up from 62.1% in 2016.
The percentage of civil servants working at the most junior grades (Administrative Assistant/Administrative Officer) has fallen each year since 2016, when it stood at 37.9%, and is now less than a quarter of the workforce for the first time (24.5%).
The percentage of civil servants working in grades 6 and 7 has increased to 16.7%, up from 16.2% in 2025 and 9.7% in 2016.
Figure 3.1: Civil Service grade structure, 2016 to 2026 (see tables 1 and E2)
Civil Service grades:
-
Senior Civil Service level (SCS level)
-
Grade 6 and 7 (G6/G7)
-
Higher Executive Officer/Senior Executive Officer (HEO/SEO)
-
Executive Officer (EO)
-
Administrative Assistant/Administrative Officer (AA/AO)
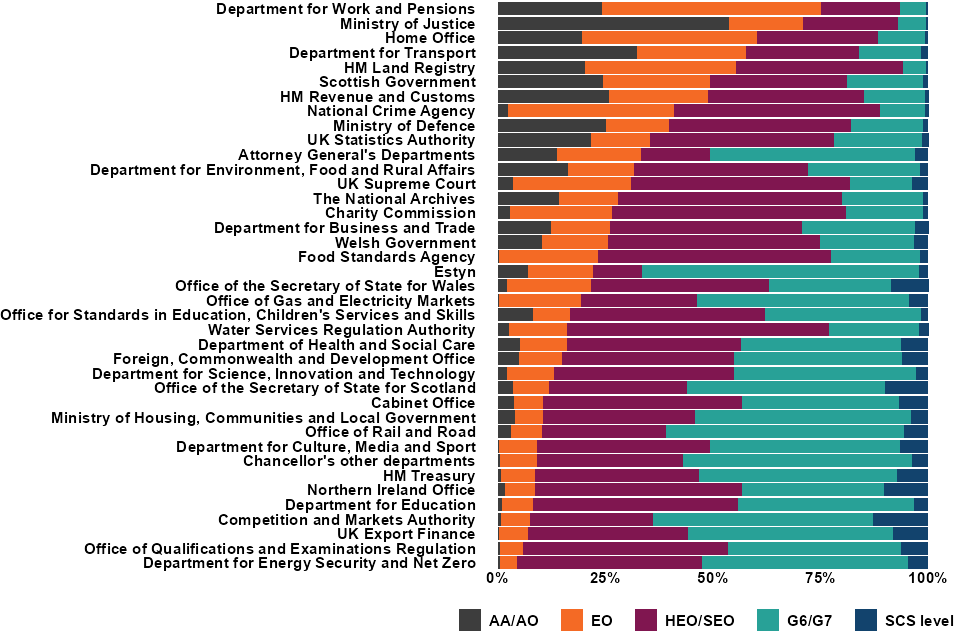
Departments with large numbers of front-line staff delivering public services tend to have a higher proportion of junior grades. For example, the Department for Work and Pensions (DWP) has the highest percentage of staff at EO grade and below (75.2%).
Departments with more senior grades tend to have fewer employees delivering services directly to the public. For example, DESNZ has the highest percentage of employees at grades HEO/SEO and above (95.6%).
Figure 3.2: Grade structure by department (see table 20)
Statistical Note
There are two measures of the SCS available: the Senior Civil Service and SCS level. See Notes section.
4. Location
Civil servants work in all regions of the UK, and Overseas.
Just under one in five civil servants are based in London (19.4%), down from 19.6% in 2025.
The regions with the largest number of civil servants are London (107,810), the North West of England (75,330), and Scotland (57,800).
Excluding Northern Ireland and Overseas, East England has the fewest civil servants (23,080).
Figure 4.1: Civil Service headcount by region (see table 10)
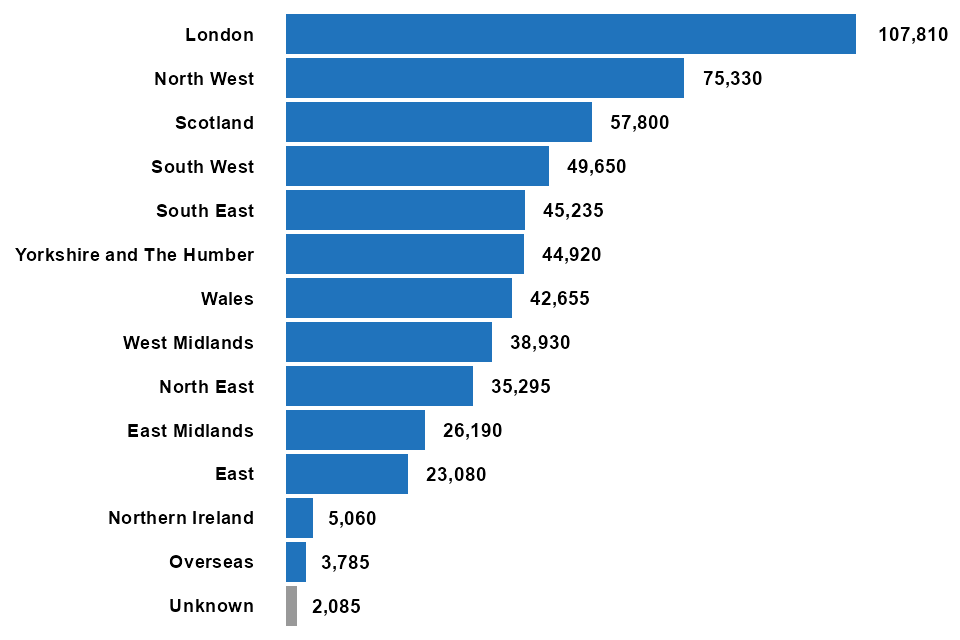
Most Civil Service departments have a presence in London. Around four in five civil servants in both the North West (79.6%) and North East (81.7%) are working for DWP, HMRC, MOJ and the Home Office.
Departments with large numbers of staff in Wales include DWP, DFT, Welsh Government, HMRC, MOJ, UKSA and DBT. There are home civil servants working in Northern Ireland – the majority for HMRC, Home Office and MOD. The departments employing the most civil servants in Scotland are Scottish Government, DWP, HMRC, MOD and Home Office.
The majority of civil servants based Overseas work for FCDO and MOD.
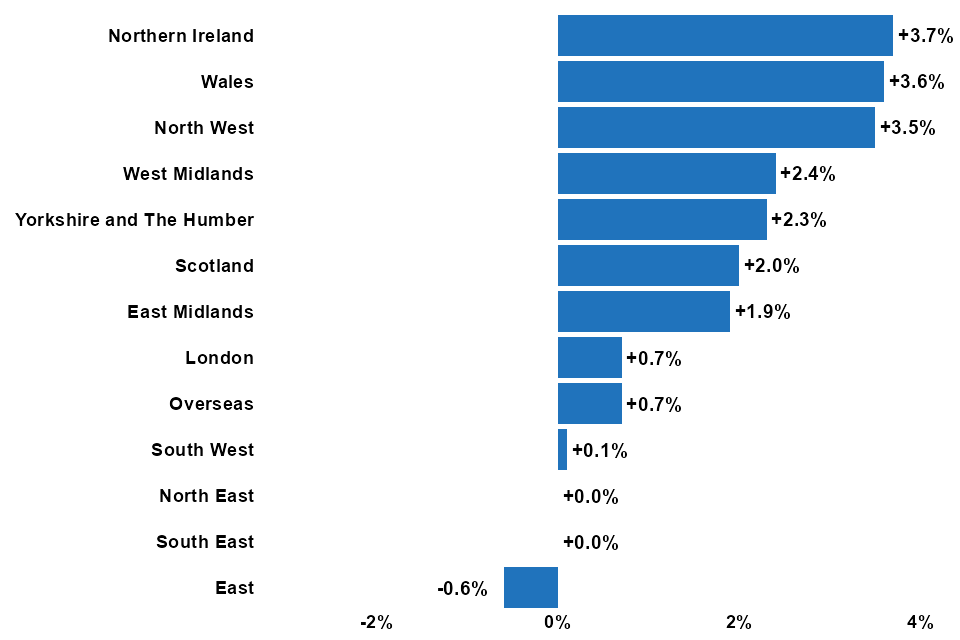
Civil Service employment increased in all regions apart from East England between 2025 and 2026.
The overall proportion of civil servants based in London has decreased for the fifth consecutive year, to 19.4% in 2026 from 21.2% in 2021.
The regions with the largest percentage increases in headcount are Northern Ireland (+3.7%), Wales (+3.6%), North West (+3.5%), West Midlands (+2.4%) and Yorkshire and the Humber (+2.3%). The regions that have seen the largest increase in headcount are the North West (+2,530), Wales (+1,500), Scotland (+1,125), Yorkshire and the Humber (+1,025) and West Midlands (+910).
Figure 4.2: Percentage change in Civil Service regional headcount, 2025 to 2026 (see table 10)
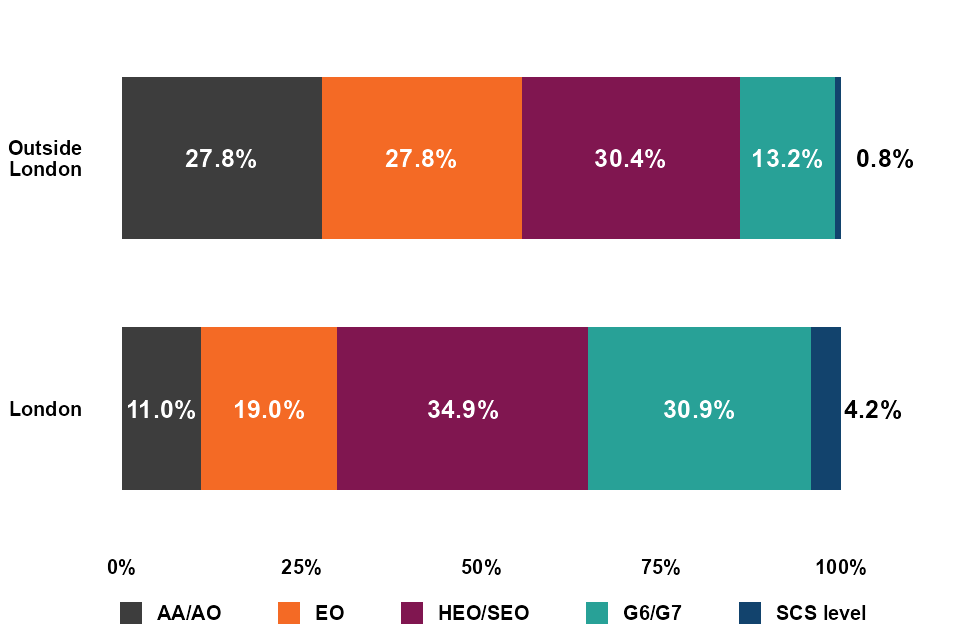
Outside of London, 27.8% of civil servants are in AA/AO grades, compared to 11.0% within London. The percentage of those in G6/G7 and SCS level grades outside of London is 14.0%, compared to 35.1% within London.
Some professions are predominantly London-based; 87.3% of those in the Actuarial profession, 65.2% in Economics, 58.5% in Cyber, and 53.4% in Policy. Other professions tend to be more evenly distributed across the regions. (see table 37).
Figure 4.3: Percentage of civil servants at each grade within London, and outside of London (see table 16)
Statistical Note
Workplace postcode data is used to derive geographical information (International Territorial Level) from the National Statistics Postcode Lookup (NSPL).
5. Sex
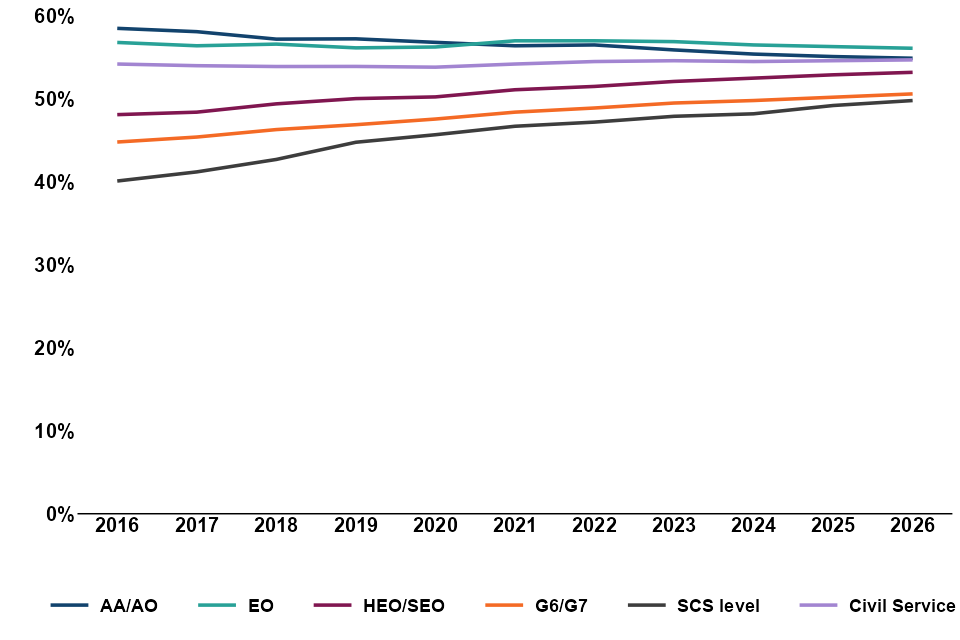
There are more women (304,760) than men (252,410) in the Civil Service; however, men outnumber women at SCS level . The percentage of women at SCS level is, however, continuing to increase: in 2026 49.8% of those at SCS level are women compared to 49.2% in 2025 and 40.1% in 2016. At all grades below SCS level there are more women than men.
Figure 5.1: Civil servants by sex (see table 1)
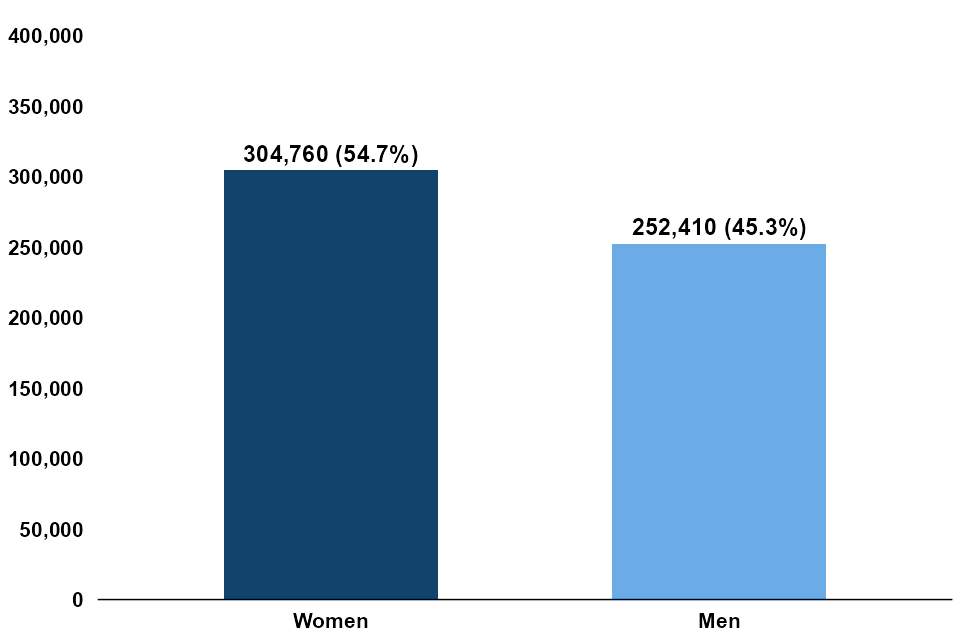
Figure 5.2: Percentage of civil servants at each grade by sex (see table 1)
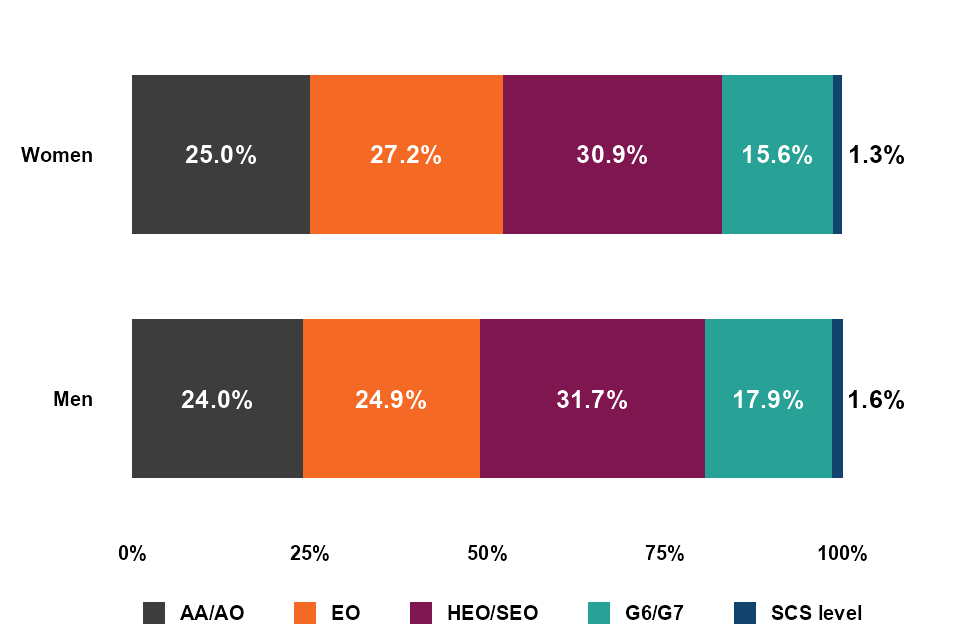
Figure 5.3: Percentage of women by grade, 2016 to 2026 (see table E4)
Statistical Note
Please note figures on sex (and gender, for gender pay gap reporting) presented in these statistics are based on management information provided by departments, which records the ‘legal sex’ of civil servants. ‘Legal sex’ does not align with ‘sex’ as defined by The Equality Act 2010.
6. Age
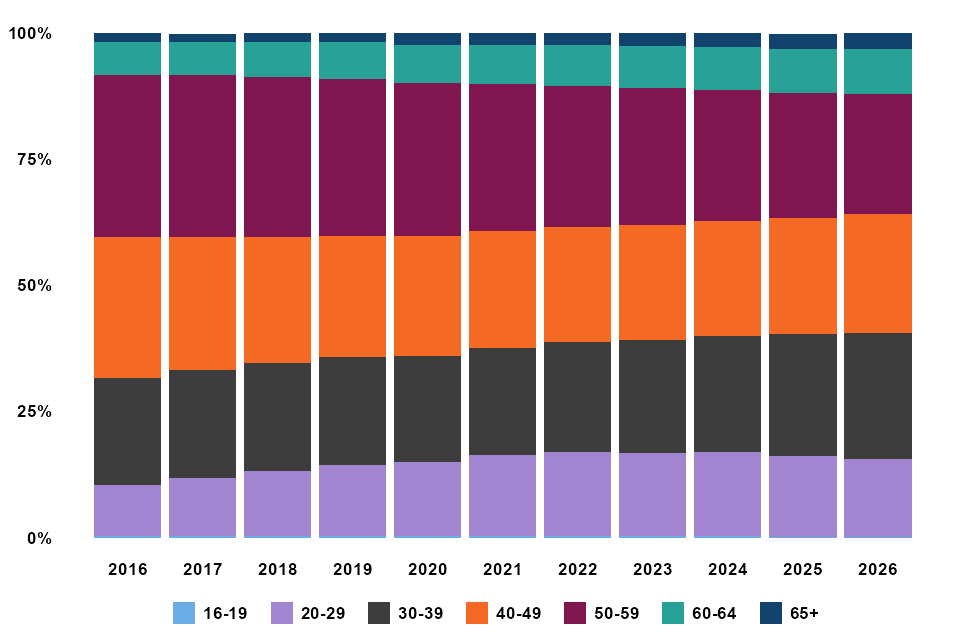
The median age of civil servants stands at 43 years, down from 44 in 2025 and down from 47 in 2016.
The percentage of civil servants aged under 40 is 40.7%, up from 40.3% in 2025 and 31.7% in 2016.
Figure 6.1: Civil servants by age band, 2016 to 2026 (see tables 4 and E5)
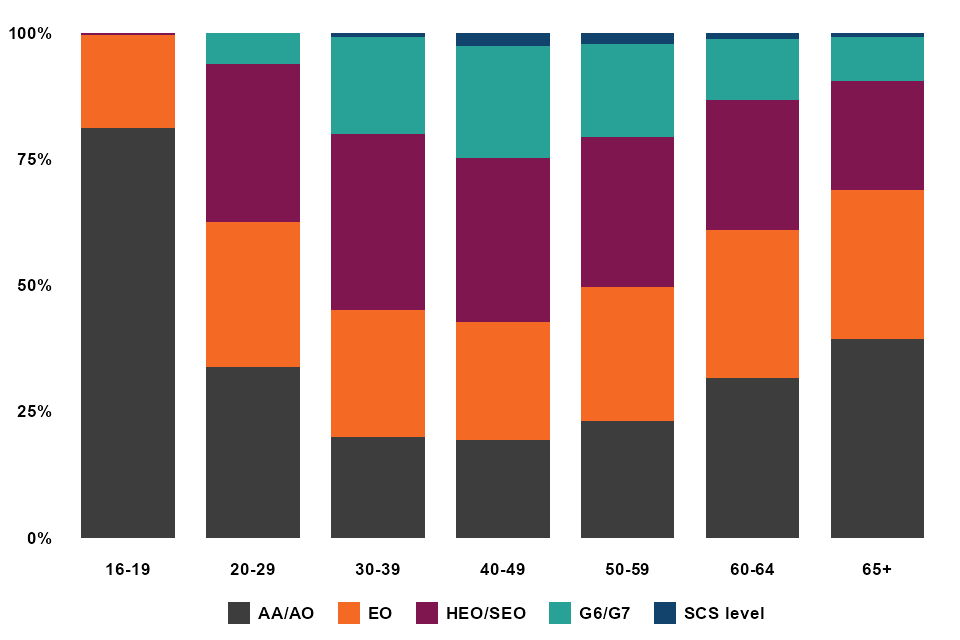
Those at the younger and older ends of the age distribution are more likely to be at AA/AO grades.
Figure 6.2: Percentage of civil servants at each grade by age band (see table 4)
7. Ethnicity
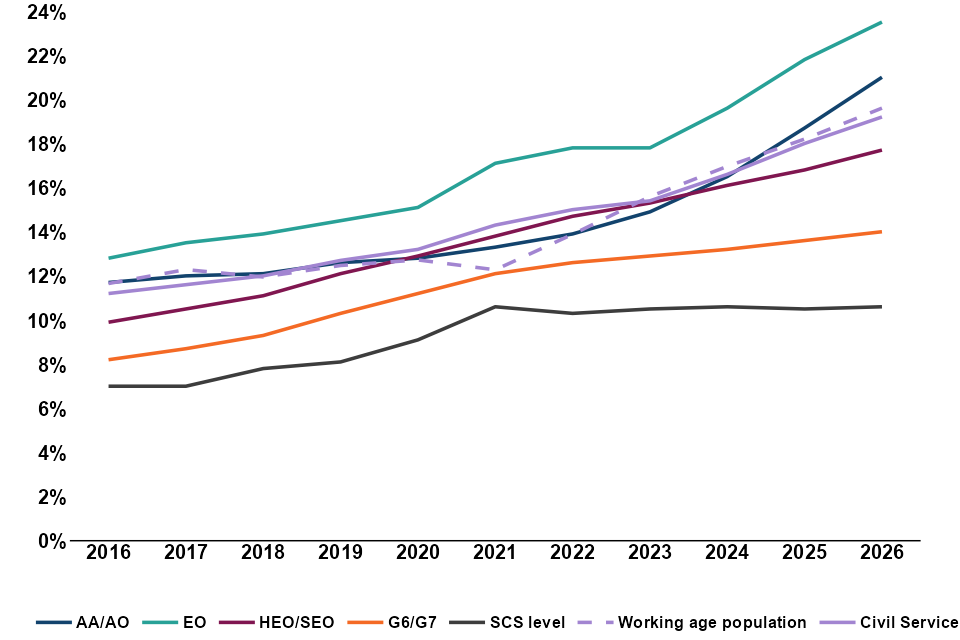
Of those with a known ethnicity, the percentage who are from an ethnic minority background is at a record high of 19.2%. This is an increase from 18.0% in 2025 and 11.2% in 2016.
Compared to 2025, the proportion of civil servants from an ethnic minority background has increased across all grades.
The largest increase has been at AA/AO; up to 21.0% in 2026 from 18.7% in 2025, and 11.7% in 2016.
Civil servants from an ethnic minority background are less represented at senior grades than in junior grades, with those at SCS level having the lowest representation rate at 10.6%, which is slightly up from 10.5% in 2025 and up from 7.0% in 2016.
The Civil Service has a slightly lower proportion of workers from an ethnic minority background than the economically active working age population in the UK (19.6%).
Figure 7.1: Percentage of civil servants from an ethnic minority background by grade, 2016 to 2026 (see tables 2 and E6)
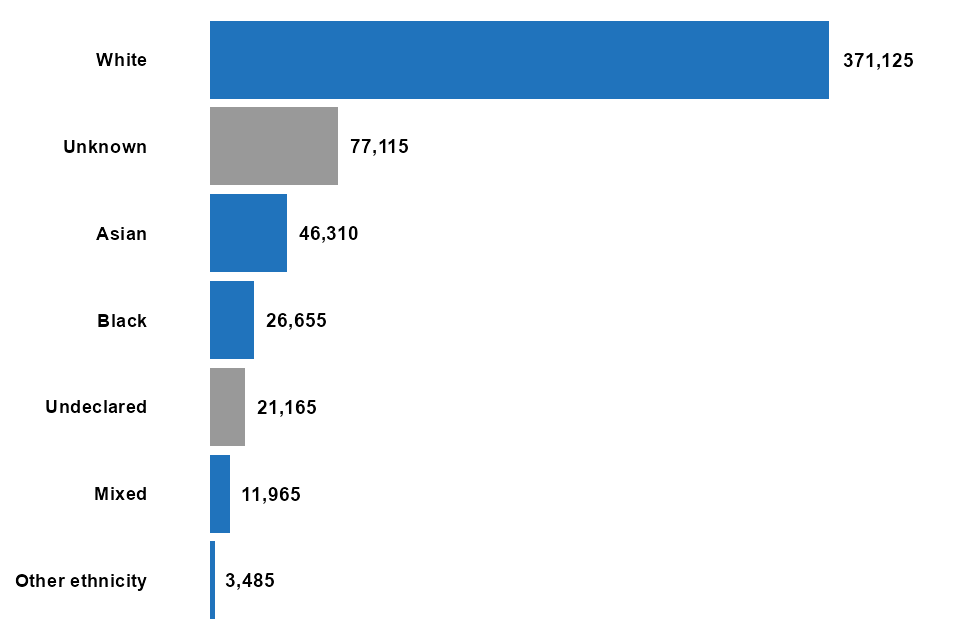
On a headcount basis, Asian civil servants (46,310) make up the largest ethnic minority group in the Civil Service, followed by Black civil servants (26,655).
Figure 7.2: Civil servants by ethnic group (see table 2)
Statistical Note
Percentages exclude those with an unknown ethnicity and those who have elected to not declare their ethnicity. The working age population figure includes only those who are economically active. See the Notes section for more information.
8. Disability
Since 2016 there have been year-on-year increases in the percentage of civil servants who declare themselves as disabled. This figure now stands at 18.4%, a record high, up from 17.9% in 2025, and 9.2% in 2016.
The proportion of civil servants with a declared disability has increased across all grades compared to 2025.
The largest increase has been at G6/G7 level; up to 14.6% in 2026 from 13.7% in 2025, and 6.3% in 2016.
The percentage of civil servants declaring themselves as disabled (18.4%) is above that of the economically active working age population (17.9%).
Figure 8.1: Percentage of civil servants that have declared a disability by grade, 2016 to 2026 (see table E7)
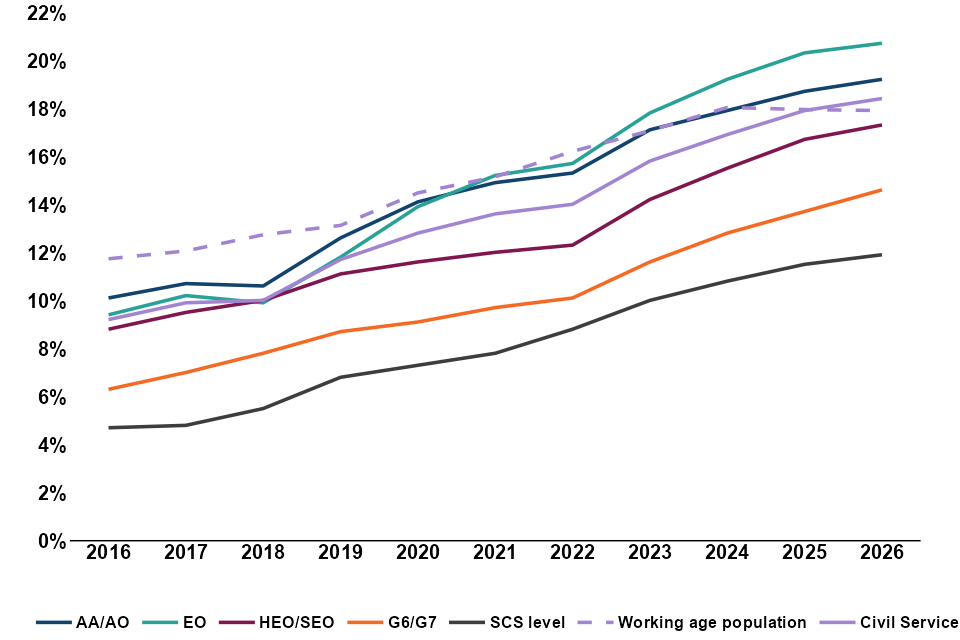
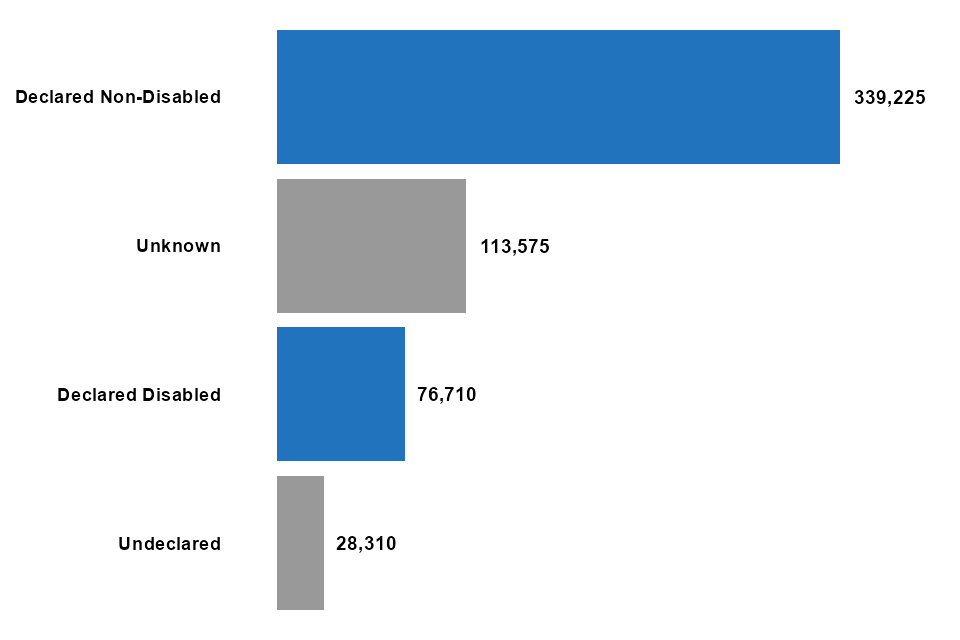
Figure 8.2: Civil servants by disability status (see table 3)
Statistical Note
Percentages exclude those with an unknown disability status and those that have elected to not declare themselves as either disabled or non-disabled. The working age population figure includes only those who are economically active. See Notes section for more information.
9. Sexual Orientation
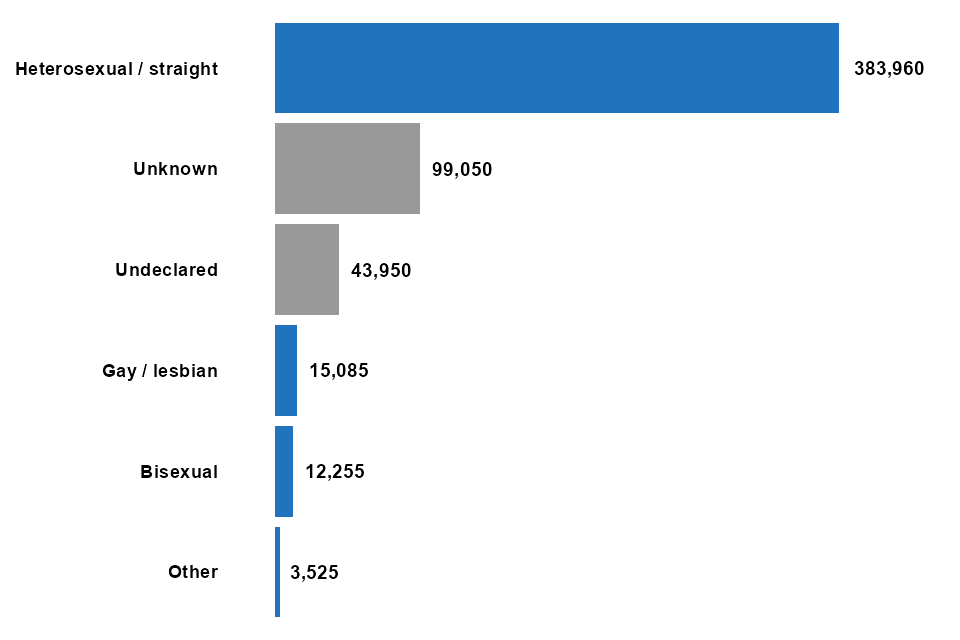
Of those with a known sexual orientation, 7.4% of civil servants identify as being lesbian, gay, bisexual or recorded their sexual orientation as ‘other’ (LGBO). This has increased every year since data on sexual orientation has been captured in these statistics, and is up from 7.2% in 2025 and 3.8% in 2016.
LGBO representation has increased at all grades over the last year. The grades with the highest percentage of LGBO civil servants are HEO/SEO, G6/7 and SCS (all 7.7%).
Declaration rates for sexual orientation have increased from 38.1% in 2015 (when it was first collected), to 74.4% in 2026.
Figure 9.1: Percentage of civil servants that identify as LGBO by grade, 2016 to 2026 (see table E8)
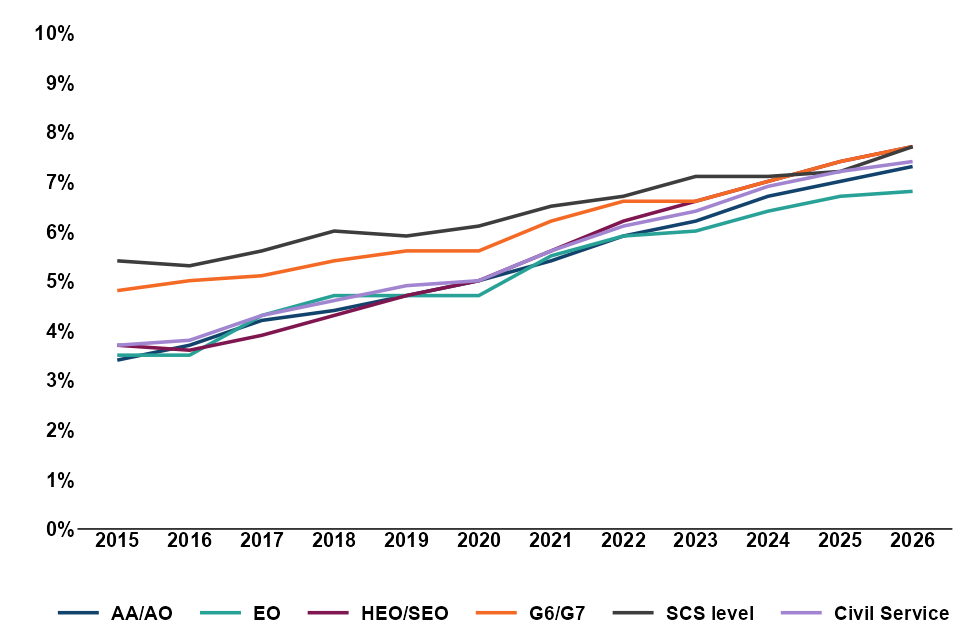
Figure 9.2: Civil servants by sexual orientation (see table A2)
Statistical Note
Percentages exclude those with an unknown sexual orientation and those that have elected to not declare their sexual orientation.
10. Religion and Belief
The declaration rate for religion and belief has increased this year to 73.8%, up from 73.3% in 2025.
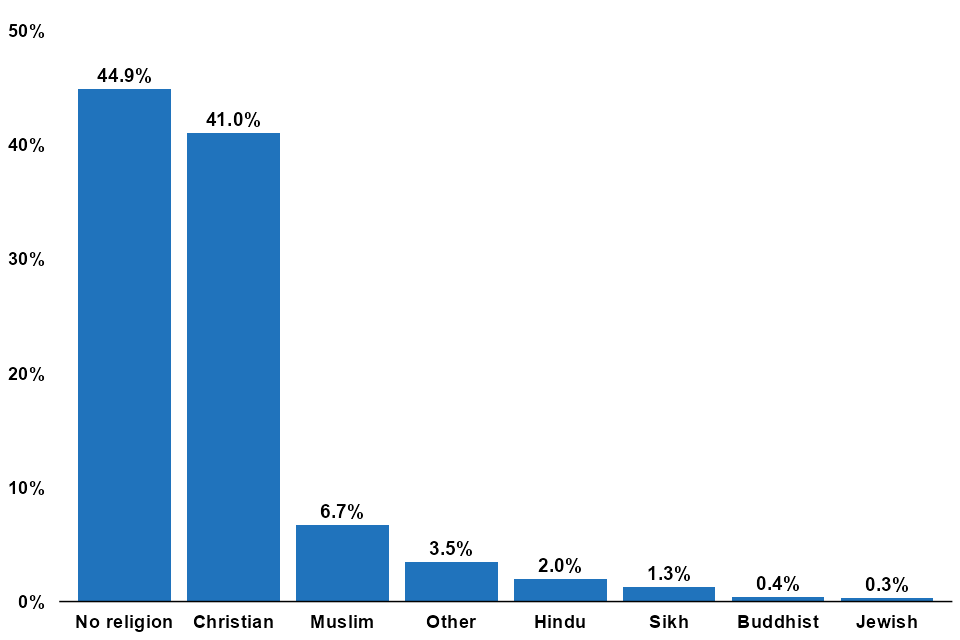
The most commonly reported religion or belief is Christianity at 41.0%. The second most commonly reported is Islam (Muslim) at 6.7%. A further 44.9% of civil servants reported having no religion or belief.
Figure 10.1: Civil servants by religion, belief, or non-belief (see table A4)
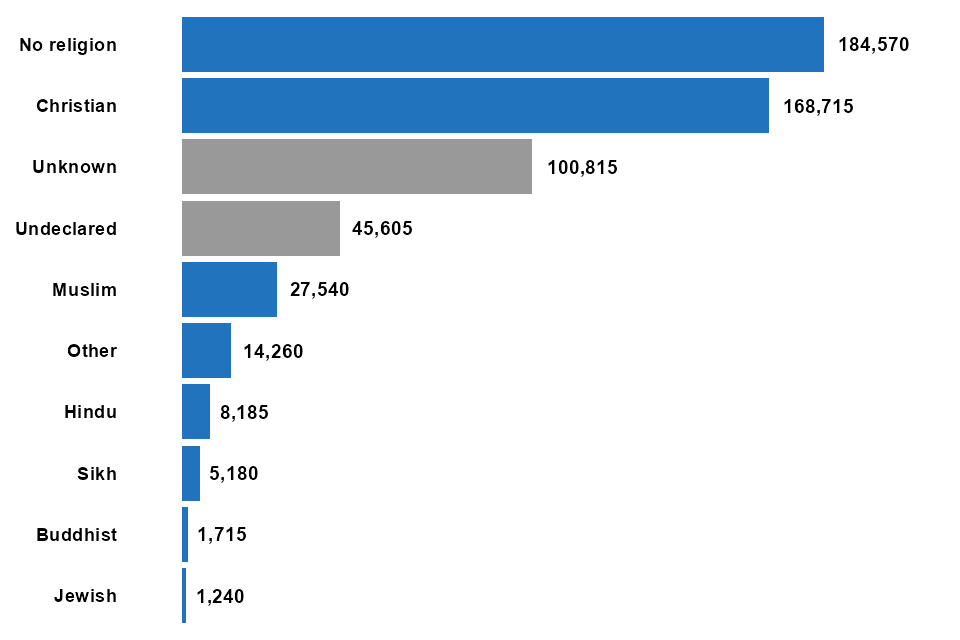
Figure 10.2: Percentage of civil servants by religion, belief, or non-belief (see table A4)
Statistical Note
The percentages stated here exclude those with an unknown religion or belief and those that have elected to not declare their religion or belief.
11. Pay
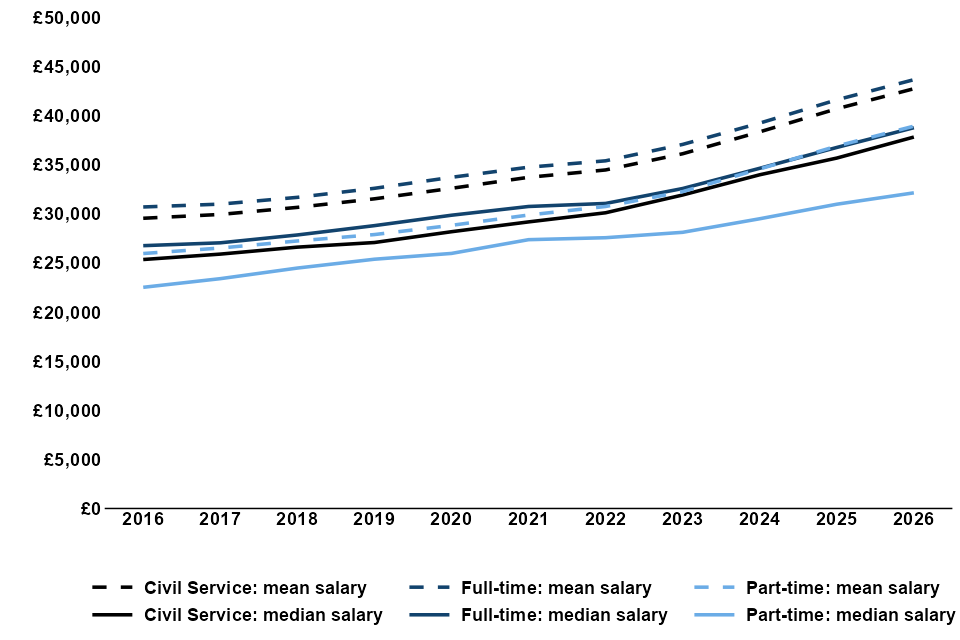
The median salary in the Civil Service rose to £37,820 in 2026 from £35,680 in 2025, an increase of £2,140 (6.0%).
The mean and median salaries (on a full-time equivalent basis) are higher for full-time staff compared to part-time staff.
Figure 11.1: Median and mean salary of full-time, part-time, and all civil servants, 2016 to 2026 (see table E9)
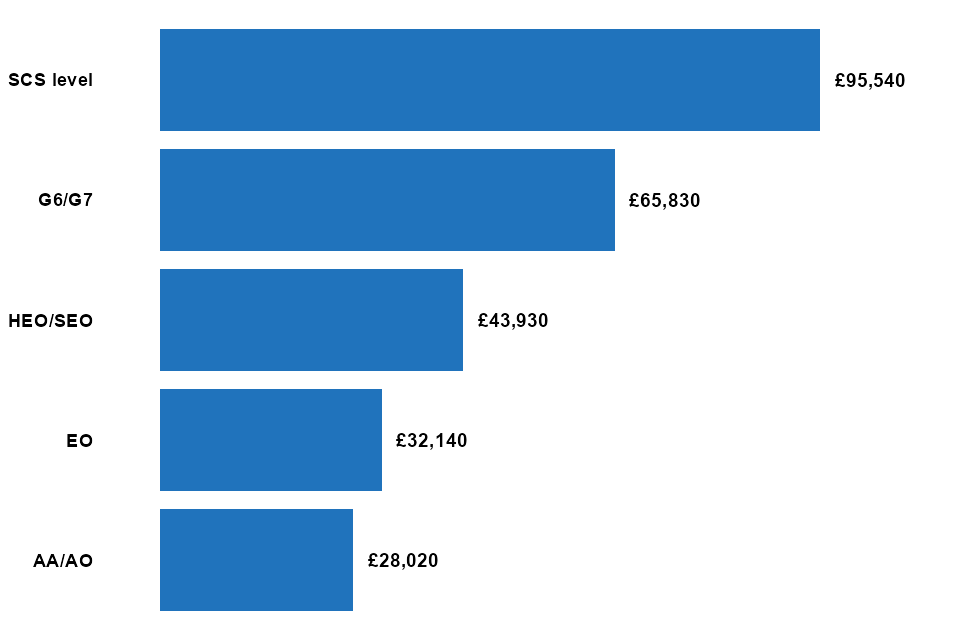
The median salary varies by grade, from £28,020 in the administrative grades to £95,540 at SCS level.
The median salary increased across all grades, ranging from 3.2% at SCS level to 5.2% at AA/AO level.
Figure 11.2: Median salary by grade (see table 25)
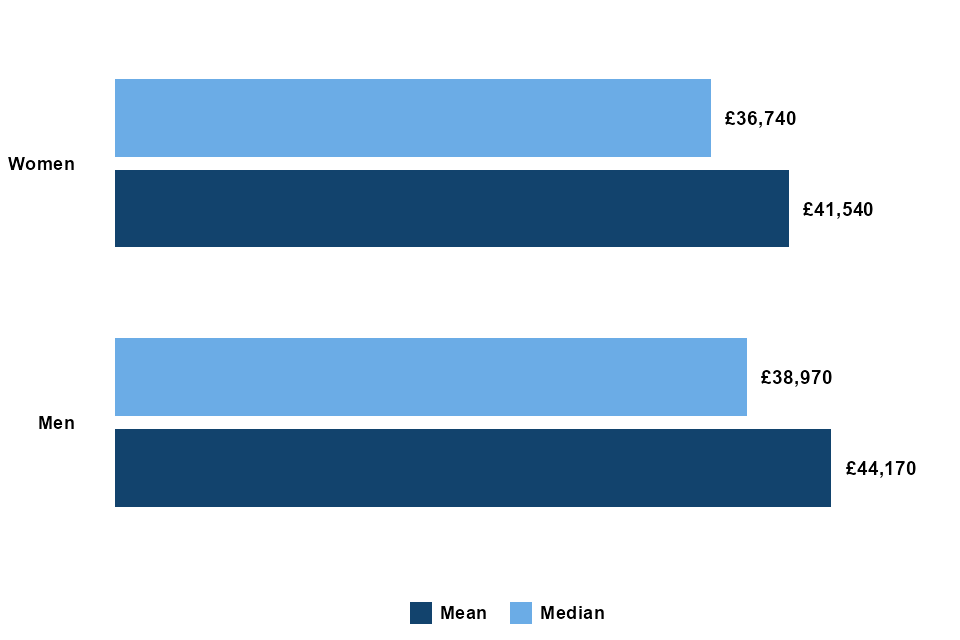
Women have a median salary of £36,740, compared to £38,970 for men. Women have a mean salary of £41,540 compared to £44,170 for men. Salary differences between the sexes are partly explained by their relative representations across the grades.
Figures represent the average across all staff, and may not be representative of changes affecting individuals or their salaries.
Figure 11.3: Mean and median salary by sex (see tables 7 and 24)
Statistical Notes
The differences in pay shown above do not represent the official measure of the ‘Gender Pay Gap’ (these are shown in the ‘Gender Pay Gap’ section). Government departments separately publish their gender pay gap data on the Gender pay gap service portal each year to comply with the legal requirements.
It is important to note that these figures are not adjusted for inflation. All salaries are on a full-time equivalent basis, i.e. the salary that part-time staff would earn if they worked full-time at the same hourly rate.
12. Working Pattern
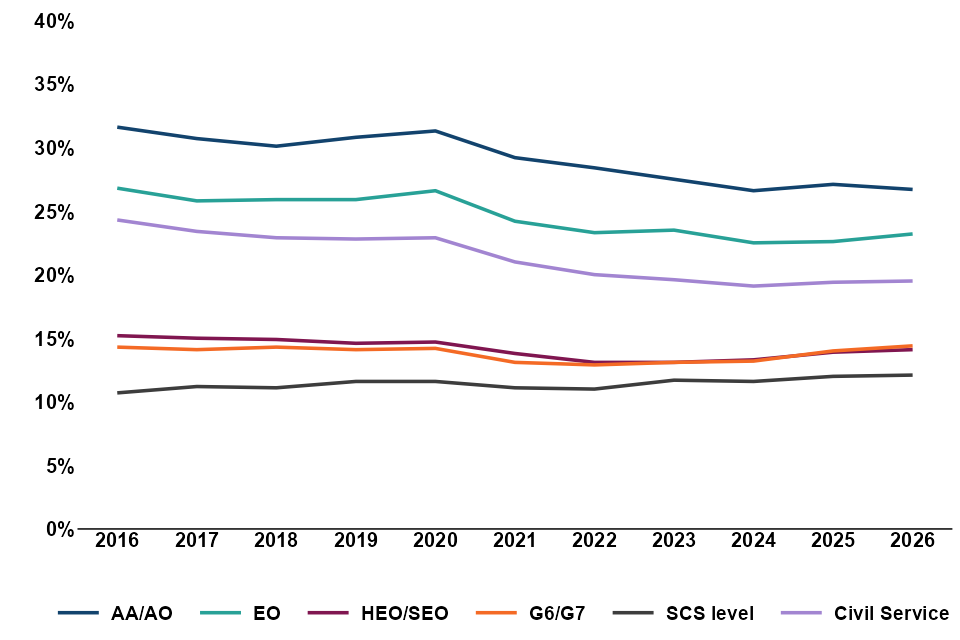
Just under one in five (19.5%) of civil servants work part-time. This is up slightly from 19.4% in 2025 and down from a peak of just over one in four (25.5%) in 2015.
The percentage of civil servants working part-time is lower in senior grades, decreasing from 26.7% of those in the AA/AO grades, to 12.1% at SCS level.
Figure 12.1: Percentage of civil servants working part-time by grade, 2016 to 2026 (see table E10)
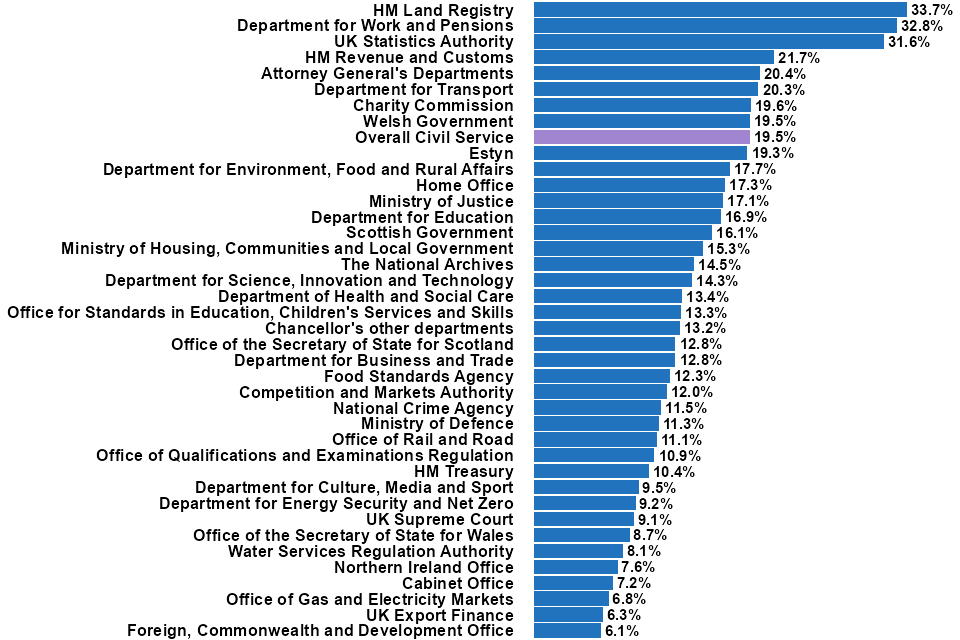
HM Land Registry has the highest percentage of employees working part-time (33.7%).
Figure 12.2: Percentage of civil servants working part-time by department (see table 36)
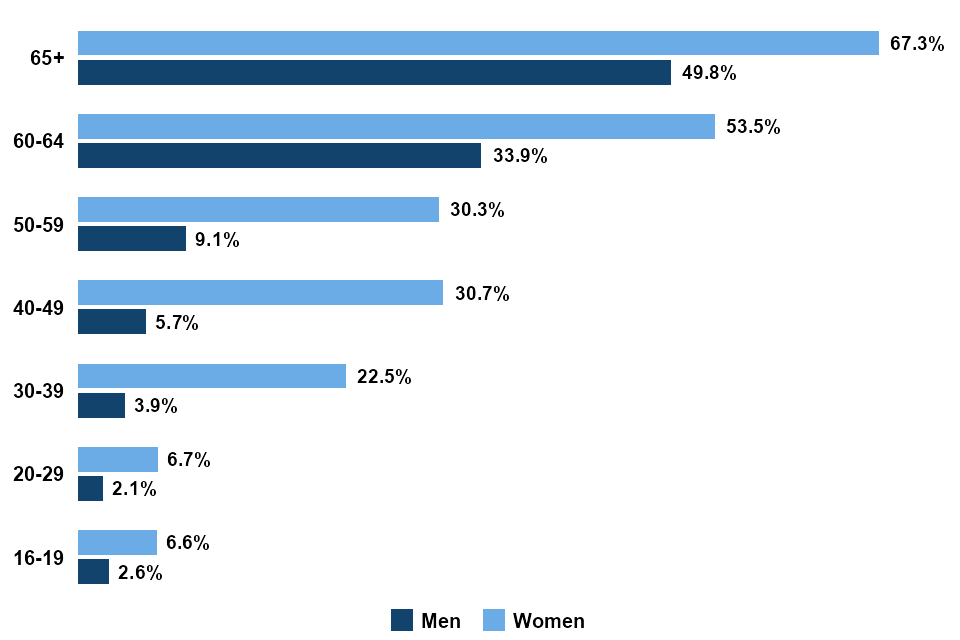
Women are more likely to work part-time than men at all age bands.
Overall, older age groups have a higher percentage of both men and women working part-time.
There is a marked increase in women working part-time from age bands 30-39 and above. At the age bands 60-64 and above, both men and women see a large increase in the percentage working part-time.
Figure 12.3: Percentage of civil servants working part-time by sex and age band (see table 34)
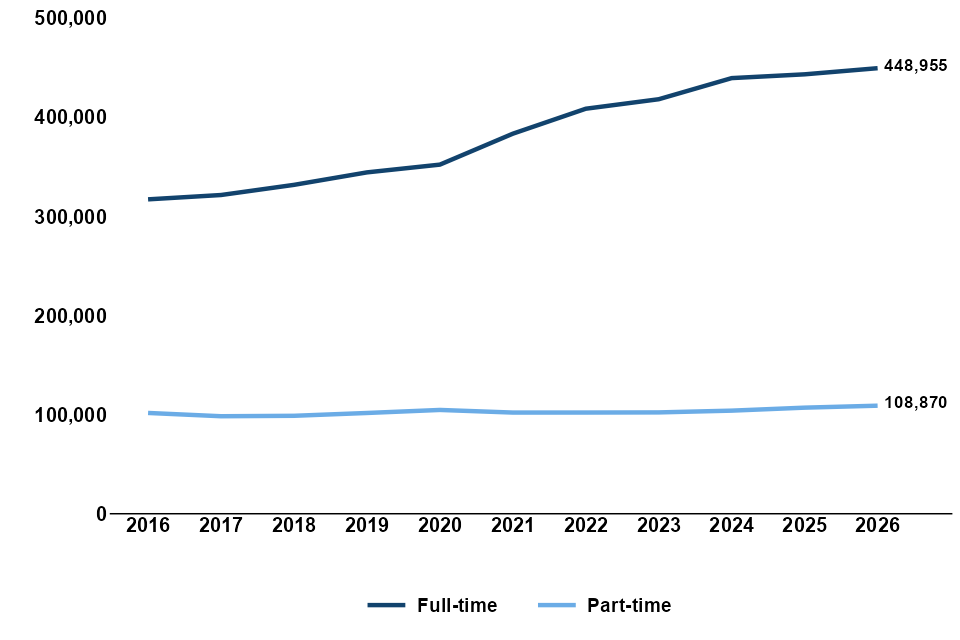
The number of civil servants working full-time is 448,955; an increase from 442,770 (+1.4%) in 2025.
The part-time headcount has shown a larger percentage change, increasing to 108,870 from 106,890 (+1.9%) across the same period.
Figure 12.4: Working patterns of civil servants, 2016 to 2026 (see table E11)
13. Gender Pay Gap
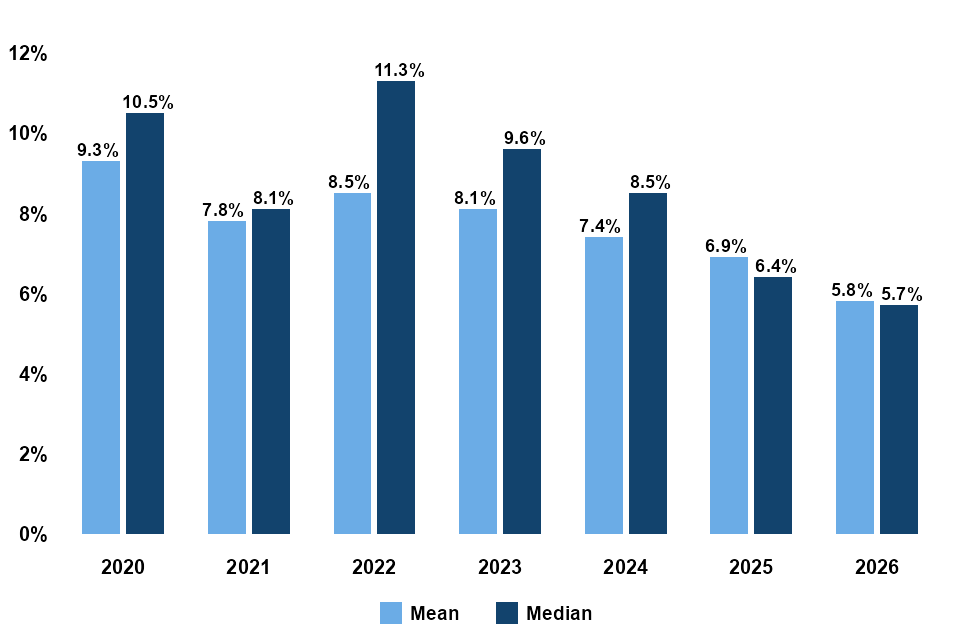
The median gender pay gap for the Civil Service reduced from 6.4% in 2025 to 5.7% in 2026. The mean gender pay gap for the Civil Service also reduced, from 6.9% in 2025 to 5.8% in 2026. These are the lowest reported gaps for both measures since overall Civil Service reporting began in 2020.
Figure 13.1: Gender pay gap, 2020 to 2026 (see table C and E12)
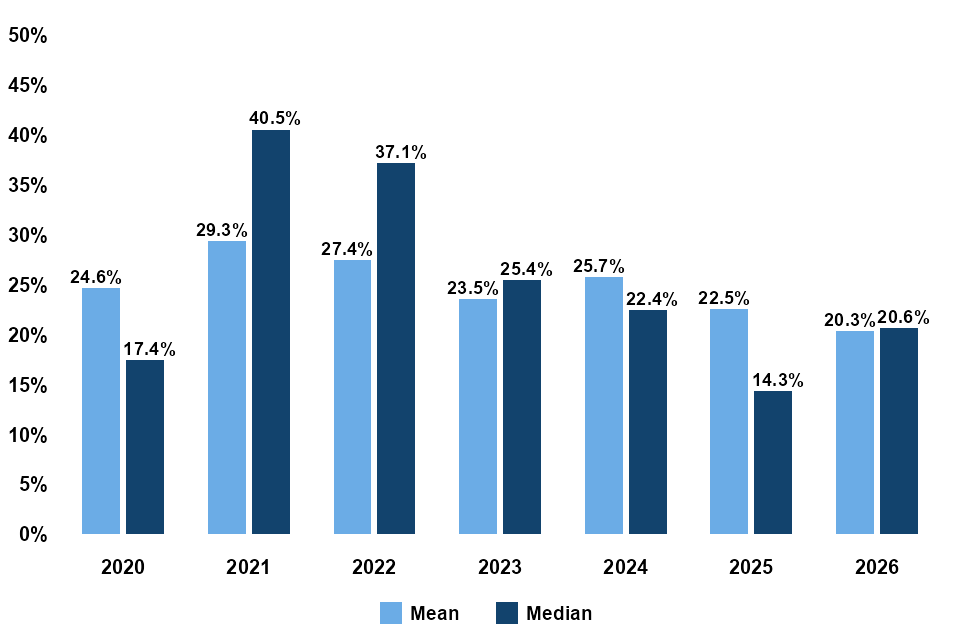
The median bonus gender pay gap for the Civil Service showed an increase from 14.3% in 2025 to 20.6% in 2026, whilst the mean bonus gender pay gap decreased from 22.5% to 20.3% across the same period.
Figure 13.2: Bonus gender pay gap, 2020 to 2026 (see table C and E12)
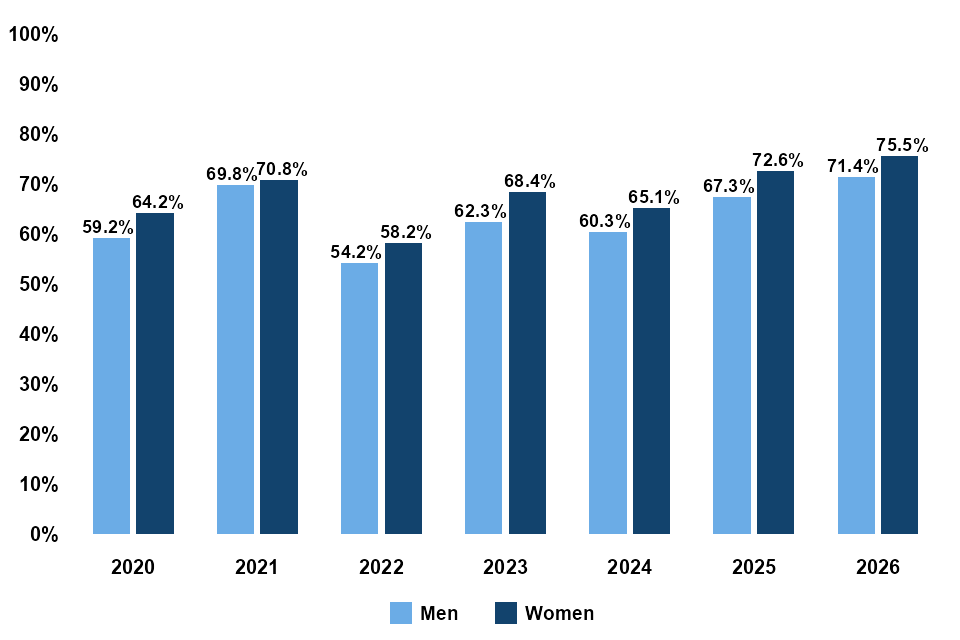
In line with last year, a higher proportion of women received a bonus compared to men (75.5% and 71.4% respectively).
Figure 13.3: Percentage of men and women receiving a bonus, 2020 to 2026 (see table C and E12)
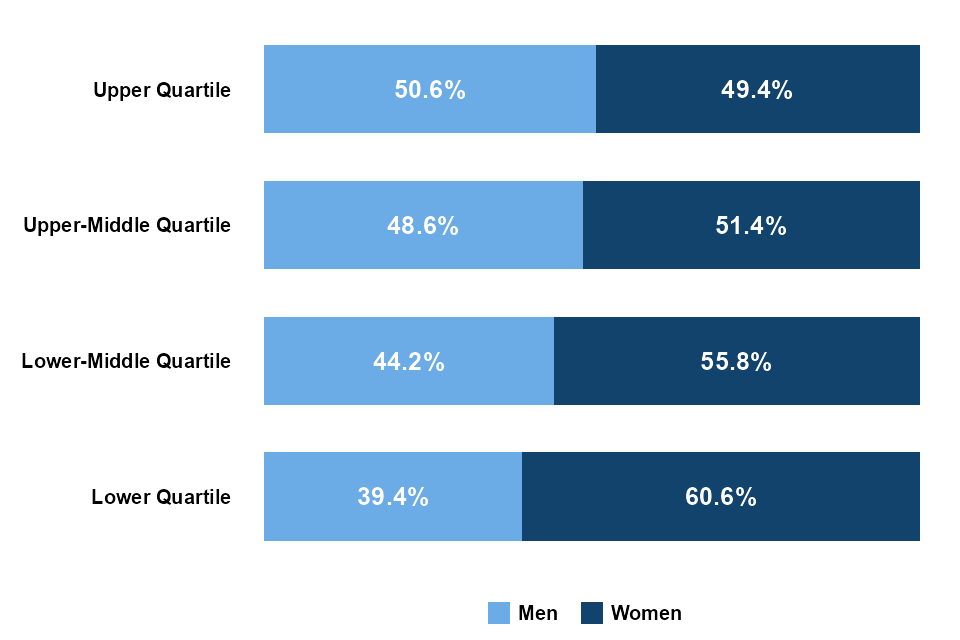
Women are under-represented in the highest pay quartile (49.4% women compared to 50.6% men) and overrepresented in the lowest pay quartile (60.6% women compared to 39.4% men).
Figure 13.4: Percentage of men and women in each pay quartile (see table C and E12)
Statistical Notes
Figures are calculated using a methodology aligned to the statutory reporting requirements. Earnings pay gap calculations are based on employees receiving their normal pay on 31 March 2026. Bonus calculations also include employees who received a bonus but who were on reduced pay or unpaid leave on 31 March 2026.
Please note figures on sex (and gender, for gender pay gap reporting) presented in these statistics are based on management information provided by departments, which records the ‘legal sex’ of civil servants. ‘Legal sex’ does not align with ‘sex’ as defined by The Equality Act 2010.
14. Profession
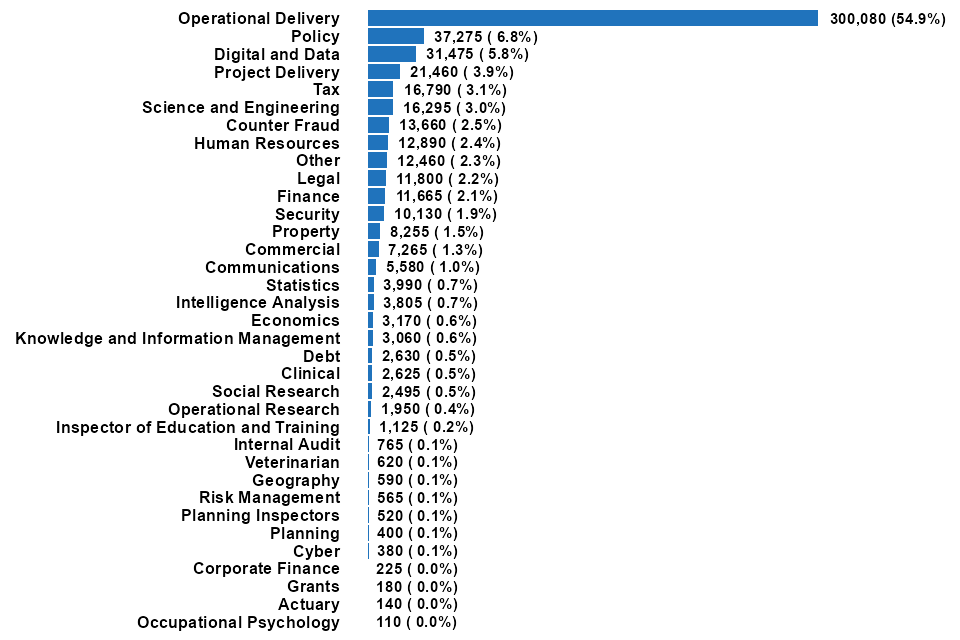
The majority of civil servants (54.9%) work in the Operational Delivery profession. Operational Delivery staff provide frontline government services directly to citizens or businesses, including paying benefits and pensions, providing employment services, staffing prisons, and issuing driving licences.
The next largest profession is Policy (6.8%), followed by Digital and Data (5.8%), Project Delivery (3.9%) and Tax (3.1%).
The reporting rate for professions data is 98.0%, up from 97.4% in 2025.
Figure 14.1: Percentage and headcount of civil servants working within each profession (see table 8)
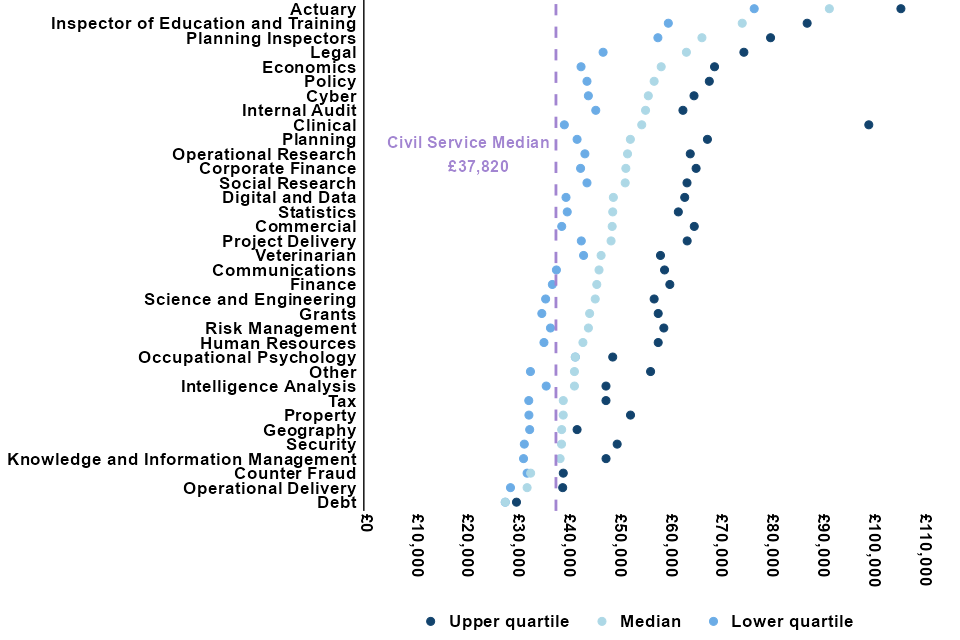
The professions with the highest median salary are Actuary (£91,640), Education and Training Inspectors (£74,490) and Planning Inspectors (£66,560).
Those with the lowest median salary are Debt (£27,840) and Operational Delivery (£32,140).
The Operational Delivery profession accounts for a large proportion of the Civil Service; therefore the overall median will be heavily influenced by the salaries in this profession.
Figure 14.2: Lower quartile, median, and upper quartile of salary by profession (see table 35)
15. Function
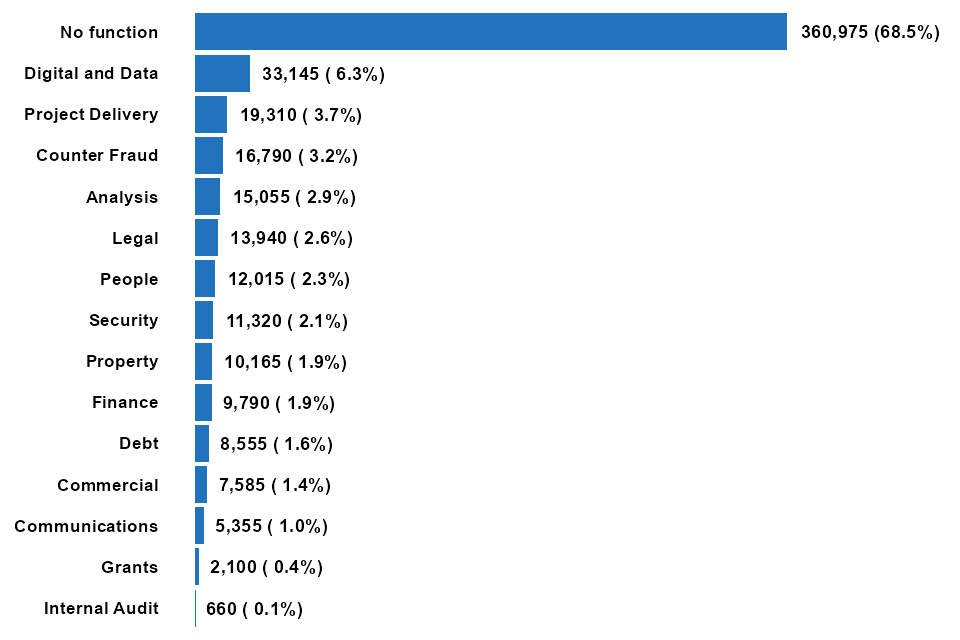
The majority of civil servants (68.5%) do not work in a function.
The largest function is Digital & Data (6.3%), followed by Project Delivery (3.7%), then Counter Fraud (3.2%).
The response rate for function information has increased from 91.2% in 2025 to 94.4% in 2026.
Figure 15.1: Headcount and percentage of civil servants working within each function (see table D1)
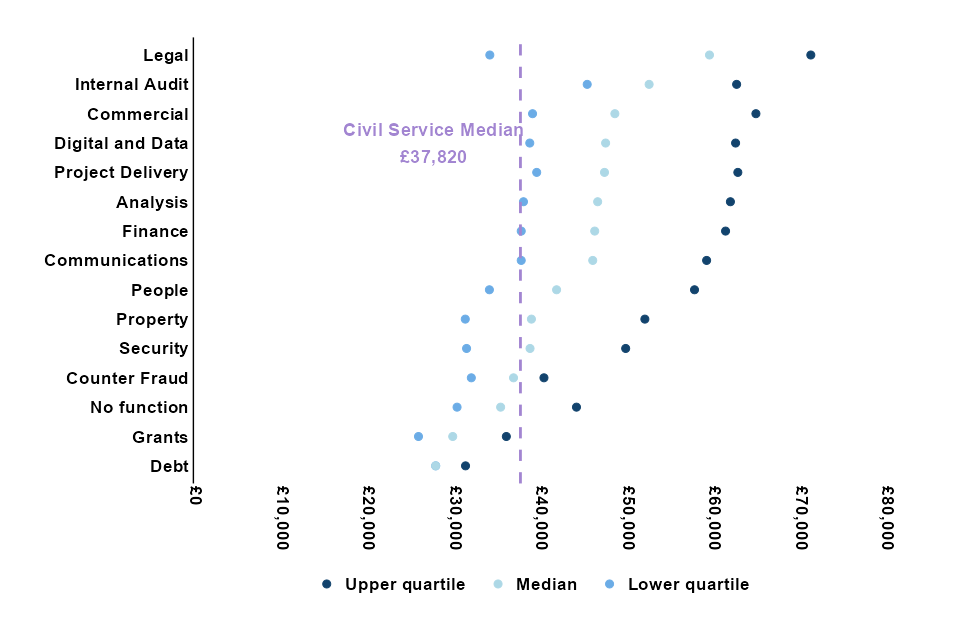
The functions with the highest median salary are: Legal (£59,680), Internal Audit (£52,700), Commercial (£48,740) and Digital and Data (£47,670). Those with the lowest median salary are Debt (£28,020) and Grants (£29,990).
Figure 15.2: Lower quartile, median and upper quartile of salary by function (see table D3)
Statistical Note
Welsh Government, Scottish Government and Serious Fraud Office did not supply any, or provided very limited information on functions.
16. Entrants and Leavers
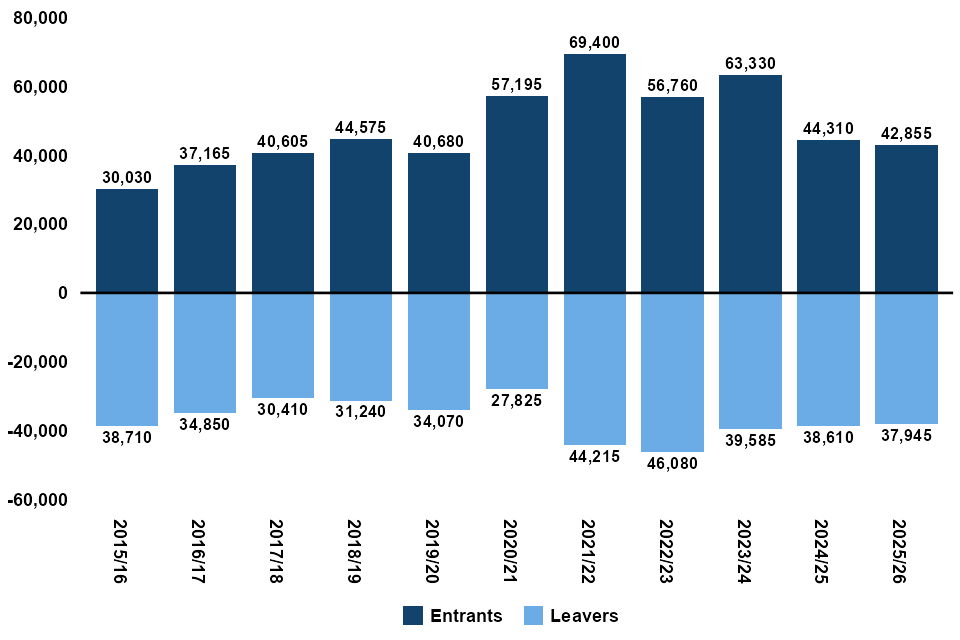
The number of new entrants this year decreased to 42,855 from 44,310 in 2024/25.
Over the year, 37,945 people left the Civil Service, down from 38,610 in 2024/25.
Figure 16.1: Civil Service entrants and leavers, 2015/16 to 2025/26 (see table E13)
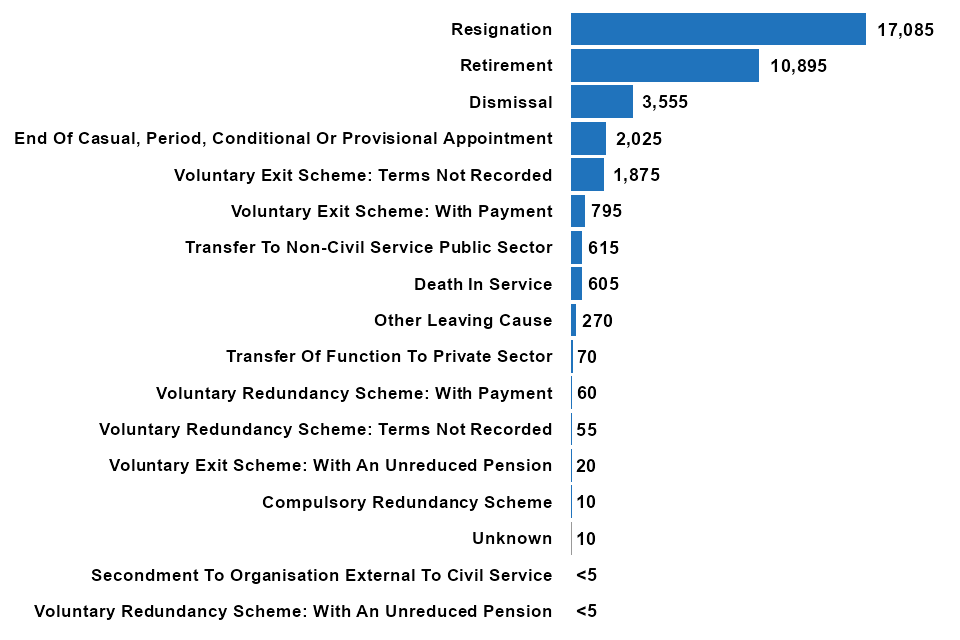
The most common reason for leaving the Civil Service is resignation, accounting for 17,085 leavers. The next most common reason is retirement (10,895).
Figure 16.2: Civil Service leavers by leaving cause (see table 32)
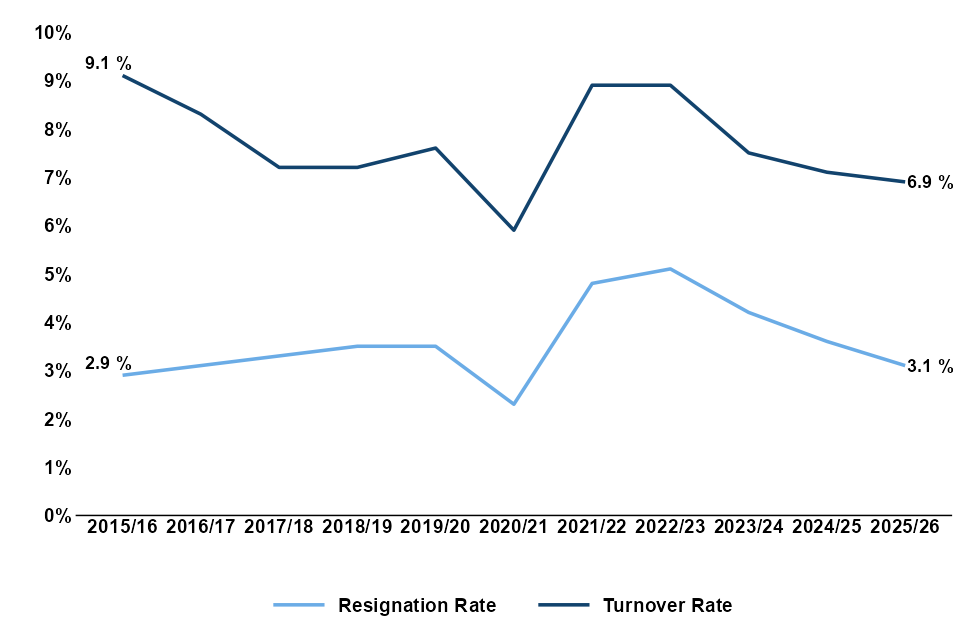
The turnover rate in the Civil Service fell to 6.9% from 7.1% in 2024/25. The resignation rate fell to 3.1% from 3.6% in 2024/25.
Figure 16.3: Civil Service turnover rates, 2015/16 to 2025/26 (see table E14)
Statistical Notes
Entrant and leaver numbers are calculated from entry and leaving dates provided as part of the ACSES data collection. The difference between them does not align precisely with the year-on-year difference between in-post headcounts. For example, there are people who left and rejoined the Civil Service more than once during a year, and people whose last day falls on the reference date (31 March) - these are counted as both leavers and in-post.
Turnover rate includes all moves out of the Civil Service over each year to 31 March.
17. Notes
See the quality and methodology information document for further detail
How the output is created
The statistics in this release are derived from returns completed as part of the Annual Civil Service Employment Survey (ACSES). Its scope covers all Civil Service organisations, including all major Departments. ACSES requests from organisations an individual-level record of all their Civil Service employees ‘in post’ as at the reference date, along with records for leavers and entrants from/to the Civil Service in the preceding 12 months. ACSES collects information via a standard Excel template that includes data fields on pay, contractual hours, grade and location. It also includes personal characteristics, such as age, sex, religion, and sexual orientation. The data collected are anonymous in that no employee names are requested. The data, however, is considered and handled as ‘personal data’ because in certain circumstances individuals may be identifiable. Where departmental figures are quoted these will include the main department and their executive agencies and crown non-departmental public bodies. For Gender Pay Gap, however, different aggregations may apply – see relevant data table. Given the varied nature of the HR/pay systems used by departments, caution should be exercised in comparing statistics across departments.
Further information
The Civil Service Statistics data tables, and the quality and methodology information document are published on gov.uk.
Data up to 2018 are also made available via NOMIS, which is a service provided by the ONS to give users free access to a range of UK labour market statistics from official sources. There may be small differences in NOMIS figures and ACSES time-series data within this online bulletin resulting from ensuring consistency of methodology between this year and previous years.
External Sources
UK Workforce comparison figures for disability and ethnicity use the ONS Labour Force Survey data (May 2026) for those economically active aged 16-64 as of Jan-Mar each year.
Technical notes
Organisations within the Civil Service have different grading systems. These have been mapped to common responsibility levels in the statistics presented in this bulletin.
There are two measures of the SCS available: the Senior Civil Service and SCS level. ACSES measures SCS level employees that includes a number of health professionals, military personnel, and senior diplomats that are not part of the Senior Civil Service. The Civil Service Statistics release, therefore, does not contain the official headline figures used for monitoring diversity, pay and other key measures of the Senior Civil Service. These are monitored using the Cabinet Office SCS Database that collects more frequent and comprehensive information on those individuals that make up the Senior Civil Service.
18. About
Civil Service Statistics is an annual Accredited Official Statistics release describing the UK Civil Service workforce in terms of its size, demographic characteristics, salaries, working pattern, grade, and location. The data is drawn from the Annual Civil Service Employment Survey (ACSES).
The Civil Service helps the government of the day develop and implement its policies as effectively as possible. It provides services directly to the public, including paying benefits and pensions; running employment services; running prisons and issuing driving licences. Civil servants also work on policy development and implementation, including analysts, project managers, lawyers and economists.
Organisations that make up the Civil Service include central government departments, their agencies, and crown non-departmental government bodies.
These statistics count all home Civil Service employees, including those based in Northern Ireland and Overseas. Not included are the Northern Ireland Civil Service, other Crown servants and employees of the wider public sector, for example, employees of non-crown non-departmental public bodies and the National Health Service (NHS).
Notes on the statistics
Unless otherwise specified, all percentages are calculated on a headcount basis and exclude unknown values for all variables. Figures are rounded to the nearest 5 in the case of headcounts/FTEs, with salaries rounded to the nearest £10. Percentages are rounded to one decimal place. Data in this release is available in the associated Civil Service Statistics data tables. Where time-series are presented, data have been taken from previous Civil Service Statistics publications.
Further analysis and methodology
Summary information on the scope and limitations is available in the Notes section of this release, with further details available in the quality and methodology information document published on the gov.uk website, along with previous versions of these statistics
Accredited Official Statistics
These accredited official statistics have been independently reviewed by the Office for Statistics Regulation (OSR). They comply with the standards of trustworthiness, quality and value in the Code of Practice for Statistics. Accredited official statistics are called National Statistics in the Statistics and Registration Service Act 2007.
Accreditation signifies their compliance with the authority’s Code of Practice for Statistics which broadly means these statistics are:
-
managed impartially and objectively in the public interest
-
meet identified user needs
-
produced according to sound methods
-
well explained and readily accessible
Our statistical practice is regulated by the Office for Statistics Regulation (OSR).
OSR sets the standards of trustworthiness, quality and value in the Code of Practice for Statistics that all producers of official statistics should adhere to.
These statistics were independently reviewed by the OSR in February 2022. See Compliance Check of Civil Service Statistics. Since this review by the OSR, we have continued to comply with the Code of Practice for Statistics.
Request for Feedback
If you would like to provide feedback on any aspect of this statistical release, please contact us.