Child and Working Tax Credits Statistics: Provisional Awards April 2021 Main Commentary
Published 23 June 2021

© Crown copyright 2021
This publication is licensed under the terms of the Open Government Licence v3.0 except where otherwise stated. To view this licence, visit nationalarchives.gov.uk/doc/open-government-licence/version/3 or write to the Information Policy Team, The National Archives, Kew, London TW9 4DU, or email: psi@nationalarchives.gov.uk.
Where we have identified any third party copyright information you will need to obtain permission from the copyright holders concerned.
This publication is available at https://www.gov.uk/government/statistics/child-and-working-tax-credits-statistics-provisional-awards-april-2021/child-and-working-tax-credits-statistics-provisional-awards-april-2021-main-commentary
Contact details
For queries or feedback on this publication, please contact:
For press queries, please contact:
- HMRC Press Office, tel: 03000 585018
What are tax credits?
Tax credits are a system of financial support for families based on their specific circumstances.
The system, introduced in 2003, forms part of wider government policy to provide support to parents returning to work, reduce child poverty and increase financial support for families. The design of the system means that as families’ circumstances change, so does (daily) entitlement to tax credits.
Tax credits are based on household circumstances and can be claimed jointly by couples or by single adults.
Entitlement is based on the following factors:
- age
- income
- hours worked
- number and age of children
- childcare costs
- disabilities
For further information about who can claim please refer to the benefits page on GOV.UK.
These statistics focus on the number of families benefiting from Child Tax Credit (CTC) and/or Working Tax Credit (WTC) in England, Scotland, Wales and Northern Ireland as at 2 April 2021.
This publication presents a breakdown of families by their profile position, age and gender, type of family and family size as well as the number of children in benefiting families, broken down by age.
It also includes statistics on families benefiting from each of the different elements of tax credits and provides information on the income used in calculating awards and the frequency of payments.
Main Headlines
As at April 2021, there were:
- 1.90 million families claiming CTC and/or WTC in April 2021. This is a fall of 427,000 when compared to a year earlier.
- 3.49 million children in tax credit claiming families. This is a fall of 902,000 when compared to a year earlier.
Figure A: Number of families claiming tax credits since April 2009
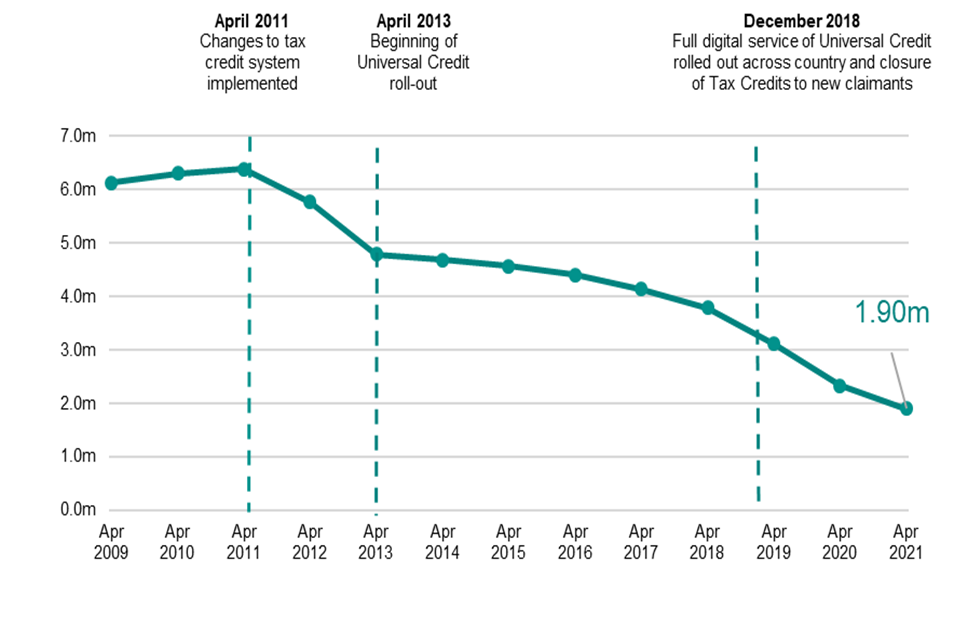
Figure A shows the number of families claiming tax credits since April 2009. Since the peak in 2011 the number of families claiming tax credits has fallen to 1.90 million in April 2021. Figure A also shows policy changes introduced which could have had an impact on these numbers. In April 2011, changes to the tax credit system were implemented. In April 2013, Universal Credit (UC) had started to be rolled out and by December 2018 there was a full digital service of UC across the country and a closure of new tax credits claims.
Figure B: Breakdown of tax credits population
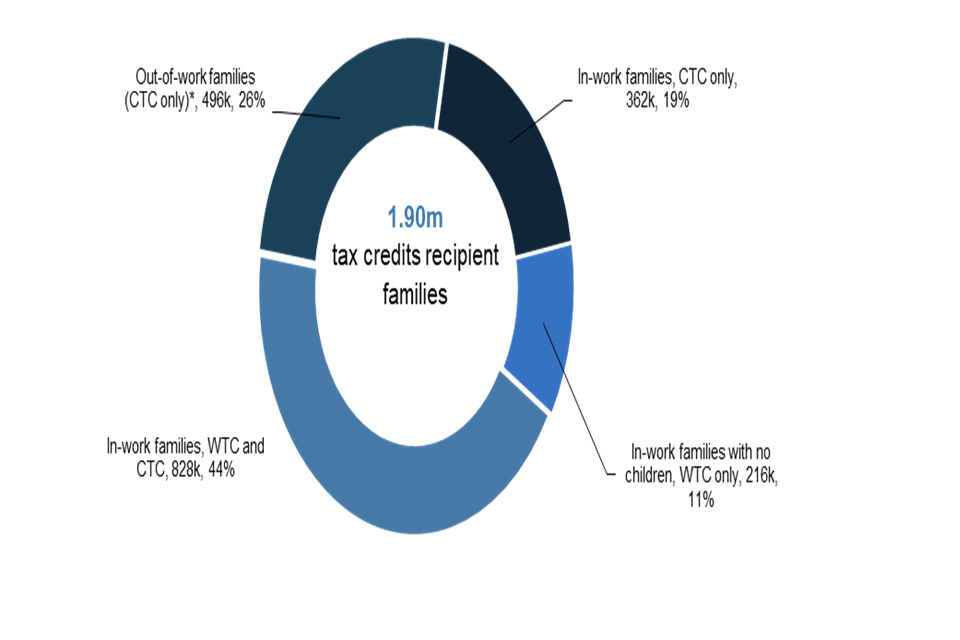
Figure B shows that there were 1.90 million tax credits claimants in April 2021. 26% of these were out-of-work and claiming CTC only. 19% were in-work and claiming CTC only. 11% were in-work claiming WTC only and 44% were in-work and claiming both CTC and WTC.
Figure C: Families and children in each Country or English Region
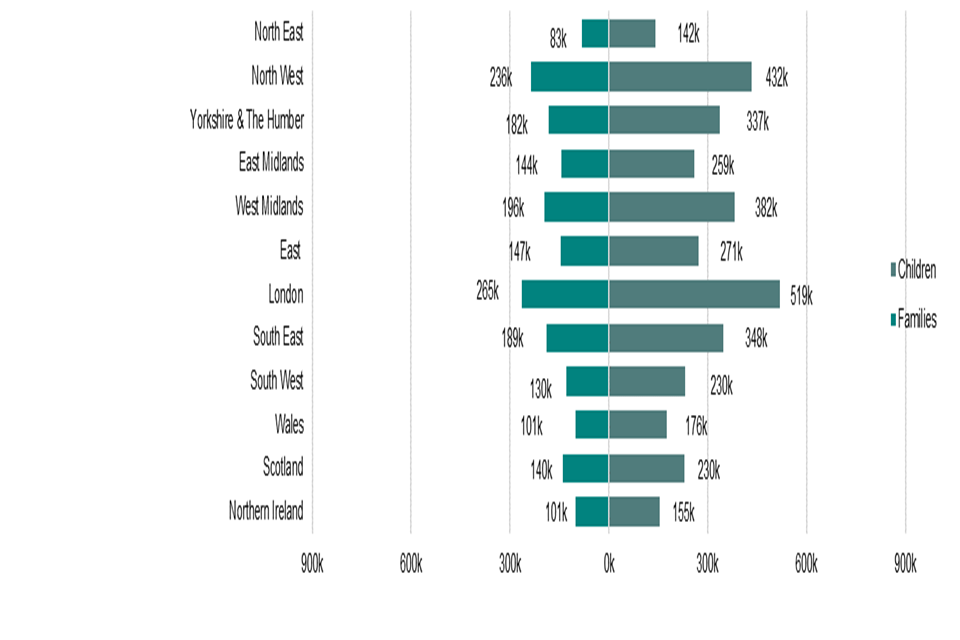
Figure C shows the families and children in each country or English region claiming tax credits. London has the most families and children claiming tax credits whilst the North East has the least. Specific breakdowns can be found in Table 8.1 and Table 8.2.
Changes Since Previous Publication
Impacts of the Covid-19 Pandemic
During 2020, the Covid-19 pandemic led to some changes in the tax credit system which may have had an impact on these statistics.
As part of a number of measures to support the country, the basic element of WTC was increased by £1,045 to £3,040 from 6 April 2020 until 5 April 2021. The amount a claimant or household has benefited depends on their circumstances, including their level of household income, how many children they are responsible for and if they are disabled.
However, claimants will have received an increase of up to £20 each week. The temporary increase moved many claimants from nil to positive awards at the start of April 2020.
At the start of the pandemic, there was also a higher than usual move to (UC) due to unemployment impacts and a reduction in working hours. These impacts have largely offset one another. Policies were also introduced relaxing rules on the number of hours claimants need to work to be eligible for WTC.
HMRC automatically renewed tax credit claims for 2019 to 2020 apart from those identified as very high risk. This is likely to have resulted in fewer tax credits terminations than there would have been otherwise.
HMRC Consultation on Official Statistics
HMRC launched a wide-ranging consultation on our official statistics on 8 February 2021.
This included changes to a number of tax credits statistics releases including a proposal to reduce the provisional award statistics from twice yearly to annually. We plan to consult further with users of these statistics who responded to the consultation with the aim of moving to an annual publication, published each summer alongside or as one publication with the Child and Working Tax Credits Finalised Award statistics.
Section 1: Time Series
Section 1 provides statistics on the history of the tax credits system between April 2009 and April 2021. This enables comparisons across different tax credits populations and describes how various parts of the system have changed over time.
Figure 1.1: Total number of families receiving CTC and WTC, April 2009 to April 2021
Figure 1.1 shows the total number of families claiming tax credits was around 6 million until 2011. This figure subsequently decreased as a result of policy changes announced in the June 2010 budget, the October 2010 spending review and the introduction of UC in 2013.
The roll-out of UC to all areas of the country was completed on 12 December 2018, which means that from this date there were no new claims for tax credits except in a small number of limited circumstances.
As at April 2021, the total number of families claiming tax credits was 1.90 million.
Figure 1.2: Breakdown of the recipient families by type of credits received
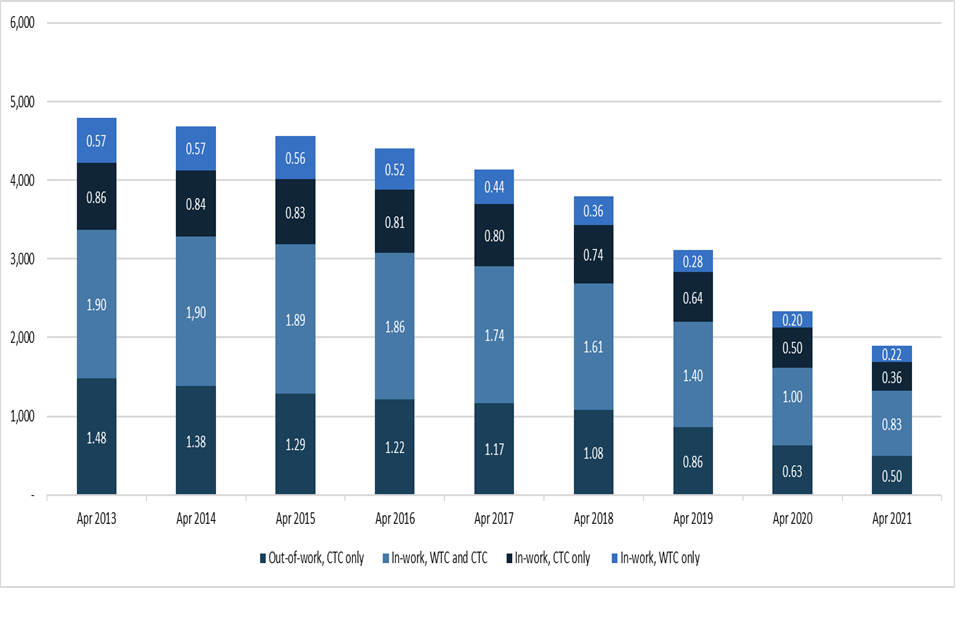
Figure 1.2 breaks down the tax credits population by the type of benefit they receive and have received since April 2013. As shown above, the largest recipient category is ‘In-work, WTC and CTC’, followed by ‘Out-of-work, CTC only’ followed by ‘In-work, CTC only’ and then finally ‘In-work, WTC only’. This has been the order since April 2013.
Figure 1.3: Number of families claiming WTC only (in-work families with no children) and families claiming the childcare element
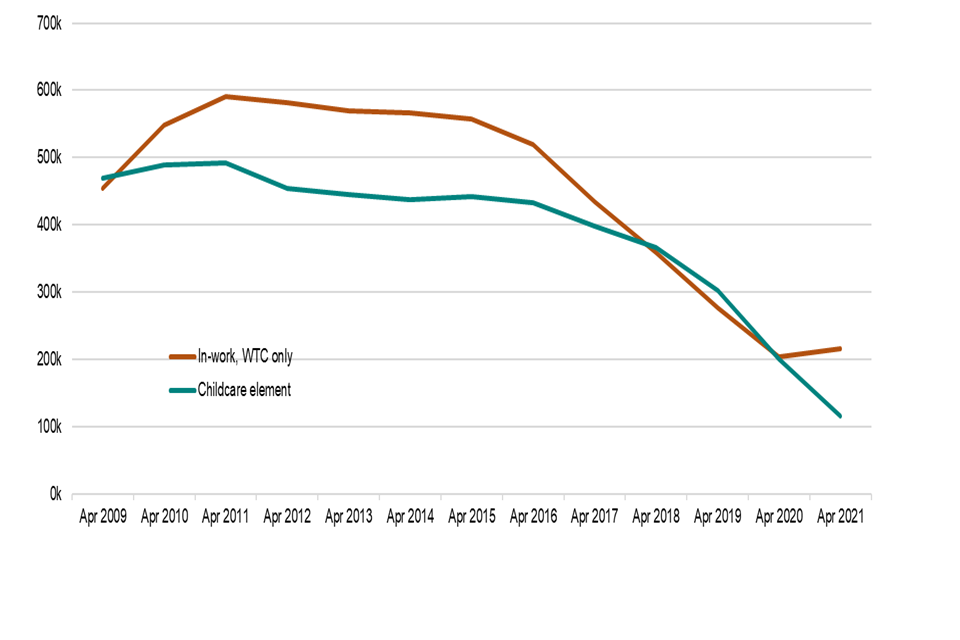
Figure 1.3 shows that the number of families claiming WTC only peaked at 591,000 in April 2011. It remained above 500,000 until April 2016, but has since decreased to 216,000 in April 2021. Figure 1.3 also shows that the number of families benefiting from the childcare element has fallen to 117,000 from a peak of 493,000 in April 2011.
The small increase in the WTC only claimants in April 2021 is due to the measures put in place at the beginning of the Covid-19 pandemic. The temporary increase in WTC basic element of £20 per week from 6 April 2020 to 5 April 2021 moved many claimants from nil to positive awards at the start of April. More details of these measures are provided in the Covid-19 impacts section above.
Section 2: Summary
Section 2 provides a summary on the tax credits population at April 2021. More detailed breakdowns can be found in sections 3 to 8.
Figure 2.1: Composition of families receiving different types of tax credits
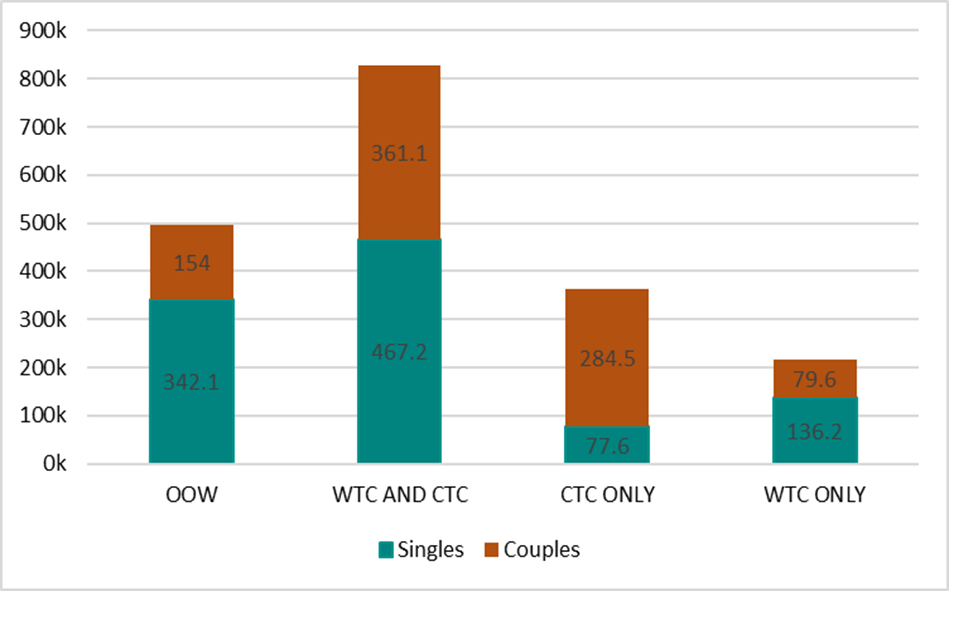
Figure 2.1 shows the tax credits population by the type of tax credits they receive and the composition of their family (whether they are single or in a couple). The majority of recipients are in work and receiving both WTC and CTC. Almost 70% of out-of-work families receiving CTC only are lone parents. Approximately 80% of the in-work families receiving CTC only are couples.
Figure 2.2: Recipient families: proportion of families receiving each type of award
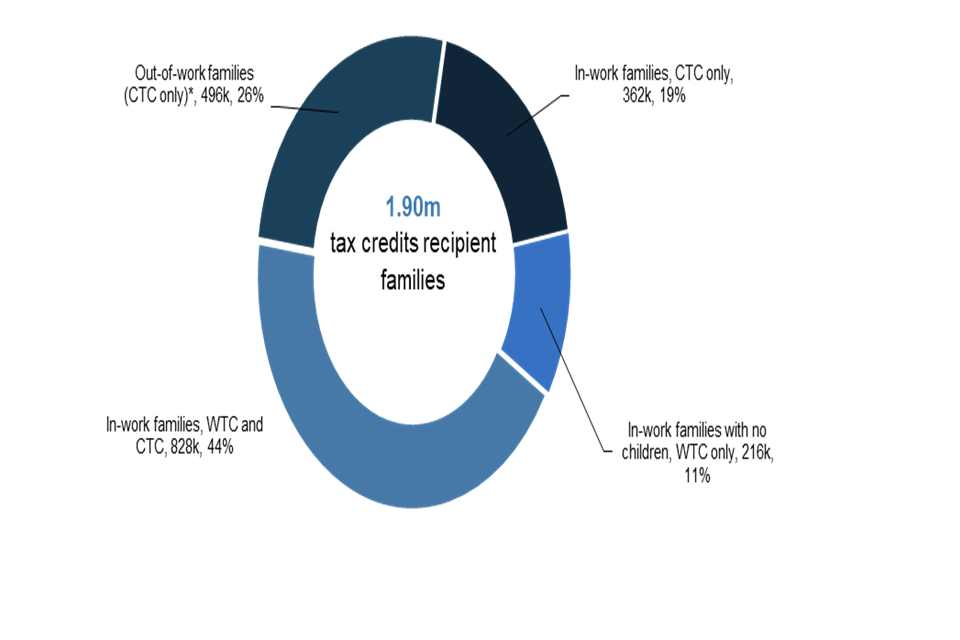
Figure 2.2 shows that 26% of families claiming tax credits are out-of-work families receiving CTC (*less than 1% receive the family premium through DWP benefits) and in-work families make up the remaining 74%. Within this, 44% of families are claiming relatively higher value awards (WTC and CTC), 19% are claiming CTC only and the remaining 11% are in-work families with no children claiming WTC only.
Table 2.1: Recipient families, couples and single adults and their children (thousands)
| Families-Singles | Families-Couples | Total Families | Number of Children in Recipient Families | |
|---|---|---|---|---|
| Out of Work Families with Children | 342.1 | 154.0 | 496.2 | 1,029.3 |
| Receiving CTC | 337.1 | 151.4 | 488.5 | 1,015.6 |
| of which maximum award [footnote 1] | 332.0 | 134.2 | 466.3 | 968.9 |
| of which tapered | 5.0 | 17.2 | 22.3 | 46.6 |
| Receiving equivalent in DWP benefits [footnote 2] | 5.1 | 2.6 | 7.6 | 13.7 |
| In-Work Families with Children | 544.8 | 645.6 | 1,190.5 | 2,456.1 |
| of which receiving WTC [footnote 3] and CTC | 467.2 | 361.1 | 828.3 | 1,660.6 |
| and maximum award [footnote 1] | 70.5 | 34.5 | 105.0 | 222.0 |
| and tapered | 396.7 | 326.6 | 723.3 | 1,438.7 |
| Total Receiving CTC only | 77.6 | 284.5 | 362.1 | 795.5 |
| In-Work Families with No Children(WTC only) | 136.2 | 79.6 | 215.8 | [no data] |
| of which maximum award [footnote 1] | 30.3 | 9.9 | 40.2 | [no data] |
| of which tapered | 105.8 | 69.7 | 175.5 | [no data] |
| Total In-Work Families | 681.0 | 725.2 | 1,406.2 | 2,456.1 |
| All Families | 1,023.1 | 879.3 | 1,902.4 | 3,485.4 |
| With children | 887.0 | 799.7 | 1,686.6 | 3,485.4 |
| Other | 136.2 | 79.6 | 215.8 | [no data] |
Section 3: Age, Gender and Children in Recipient Families
Section 3 focuses on the demographic breakdown of the tax credits population, including the age and gender of adults in recipient families as well as the number and age of children in each family.
Figure 3.1: Age breakdown of adults receiving tax credits
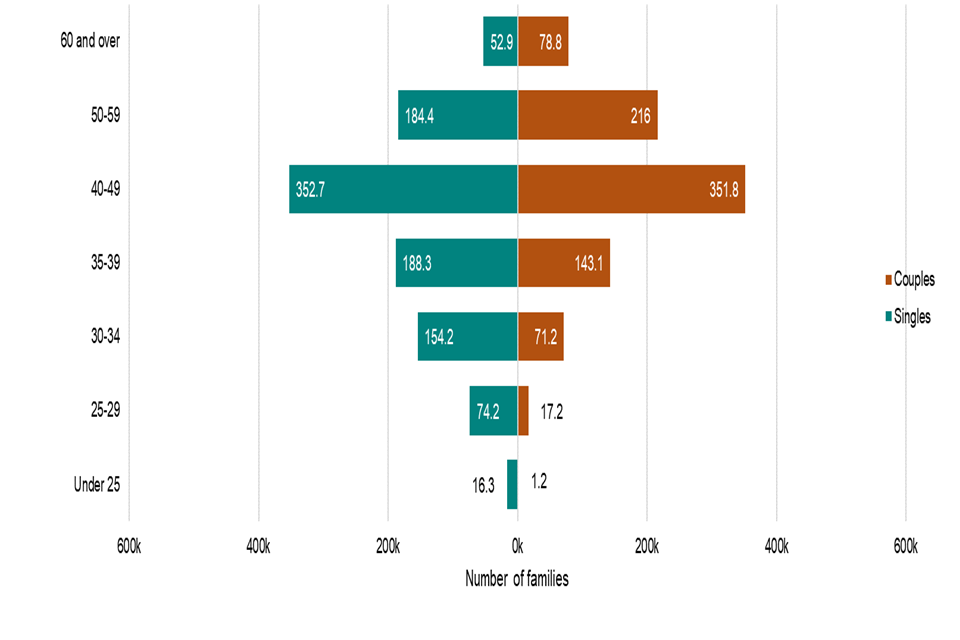
Figure 3.1 shows the age breakdown of adults receiving tax credits and whether they are single or in a couple. Figure 3.1 shows that tax credits recipients most commonly fall within the 40-49 age range. Overall, the age distribution for singles is younger than for couples.
Figure 3.2: Number of children in families receiving CTC
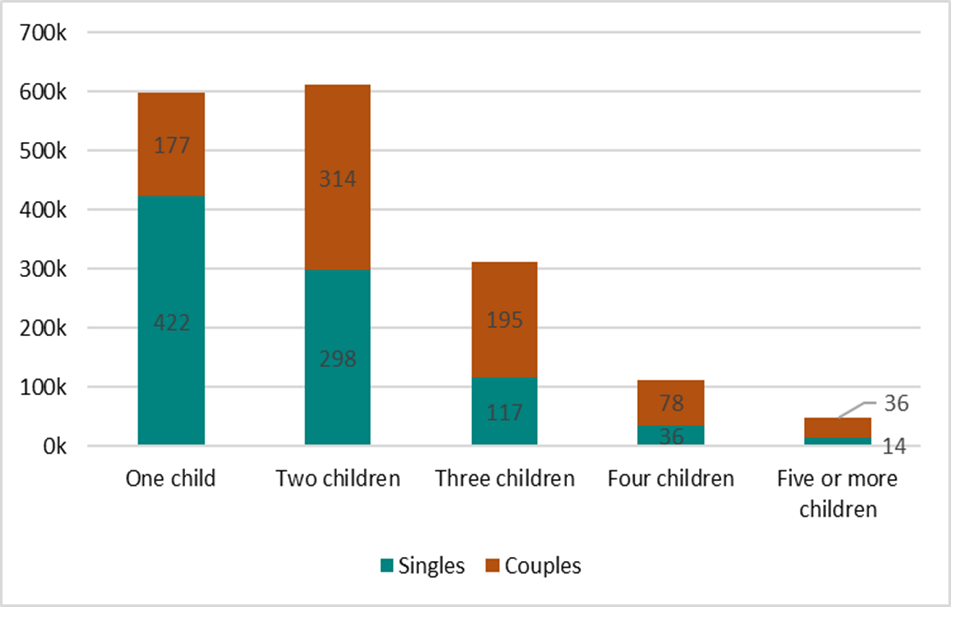
Figure 3.2 shows the number of children in different types of families receiving CTC. A majority of families receiving CTC had either one or two children. Couples are more likely than single adults to have larger family sizes; around 70% of one-child families have a single adult claimant whereas 65% of claims with three or more children are from couple families.
Figure 3.3: Distribution of children[footnote 4] by age in tax credit families
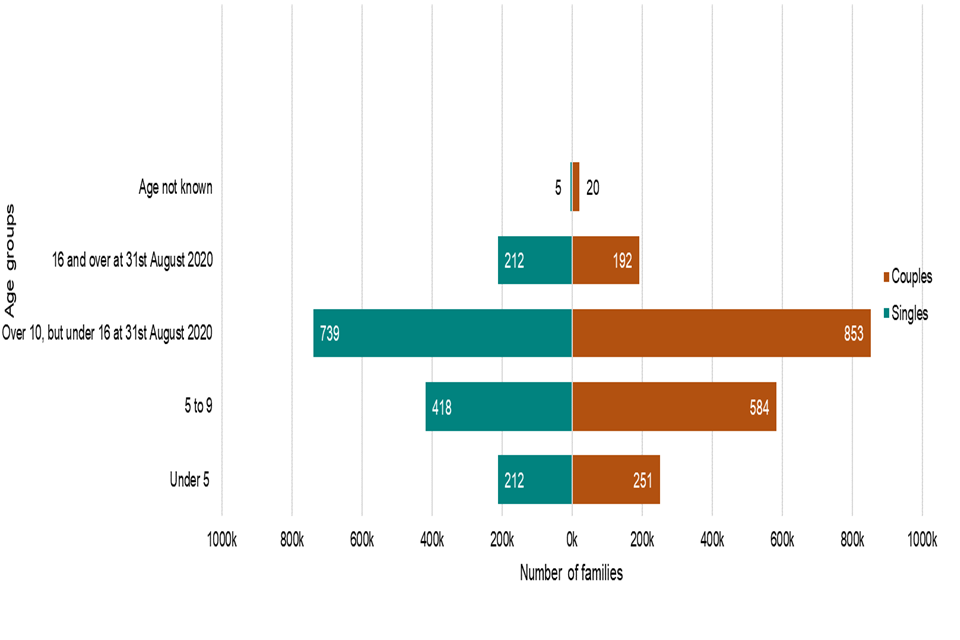
Figure 3.3 shows the distribution of children by age in tax credit families. Single adult families have slightly more qualifying young people aged 16 and over than families with two adults. In general, lone parents are more likely to be claiming tax credits for older children or qualifying young people than their couple counterparts.
Figure 3.4: Gender of tax credits single families in out-of-work and in-work families
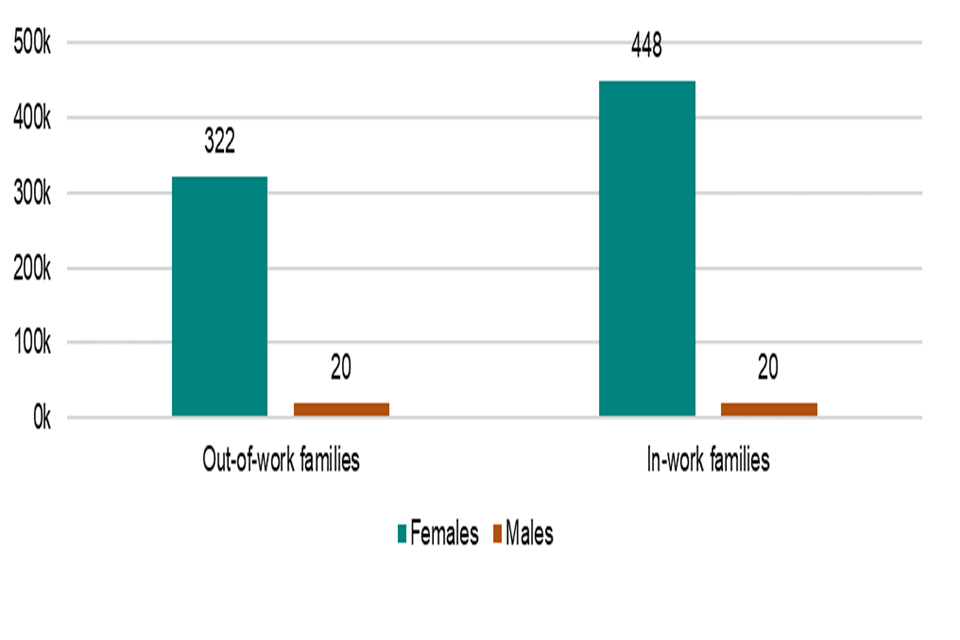
Figure 3.4 shows that females make up the majority of out-of-work (94%) and in-work (96%) single families.
Figure 3.5: Gender of working [footnote 5] adult(s) in couple families
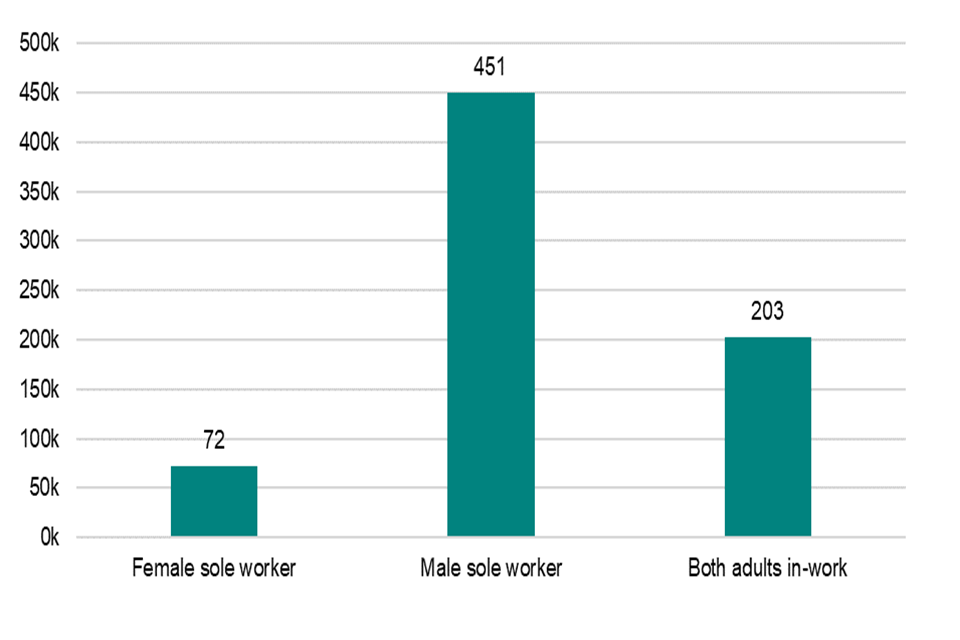
Figure 3.5 shows that in families with one sole worker, males make up the majority (86%).
Section 4: Hours Worked and Childcare of In-Work Recipient Families
Section 4 focuses on the in-work recipient families, with breakdowns of the numbers of hours worked per week and the number of families benefiting from the 30-hour element. It also covers the number of families benefiting from the childcare element and the cost of that childcare.
Figure 4.1: Weekly hours worked by main worker for in-work families in receipt of tax credits (thousands)
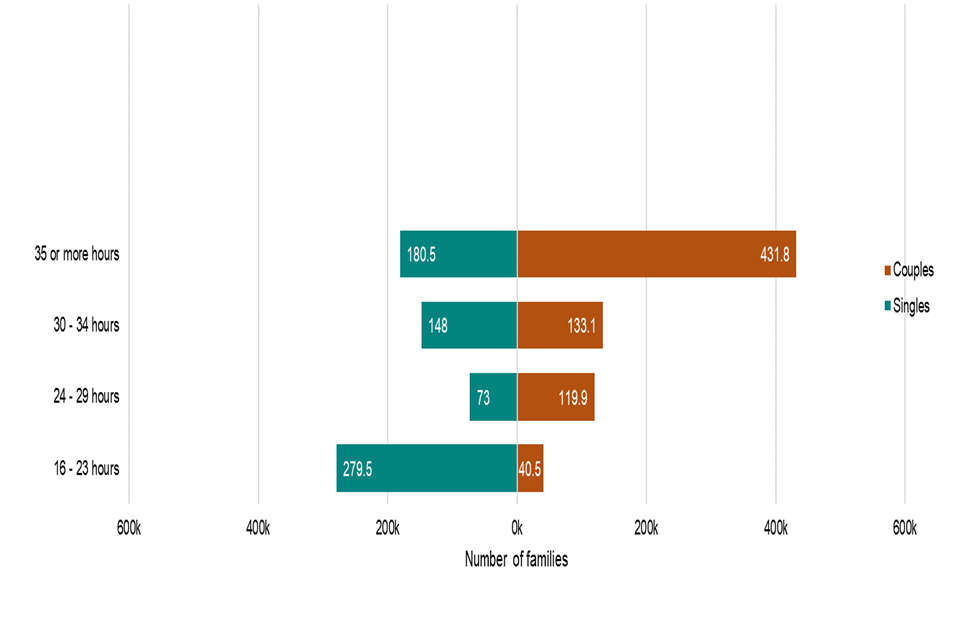
Figure 4.1 shows the number of weekly hours worked by the main-worker for in-work families receiving tax credits. The majority of main-workers in couples work full-time (or the equivalent of 35 hours or more per week). The majority of single parents work part-time, but there is a more even split for them across part-time and full-time work.
In addition to the 893,000 families where the main or only worker works over 30 hours per week, 39,900 couples whose combined hours exceed 30 per week benefit from the 30-hour credit. In total 318,000 single families and 605,000 couples benefit from the 30-hour credit.
Figure 4.2: Eligible childcare costs claimed (per week)
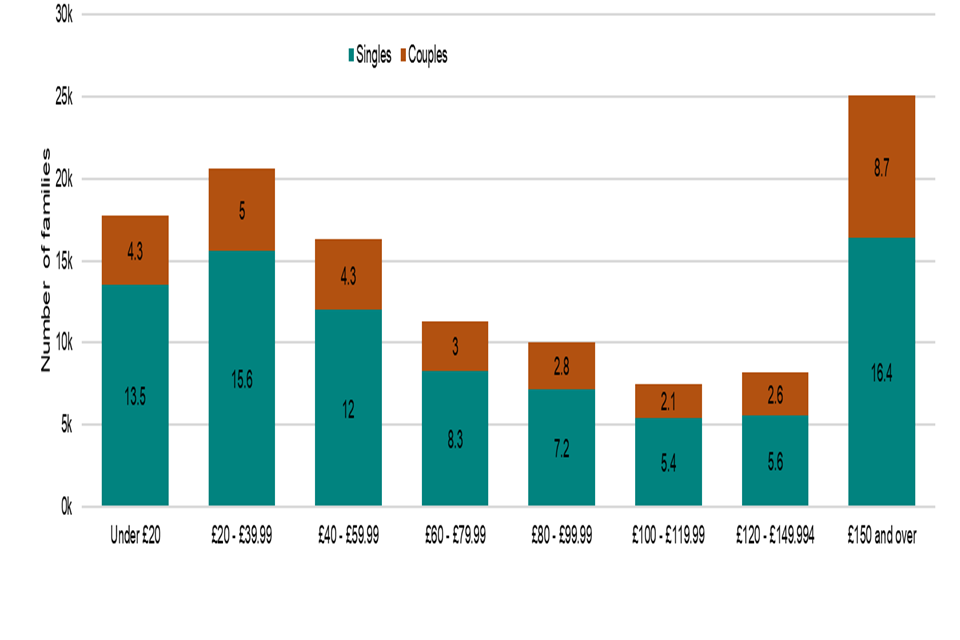
Figure 4.2 shows average weekly support with childcare costs for claimant families. The costs claimed for are split broadly across the cost bands although the largest numbers of families are claiming £150 or over per week.
Section 5: In-work Families Benefiting From Disability Elements
Section 5 focuses on families that are benefiting from the disability elements - the disabled worker element, the severely disabled adult element, the disabled child element and the severely disabled child element. There are breakdowns of the family size and the numbers of hours worked by those benefiting as well as breakdowns on overlapping disability/childcare elements.
Number of individuals benefiting from the disability elements
Headline figures
- 76,300 disabled workers benefiting from the disability elements, of which 40,100 are benefiting from the severely disabled adult element
- 164,100 disabled children benefiting from the disabled child element, of which 56,100 are benefiting from the severely disabled child element
Tables 5.1 to 5.4 provide more details on those in-work families benefiting from the four disability elements including the total number of disabled adults or children, the size of the benefiting families and the number of families also benefiting from other elements of tax credits.
Table 5.1: In-work families benefiting from the Disabled Worker Element (thousands)
| Singles With Children | Singles Without Children | Couples With Children | Couples Without Children | Total | |
|---|---|---|---|---|---|
| Total Families Benefiting[footnote 6] | 13.2 | 33.3 | 17.6 | 11.1 | 75.3 |
| Total Disabled Workers | 13.2 | 33.3 | 18.1 | 11.7 | 76.3 |
| Disabled Workers in Benefiting Families | |||||
| Sole worker [footnote 5] is disabled | 13.2 | 33.3 | 9.2 | 7.1 | 62.8 |
| Couples both working-one disabled | [no data] | [no data] | 7.9 | 3.5 | 11.4 |
| Couples both working-both disabled | [no data] | [no data] | 0.5 | 0.6 | 1.1 |
| Gender of Disabled Workers | |||||
| Female | 12.4 | 20.0 | 6.6 | 4.6 | 43.6 |
| Male | 0.8 | 13.3 | 11.5 | 7.2 | 32.8 |
| Ages of Disabled Workers | |||||
| Under 20 | [no data] | [no data] | [no data] | [no data] | [no data] |
| 20-29 | 0.6 | 2.2 | 0.6 | 0.1 | 3.4 |
| 30-39 | 4.1 | 5.2 | 5.2 | 0.3 | 14.8 |
| 40-49 | 5.7 | 7.0 | 7.5 | 1.3 | 21.5 |
| 50-59 | 2.7 | 11.9 | 4.1 | 5.1 | 23.8 |
| 60 or over | 0.2 | 6.9 | 0.7 | 5.0 | 12.9 |
| Hours Worked by Disabled Workers | |||||
| 16-23 | 7.4 | 15.6 | 6.2 | 4.5 | 33.7 |
| 24-29 | 1.2 | 3.5 | 2.2 | 1.1 | 8.0 |
| 30-34 | 2.0 | 6.6 | 2.6 | 2.4 | 13.6 |
| 35-39 | 1.9 | 5.4 | 3.9 | 1.9 | 13.1 |
| 40 or more | 0.7 | 2.2 | 3.1 | 1.9 | 7.9 |
Table 5.2: In-work families benefiting from the Disabled Child Element (thousands)
| Singles With One Disabled Child | Singles With 2+ Disabled Children | Couples With One Disabled Child | Couples With 2+ Disabled Children | Total | |
|---|---|---|---|---|---|
| Total Families Benefiting [footnote 7] | 39.1 | 2.9 | 86.3 | 15.4 | 143.7 |
| Family Size | |||||
| One Child | 16.6 | [no data] | 16.0 | [no data] | 32.6 |
| Two Children | 14.2 | 1.6 | 34.5 | 5.6 | 55.9 |
| Three Children | 6.1 | 0.9 | 22.5 | 5.4 | 34.8 |
| Four Children | 1.7 | 0.3 | 8.9 | 2.8 | 13.7 |
| Five or More Children | 0.5 | 0.1 | 4.4 | 1.7 | 6.7 |
| Also with the Childcare Element | 6.3 | 0.7 | 4.2 | 0.9 | 12.1 |
| Also with the Disabled Worker Element | 1.9 | 0.2 | 3.1 | 0.7 | 5.9 |
| Number of Disabled Children in Benefiting Families | 39.1 | 6.1 | 86.3 | 32.7 | 164.1 |
Table 5.3: In-work families benefiting from the Severely Disabled Adult Element (thousands)
| Singles With Children | Singles Without Children | Couples With Children | Couples Without Children | Total With Children | Total Without Children | Total | |
|---|---|---|---|---|---|---|---|
| Total Families Benefiting [footnote 8] | 3.2 | 8.8 | 17.3 | 10.2 | 20.5 | 19.0 | 39.5 |
| Family Size | |||||||
| No Children | [no data] | 8.8 | [no data] | 10.2 | [no data] | 19.0 | 19.0 |
| One Child | 1.9 | [no data] | 6.8 | [no data] | 8.7 | [no data] | 8.7 |
| Two Children | 1.0 | [no data] | 6.4 | [no data] | 7.4 | [no data] | 7.4 |
| Three Children | 0.2 | [no data] | 2.8 | [no data] | 3.0 | [no data] | 3.0 |
| Four Children | 0.1 | [no data] | 0.9 | [no data] | 1.0 | [no data] | 1.0 |
| Five or More Children | [no data] | [no data] | 0.4 | [no data] | 0.4 | [no data] | 0.4 |
| Hours Worked by Solo or Main Worker | |||||||
| 16-23 | 1.7 | 4.4 | 3.3 | 1.4 | 5.0 | 5.8 | 10.8 |
| 24-29 | 0.4 | 0.9 | 2.3 | 0.5 | 2.7 | 1.4 | 4.1 |
| 30-34 | 0.5 | 1.6 | 2.7 | 3.3 | 3.1 | 4.9 | 8.1 |
| 35-39 | 0.5 | 1.3 | 4.8 | 2.5 | 4.4 | 3.1 | 7.5 |
| 40 or more | 0.2 | 0.6 | 4.2 | 2.5 | 4.4 | 3.1 | 7.5 |
| Total Severely Disabled Adults in Benefiting Families | 3.2 | 8.8 | 17.5 | 10.6 | 20.7 | 19.4 | 40.1 |
| Also with Childcare Element | 0.7 | [no data] | 0.9 | [no data] | 1.6 | [no data] | 1.6 |
| Also with Disabled Worker Element | 3.2 | 8.8 | 5.5 | 4.0 | 8.7 | 12.8 | 21.5 |
Table 5.4: In-work families benefiting from the Severely Disabled Child Element (Thousands)
| Singles | Couples | Total | |||||
|---|---|---|---|---|---|---|---|
| Total Families Benefiting [footnote 9] | 12.9 | 38.7 | 51.7 | ||||
| Family Size | |||||||
| One Child | 5.1 | 6.4 | 11.5 | ||||
| Two Children | 4.7 | 15.2 | 19.9 | ||||
| Three Children | 2.3 | 10.6 | 12.9 | ||||
| Four Children | 0.6 | 4.4 | 5.0 | ||||
| Five or More Children | 0.2 | 2.2 | 2.4 | ||||
| Hours Worked by Solo or Main Worker | |||||||
| 16-23 | 6.7 | 2.6 | 9.3 | ||||
| 24-29 | 1.4 | 4.2 | 5.6 | ||||
| 30-34 | 2.2 | 5.2 | 7.3 | ||||
| 35-39 | 1.9 | 12.1 | 14.0 | ||||
| 40 or more | 0.7 | 14.7 | 15.4 | ||||
| Total Severely Disabled Children in Benefiting Families | 13.6 | 42.5 | 56.1 | ||||
| Also with Childcare Element | 2.3 | 2.0 | 4.3 | ||||
| Also with Disabled Worker Element | 0.9 | 1.6 | 2.5 |
Section 6: Annual Incomes of In-Work Recipient Families
The amount of tax credits a family receives depends on their level of income. The maximum award is reduced (known as tapered) as families move up the income distribution.
Section 6 describes the distribution of incomes used to taper awards for families in receipt. This is also broken down further in the data tables by the type of income reported – that is, whether the award is based on the family’s income from the previous year (‘PY’ income), the family’s current year income (‘CY’ income), or whether income disregards have been applied. Please see the technical note for more details on how entitlement is calculated.
Figure 6.1: Income used to taper awards: In-work recipient families
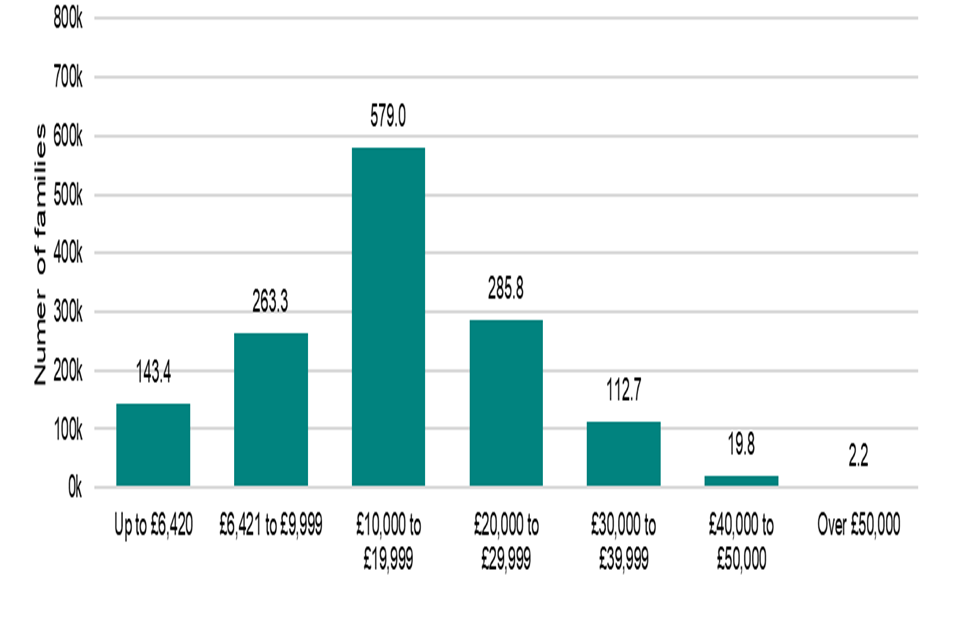
Figure 6.1 shows that the large majority of families receiving tax credits have incomes under £30,000 with the highest proportion falling within the £10,000 to £19,999 range. Awards based on an income up to £6,530 receive their maximum entitlement whereas for incomes above this amount the award is tapered (see the Child and Working Tax Credit Entitlement section for details).
Section 7: Type of Payments to In-Work Families With Children
Section 7 details the chosen payment frequency for families in receipt, broken down by family status and gender of the payee. Tax Credit recipients are able to choose whether they are paid in weekly or 4-weekly intervals.
Figure 7.1: Chosen frequency of payment: In-work families with children[footnote 10]
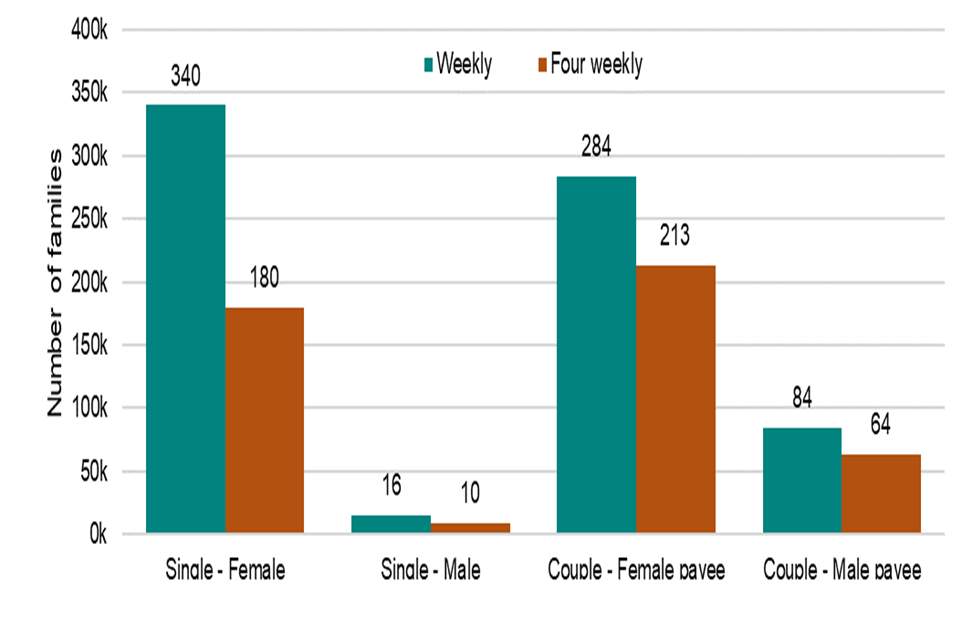
Figure 7.1 shows that families tend to choose weekly CTC payments rather than four-weekly payment cycles. The vast majority of CTC payments are paid to female claimants. Single adult families are around twice more likely to opt for weekly payments than four-weekly payments, while couples mostly opt for weekly payments, though the split is more even.
Section 8: Regional Analysis of Recipient Families
Section 8 details the numbers of families in receipt of tax credits with a regional breakdown. There are detailed breakdowns of the level of support provided in each region, the numbers of families benefiting from the childcare element as well as the disabled worker element and disabled child element.
Geographical splits at Local Authority Level, Westminster Parliamentary Constituency Level and Scottish Parliamentary Constituency Level can be found in the geographical tables.
Figure 8.1: Numbers of families claiming different types of tax credits by Country and English Region
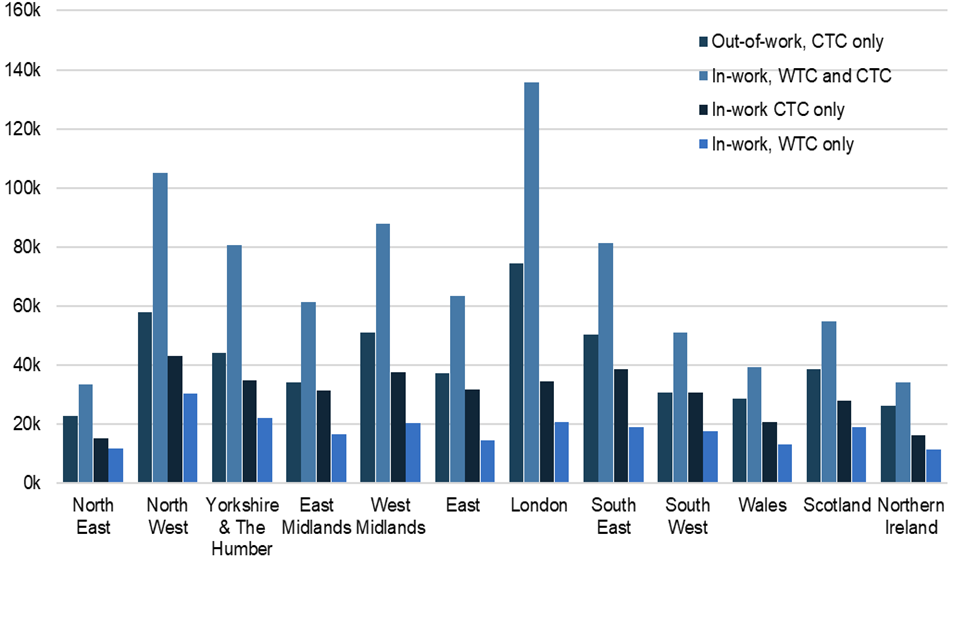
As seen in Figure 8.1 above and table 8.1 below, the region with the highest number of tax credits recipients is London, followed by the North West and then the West Midlands. The region with the lowest number of tax credits recipients is the North East of England followed by Northern Ireland.
The highest number of families on the higher awards - those receiving WTC and CTC - are from London followed by the North West. The highest number of out-of-work families in receipt are again in London followed by the North West.
This takes no account of the size of the population that are eligible for tax credits so one should be careful when drawing inferences from these results.
Table 8.1: Recipient families by profile of tax credits and by Country and English Regions (thousands)
| Country and English Region | Total Out-of-Work Families | In-Work Families With Children Receiving WTC and CTC | In-Work Families With Children Receiving CTC Only | In-Work Families With No Children Receiving WTC Only | Total In-Work Families | Total In Receipt |
|---|---|---|---|---|---|---|
| United Kingdom[footnote 11] | 496.2 | 828.3 | 362.1 | 215.8 | 1,406.2 | 1,902.4 |
| England | 402.5 | 699.4 | 297.5 | 172.3 | 1,169.1 | 1,571.7 |
| North East | 22.8 | 33.3 | 15.2 | 11.6 | 60.1 | 82.9 |
| North West | 58.0 | 105.0 | 43.0 | 30.3 | 178.3 | 236.3 |
| Yorkshire and The Humber | 44.2 | 80.6 | 34.9 | 22.0 | 137.5 | 181.8 |
| East Midlands | 34.2 | 61.4 | 31.4 | 16.5 | 109.4 | 143.5 |
| West Midlands | 50.8 | 87.8 | 37.6 | 20.3 | 145.6 | 196.4 |
| East | 37.2 | 63.5 | 31.6 | 14.5 | 109.6 | 146.8 |
| London | 74.5 | 135.6 | 34.4 | 20.5 | 190.5 | 265.0 |
| South East | 50.1 | 81.4 | 38.7 | 19.0 | 139.1 | 189.2 |
| South West | 30.6 | 50.9 | 30.7 | 17.5 | 99.0 | 129.6 |
| Wales | 28.4 | 39.1 | 20.5 | 13.2 | 72.8 | 101.2 |
| Scotland | 38.6 | 54.9 | 27.7 | 18.8 | 101.4 | 140.0 |
| Northern Ireland | 26.2 | 34.2 | 16.0 | 11.3 | 61.5 | 87.7 |
| Foreign and Not Known | 0.4 | 0.7 | 0.4 | 0.2 | 1.4 | 1.8 |
Table 8.2: Number of children in recipient families, by Country and English Regions (thousands)
| Country and English Region | Children in Out-of-Work Families | With Children Receiving WTC and CTC | With Children Receiving CTC Only | Total Children in All Tax Credit Recipient Families |
|---|---|---|---|---|
| United Kingdom[footnote 11] | 1,029.3 | 1,660.6 | 795.5 | 3,485.4 |
| England | 842.8 | 1,422.6 | 656.2 | 2,921.6 |
| North East | 47.1 | 62.4 | 32.3 | 141.8 |
| North West | 121.5 | 217.2 | 93.6 | 432.4 |
| Yorkshire and The Humber | 94.3 | 165.7 | 77.4 | 337.3 |
| East Midlands | 70.9 | 118.8 | 69.6 | 259.3 |
| West Midlands | 110.3 | 186.8 | 84.8 | 381.8 |
| East | 77.6 | 123.7 | 70.1 | 271.4 |
| London | 152.7 | 292.9 | 73.7 | 519.3 |
| South East | 104.9 | 157.6 | 85.6 | 348.0 |
| South West | 63.6 | 97.6 | 69.1 | 230.3 |
| Wales | 58.7 | 73.0 | 44.5 | 176.3 |
| Scotland | 74.1 | 97.8 | 57.6 | 229.5 |
| Northern Ireland | 52.9 | 65.8 | 36.2 | 154.9 |
| Foreign and Not Known | 0.7 | 1.4 | 1.0 | 3.1 |
A National Statistics Publication
National Statistics are produced to high professional standards as set out in the Code of Practice for Official Statistics. They undergo regular quality assurance reviews to ensure that they meet customer needs. They are produced free from any political interference.
The United Kingdom Statistics Authority has designated these statistics as National Statistics, in accordance with the Statistics and Registration Service Act 2007 and signifying compliance with the Code of Practice for Official Statistics
Designation can be broadly interpreted to mean that the statistics:
- meet identified user needs
- are well explained and readily accessible
- are produced according to sound methods
- are managed impartially and objectively in the public interest
- are produced to the highest standard, ensuring that data confidentiality has been maintained
Once statistics have been designated as National Statistics it is a statutory requirement that the Code of Practice shall continue to be observed.
For general enquiries about National Statistics, contact the National Statistics Public Enquiry Service on:
Tel: 0845 601 3034
Overseas: +44 (01633) 653 599
Minicom: 01633 812 399
E-mail: info@statistics.gov.uk
Fax: 01633 652 747
Letter: Customer Contact Centre, Room 1.101, Government Buildings, Cardiff Road, Newport, South Wales, NP10 8XG.
You can find National Statistics on the Research and statistics page of gov.uk.
National Statistics Review
A formal review of our National and Official Statistics publications was held between May and August 2011. Over 130 responses were received from a broad range of users. A report summarising the responses received from the review of tax credit statistics has been published on GOV.UK. The Office for Statistics Regulation conducted a compliance check of child and working tax credit statistics in 2021. A letter summarising their findings and recommendations can be found on the Office for Statistics Regulation website.
Appendix A: Technical Note
Current entitlement
There is a single entitlement calculation covering both Child and Working Tax Credit, and covers the income and other circumstances of both partners where there are two adults in the family.
Awards run to the end of the tax year, and are based on the element values, thresholds, etc. shown at Appendix B.
An annual award is calculated by summing the various elements to which the family is entitled.
Unless the family is receiving Income Support, income-based Jobseeker’s Allowance, income-based Employment and Support Allowance or Pension Credit (Guarantee Credit), this sum is reduced if the family’s annual income (see below) exceeds the relevant income threshold. The reduction is 41 per cent of the excess over the threshold.
For 2020 to 2021 awards, the initial calculation of a family’s entitlement is based on its relevant income in 2019 to 2020 after those awards were finalised[footnote 12].
Relevant income comprises gross annual taxable income from social security benefits (except pensions) and from employment or self-employment, less pension contributions; plus annual income from savings, property, state and private pensions and other sources (but excluding maintenance) in excess of £300.
For claims by couples, entitlement is based on their joint annual income.
Final entitlement for 2020 to 2021 will be based on 2020 to 2021 income if that is more than £2,500 lower than the income in 2019 to 2020, or exceeds it by more than £2,500. However, the first £2,500 of a fall in income or the first £2,500 rise in income in 2020 to 2021 is disregarded in calculating the tax credit due for that year.
The family can report an estimate of its income in 2020 to 2021 at any time, and the award will be recalculated using this income.
After the end of the year, the award is finalised when the 2020 to 2021 income is known.
Changes of circumstance
A family’s circumstances (such as number of children, hours worked, childcare costs, and disabilities) can change within the year. To calculate the annual award, the year is then split into the periods between which the family’s circumstances changed.
Entitlement is calculated for each period, based on the annual values shown in Appendix B but scaled down to the number of days in the period. The rate of entitlement attributed to each case for this publication is that for the period spanning the reference date.
Data sources
The estimates in the tables for in-work families are based on data from a random sample of families with awards at the reference date, extracted from the tax credits computer system on that date. The estimates for out-of-work families with children receiving tax credits are based a random sample from the HM Revenue and Customs system taken at 2 April 2021.
The out-of-work families receiving their child support via Department for Work and Pensions (DWP) are based on matched benefit and tax credits data, calibrated to total estimates of the population made by the DWP. The out-of-work families’ claimants’ size in Table 2.1 is the combination of estimate for CTC equivalent paid by DWP plus the estimate for out-of- work families receiving CTC at the extraction date.
For both in-work and out-of-work families, weights were given to the sample to gross the total to derive the estimates. Details of weighting is provided in Appendix B.
Appendix B: Sampling Method and Sampling Error
The tables are based on a random sample of families receiving CTC or WTC at the reference date. The sample comprises 10 per cent of such single adults (with or without children) and 20 per cent of such couples. Each figure in the tables is derived by weighting the relevant sample cases by the inverses of these sampling fractions[footnote 13].
The figures in the tables are, therefore, estimates, but we know how accurate they are. For example, suppose that there are 100,000 couples with a characteristic. This number is not known, and we are to estimate it via the sample. Each couple is sampled with a chance of 0.2.
Statistical theory says that there is a 95 per cent chance that the number sampled will lie between 19,752 and 20,248, and that the resulting estimate will lie between 98,760 and 101,240.
At least approximately, then, where an estimate of 100,000 is derived from the sample, the true figure lies between these figures, with a 95 per cent probability. That is, the “95 per cent confidence interval” for the estimate is the estimate itself plus or minus 1,240.
The width of the confidence interval varies with the size of the estimate and the sampling fraction, as shown in the table below. For estimates that comprise a mixture of couples and single adults, the figures will lie between the two sets shown, according to the mix.
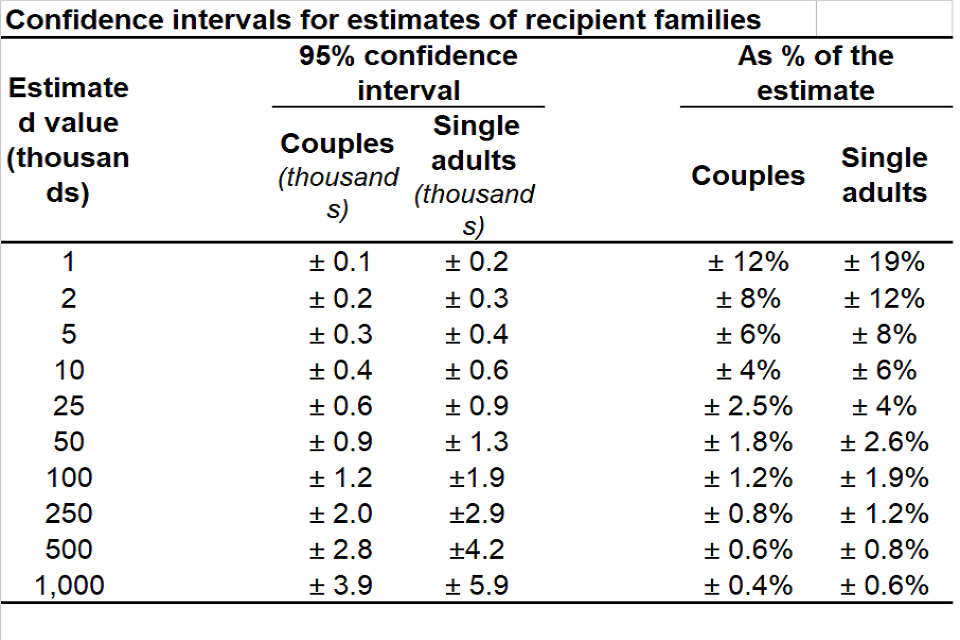
Sampling uncertainty
As the figures are based on a sample, therefore they are subject to sampling uncertainty. Figures based on too small a number of cases are shown as “-“.
Appendix C: Annual Entitlement (£) by Tax Credit Elements and Thresholds
| 2016-17 | 2017-18 | 2018-19 | 2019-20 | 2020-21 | |||||||
|---|---|---|---|---|---|---|---|---|---|---|---|
| Child Tax Credit | |||||||||||
| Family element | 545 | 545 | 545 | 545 | 545 | ||||||
| Family element, baby addition[footnote 14] | - | - | - | - | - | ||||||
| Child element[footnote 15] | 2,780 | 2,780 | 2,780 | 2,780 | 2,830 | ||||||
| Disabled child additional element[footnote 16] | 3,140 | 3,175 | 3,355 | 3,355 | 3,415 | ||||||
| Severely disabled child element[footnote 17] | 1,275 | 1,290 | 1,360 | 1,360 | 1,385 | ||||||
| Working Tax Credit | |||||||||||
| Basic element | 1,960 | 1,960 | 1,960 | 1,960 | 3,040 | ||||||
| Couples and lone parent element | 2,010 | 2,010 | 2,010 | 2,010 | 2,045 | ||||||
| 30 hour element[footnote 18] | 810 | 810 | 810 | 810 | 825 | ||||||
| Disabled worker element | 2,970 | 3,000 | 3,165 | 3,165 | 3,220 | ||||||
| Severely disabled adult element | 1,275 | 1,290 | 1,365 | 1,365 | 1,390 | ||||||
| 50+ return to work payment[footnote 19]:16 but less than 30 hours per week | - | - | - | - | - | ||||||
| 50+ return to work payment: at least 30 hours per week | - | - | - | - | - | ||||||
| Childcare element: Maximum eligible costs allowed (£ per week) | |||||||||||
| Eligible costs incurred for 1 child | 175 | 175 | 175 | 175 | 175 | ||||||
| Eligible costs incurred for 2+ children | 300 | 300 | 300 | 300 | 300 | ||||||
| Percentage of eligible costs covered | 70% | 70% | 70% | 70% | 70% | ||||||
| Common features | |||||||||||
| First income threshold[footnote 20] | 6,420 | 6,420 | 6,420 | 6,420 | 6,530 | ||||||
| First withdrawal rate | 41% | 41% | 41% | 41% | 41% | ||||||
| Second income threshold[footnote 21] | - | - | - | - | - | ||||||
| Second withdrawal rate | - | - | - | - | - | ||||||
| First income threshold for those entitled to Child Tax Credit only[footnote 22] | 16,105 | 16,105 | 16,105 | 16,105 | 16,385 | ||||||
| Income increase disregard[footnote 23] | 2,500 | 2,500 | 2,500 | 2,500 | 2,500 | ||||||
| Income fall disregard[footnote 23] | 2,500 | 2,500 | 2,500 | 2,500 | 2,500 | ||||||
| Minimum award payable | 26 | 26 | 26 | 26 | 26 |
-
Where the award is not reduced through tapering, either because the family receives out-of-work benefits, or because the annual income is below the relevant first threshold. See Appendix A. ↩ ↩2 ↩3
-
Not tapered. ↩
-
Includes almost 17,000 families (over 6,900 couples and over 9,700 singles) where the WTC entitlement is less than or equal to the childcare element and is therefore paid together with CTC. ↩
-
Includes all children or qualifying young people in families receiving tax credits. This may not be equal to the number of children for whom the family is receiving the child element of CTC due to the policy to provide support for a maximum of two children, affecting children born after 6 April 2017 unless they are covered by an exception. ↩
-
‘Worker’ is defined here as an adult working for a minimum of 16 hours per week. ↩ ↩2
-
Those claiming the disabled worker element who (a) have children and have a positive award, or (b) have no children and have a positive WTC award. Disabled workers includes those who are severely disabled and who are also included in Table 5.3. ↩
-
Those with the disabled child element and with a positive award. Disabled children includes those who are severely disabled and included in Table 5.4. ↩
-
Those with the severely disabled adult element who (a) have children and have a positive award, or (b) have no children and have a positive WTC award. ↩
-
Those with the severely disabled child element and with a positive award. ↩
-
Cases where the frequency of payment is unknown are not included in the graph. ↩
-
Includes foreign and not known. “Foreign and not known” consists of a small proportion of recipient families and children who do not live within England, Scotland, Northern Island or Wales. They may, for instance, be a Crown servant posted overseas, or living in a British Crown Dependency. Due to the small size of this population, we combine them into one group which also consists of those whom, at the time of publication, either have a UK postcode that does not match to a Government Office Region code, or do not have a postcode in the available data. ↩ ↩2
-
Although most new claims for tax credits ended in January 2019, a small number of claimants continued to make new claims during 2020 to 2021 and in those cases, the 2019 to 2020 income will be taken from their claim form. ↩
-
Each case is further weighted so that the overall total equals an independent count of families with awards. ↩
-
Payable to families for any period during which they have one or more children aged under one. Abolished 6 April 2011. ↩
-
Payable for each child up to 31 August after their 16th birthday, and for each young person for any period in which they are aged under 20 (under 19 until 2005 to 2006) and in full-time non-advanced education, or under 19 and in their first 20 weeks of registration with the Careers service or Connexions. ↩
-
Payable in addition to the child element for each disabled child. ↩
-
Payable in addition to the disabled child element for each severely disabled child. ↩
-
Payable for any period during which normal hours worked (for a couple, summed over the two partners) is at least 30 per week. ↩
-
Payable for each qualifying adult for the first 12 months following a return to work. Abolished 6 April 2012. ↩
-
Income is net of pension contributions, and excludes Child Benefit, Housing benefit, Council tax benefit, maintenance and the first £300 of family income other than from work or benefits. The award is reduced by the excess of income over the first threshold, multiplied by the first withdrawal rate. ↩
-
For those entitled to the CTC, the award is reduced only down to the family element, plus the baby addition where relevant, less the excess of income over the second threshold multiplied by the second withdrawal rate. Abolished effective 6 April 2012. ↩
-
Those also receiving Income Support, income-based Jobseeker’s Allowance or Pension Credit are passported to maximum CTC with no tapering. ↩
-
Introduced from 6 April 2012, this drop in income is disregarded in the calculation of tax credit awards. ↩ ↩2