Proceeds of crime recovered
Updated 15 September 2026
Applies to England, Northern Ireland and Wales

© Crown copyright 2026
This publication is licensed under the terms of the Open Government Licence v3.0 except where otherwise stated. To view this licence, visit nationalarchives.gov.uk/doc/open-government-licence/version/3 or write to the Information Policy Team, The National Archives, Kew, London TW9 4DU, or email: psi@nationalarchives.gov.uk.
Where we have identified any third party copyright information you will need to obtain permission from the copyright holders concerned.
This publication is available at https://www.gov.uk/government/statistics/asset-recovery-statistics-financial-years-ending-2021-to-2026/proceeds-of-crime-recovered
Asset recovery is the process of depriving criminals of the proceeds of their offending and preventing them from benefiting from criminal conduct. A range of powers are available under the Proceeds of Crime Act 2002 (POCA) to restrain, recover and confiscate criminal assets.
Part 2 of POCA makes provision for the confiscation of a person’s benefit from criminal conduct, following a criminal conviction. Part 2 also provides powers to restrain, seize and detain property from criminal conduct following a criminal conviction to prevent the individual from dissipating assets.
Part 5 of POCA makes provisions for the forfeiture of certain assets (cash, monies in relevant accounts, listed assets or cryptoassets) that are determined to be, or to represent property obtained through, or intended for use in unlawful conduct, without a criminal conviction. If the relevant statutory conditions are satisfied the Magistrates’ Court will authorise the seizure and forfeiture of assets. Part 5 also enables the recovery of property via high court proceedings.
This section provides statistics on the value recovered through criminal confiscation, forfeiture and civil recovery, specifically:
- Confiscation order receipts
- Forfeiture order receipts
- Civil recovery
- Compensation to victims
1. Assets recovered by confiscation order receipts
1.1 Value of confiscation order receipts
The measure for the volume of confiscation orders in which the proceeds of crime have been recovered is not reported in this release due to limitations with JARD data. Further information on this is available in the User guide to Asset recovery statistics.
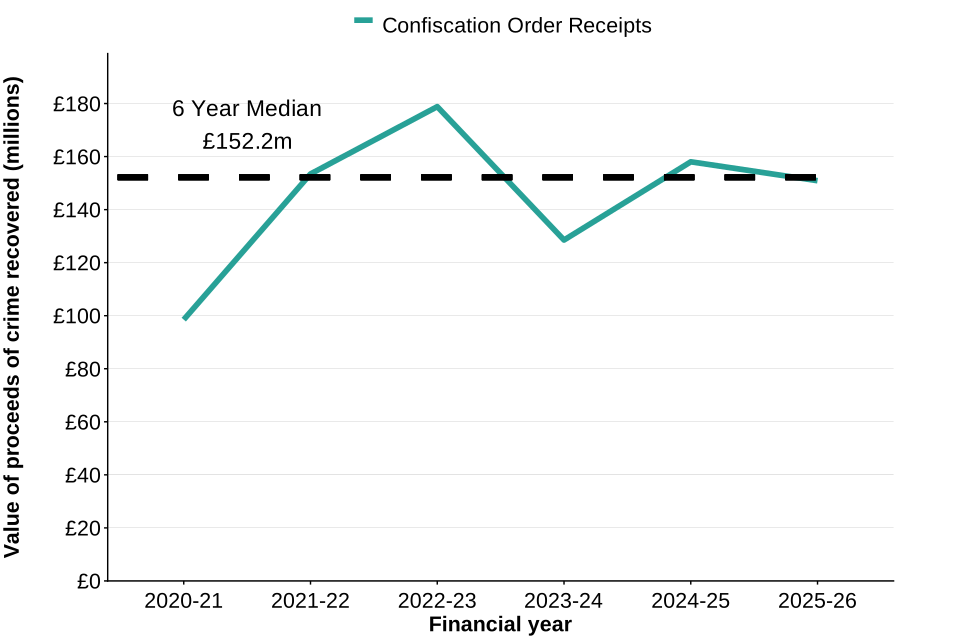
There was £150.9 million recovered from confiscation order receipts in the financial year ending March 2026, a 5% decrease from £158.0 million recovered in the previous financial year and 1% below the 6-year median of £152.2 million. This decrease was primarily driven by lower receipts from local police-led confiscation orders, following exceptionally high receipts recorded in the financial year ending March 2025.
Figure 1: The value of confiscation order receipts from financial year ending March 2021 until financial year ending March 2026, in England and Wales and Northern Ireland
Source: JARD
Notes:
- Figure 1 shows the value of the proceeds of crime recovered (paid against confiscation order impositions) from the defendant following the end of criminal proceedings. It includes payments received from the defendant, or through successful enforcement activity, on any outstanding confiscation orders which means it can include payments linked to a confiscation order imposition in the current financial year and previous ones.
As shown in figure 1, confiscation order receipts were lowest in the financial year ending March 2021. The introduction of COVID-19 restrictions during this period had a negative impact on the wider criminal justice system, including investigation, prosecution and conviction activity, which in turn affected confiscation order impositions and receipts.
Following a low in the financial year ending March 2021, confiscation order receipts increased to £178.8 million, the highest amount in this 6-year period, in the financial year ending March 2023, driven by £94.5 million in high-value cases. Receipts then fell to £128.5 million in the financial year ending March 2024, before recovering to £158.0 million in the financial year ending March 2025. In the financial year ending March 2026, receipts decreased slightly to £150.9 million, primarily due to lower receipts from local police-led confiscation orders.
1.2 Confiscation order receipts’ value by agency sector
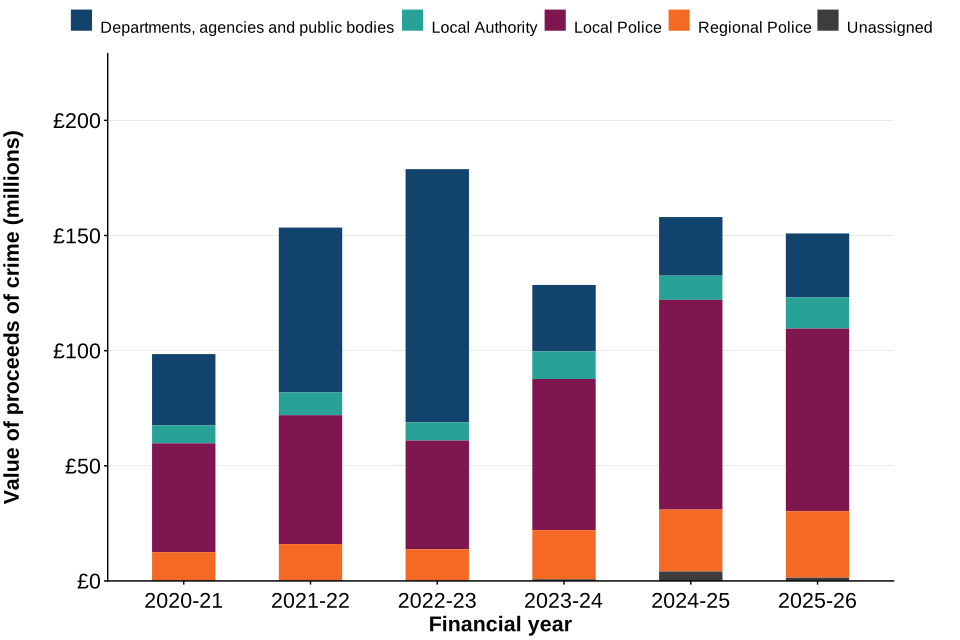
In the financial year ending March 2026, local police contributed £79.3 million in confiscation order receipts, accounting for 53% of the total value recovered through confiscation order receipts. This represented a 13% decrease compared with the previous financial year (£91.1 million). In contrast, receipts recovered by departments, agencies and public bodies increased by 9%, from £25.5 million to £27.8 million. Regional police accounted for the second-highest value of receipts, contributing £28.9 million, an increase of 7% compared with the previous financial year (£26.9 million). Local authorities contributed £13.5 million, up 28% from the previous financial year (£10.5 million).
Figure 2: The value of confiscation order receipts from financial year ending March 2021 until financial year ending March 2026, in England and Wales and Northern Ireland, by agency sector
Source: JARD
Notes:
- Figure 2 shows the value of the proceeds of crime recovered (paid against confiscation order impositions) from the defendant following the end of criminal proceedings. It includes payments received from the defendant, or through successful enforcement activity, on any outstanding confiscation orders which means it can include payments linked to a confiscation order imposition in the current financial year and previous ones.
Over the last 6 financial years, local police forces have contributed the largest share of the total value recovered, accounting for 45% of the total £868.3 million recovered, across the 6 financial year period.
Departments, agencies and public bodies have seen volatile performance over the 6-year period, with performance spiking in the financial years ending March 2022 and 2023, primarily due to an influx in high-value cases. The value fell in subsequent years as the number of high-value cases also decreased.
Regional police recovered £28.9 million in the financial year ending March 2026, an increase of 7% compared with the previous financial year and the highest value recovered during the 6-year reporting period.
The value of confiscation order receipts recovered by local authorities has increased, up 28% from £10.5 million recovered in the financial year ending March 2025 to £13.5 million in the latest financial year.
1.3 Confiscation order receipts’ value by primary offence type
The value of confiscation order receipts varied across offence groups in the financial year ending March 2026. Receipts relating to money laundering and offences categorised under the ‘other’ offence group increased compared with the previous financial year, whereas receipts associated with drugs, fraud, modern slavery and theft declined.
Drug offences:
- drug offences confiscation order receipts totalled £67.1 million in the financial year ending March 2026, broadly in line with the previous financial year (£67.7 million)
- drug offences confiscation order receipts were the main contributor amongst the offence types and accounted for 44% of total confiscation order receipts recovered in financial year ending March 2026
- local police forces contributed the majority of drug offences receipts during this period, being responsible for 70% (£46.9 million) of the receipts recovered relating to drug offences
Fraud offences:
- fraud offences confiscation order receipts totalled £34.5 million in the financial year ending March 2026, a decrease of 32% compared with the previous financial year (£50.4 million)
- the value was slightly above the 6-year low of £34.3 million recorded in the financial year ending March 2024
- this decrease was primarily driven by lower receipts from local police and departments, agencies and public bodies, whose fraud offences receipts fell by 41% and 37% respectively compared with the previous financial year
Theft offences:
- theft offences confiscation order receipts saw a decrease (down 78% from £18.5 million to £4.1 million) compared to previous year and down 20% from the 6-year median of £5.1 million
- this decrease was largely attributable to an exceptional high-value theft case in the financial year ending March 2025, when receipts increased from £3.7 million to £13.8 million
Money laundering offences:
- money laundering offences confiscation order receipts more than tripled compared to the previous year (up from £9.6 million to £33.2 million)
- this increase was primarily driven by higher receipts recovered by departments, agencies and public bodies, which increased by 197% from £3.3 million to £9.9 million, and local police, whose receipts increased by 191% from £5.1 million to £14.8 million compared with the previous financial year
1.4 Confiscation order receipts’ value by high-value (£1 million +) and low-value cases (< £1 million)
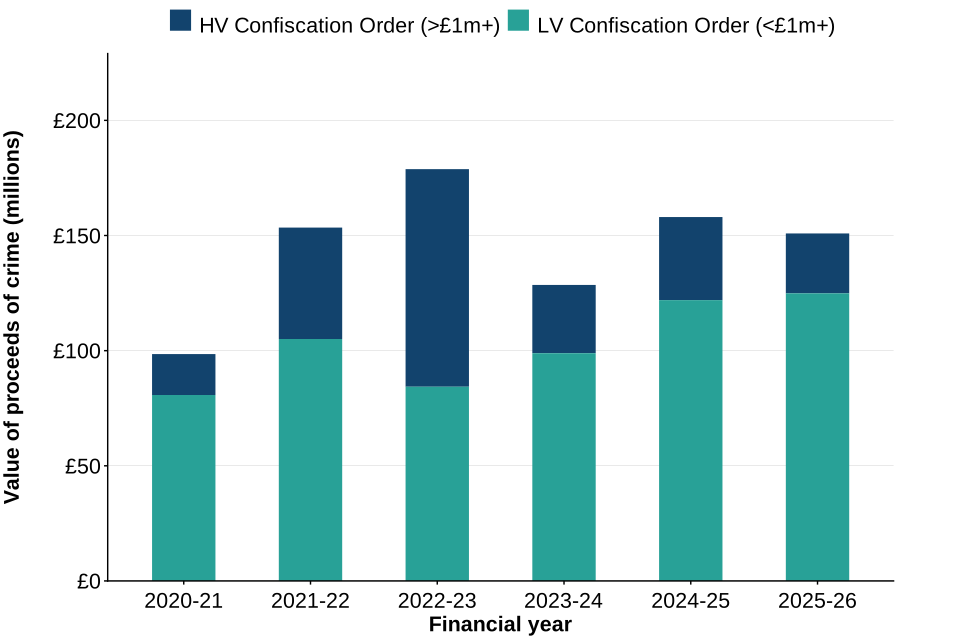
As shown in figure 3, the financial year ending March 2026 saw a 28% decrease in high-value receipts, from £36.1 million to £26.0 million.
When assessing low-value receipts, performance has increased by 2% compared to previous year (from £121.9 million to £124.9 million). Local police remained the dominant contributor, accounting for just over half (53%) of the total value of low-value receipts. Regional police contributed £28.9 million (23% of the total), representing a 7% increase compared with the previous financial year (£26.9 million) and the highest value recorded during the 6-year reporting period.
Figure 3: The value of confiscation order receipts from financial year ending March 2021 until financial year ending March 2026, in England and Wales and Northern Ireland, split by high-value (£1 million +) and low-value cases (< £1 million)
Source: JARD
Notes:
- Figure 3 shows the value of the proceeds of crime recovered (paid against confiscation order impositions) from the defendant following the end of criminal proceedings. It includes payments received from the defendant, or through successful enforcement activity, on any outstanding confiscation orders which means it can include payments linked to a confiscation order imposition in the current financial year and previous ones.
Further information on the value recovered from confiscation orders is available in tables 2, 6, 9, 18 and 21 of the Asset recovery statistics, financial years ending 2021 to 2026: data tables.
2. Assets recovered by forfeiture order receipts
2.1 Value of forfeiture order receipts
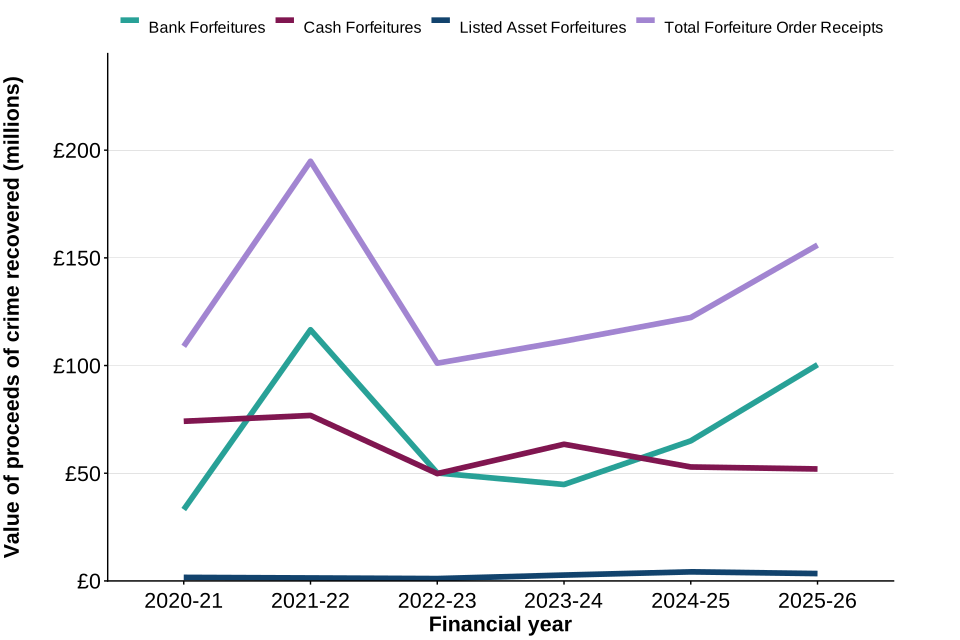
In the financial year ending March 2026, £155.9 million was recovered under forfeiture orders, which is an increase of 28% from £122.3 million in the previous financial year.
Of these:
- £52.0 million (33%) was from cash forfeitures, compared to £52.9 million (43%) in the previous financial year
- £100.4 million (64%) was from bank forfeitures compared to £65.0 million (53%) the previous year
- £3.4 million (2%) was recovered from listed assets compared to £4.2 million (3%) the previous year
In the financial year ending March 2021, forfeiture recoveries were primarily driven by cash forfeitures. However, from the financial year ending March 2022 onwards, bank account forfeitures became the principal driver of forfeiture recoveries in most years. Whilst cash forfeitures briefly regained prominence in the financial year ending March 2024, bank account forfeitures once again accounted for the largest share of recoveries in the financial years ending March 2025 and March 2026, contributing £65.0 million and £100.4 million respectively.
Figure 4: The value of forfeiture order receipts (total and sub-types) from the financial year ending March 2021 until financial year ending March 2026, in England and Wales and Northern Ireland
Source: JARD
Notes:
- Data presented in figure 4 shows the proceeds of crime recovered at the end of an investigation from the respondent. It includes the proceeds of crime recovered on any outstanding forfeiture order which means the proceeds recovered could be linked to a seizure from a previous financial year.
- These powers can only be used where assets or the proceeds of crime are worth more than the prescribed minimum amount of £1,000.
- Note that the total sum for forfeiture order receipts by sub-type includes seizures where the sub-type was not recorded or specified on JARD.
- Note that the value captured for forfeiture order receipts is based on the original order amount due to data entry issues on JARD.
As shown in figure 4, from the financial year ending March 2021 the value of forfeiture order receipts increased sharply to a peak in March 2022 (£194.8 million recovered). Despite the value of forfeiture order receipts experiencing a sharp decline to £101.1 million in the financial year ending March 2023, the value of receipts had begun to steadily rise to £155.9 million in the latest financial year.
Cash forfeitures saw a 2% decrease in value compared with the previous financial year. In contrast, bank forfeitures saw a 54% increase in value which can partly be attributed to an increase in high-value bank forfeitures (up 140% from £13.9 million to £33.3 million), and also an increase in volume of low-value cases (up 33% from 1,118 to 1,489 cases).
2.2 Volume of forfeiture orders
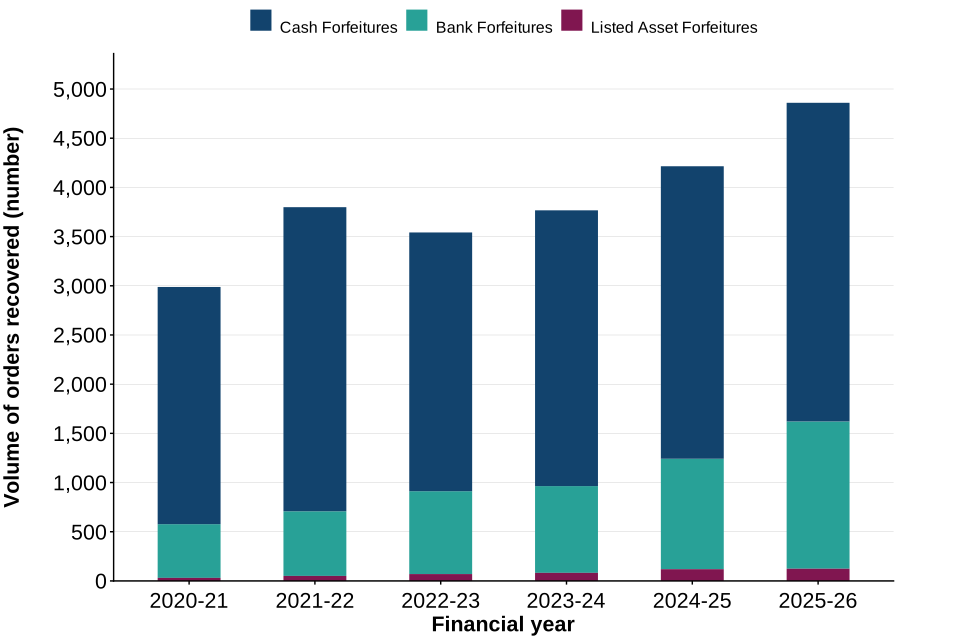
There were 4,859 forfeiture orders granted in the financial year ending March 2026, representing an increase of 15% from 4,214 in the previous financial year.
Of these:
- 3,239 orders (67%) were cash forfeitures, compared with 2,973 orders (70%) in the previous financial year
- 1,497 orders (31%) were bank forfeitures, compared with 1,123 (27%) in the previous financial year
- 123 orders (3%) were listed asset orders, compared with 118 (3%) in the previous financial year
Figure 5: The volumes of forfeiture order receipts by sub-types from the financial year ending March 2021 until financial year ending March 2026, in England and Wales and Northern Ireland
Source: JARD
Notes:
- Data presented in figure 5 shows volume of the proceeds of crime recovered at the end of an investigation from the respondent. It includes the proceeds of crime recovered on any outstanding forfeiture order, which means the proceeds recovered could be linked to a seizure from a previous financial year.
- These powers can only be used where assets or the proceeds of crime are worth more than the prescribed minimum amount currently set at £1,000.
- Note that the total sum for forfeiture order receipts by sub-type includes seizures where the sub-type was not recorded or specified on JARD.
As figure 5 shows, there has been a general increase in the number of forfeiture orders over the last 6 financial years, with some fluctuation including a spike in the financial year ending March 2022 (3,799 forfeiture orders). Volumes in the latest financial year were up 15% from the previous financial year and reached a 6-year high at 4,859 orders.
Cash forfeitures have remained the most prominent forfeiture order sub-type over the last 6 financial years. Compared to the previous year, the number of cash forfeitures orders granted have risen by 9% (from 2,973 to 3,239 orders) and encompassed 67% of total volume of forfeiture orders for the latest year.
Additionally, there has been an increase in the number of bank account forfeiture orders, up 33% compared to the previous year from 1,123 to 1,497 orders, reaching a 6-year high.
Listed assets also saw an increase in volume of orders, up 4% from 118 to 123 orders, also reaching a 6-year high.
2.3 Forfeiture order receipts’ value by agency sector
In the financial year ending March 2026:
- forfeiture order receipts from local police forces totalled £79.0 million, accounting for 51% of total value of forfeiture order receipts
- departments, agencies and public bodies contributed £65.9 million (42%) in financial year ending March 2026, up 106% compared to the previous year and up 53% compared to the 6-year median of £43.0 million
- regional police forces contributed £9.8 million (6%) to forfeiture order receipts in the latest financial year, rising by 10% compared to the previous year’s peak of £8.9 million
- local authorities contributed £1.3 million in the latest financial year, rising by 294% compared to the previous year’s peak of £325,000, reaching a 6-year high, and up 323% compared to the 6-year median of £302,000
2.4 Forfeiture order receipts by primary offence type
Money laundering offences:
- money laundering offences have remained the most prominent primary offence type for forfeiture orders over the last 6 financial years, accounting for £447.8 million (56%) of the £794.4 million total value of forfeiture order receipts over the 6 financial-year period
- in the financial year ending March 2026, money laundering offences contributed £80.9 million, an 11% increase compared to the previous financial year and was driven by local police forces who contributed £47.5 million (59%) of receipts
- money laundering offences also saw a large increase (23%) in the volume of forfeiture orders from 1,275 in the previous financial year to 1,565, reaching a 6 financial year high
Drug offences:
- drug offences have been the most prominent offence type in terms of volume over the last 6 financial years, accounting for 51% of the total volume of forfeiture orders over the 6 financial-year period
- drug offences contributed £22.6 million in forfeiture recoveries in the financial year ending March 2026, a decrease of 14% from £26.4 million in the previous financial year
- despite this decline, drug offences were the third-largest offence group by value after money laundering and fraud, accounting for 15% of the total value recovered through forfeiture powers
- in the same period, there were 2,052 drug offences forfeiture orders, accounting for 43% of total forfeiture volumes
Fraud offences:
- fraud offences contributed £39.0 million in forfeiture recoveries in the financial year ending March 2026, accounting for 25% of the total value recovered through forfeiture powers
- this represents a substantial increase of 167% compared with the previous financial year (£14.6 million) and is the highest value recorded for fraud forfeitures during the 6-year reporting period
- this was led by departments, agencies and public bodies which contributed 84% (£32.7 million) of the total value of fraud offences receipts for the most recent year
2.5 Forfeiture orders by high-value (£1 million +) and low-value cases (< £1 million)
As shown in figure 6, the financial year ending March 2026 saw a 94% increase in high-value receipts, from £18.4 million to £35.7 million. The majority of the high-value cases were led by departments, agencies and public bodies which contributed 95% (£33.9 million) of the total high-value receipts for that period.
Figure 6: The value of forfeiture order receipts from financial year ending March 2021 until financial year ending March 2026, in England and Wales and Northern Ireland, split by high-value (£1 million +) and low-value cases (< £1 million)

Source: JARD
Notes:
- Data presented in figure 6 shows the proceeds of crime recovered at the end of an investigation from the respondent. It includes the proceeds of crime recovered on any outstanding forfeiture order which means the proceeds recovered could be linked to a seizure from a previous financial year.
- These powers can only be used where assets or the proceeds of crime are worth more than the prescribed minimum amount currently set at £1,000.
- Note that the value captured for forfeiture order receipts is based on the original order amount due to data entry issues on JARD.
When assessing low-value forfeiture orders, performance has increased by 16% compared to previous year (from £103.9 million to £120.2 million), reaching a 6-year high. This was also primarily driven by local police, contributing 64% (£77.2 million) of the total low-value receipts.
Over the 6-year reporting period, high-value forfeiture order receipts totalled £203.1 million, while low-value forfeiture order receipts totalled £591.3 million.
Further information on the value and volume recovered from forfeiture orders is available in tables 4, 8, 9, 18 and 23 of the Asset recovery statistics, financial years ending 2021 to 2026: data tables.
3. Civil recovery powers
3.1 Civil freezing orders and unexplained wealth orders (UWOs)
A UWO is an investigative power that was introduced as part of the Criminal Finances Act 2017 amendments to POCA powers. If an individual or company subject to a UWO does not provide the information sought, without a reasonable excuse, then there is a statutory presumption that the property in question is recoverable property, and it could result in the applicant for the UWO proceedings obtaining a civil recovery order. An interim freezing order (IFO) can also be applied for alongside a UWO to prevent property being dissipated during the proceedings. Separately, property freezing orders (PFO) may be obtained in civil recovery investigations to prevent property from being dealt with pending the outcome of proceedings. Statistics on IFOs and PFOs are now included within this statistical release.
This section provides a summary of the statistics on the value of proceeds of crime investigated through unexplained wealth orders (UWOs), the volume and value of IFOs and PFOs, and the value of proceeds of crime recovered through civil recovery orders.
3.2 Key notes on using these statistics
A UWO is an investigative power and not all proceeds of crime recovered by civil recovery receipts will have been subject to a UWO earlier in the process. Users should be cautious when making comparisons between the data reported for UWOs and civil recovery receipts for this reason.
Volume and agency statistics have not been provided for civil recovery order receipts because there is no available data. Further information on data quality, methodology and the legislative background of the civil system process for proceeds of crime under POCA can be found in the User guide to Asset recovery statistics.
3.3 Value investigated under UWOs and frozen under civil freezing orders
Based on data provided by the National Economic Crime Centre (NECC) in April 2026, £451.5 million was investigated under UWOs in the financial year ending March 2026. This represents a substantial increase compared with the previous financial year, when £1.8 million was investigated.
The value of proceeds of crime frozen through IFOs was £431.7 million, compared with zero in the previous financial year. The value frozen through PFOs increased from £52.2 million to £182.7 million over the same period.
The Home Office annual UWO report is a statutory requirement under the Economic Crime (Transparency and Enforcement) Act 2022 to report annually on the number of UWOs obtained for and applied each year. The report will be published separately to the annual statistical bulletin every September.
3.4 Value of receipts recovered from civil recovery orders
Data presented on civil recovery order receipts is provided by the National Crime Agency (NCA). These statistics are considered as “official statistics in development” due to the quality of the administrative dataset which has been used in their production. For further information on official statistics in development and data quality issues please refer to the accompanying User guide to Asset recovery statistics.
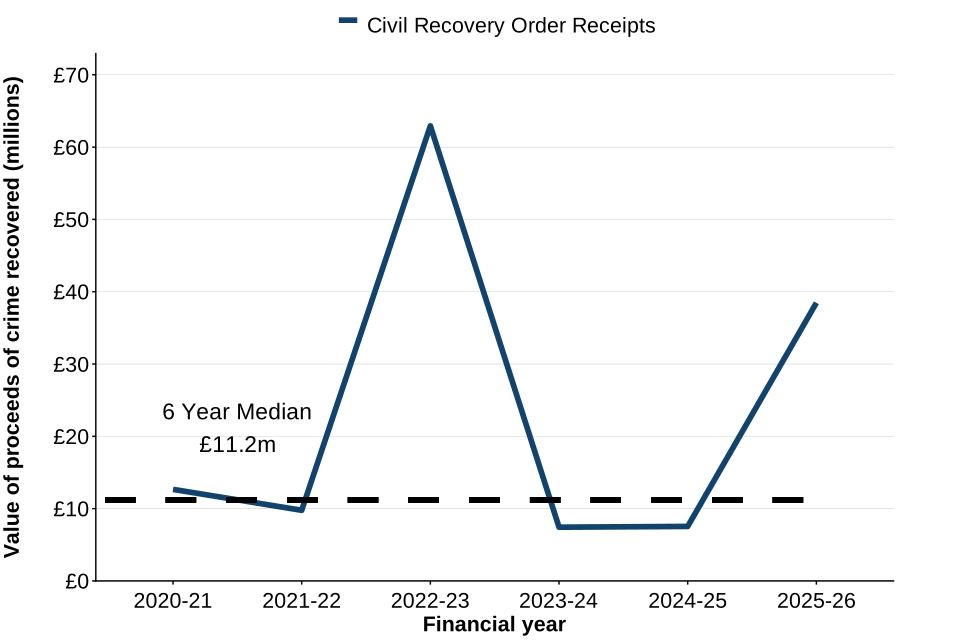
In the financial year ending March 2026, £38.5 million was recovered under civil recovery orders, over 5 times the value recovered in the previous financial year (£7.5 million) and more than triple the median value recorded across the last 6 financial years (£11.2 million).
Figure 7: The value of proceeds of crime recovered through civil recovery order receipts from the financial year ending March 2021 until financial year ending March 2026, in England and Wales and Northern Ireland
Source: NCA
Notes:
- Data presented in figure 7 shows the proceeds of crime recovered from any civil recovery orders granted in England, Wales or Northern Ireland. These amounts can include receipts linked to orders made in a previous financial year.
As shown in figure 7, the value of civil recovery order receipts fluctuated greatly between the financial years ending March 2021 and March 2025, with a substantial increase in the financial year ending March 2023. In the financial year ending March 2026, receipts increased again to £38.5 million, more than triple the 6-year median value (£11.2 million). The spike in receipts in the financial year ending March 2023 was largely explained by one high-value operation processed by the NCA, which obtained a civil recovery order worth £53.9 million linked to the recovery of funds held in bank accounts that had been suspended due to suspected fraud. Excluding the £53.9 million civil recovery order as an outlier, the median value over the period shown was £9.8 million, meaning receipts in the financial year ending March 2026 were almost 4 times higher than a typical year over the series.
Further information on civil recovery is available in table 5 of the Asset recovery statistics, financial years ending 2021 to 2026: data tables.
4. Compensation to victims
The compensation figures included within this statistical series only include compensation paid through confiscation order receipts and do not represent the full value of compensation paid to victims across the criminal justice system. Data on wider criminal courts and criminal justice statistics including compensation can be found in the Criminal justice statistics and Criminal court statistics.
It should be noted that compensation orders can only be applied for when a criminal confiscation order has been granted; forfeiture and civil recovery orders cannot have compensation orders granted against them. Compensation is only payable to the victim from confiscation order receipts when the court considers that the offender does not have the means to satisfy both their confiscation order and compensation order and accordingly, the latter should be paid out of confiscated funds.
In the financial year ending March 2026, £26.1 million in compensation was paid to victims from proceeds of crime recovered through confiscation order receipts. This is a 45% decrease from the previous financial year (£47.2 million). Despite this decrease, compensation payments remained 29% above the 6-year median of £20.3 million.
The decline was largely driven by lower compensation payments arising from local police-led confiscation orders, following exceptionally strong performance in the financial year ending March 2025. During that year local police accounted for £28.8 million of compensation payments, of which £17.7 million can be attributed to 2 cases.
Figure 8: Total compensation paid to victims from the financial year ending March 2021 until the financial year ending March 2026, in England and Wales and Northern Ireland

Source: JARD
Notes:
- Data in figure 8 captures the total amount paid out to all victims as compensation (from confiscation) from the financial year ending March 2021 to the financial year ending March 2026.
- A court imposing a confiscation order can also order an offender to pay compensation to the victim of their crime. If the offender does not have the means to satisfy both their confiscation order and compensation order, the court can order that compensation order to be payable from the sums recovered as part of the confiscation order.
As shown in figure 8, the total amount of compensation paid to victims fluctuated over the period. Compensation paid rose sharply to £47.2 million in the financial year ending March 2025. Compensation then decreased to £26.1 million in the financial year ending March 2026, although this remained higher than the levels seen prior to the financial year ending March 2025.
Although the value of compensation paid to victims broadly followed trends in confiscation order receipts in some years, it does not always reflect the overall proceeds of crime recovered within a financial year. Compensation is only payable from confiscation order receipts where the court considers that an offender does not have sufficient means to satisfy both their confiscation order and compensation order and, accordingly, compensation should be paid from confiscated funds.
Compensation granted in the financial year ending March 2026 made up 17% of confiscation order receipts, compared to 30% in the previous financial year.
4.1 Compensation by agency sector
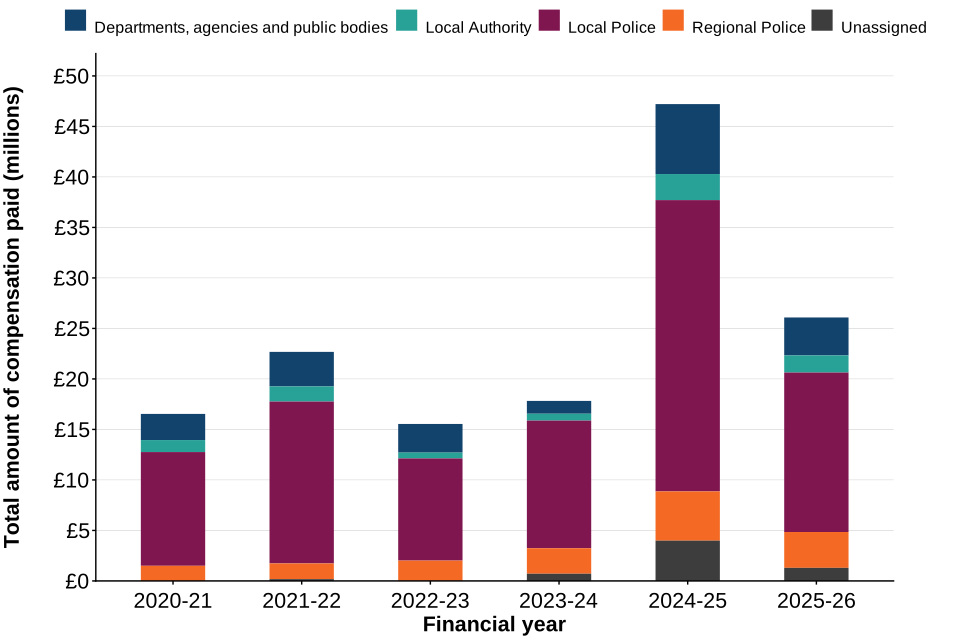
Figure 9: Total compensation paid to victims from the financial year ending March 2021 until the financial year ending March 2026, in England and Wales and Northern Ireland, split by agency sector
Source: JARD
Notes:
- Data in figure 9 captures the total amount paid out to all victims as compensation (from confiscation) from the financial year ending March 2021 to the financial year ending March 2026.
- A court imposing a confiscation order can also order an offender to pay compensation to the victim of their crime. If the offender does not have the means to satisfy both their confiscation order and compensation order, the court can order that compensation order to be payable from the sums recovered as part of the confiscation order.
Of the £26.1 million paid in compensation in the financial year ending March 2026:
- £15.8 million (61%) were associated with confiscation orders processed by local police forces
- £3.8 million (14%) were associated with confiscation orders processed by departments, agencies and public bodies
- £3.5 million (14%) were associated with confiscation orders processed by regional police forces
- £1.7 million (6%) were associated with confiscation orders processed by local authorities
- £1.3 million (5%) were associated with confiscation orders processed by unassigned agencies
- local police forces have paid the largest amount of victim compensation from confiscation order receipts over the last 6 financial years accounting for £94.7 million (65%)
Across these last 6 financial years, fraud offences have contributed to most of the compensation paid by local police forces, with £8.5 million being attributed to fraud offences in the financial year ending March 2026. For all other agency sectors, the most common offence related to compensation being processed was fraud.
Regional police forces processed £3.5 million in compensation in the financial year ending March 2026. Although this was lower than the £4.9 million processed in the previous financial year, it was the second highest value recorded during the 6-year reporting period.
Departments, agencies and public bodies processed £3.8 million in compensation payments from confiscation order receipts in the financial year ending March 2026. While this represented a decrease of 46% from the 6-year high of £6.9 million recorded in the previous financial year, fraud offence cases remained the largest contributor, accounting for £3.0 million (79%) of the total compensation paid by the sector.
4.2 Compensation by primary offence type
Of the £26.1 million paid in compensation in the financial year ending March 2026:
- £16.6 million (64%) were associated with fraud offences
- £3.1 million (12%) were associated with theft offences
- £5.9 million (23%) were associated with money laundering offences
- the remaining £460,000 (2%) were associated with drugs, modern slavery and offences categorised as other
- fraud offences have remained the most prominent primary offence type for compensation over the last 6 financial years
Fraud offences accounted for 68% (£99.2 million) of compensation processed since the financial year ending March 2021.
Money laundering offences have more than trebled, increasing from £1.5 million in the financial year ending March 2025 to £5.4 million in the financial year ending March 2026.
Compensation relating to theft offences totalled £3.1 million in the financial year ending March 2026, a decrease of 74% compared with the previous financial year (£11.8 million). Despite this decline, the value remained 12% above the 6-year median of £2.8 million. It should be noted that certain offence types (like fraud and theft) are more likely to have easily identifiable victims than other offences and are therefore more likely to have compensation orders associated with confiscation orders.
Further information on the value of compensations is available in tables 2, 6, 9 and 21 of the Asset recovery statistics, financial years ending 2021 to 2026: data tables.
5. About these statistics
Future releases of this statistical publication are pre-announced on the statistics release calendar on the GOV.UK website. The accompanying User guide to Asset recovery statistics provides information on the different data sources used and the processes for this statistical release, as well as other statistical information about the Bulletin.
Tables and data
Asset recovery statistics, financial years ending 2021 to 2026: data tables provides 6-year time-series data for each POCA Power, ARIS allocations, data collected by the Home Office on the use of ARIS, cryptocurrency and proceeds of crime from international cooperation.
Feedback
Home Office is keen to receive feedback on its statistical publications to maintain their relevance for users.
Any feedback should be directed to the Asset Recovery Performance team through email: POCAPerformance@homeoffice.gov.uk
Press enquiries for this release should be directed to telephone number: 0300 123 3535.
Other enquiries on these statistics should be directed by email to: CriminalFinancesandAssetRecoveryUnit@homeoffice.gov.uk