Proceeds of crime denied
Updated 15 September 2026
Applies to England, Northern Ireland and Wales

© Crown copyright 2026
This publication is licensed under the terms of the Open Government Licence v3.0 except where otherwise stated. To view this licence, visit nationalarchives.gov.uk/doc/open-government-licence/version/3 or write to the Information Policy Team, The National Archives, Kew, London TW9 4DU, or email: psi@nationalarchives.gov.uk.
Where we have identified any third party copyright information you will need to obtain permission from the copyright holders concerned.
This publication is available at https://www.gov.uk/government/statistics/asset-recovery-statistics-financial-years-ending-2021-to-2026/proceeds-of-crime-denied
Asset denial aims to ensure that individuals do not benefit from criminal conduct by removing assets that have been obtained through, or are intended for use in, unlawful activity. The Proceeds of Crime Act 2002 (POCA) provides a range of powers to support this objective through both criminal and civil asset recovery processes.
Part 2 of POCA makes provision for the confiscation of a person’s benefit from criminal conduct, following a criminal conviction. Part 2 also provides powers to restrain, seize and detain property from criminal conduct following a criminal conviction to prevent the individual from dissipating assets.
Part 5 of POCA makes provisions for the forfeiture of certain assets (cash, monies in relevant accounts, listed assets or cryptoassets) that are determined to be, or to represent property obtained through, or intended for use in unlawful conduct, without a criminal conviction. If the relevant statutory conditions are satisfied the Magistrates’ Court will authorise the seizure and forfeiture of assets. The detention and forfeiture can also occur under other legislation including, but not limited to, the Drugs Trafficking Act 1994, Police and Criminal Evidence Act 1984, and Anti-Terrorism, Crime and Security Act 2001.
This section provides statistics on the value and volume of assets restrained, confiscation orders imposed, and the value recovered through criminal confiscation, specifically:
- Restraint orders
- Confiscation order impositions
-
Civil seizures
- asset freezing orders
- cash seizures
- listed assets
1. Assets denied by restraint orders
1.1 Value of restraint orders
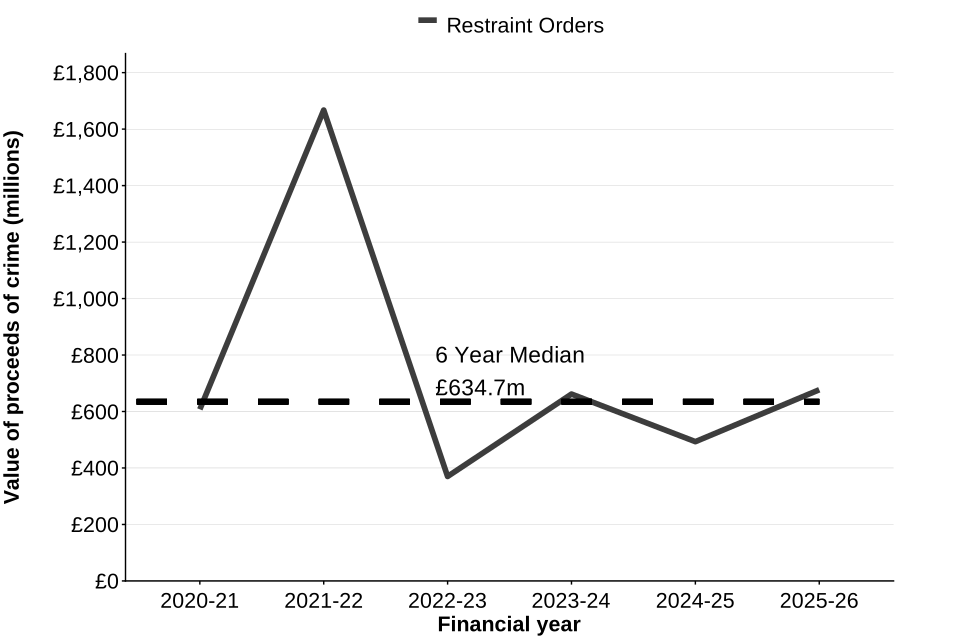
As shown in figure 1 below, the value of restraint orders in the financial year ending March 2026 has increased to £677.0 million, up 37% compared to the previous year and up 7% compared to the median for the last 6-years. This increase was primarily driven by a rise in the value of high-value (£1 million or above) restraint orders, which increased by 51% from £319.5 million to £484.0 million. This occurred despite a small decrease in the number of high-value restraint orders, from 87 to 84.
Figure 1: The total value of proceeds of crime restrained through restraint orders from financial year ending March 2021 until financial year ending March 2026, in England and Wales and Northern Ireland
Source: JARD
Notes:
- Data presented in figure 1 includes proceeds of crime that are restrained so that they cannot be sold or otherwise disposed of by the defendant (or property owner) without court approval whilst confiscation proceedings and enforcement are ongoing.
- A restraint order is used in certain circumstances and does not reflect the overall number of confiscation orders made (impositions) or the proceeds of crime recovered at the end of criminal proceedings. Confiscation orders can be imposed without having a restraint order granted to secure assets. Users should be cautious when making comparisons between the data reported for restraint orders and confiscation orders impositions for this reason.
As can be seen in figure 1, the value of restraint orders over the last 6 years has a median value of £634.7 million. The highest value across the series was in the financial year ending March 2022, when restraint orders peaked at £1.7 billion. However, this peak is attributable to the inclusion of a single restraint order valued at £1 billion. Excluding that single high-value restraint order, the adjusted total for the financial year ending March 2022 would drop to £668.3 million, aligning more closely with the 6-year median.
Due to the live operational nature of police administrative systems, the data presented in this bulletin represent a snapshot in time, based on data extracted from JARD in June 2026. Any retrospective updates to the system will be reflected in future editions of this release. Consequently, figures published in each annual bulletin supersede those in previous releases, and direct comparisons of asset recovery performance between the latest and earlier bulletins should be avoided. Further details on the JARD database and data variations can be found in the User guide to Asset recovery statistics.
1.2 Volume of restraint orders
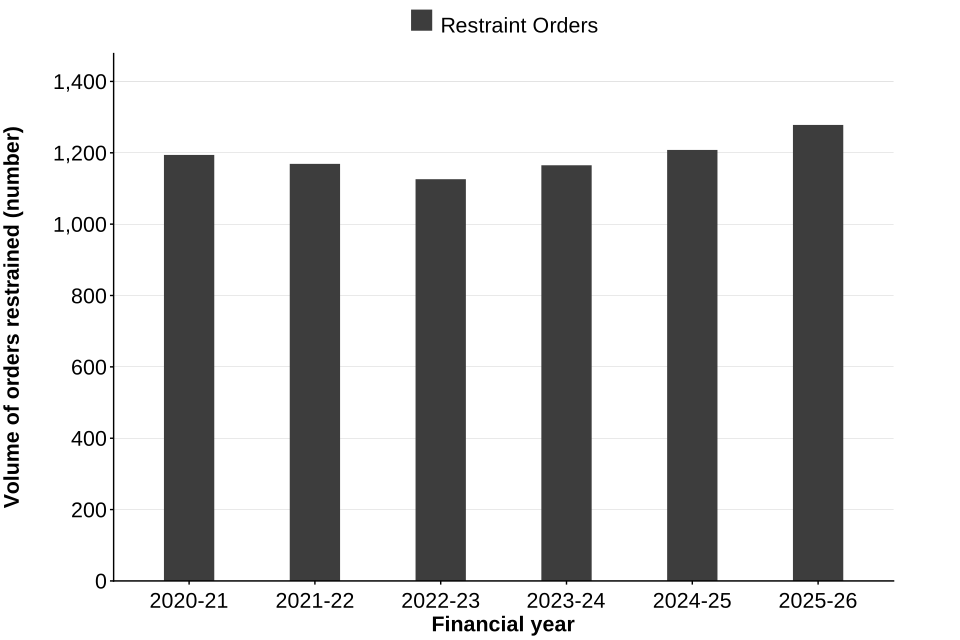
As shown in figure 2, the number of restraint orders has remained consistent since financial year ending March 2021, with 1,270 orders granted in the financial year ending March 2026, slightly higher (7%) than the 6-year median of orders granted.
Figure 2: The volume of restraint orders granted from financial year ending March 2021 until financial year ending March 2026, in England and Wales and Northern Ireland
Source: JARD
Notes:
- Data presented in figure 2 includes the number of restraint orders where proceeds of crime were restrained and could not be disposed of whilst confiscation proceedings and enforcement are ongoing.
- Restraint orders do not reflect the overall number of confiscation orders made (impositions) or the proceeds of crime recovered at the end of the criminal proceedings. Confiscation orders can be imposed without having obtained a restraint order.
1.3 Restraint orders by agency sector
The value of proceeds of crime restrained through restraint orders increased for departments, agencies and public bodies and regional police force compared with the previous financial year, while the value restrained by local authorities and local police force decreased. The largest increase was observed for departments, agencies and public bodies, where the value restrained rose by 160%, from £128.8 million in the financial year ending March 2025 to £335.1 million in the financial year ending March 2026. The value restrained by regional police also increased substantially, rising by 91% from £62.5 million to £119.3 million. A breakdown of this can be found in figure 3 below.
Figure 3: The total value of proceeds of crime restrained through restraint orders from financial year ending March 2021 until financial year ending March 2026, in England and Wales and Northern Ireland, split by agency sector

Source: JARD
Notes:
- Values presented in figure 3 includes the proceeds of crime that are restrained and cannot be disposed of by the defendant (or property owner) without court approval whilst confiscation proceedings and enforcement are ongoing.
- A restraint order is used in certain circumstances and does not reflect the overall number of confiscation orders made (impositions) or the proceeds of crime recovered at the end of the criminal proceedings. Confiscation orders can be imposed without having a prior restraint order. Users should be cautious when making comparisons between the data reported for restraint orders and confiscation orders impositions for this reason.
In the financial year ending March 2026, £677.0 million was restrained. Of these:
- local police forces restrained £207.2 million, accounting for 31% of the total value of restraint orders, which represented a 24% decrease compared with the previous financial year (£272.9 million) and was 7% below the 6-year median of £223.5 million for local police forces
- departments, agencies and public bodies restrained £335.1 million, an increase of 160% compared to the previous year (£128.8 million) with an increase in the volume of restraint orders
- regional police forces restrained £119.3 million, an increase of 91% compared to the previous year (£62.5 million)
- local authorities restrained £12.5 million, a decrease of 57% compared to the previous year (£29.0 million)
Over the last 6 financial years, regional police forces have contributed the largest share of the total value restrained, accounting for 38% of the total £4.5 billion restrained across the 6 financial year period. This proportion was heavily influenced by a single high-value restraint order valued at £1 billion, which created a disproportionate impact for the financial year ending March 2022. When this case is excluded from the total, the contribution by regional police forces decreases to 20% of the adjusted total of £3.5 billion restrained. In this adjusted breakdown, local police forces account for the highest proportion at 40%, followed by departments, agencies, and public bodies at 34%.
1.4 Restraint orders by primary offence
The value of restraint orders increased compared with the previous financial year for most offence groups, including fraud, money laundering, modern slavery, theft and offences categorised under the ‘other’ offence group. Drug offences were the only offence group to record a decline.
The largest proportional increase in restraint order values was observed for theft offences, with the value restrained increasing from £7.9 million to £20.4 million (158%). Drug offences recorded the largest proportional decrease, falling by 10% from £178.0 million to £160.5 million. Fraud offences saw the largest absolute increase in value restrained, rising by just over £150 million, the highest increase across all offence groups.
Drug offences:
- in the financial year ending March 2026, drug related offences accounted for £160.5 million (24%) of the total amount restrained, down 10% from £178.0 million in the previous year, and up 11% compared to the 6-year median of £144.8 million for drug offences
- drug related offences continue to contribute to the majority of orders in terms of volume, accounting for 52% of the volume of restraint orders in the financial year ending March 2026
- over the 6-year period drug related offences accounted for 56% of the total number of restraint orders (3,856 out of 6,915)
Fraud offences:
- in the financial year ending March 2026, fraud offences accounted for £288.3 million (43%) of the total amount restrained, showing a 110% increase in value compared to £137.0 million in the previous year
- there was also an increase in volume with 342 fraud offences restraint orders for the most recent year, up from 280 orders in the previous year (increase of 22%), which means the average value of restraint orders for fraud offences has nearly doubled from £489,000 to £843,000
Money laundering offences:
- performance from money laundering related restraint orders increased by 10%, from £87.0 million in the financial year ending March 2025 to £95.7 million in the financial year ending March 2026
- this is despite a decrease in the volume of money laundering related restraint orders, which decreased from 102 to 93 orders, suggesting overall higher value restrained per order
Theft offences:
- restraint orders related to theft saw a 158% increase, totalling £20.4 million (3%) in the financial year ending March 2026
- this is 7% above the 6-year median of £19.0 million, indicating that restraint order values for theft offences have returned to levels more consistent with the longer-term trend
Performance in terms of value restrained over the last 6 financial years has been driven by money laundering and fraud related offences, contributing £1.5 billion (34%) and £1.4 billion (32%) of the total value restrained (£4.5 billion), respectively. The money laundering total includes a single high-value restraint order valued at £1 billion for the financial year ending March 2022, which again disproportionately impacts the overall figure.
When this case is excluded, the adjusted total value restrained over the 6-year period is £3.5 billion, and the contribution from money laundering related offences decreases to £514.8 million (15%). In this adjusted breakdown, fraud remains the largest contributor at £1.4 billion (42%). Of this £792.9 million (55%) can be attributed to departments, agencies and public bodies.
1.5 Restraint orders by high-value (£1 million +) and low-value cases (< £1 million)
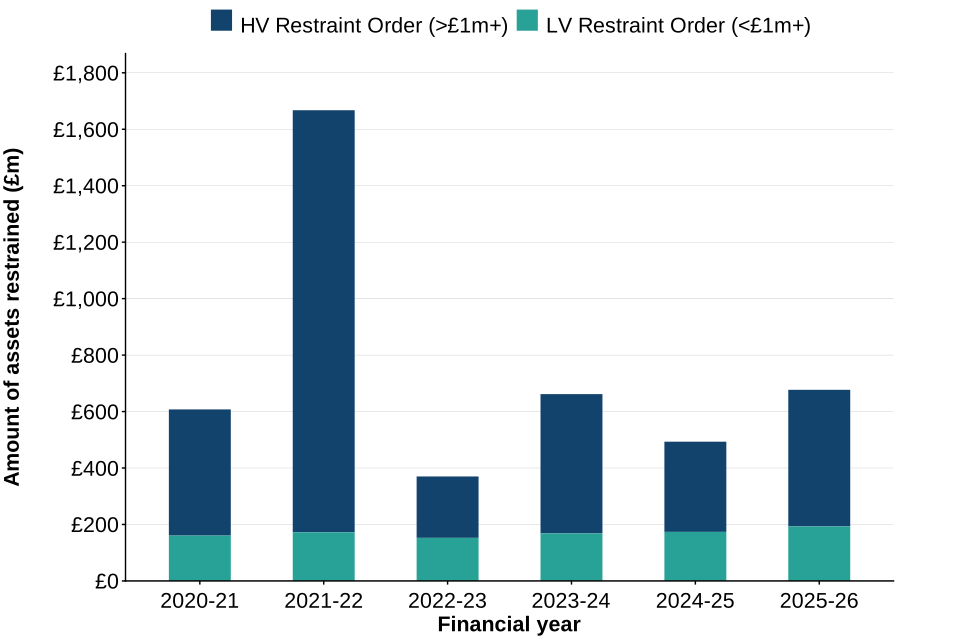
For the financial year ending March 2026, high-value orders saw an increase of 51% (from £319.5 million to £484.0 million). This is despite the volume of high-value orders remaining relatively stable, suggesting overall slightly higher value per order compared to the previous year. The highest value restraint orders in the financial year ending March 2026 were valued at £30 million. Multiple orders of this value were obtained across a range of agencies and offence types, including fraud, money laundering and other offences.
Additionally, for that same period low-value cases saw a slight increase (up 11% from £173.7 million to £193.0 million) compared to the previous financial year. This was accompanied by a 7% increase in the volume of cases, which rose from 1,121 to 1,194.
Figure 4: The total value of proceeds of crime restrained through restraint orders from financial year ending March 2021 until financial year ending March 2026, in England and Wales and Northern Ireland, split by high-value (£1 million +) and low-value cases (< £1 million)
Notes:
- Data presented in figure 4 includes proceeds of crime that are restrained so that they cannot be sold or otherwise disposed of by the defendant (or property owner) without court approval whilst confiscation proceedings and enforcement are ongoing.
- A restraint order is used in certain circumstances and does not reflect the overall number of confiscation orders made (impositions) or the proceeds of crime recovered at the end of criminal proceedings. Confiscation orders can be imposed without having a restraint order granted to secure assets. Users should be cautious when making comparisons between the data reported for restraint orders and confiscation orders impositions for this reason.
It should be noted that the financial year ending March 2022 saw a substantial increase in high-value restraint orders, up 234% from £447 million to £1.5 billion. However, this increase was primarily due to a single high-value restraint order in relation to money laundering obtained by London Regional Asset Recovery Team (RART) valued at £1 billion. This order accounted for 60% of the value of restraint orders for that year and was the highest-value restraint order granted over the last 6 financial years.
1.6 Restraint orders by value banding
In the financial year ending March 2026, the majority of restraint orders were for lower-value amounts. Restraint orders valued at up to £50,000 accounted for 40% of all orders issued (510 orders), making this the most common value band. Orders valued between £100,000 and £250,000 accounted for a further 19% (237 orders), while those valued between £50,000 and £100,000 accounted for 17% (216 orders). See table 20 of the Asset recovery statistics, financial years ending 2021 to 2026: data tables for more information.
Although lower-value orders accounted for the majority of restraint orders, the £500,000 to £1 million band recorded the largest proportional increase in volume, rising by 24% from 78 to 97 orders compared with the previous financial year.
Further information on the value and volume of restraint orders is available in tables 2, 6, 11, 17 and 21 of the Asset recovery statistics, financial years ending 2021 to 2026: data tables.
2. Confiscation order impositions
Confiscation order impositions take place before the enforcement and receipts phase as they are the point at which the court places a requirement to pay a confiscation order on an offender. Confiscation order impositions can highlight the success of agencies at identifying and pursuing cases where assets can be confiscated, and at obtaining confiscation orders against a defendant.
2.1 Value of confiscation order impositions
The value of confiscation order impositions increased compared with the previous financial year, with £367.3 million of confiscation orders imposed in the financial year ending March 2026. This represents an increase of 64% from £223.9 million in the previous financial year and an increase of 76% compared with the 6-year median of £208.3 million, indicating a strong performance in the financial year ending March 2026. This was also the highest value of confiscation order impositions recorded during the 6-year reporting period.
Figure 5: The value of proceeds of crime imposed from confiscation orders from financial year ending March 2021 until financial year ending March 2026, in England and Wales and Northern Ireland

Source: JARD
Notes:
- Values presented in figure 5 include the proceeds of crime which the defendant is ordered to pay back to the court. It does not reflect the proceeds of crime which are subsequently recovered through enforcement action and payments.
The increase in confiscation order impositions in the financial year ending March 2026 was partly driven by 2 high-value confiscation orders of £64 million and £90.5 million, which accounted for 42% of the total value of confiscation orders imposed during the year. A more detailed breakdown can be found in the high-value section later in this commentary.
The 6-year low in the financial year ending March 2021 could be linked to the restrictions introduced during the COVID-19 pandemic which affected law enforcement, criminal justice, and asset recovery systems.
2.2 Volume of confiscation order impositions
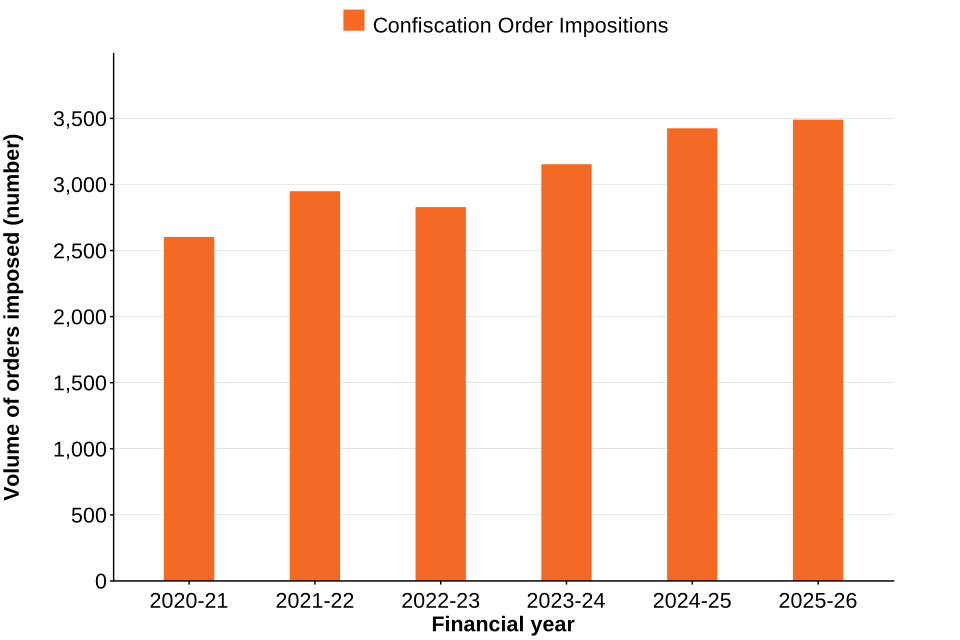
As shown in figure 6, the volume of confiscation order impositions has generally increased since the financial year ending March 2021, despite a slight decline in the financial year ending March 2023. In financial year ending March 2026, 3,490 confiscation order impositions were granted. This has increased by 2% from 3,425 in the previous financial year.
Figure 6: The volume of confiscation orders imposed from financial year ending March 2021 until financial year ending March 2026, in England and Wales and Northern Ireland
Source: JARD
Notes:
- Volumes presented in figure 6 include the proceeds of crime which the defendant is ordered to pay back to the court. It does not reflect the proceeds of crime which are subsequently recovered through enforcement action and payments.
2.4 Confiscation order impositions by agency sector
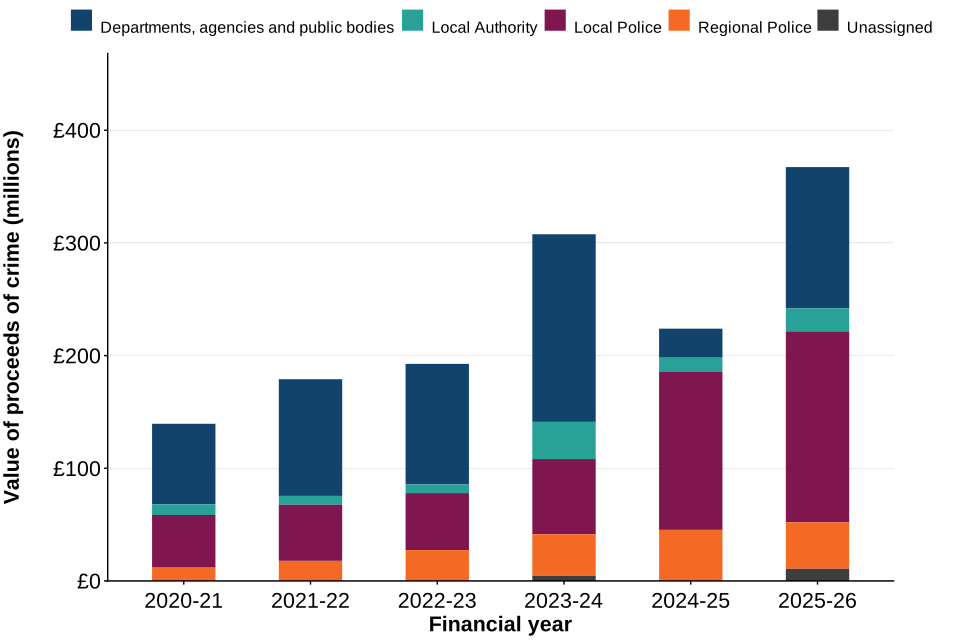
Figure 7 shows that departments, agencies and public bodies were the largest contributor to the value of confiscation order impositions between the financial years ending March 2021 and March 2024. However, since the financial year ending March 2025, local police surpassed departments, agencies and public bodies to become the largest contributing sector for the last 2 years. Although the value of confiscation order impositions attributed to departments, agencies and public bodies increased substantially in the financial year ending March 2026 compared with the previous financial year (increase of 386% from £25.8 million to £125.4 million), local police remained the largest contributing sector in terms of the total value imposed.
Figure 7: The value of proceeds of crime imposed from confiscation orders from financial year ending March 2021 until financial year ending March 2026, in England and Wales and Northern, split by agency sector
Source: JARD
Notes:
- Values presented in figure 7 includes the proceeds of crime which the defendant is ordered to pay back to the court. It does not reflect the proceeds of crime which are subsequently recovered through enforcement action and payments.
Over the last 6 financial years, local police forces have contributed 37% of the total £1.4 billion imposed.
For the financial year ending March 2026, local police accounted for 46% (£169.4 million) of the total value of confiscation order impositions. This represented a 21% increase compared with the previous financial year and was the highest value recorded for local police during the 6-year reporting period.
Departments, agencies and public bodies have been the main contributor in terms of value imposed until the financial year ending March 2024. Over the last 6 financial years, they have contributed 43% of the total £1.4 billion imposed across the 6 financial year period.
For the financial year ending March 2026, departments, agencies and public bodies have contributed 34% (£125.4 million) of the total value of impositions, with a 386% increase compared to the previous year.
2.5 Confiscation order impositions by primary offence type
The value of confiscation order impositions increased for a number of offence groups in the financial year ending March 2026, most notably fraud, which rose from £53.5 million in the previous financial year to £129.9 million, the highest value recorded during the 6-year reporting period. “Other” offences accounted for a substantial proportion of the total value imposed in the latest year, with £110.8 million of confiscation orders imposed in the financial year ending March 2026. This was largely driven by counterfeiting, intellectual property and forgery offences, which accounted for £93.5 million (84%) of the total value imposed within this category. Across the 6-year reporting period, fraud offences confiscation order impositions contributed the highest cumulative value (£426.1 million), accounting for 30% of the total value imposed (£1.41 billion).
A summary of key findings by primary offence type is outlined below.
Drug offences:
- for the financial year ending March 2026, drug offences accounted for 24% (£89.7 million) of the total value of confiscation orders imposed (£367.3 million)
- the value of confiscation order impositions relating to drug offences decreased by 2% compared with the previous financial year (£91.6 million)
- drug offences contributed to the majority of impositions in terms of volume, with 2,388 orders accounting for 68% of total confiscation orders imposed
Fraud offences:
- in the financial year ending March 2026, fraud offences accounted for the highest value of confiscation order impositions, with £129.9 million across 552 orders
- this represented 35% of the total value of confiscation orders imposed during the year and marked a substantial increase of 143% compared with the previous financial year (£53.5 million)
- the value imposed was also 166% above the 6-year median
Money laundering offences:
- in the financial year ending March 2026, money laundering offences confiscation order impositions totalled £29.2 million, accounting for 8% of the total value imposed
- the number of impositions remained broadly stable, increasing slightly from 132 to 137 orders
- the value imposed decreased by 35% compared with the previous financial year (£45.2 million) and was 36% below the 6-year median of £45.6 million
Theft offences:
- in the financial year ending March 2026, theft offences accounted for £7.4 million, representing 2% of the total value of confiscation order impositions
- this was a decrease of 66% compared with the previous financial year (£22.0 million), although it remained 7% above the 6-year median
- this increase in financial year ending March 2025 was mainly attributed to 2 high-value theft cases with a combined value of £15.7 million recovered by local police
Over the last 6 financial years, fraud related impositions had the highest contribution in terms of value imposed at 30% (£426.1 million) of the total value imposed over the last 6 years (£1.4 billion). This was followed by drugs related impositions with the second highest contribution at 26% (£367.1 million). However, money laundering related impositions had the highest value per order imposed over the last 6 years compared to other offence types, at £475,000 per order. In terms of volume, drug offences were the most common offence type, accounting for 69% of the confiscation orders imposed across the last 6 financial years.
2.6 Confiscation order impositions by high-value (£1 million +) and low-value cases (< £1 million)
As shown in figure 8, the financial year ending March 2026 saw a 117% increase in the value of high-value confiscation order impositions, rising from £99.6 million to £216.2 million. This increase was largely driven by 2 exceptionally high-value cases relating to fraud and offences categorised under the ‘other’ offence group, which together accounted for £154.5 million of the total value imposed.
When assessing low-value impositions, performance increased by 22% compared with the previous financial year, rising from £124.3 million to £151.1 million. This represented the highest value of low-value confiscation order impositions recorded during the 6-year reporting period and was accompanied by a 2% increase in the volume of impositions, from 3,400 to 3,465 orders. Together, these increases suggest a strengthening and consistent level of operational activity. While high-value confiscation order impositions have fluctuated considerably over the reporting period, low-value impositions have followed a more consistent upward trend.
Figure 8: The value of proceeds of crime imposed from confiscation orders from financial year ending March 2021 until financial year ending March 2026, in England and Wales and Northern Ireland, split by high-value (£1 million +) and low-value cases (< £1 million)

Notes:
- Values presented in figure 8 include the proceeds of crime which the defendant is ordered to pay back to the court. It does not reflect the proceeds of crime which are subsequently recovered through enforcement action and payments.
Further information on the value and volume of confiscation order impositions is available in tables 2, 6, 11, 17 and 21 of the Asset recovery statistics, financial years ending 2021 to 2026: data tables.
3. Civil seizures
This section provides a summary of the statistics on the value and volume of the proceeds of crime seized, frozen and recovered (forfeited) under different legislation, including POCA, as follows:
- The value and volume of proceeds of crime seized and frozen through cash seizures, account freezing orders and listed asset seizures.
- The value and volume of proceeds of crime recovered from forfeiture order receipts and through cash seizures, account freezing orders and listed asset seizures.
Users should be aware that the methodology for collecting cash seizure data from the police JARD system has been updated to include cases that were previously not captured. This new methodology has been backdated for previous years so users should avoid any direct comparisons between this release and previous releases of the bulletin. Further details can be found in the User guide to asset recovery statistics.
3.1 Value of seizures
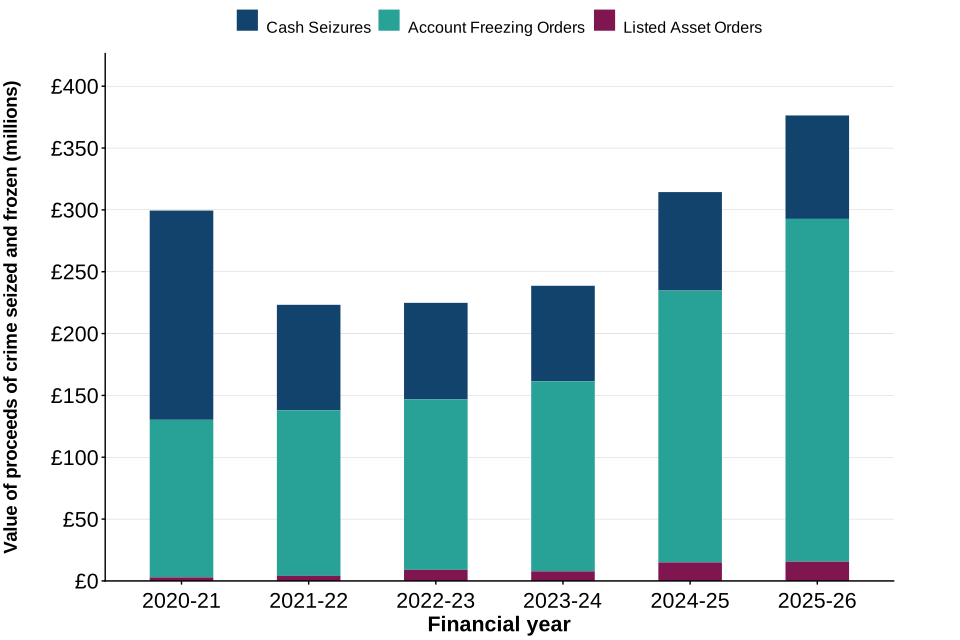
In the financial year ending March 2026, £376.4 million was seized and frozen under all seizure sub-types, an increase of 20% from the previous financial year. Of these:
- £277.1 million (74%) was from Account Freezing Orders (AFOs), compared with £219.8 million (70% of £314.4 million) in the previous financial year
- £83.6 million (22%) was from cash seizures, compared with £79.6 million (25%) in the previous financial year
- £15.6 million (4%) was from listed assets, in line with £15.0 million (5%) in the previous financial year
Since the financial year ending March 2021, a total of £1.7 billion has been seized and frozen using seizure powers. With the exception of the financial year ending March 2021, AFOs have consistently contributed the highest value of seizures of all subtypes within the reporting period.
Figure 9: The value of proceeds of crime seized and frozen under all seizure sub-types from financial year ending March 2021 until financial year ending March 2026, in England and Wales and Northern Ireland
Source: JARD
Notes:
- Data presented in figure 9 shows the value of assets or proceeds of crime seized (cash, listed assets) and frozen (AFOs) that cannot be accessed by the respondent whilst the investigation is undertaken (subject to exclusions, for example, to carry on any trade, business, profession, and for reasonable living expenses). It does not reflect the proceeds of crime which are recovered at the end of the investigation.
- These powers can only be used where assets or proceeds of crime are worth more than the prescribed minimum amount, currently set at £1,000.
As shown in figure 9, the total assets seized and frozen reached a 6-year high in the most recent financial year ending March 2026 at £376.4 million. This was mostly driven by AFO seizures, which accounted for 74% (£277.1 million) of the total seized value. The high level of asset seizure was also supported by 39 high-value AFOs worth £135.6 million, representing 49% of the total value seized. Of these, one exceptionally high-value AFO seizure, led by departments, agencies and public bodies, was valued at £42.6 million.
The financial year ending March 2021 was a particularly high year for cash seizures (£169.2 million), however since then the value of cash seized has remained relatively stable, with the most recent year figure of £83.6 million slightly above the 6-year median of £81.6 million.
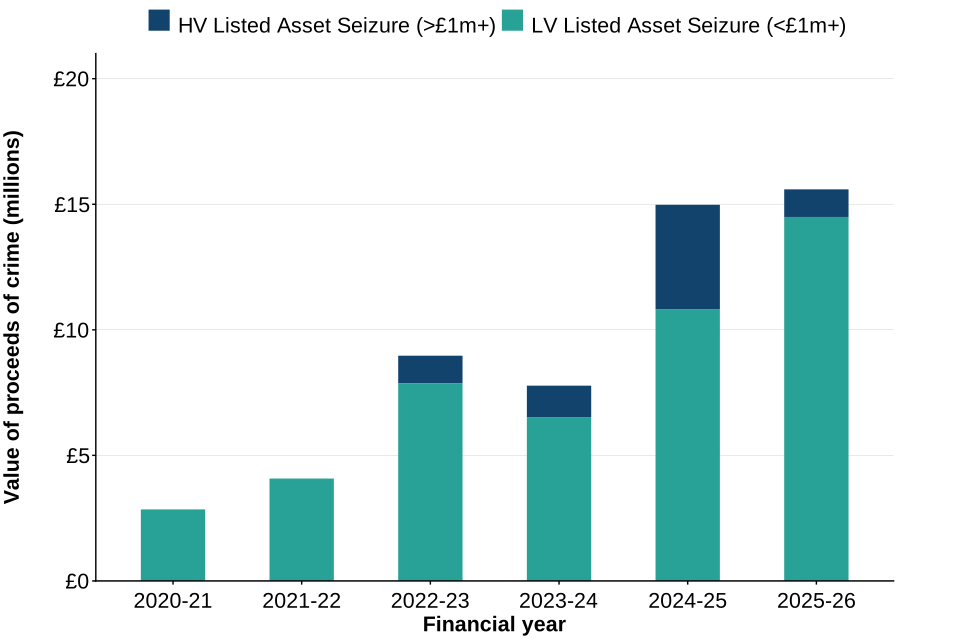
Listed asset seizures have generally increased since the financial year ending March 2021, with the value seized rising in each subsequent year, except for the financial year ending March 2024, when performance decreased by 13% from £9.0 million to £7.8 million. This was followed by a substantial increase in the financial year ending March 2025, when the value seized almost doubled from £7.6 million to £15.0 million. Performance remained stable into the financial year ending March 2026 at £15.6 million.
3.2 Volume of seizures
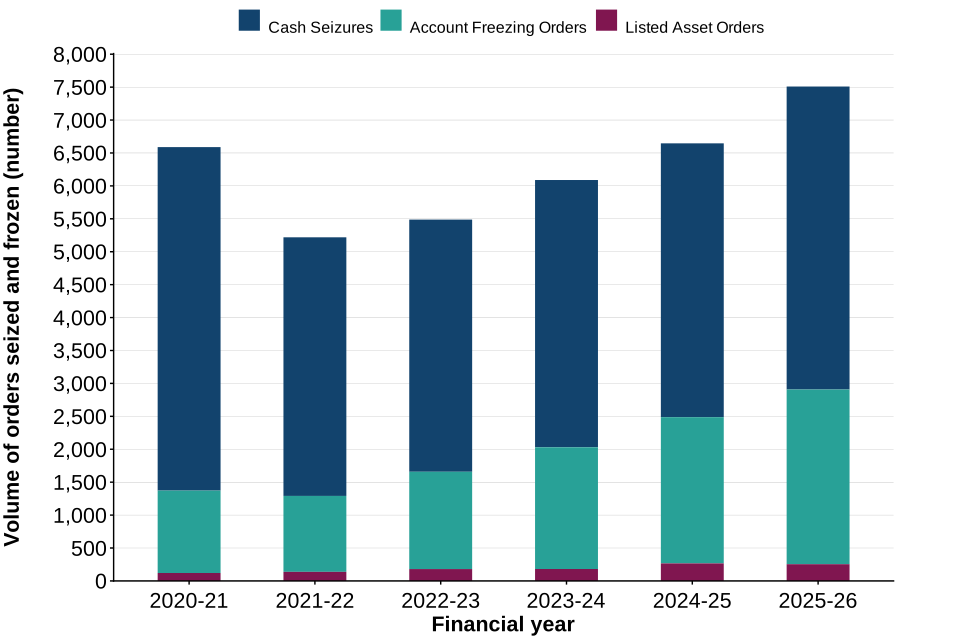
There were 7,505 seizures processed in the financial year ending March 2026, an increase of 13% compared to 6,640 processed in the previous financial year. The seizure sub-type volume breakdown in the financial year ending March 2026 is:
- 4,602 orders (61%) were associated with cash seizures, compared with 4,159 orders (63%) in the previous financial year
- 2,653 orders (35%) were associated with AFOs, compared with 2,221 orders (33%) in the previous financial year
- 250 orders (3%) were associated with listed asset orders, compared with 260 orders (4%) in the previous financial year
Figure 10: The volume of proceeds of crime seized under all seizure sub-types from the financial year ending March 2021 until financial year ending March 2026, in England and Wales and Northern Ireland
Source: JARD
Notes:
- Data presented in figure 10 shows the volume of assets or proceeds of crime seized (cash, listed assets) and frozen (AFOs) that cannot be accessed by the respondent whilst the investigation is undertaken (subject to exclusions, for example, to carry on any trade, business, profession, and for reasonable living expenses). It does not reflect the proceeds of crime which are recovered at the end of the investigation.
- These powers can only be used where assets or proceeds of crime are worth more than the prescribed minimum amount currently set at £1,000.
As shown in figure 10, the total number of seizures was at the lowest point in this 6-year period in the financial year ending March 2022, falling from 6,589 in the financial year ending March 2021 to 5,212. Since then, the volume of seizures has increased in each subsequent financial year, reaching a 6-year high of 7,505 seizures in the financial year ending March 2026. This represents a 13% increase compared with the previous financial year (6,640 seizures) and is 18% above the 6-year median (6,336 seizures).
Cash seizures have remained the most prominent seizure sub-type over the last 6 financial years. The number of cash seizures peaked at 5,217 in the financial year ending March 2021, before falling to 3,830 in the financial year ending March 2023. Since then, cash seizure volumes have increased in each subsequent financial year, reaching 4,602 seizures in the financial year ending March 2026, an increase of 11% compared with the previous financial year (4,159 seizures).
Account Freezing Orders (AFOs) have seen a continuous increase in volume since the financial year ending March 2022. In the financial year ending March 2026, 2,653 AFOs were obtained, representing a 19% increase compared with the previous financial year (2,221 orders) and the highest volume recorded during the 6-year reporting period.
Listed asset seizures continue to account for a relatively small proportion of all seizures, with a median of 173 orders per financial year over the 6-year reporting period. However, in the financial year ending March 2026, 250 listed asset seizures were recorded, which was 45% higher than the 6-year median and the second-highest volume recorded during the reporting period.
3.3 Seizures by agency sector
Local police were the highest contributing sector by value for asset seizures over the past 6 years, with the exception of financial year ending March 2025, where departments, agencies and public bodies accounted for 47% of asset seizures. In the financial year ending March 2026:
- local police seized and froze £188.9 million (50%) of the £376.4 million seized in the latest financial year, up 43% from the previous financial year
- departments, agencies and public bodies seized and froze £140.4 million (37%) of the £376.4 million seized in the latest financial year, down 4% from the previous financial year
- local authorities saw an increase in the value of assets seized and frozen in the financial year ending March 2026, rising by 23% from £1.2 million in the previous financial year to £1.5 million; this represented the highest value recorded during the 6-year reporting period
3.4 Seizures by primary offence
Money laundering offences:
- seizures associated with money laundering offences in financial year ending March 2026 accounted for the largest value of all seizures, while drug related offences accounted for the largest volume of all seizures
- in the financial year ending March 2026, the value of all seizures associated with money laundering offences was £219.0 million, accounting for 58% of the total value seized, representing a 21% increase compared with the previous financial year (£181.7 million) and the highest value recorded over the 6-year reporting period
- money laundering offences accounted for £954.6 million (57%) of the £1.7 billion seized over the last 6 financial years, being the most prominent offence type for all seizure sub-types over this period
It should be noted that this trend is partially attributed to recording practises as POCA agencies often default to recording seizures as money laundering as a catch-all for illicit finances or because the assets relate to a range of criminal conduct including money laundering. This means caution needs to be taken when interpreting trends related to primary offence type.
Fraud offences:
- fraud related criminal offences contributed £84.7 million (23%) through seizures in the financial year ending March 2026, with the majority of the seizures being AFOs (93%)
- consistent with previous years, departments, agencies and public bodies remained the primary contributors to criminal fraud-related seizures in the latest financial year, accounting for £66.9 million (79%) of the total.
Drug offences:
- following a peak of £75.3 million in the financial year ending March 2021, the value of drug offences seizures generally declined to £34.7 million in the financial year ending March 2024
- since then, the value seized has increased for 2 consecutive financial years, rising to £40.1 million in the financial year ending March 2025 and £42.3 million in the financial year ending March 2026
- in terms of volume, drug related seizures have historically contributed the highest volume of seizures, having contributed 47% (17,653 seizure cases) of the total seizures volume (36,973 total seizure cases) over the 6-year period
3.5 Seizures by high-value (£1 million +) and low-value cases (< £1 million)
Account Freezing Orders
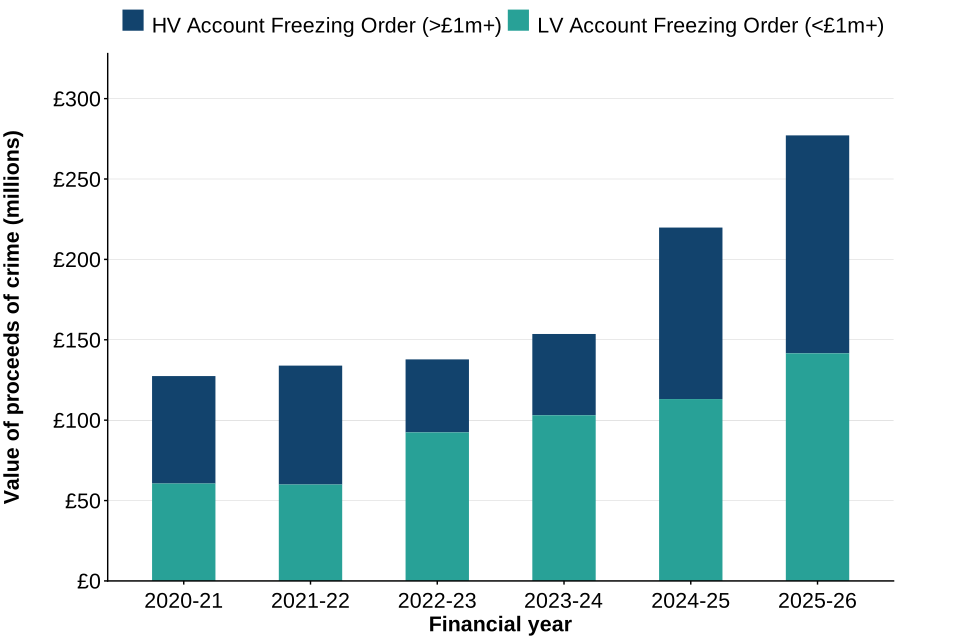
As shown in figure 11, the financial year ending March 2026 saw a 27% increase in high-value AFOs, from £106.7 million to £135.6 million. The majority of the high-value orders were led by departments, agencies and public bodies who contributed 61% (£82.6 million) of the total high-value orders for that period.
Figure 11: The value of account freezing orders from financial year ending March 2021 until financial year ending March 2026, in England and Wales and Northern Ireland, split by high-value (£1 million +) and low-value cases (< £1 million)
Source: JARD
Notes:
- Data presented in figure 11 shows the value of assets or proceeds of crime frozen via account freezing orders that cannot be accessed by the respondent whilst the investigation is undertaken (subject to exclusions, for example, to carry on any trade, business, profession, and for reasonable living expenses). It does not reflect the proceeds of crime which are recovered at the end of the investigation.
- This power can only be used where assets or proceeds of crime are worth more than the prescribed minimum amount, currently set at £1,000.
When assessing low-value AFOs, the value restrained increased by 25% compared to previous year (from £113.1 million to £141.6 million), reaching a 6-year high.
Cash seizures
As shown in figure 12, historically cash seizures have been driven primarily by low-value seizures, with the most recent year continuing this trend. For the financial year ending March 2026, there was a 68% increase in high-value receipts, from £4.3 million to £7.2 million. Most high-value cases were led by local police, who contributed 64% (£4.6 million) of the total high-value seizures for that period.
Figure 12: The value of cash seizures from financial year ending March 2021 until financial year ending March 2026, in England and Wales and Northern Ireland, split by high-value (£1 million +) and low-value cases (< £1 million)

Source: JARD
Notes:
- Data presented in figure 12 shows the value of assets or proceeds of crime seized via cash seizures that cannot be accessed by the respondent whilst the investigation is undertaken (subject to exclusions, for example, to carry on any trade, business, profession, and for reasonable living expenses). It does not reflect the proceeds of crime which are recovered at the end of the investigation.
- This power can only be used where assets or proceeds of crime are worth more than the prescribed minimum amount, currently set at £1,000.
When assessing low-value cash seizures, performance has increased by 1% compared to previous year (from £75.3 million to £76.4 million). This was also primarily driven by local police, contributing 70% (£53.6 million) of the total low-value cash seizures. Overall low-value seizures encompassed 92% of total cash seizures over the 6-year period.
Listed asset seizures
As shown in figure 13, the value of high-value listed asset seizures decreased substantially in the financial year ending March 2026, falling by 74% from £4.2 million to £1.1 million. Despite this decline, the overall value of listed asset seizures increased to £15.6 million, driven by growth in low-value listed asset seizures, which rose by 34% from £10.8 million to £14.5 million.
In contrast, the total volume of cases decreased slightly by 4%, from 260 to 250 cases. The increase in value was primarily driven by departments, agencies and public bodies, which accounted for 46% (£6.6 million) of the total value of low-value listed asset seizures in the financial year ending March 2026.
Figure 13: The value of listed asset seizures from financial year ending March 2021 until financial year ending March 2026, in England and Wales and Northern Ireland, split by high-value (£1 million +) and low-value cases (< £1 million)
Source: JARD
Notes:
- Data presented in figure 13 shows the value of assets or proceeds of crime seized via listed asset seizures that cannot be accessed by the respondent whilst the investigation is undertaken (subject to exclusions, for example, to carry on any trade, business, profession, and for reasonable living expenses). It does not reflect the proceeds of crime which are recovered at the end of the investigation.
- This power can only be used where assets or proceeds of crime are worth more than the prescribed minimum amount, currently set at £1,000.
Further information on the value and volume of assets seized through civil recovery is available in tables 3, 7, 17 and 22 of the Asset recovery statistics, financial years ending 2021 to 2026: data tables.
4. About these statistics
Future releases of this statistical publication are pre-announced on the statistics release calendar on the GOV.UK website. The accompanying User guide to Asset recovery statistics provides information on the different data sources used and the processes for this statistical release, as well as other statistical information about the Bulletin.
Tables and data
Asset recovery statistics, financial years ending 2021 to 2026: data tables provides 6-year time-series data for each POCA Power, ARIS allocations, data collected by the Home Office on the use of ARIS, cryptocurrency and proceeds of crime from international cooperation.
Feedback
Home Office is keen to receive feedback on its statistical publications to maintain their relevance for users.
Any feedback should be directed to the Asset Recovery Performance team through email: POCAPerformance@homeoffice.gov.uk
Press enquiries for this release should be directed to telephone number: 0300 123 3535.
Other enquiries on these statistics should be directed by email to: CriminalFinancesandAssetRecoveryUnit@homeoffice.gov.uk