Commentary for Annual savings statistics: June 2021
Updated 15 June 2021

© Crown copyright 2021
This publication is licensed under the terms of the Open Government Licence v3.0 except where otherwise stated. To view this licence, visit nationalarchives.gov.uk/doc/open-government-licence/version/3 or write to the Information Policy Team, The National Archives, Kew, London TW9 4DU, or email: psi@nationalarchives.gov.uk.
Where we have identified any third party copyright information you will need to obtain permission from the copyright holders concerned.
This publication is available at https://www.gov.uk/government/statistics/annual-savings-statistics/commentary-for-annual-savings-statistics-june-2021
This bulletin provides commentary and analysis on the Individual Savings Accounts, Child Trust Fund and Help to Save statistics contained in this release.
1. Individual Savings Accounts (ISAs)
1.1 Number of ISAs subscribed to (chart uses data from Table 9.4)
Chart 1 shows that around 13 million Adult ISA accounts were subscribed to in 2019 to 2020, up from 11.2 million subscribed to in 2018 to 2019. The number subscribing to cash ISAs subscriptions increased by 1.2 million from 2018 to 2019. The number subscribing to stocks and shares ISAs increased by 300,000. The share of accounts subscribed to in cash has remained broadly consistent at 75% of accounts, compared to 76% in 2018 to 2019.
Chart 1: Number of Adult ISA accounts subscribed to during the financial year
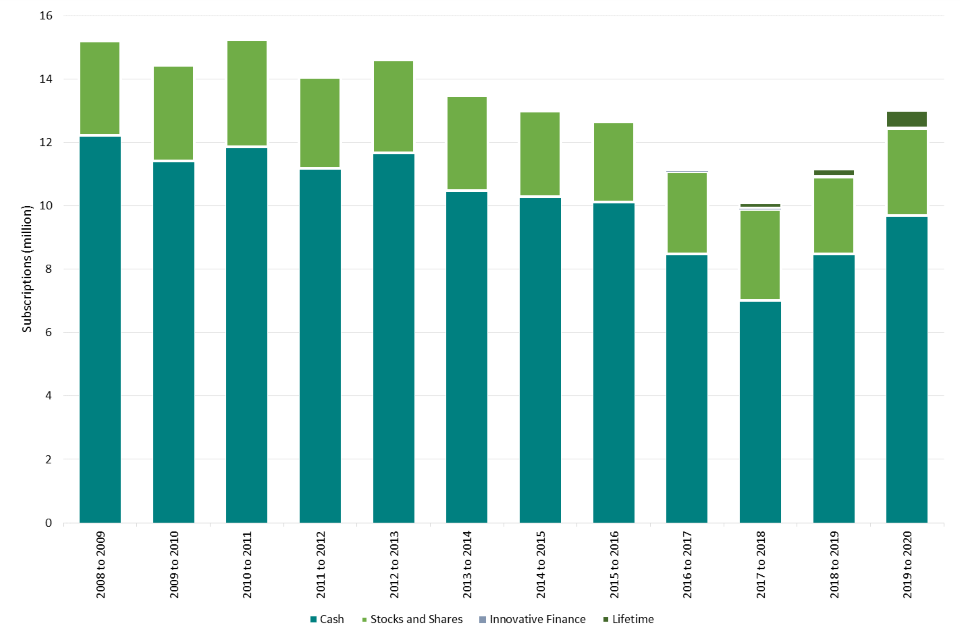
In addition, around 1 million Junior ISA accounts were subscribed to in 2019 to 2020, the ninth full financial year since the scheme was launched, up from 954,000 in 2018 to 2019.
1.2 Amounts subscribed (chart uses data from Table 9.4)
Chart 2 shows that around £75 billion was subscribed to Adult ISAs in 2019 to 2020, an increase of £7.1 billion compared to 2018 to 2019. This increase was driven by the rise in cash ISA subscriptions, which increased by £4.8 billion. The amounts subscribed to stocks and shares ISAs increased by £1.6 billion since 2018 to 2019.
Chart 2: Amounts subscribed to Adult ISAs during the financial year
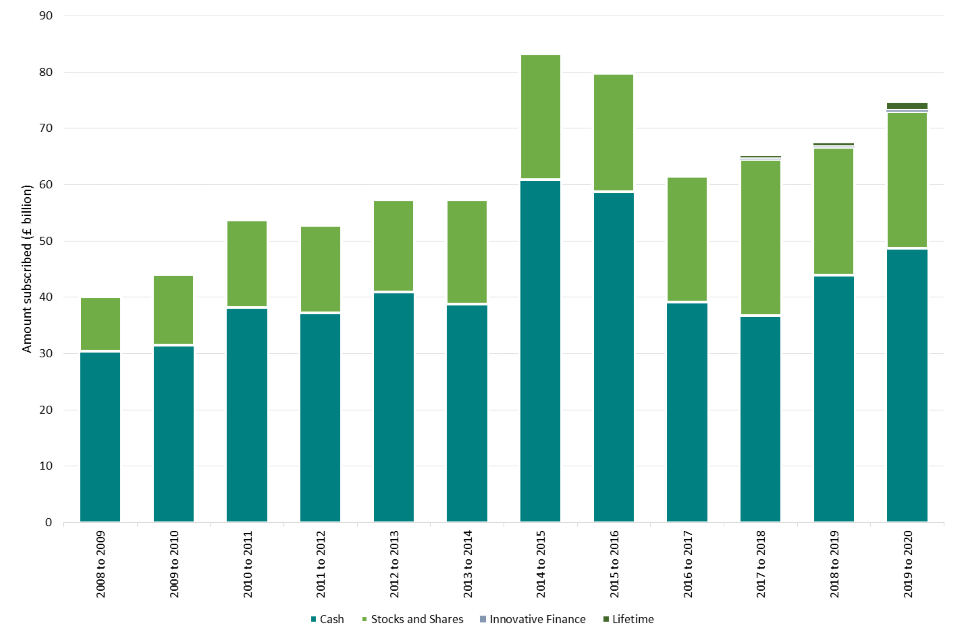
£971 million was subscribed to Junior ISA accounts in 2019 to 2020, around 61% of which was in cash. Average subscriptions in 2019 to 2020 were around £5,740, a 5% decrease on the 2018 to 2019 figure.
1.3 Market value of ISA funds (chart uses data from Table 9.6)
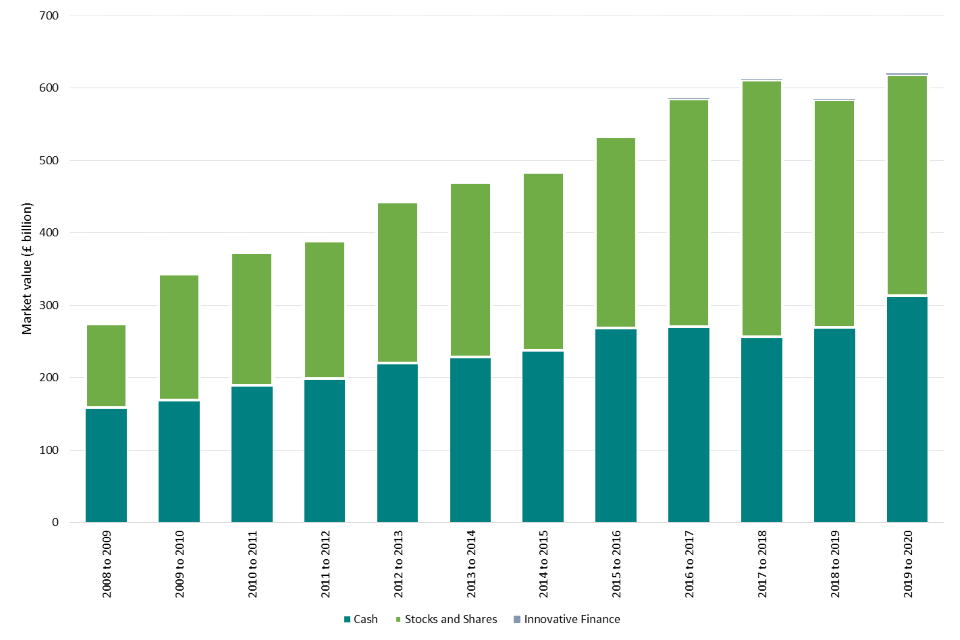
Chart 3 shows that at the end of 2019 to 2020 the market value of Adult ISA holdings stood at £620 billion. This represents a 6% increase compared to the value at the end of 2018 to 2019. This was driven by a 16% increase in the market value of funds held in cash. Stocks and shares ISA holdings account for 49% of the market value of ISA funds, a decrease of 9% from 2018 to 2019. Cash ISAs account for 51% of the market value.
Chart 3: Adult ISA fund market values
1.4 ISA holders by income (charts use data from Tables 9.7 and 9.10)
Chart 4 shows details of the 20 million Adult ISA holders analysed by income band for the year 2018 to 2019. The median ISA holder (by income) had annual income of between £20,000 and £29,999. The average ISA savings by market value was around £28,530. At higher earnings levels the number of ISA holders declines (due to a lower amount of people in such income bands), but is accompanied by a large increase in average ISA savings values. For ISA savers with incomes of £150,000 or more, values averaged £88,970.
Chart 4: Number of ISA holders and average ISA savings value by income band in 2018 to 2019
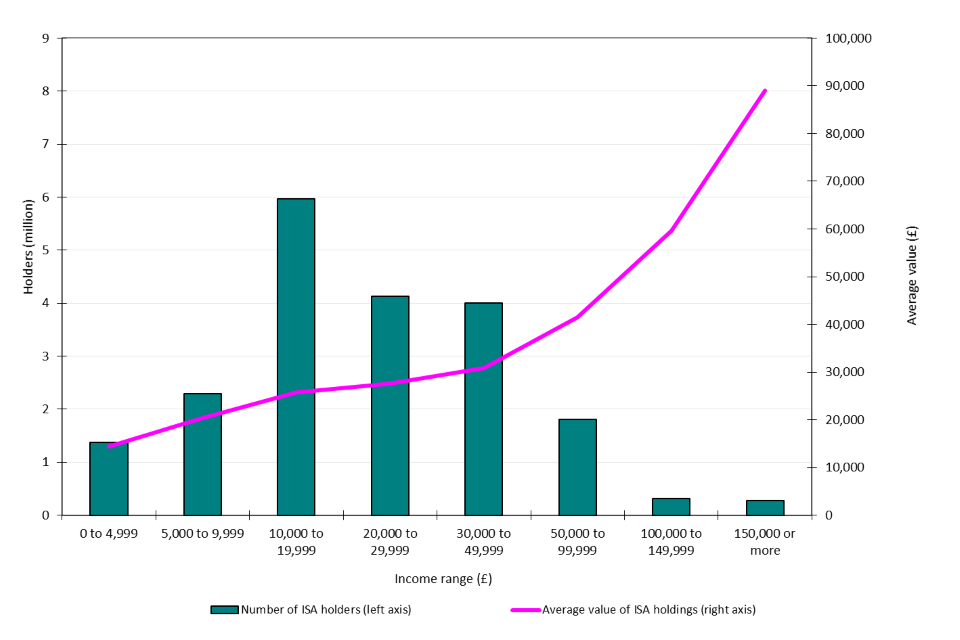
Chart 5 shows that the amount subscribed to an ISA increases with the income of the individual subscriber. 18% of subscribers saved at the maximum in 2018 to 2019, rising to 40% of those with income of £100,000 to £149,999, and to 61% of those with income of £150,000 or more. The highest proportion of savers, around 44%, saved between £1 and £2,499.
The chart suggests that some individuals may have contributed more to their ISAs than their annual earnings allow (such as those subscribing the maximum £20,000 with an income of less than £5,000). This may be possible where individuals have existing taxable savings that they are transferring into ISA accounts.
Alternatively, in households with more than one adult, earnings from one high income individual may enable other adults in the household to open an ISA account, in order to maximise the tax free return on their savings. The size of ISA holdings rises with income.
Chart 5: ISA subscriptions by income band and size of subscription in 2018 to 2019
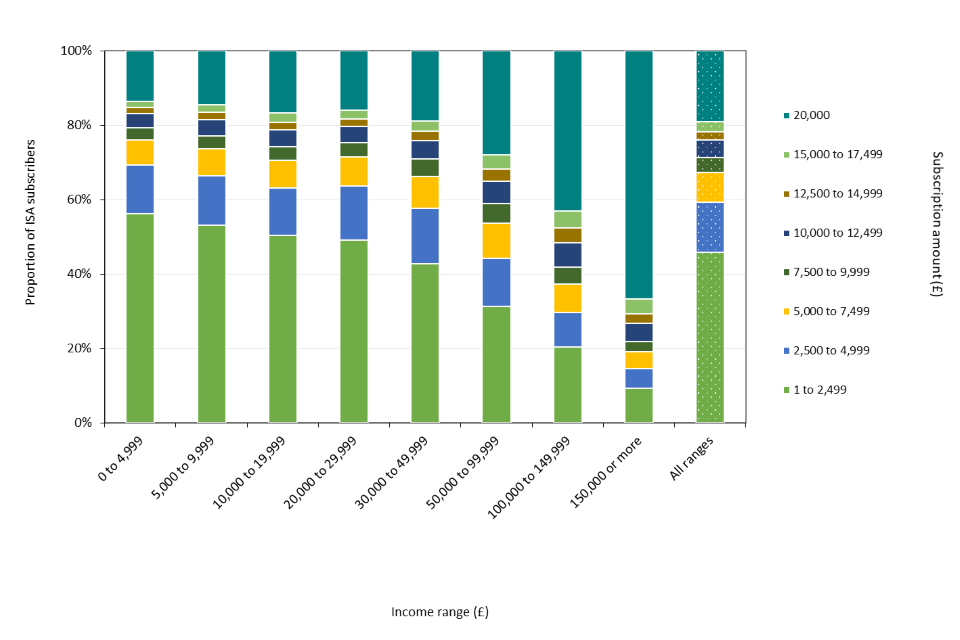
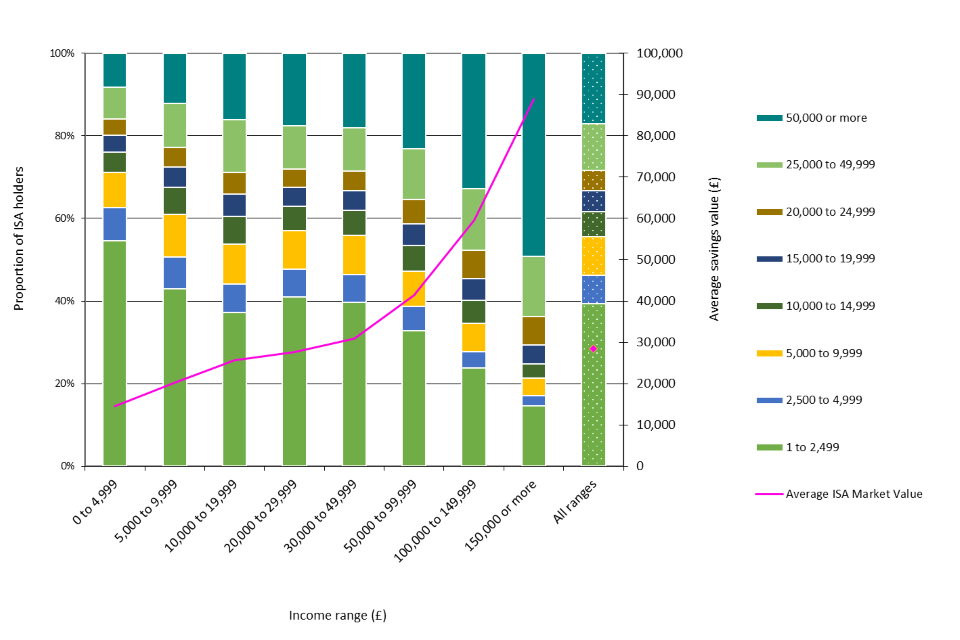
Chart 6 shows the proportion of ISA holders with different levels of ISA savings value across income bands. Among ISA savers with income of £150,000 or more, 49% have ISA savings of £50,000 or greater, compared to just 8% of savers on income below £5,000. For ISA savers with incomes of £150,000 or more the average ISA saving at the end of 2018 to 2019 was around £88,970.
Chart 6: ISA holdings by income band and average ISA savings value in 2018 to 2019
1.5 ISA holders by age and gender (charts use data from Tables 9.8 and 9.11)
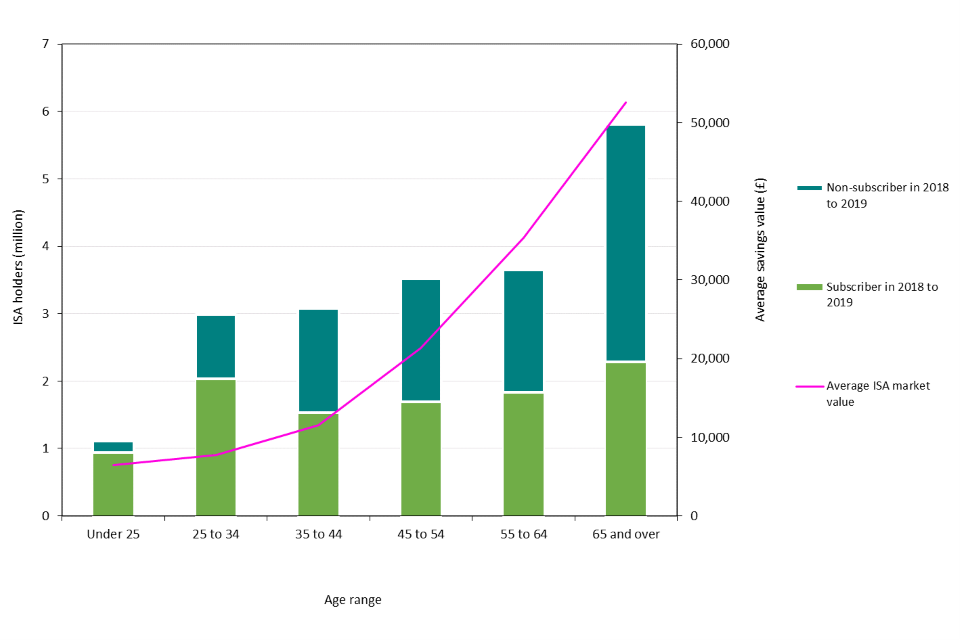
Chart 7 illustrates the distribution of Adult ISA holdings across different age groups. The lowest number is observed in the youngest category (under 25), but approximately 85% of this group were active savers in 2018 to 2019.
The greatest number of savers was in the 65 and over group, and this group also had the highest average ISA savings value of around £52,590. A large portion of this group (61%), however, were not active savers in 2018 to 2019.
Chart 7: Age distribution and average savings of ISA holders in 2018 to 2019
The size of ISA holdings also increases with age. Chart 8 shows that the proportion of ISA holders with ISAs valued at £50,000 or more is highest among those aged 65 or more, whereas the proportion of ISA holders with ISAs valued at between £1 and £2,499 is highest among those aged 25 to 34.
Chart 8: ISA holdings by age range and average ISA savings value in 2018 to 2019
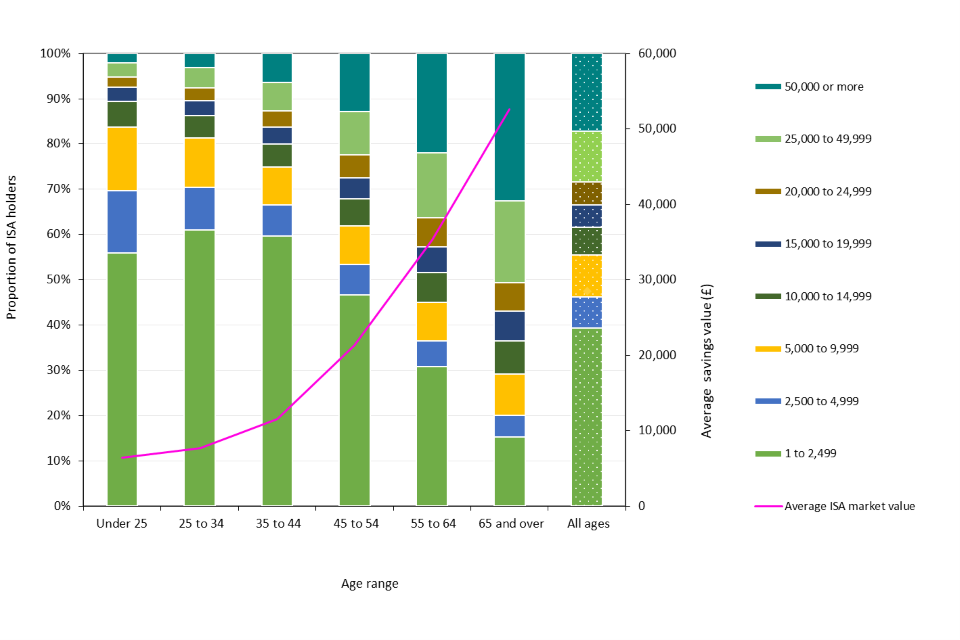
The average amount of ISA savings in the under 25 age group at the end of 2018 to 2019 was around £6,450 and the average amount of ISA savings in the 25 to 34 age group was around £7,750. This is compared with about £52,590 in the 65 and over group.
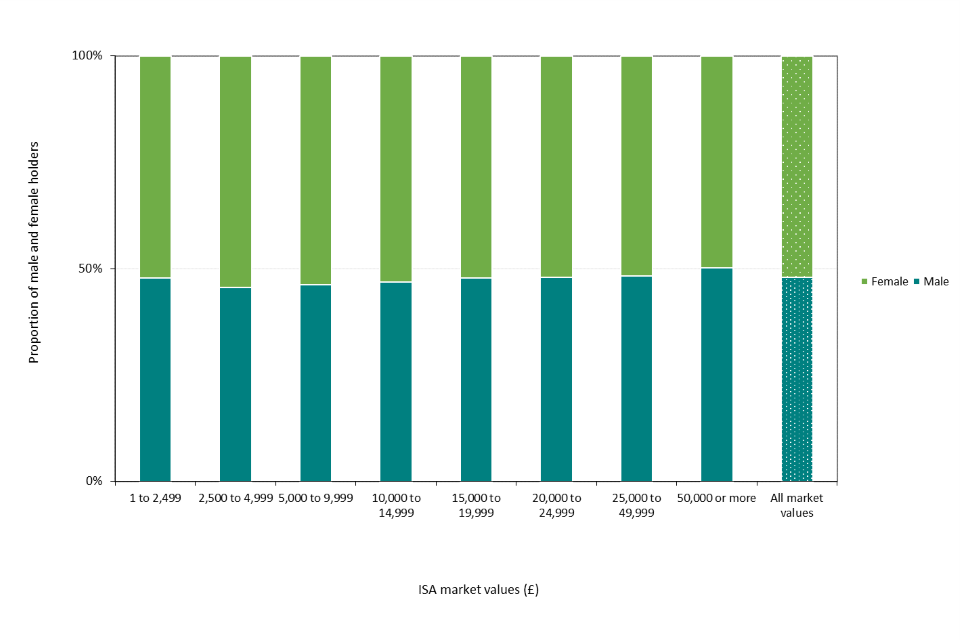
The sex split of numbers of ISA subscribers is relatively equal. Chart 9 shows that in 2018 to 2019, females accounted for a marginally higher proportion of the total ISA holdings. Females accounted for 50% of ISA holdings worth £50,000 or more, in contrast to owning 52% of holdings worth up to £2,499.
Chart 9: ISA savings by sex in 2018 to 2019
1.6 Geographical location of ISA holders (charts use data from Table 9.9 and 9.12)
Chart 10 illustrates that among English regions, the proportion of adults holding ISAs is highest in the South West at 44% and lowest in London at 34%. This is compared to an average of 39% for all English regions.
Chart 10: Proportion of population with ISAs and average holding by English region in 2018 to 2019
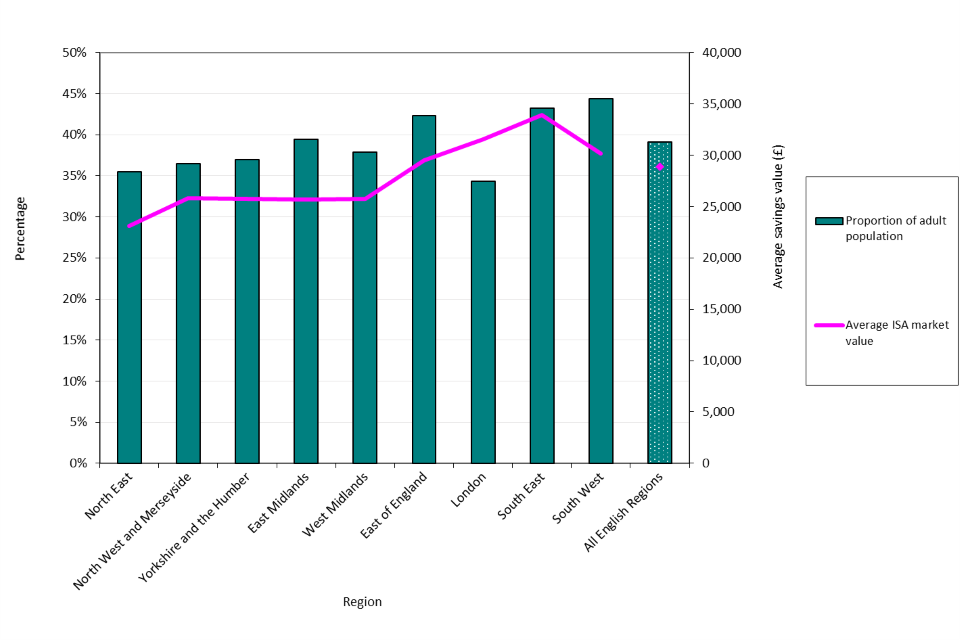
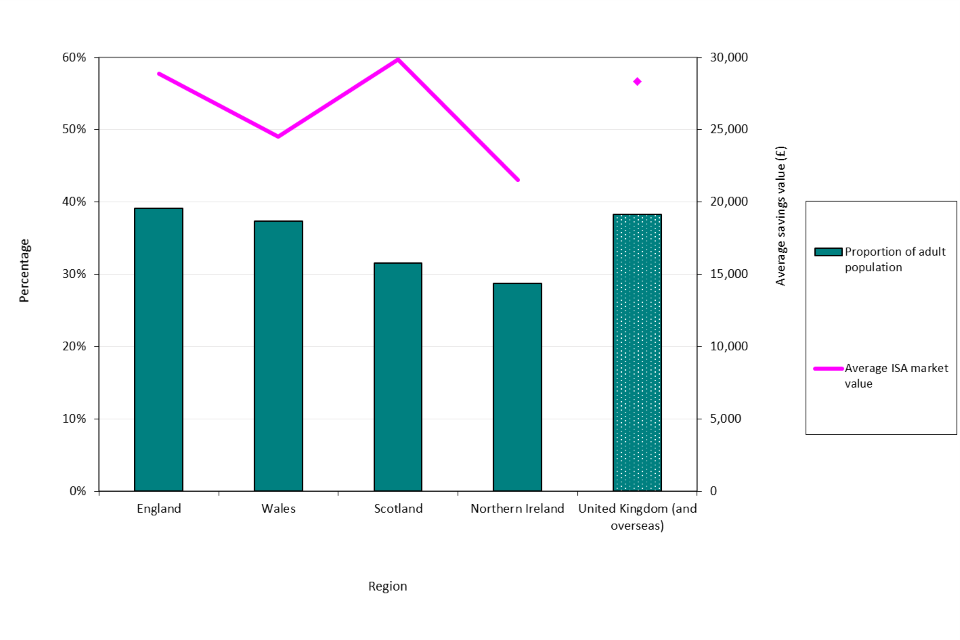
Chart 11 shows that at the end of 2018 to 2019, 39% of adults in England had an ISA. By comparison, in Wales, Scotland and Northern Ireland, 37%, 31% and 29% of adults, respectively, had ISAs. ISAs held by individuals in England and Scotland were on average higher in value compared to the rest of the United Kingdom.
Chart 11: Proportion of population with ISAs and average holding by UK region in 2018 to 2019
2. Child Trust Funds
2.1 Market value of Child Trust Funds (charts use data from Table 1a)
Chart 12 shows the average market value of a Child Trust Fund (CTF) in 2019 to 2020 was £1,500. The average market value of a stakeholder and non-stakeholder account was £1,980 and £1,400, respectively.
Chart 12: Average market value of Child Trust Funds in 2019 to 2020
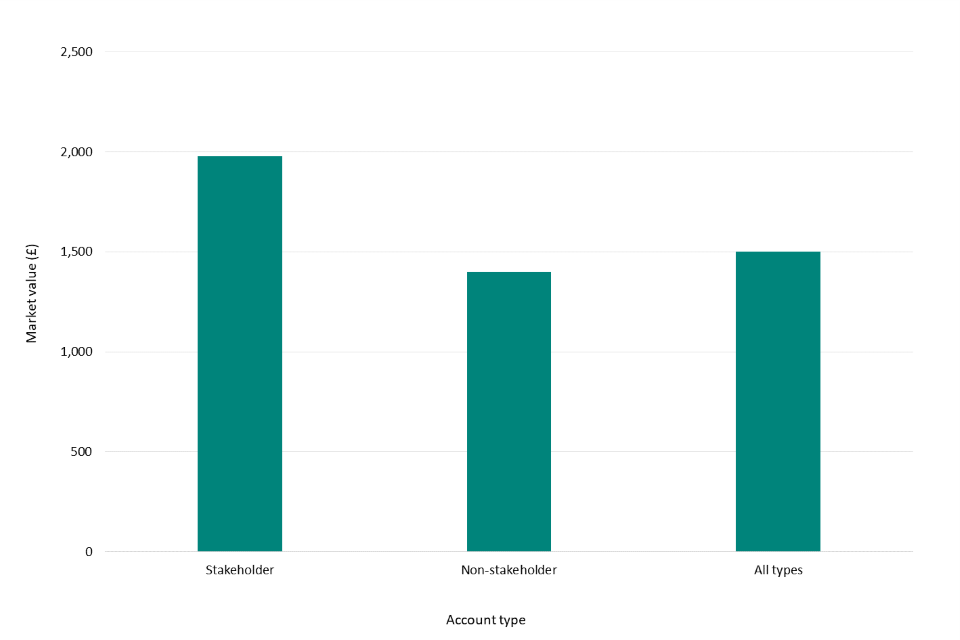
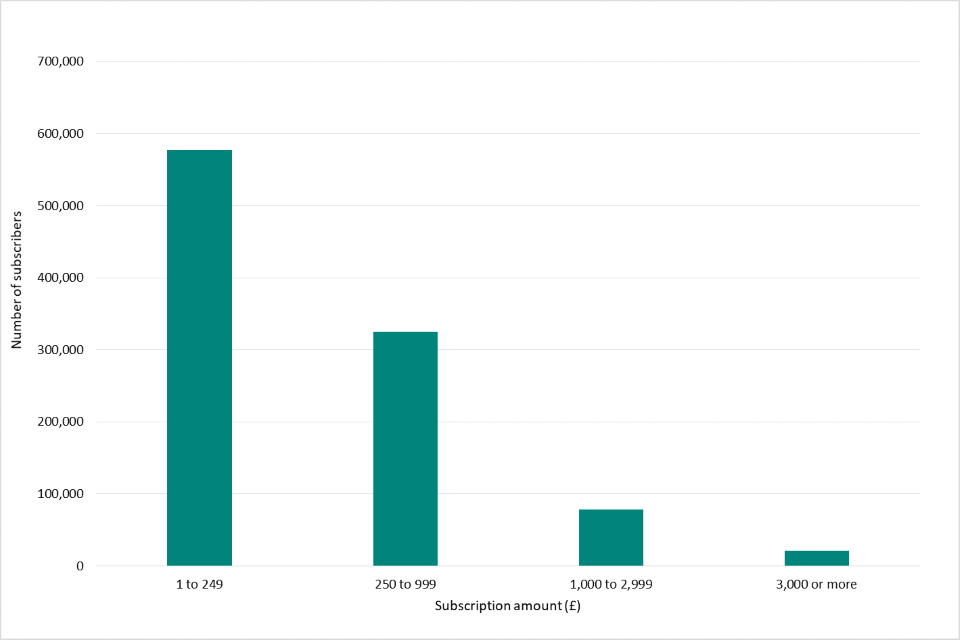
Chart 13 shows that in 2019 to 2020, the number of individuals subscribing to a CTF decreases with the size of subscription. The majority of CTF subscriptions were in the £1 to £249 band, with around 577,000 subscribers.
Chart 13: Child Trust Fund subscribers by size of subscription in 2019 to 2020
3. Help to Save
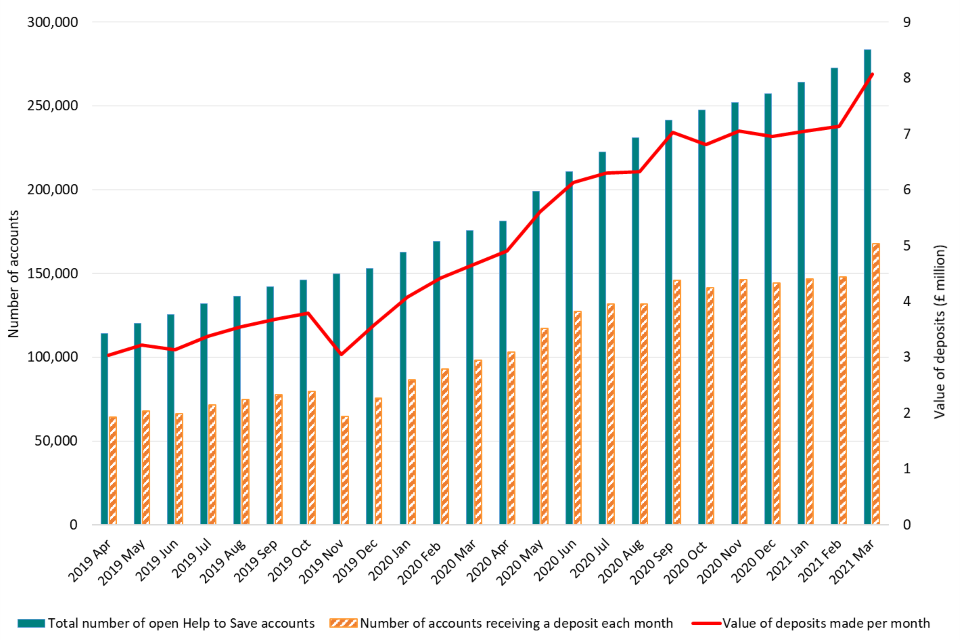
Chart 14 shows that in the past two months (February 2021 to March 2021), 19,250 Help to Save accounts have been opened. The total number of accounts opened now stands at 284,050, a 7% increase on the total number of accounts opened by the end of January 2021.
This version of the release also contains statistics at a Government Office Region, Local Authority District and Parliamentary Constituency level. Birmingham has remained the local authority district with the most accounts and the region with the most accounts has also remained as the North West.
In total, around 235,000 individuals have now made a deposit to their Help to Save account, an 8% increase compared to the previous release. For those individuals making deposits, the average deposit per person per month has remained at £48; the maximum permitted monthly deposit is £50. However, there are 49,400 accounts that are still yet to have received a deposit at all.
Total deposits to the scheme in the two month period of February 2021 to March 2021 exceeded £15 million.
Chart 14: Total number of open Help to Save accounts, monthly accounts receiving a deposit and value of monthly deposits
Source: HMRC data
3.1 Contact Information
The statistical contacts for this publication are:
- I Farrington
- K Ismail
- personaltax.statistics@hmrc.gov.uk
For press queries, please contact HMRC Press Office: news.desk@hmrc.gov.uk