Commentary for Annual savings statistics: September 2026
Published 16 September 2026

© Crown copyright 2026
This publication is licensed under the terms of the Open Government Licence v3.0 except where otherwise stated. To view this licence, visit nationalarchives.gov.uk/doc/open-government-licence/version/3 or write to the Information Policy Team, The National Archives, Kew, London TW9 4DU, or email: psi@nationalarchives.gov.uk.
Where we have identified any third party copyright information you will need to obtain permission from the copyright holders concerned.
This publication is available at https://www.gov.uk/government/statistics/annual-savings-statistics-2026/commentary-for-annual-savings-statistics-september-2026
This bulletin provides commentary and analysis on the Individual Savings Accounts (including Lifetime ISA), Child Trust Fund and Help to Save statistics contained in this release.
1. Individual Savings Accounts (ISAs)
1.1 Number of ISAs subscribed to (Chart uses data from Table 9.4)
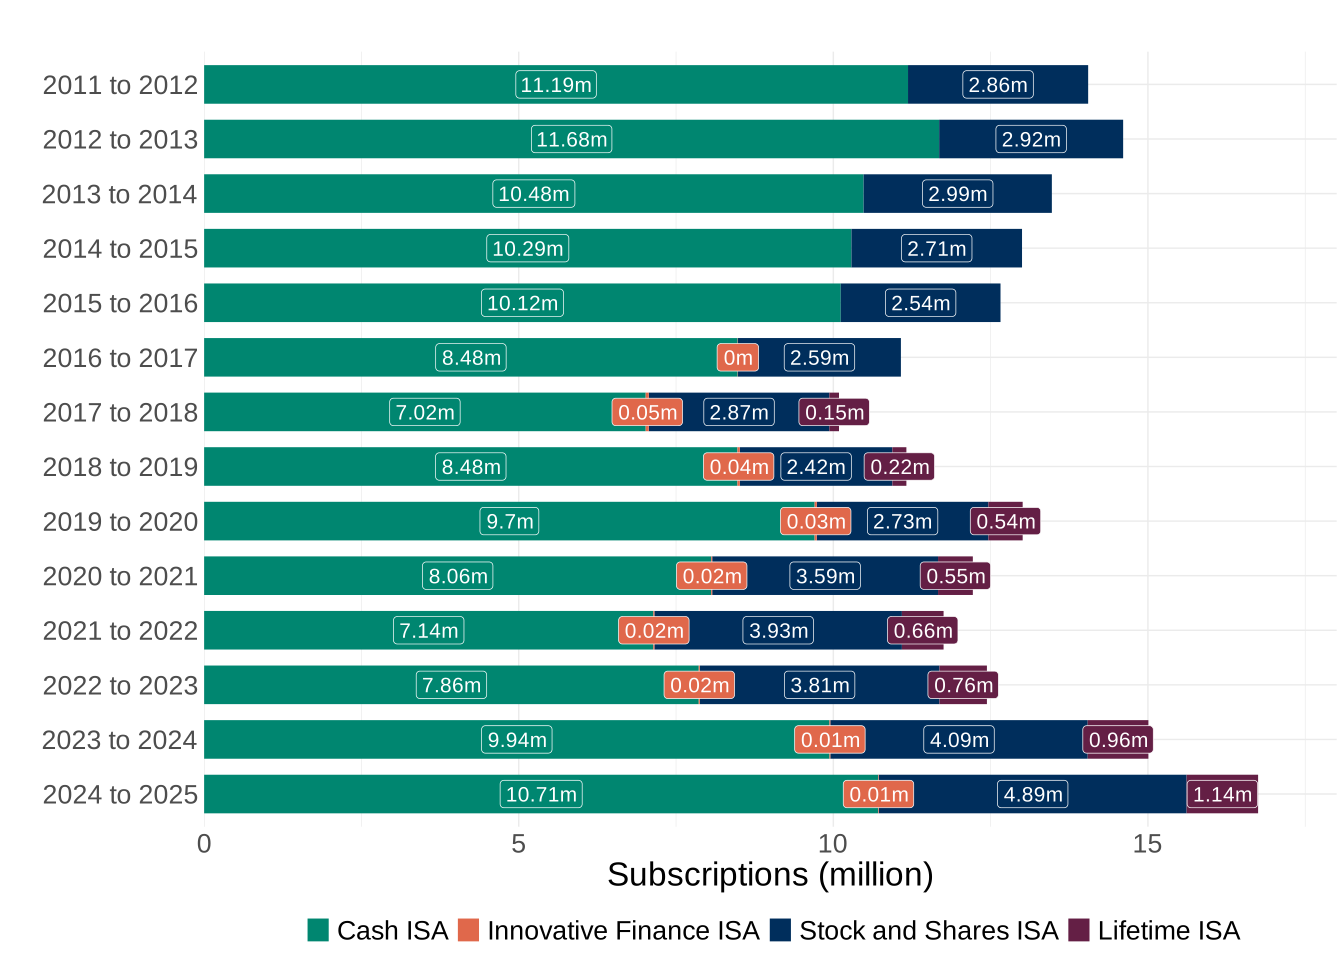
Chart 1 below shows that around 16.8 million Adult ISA accounts were subscribed to in 2024 to 2025, up from 15 million in 2023 to 2024. This upward trend is largely attributable to the significant increase in the number of Stocks and Shares accounts (802,000) subscribed to, as compared to last year, when an increase of 2.1 million Cash accounts subscribed to was observed. The share of accounts subscribed to in cash has fallen to 64%, a 2.2% reduction from 2023 to 2024. Meanwhile, the number of Innovative Finance ISAs subscribed to continues on decreasing year-on-year, with a reduction of 30.8%.
Chart 1: Number of Adult ISA accounts subscribed to per tax year
Around 1.6 million Junior ISA accounts were subscribed to in 2024 to 2025, the thirteenth full financial year since the scheme was launched, up from 1.37 million in 2023 to 2024.
1.2 Amounts subscribed (Chart uses data from Table 9.4)
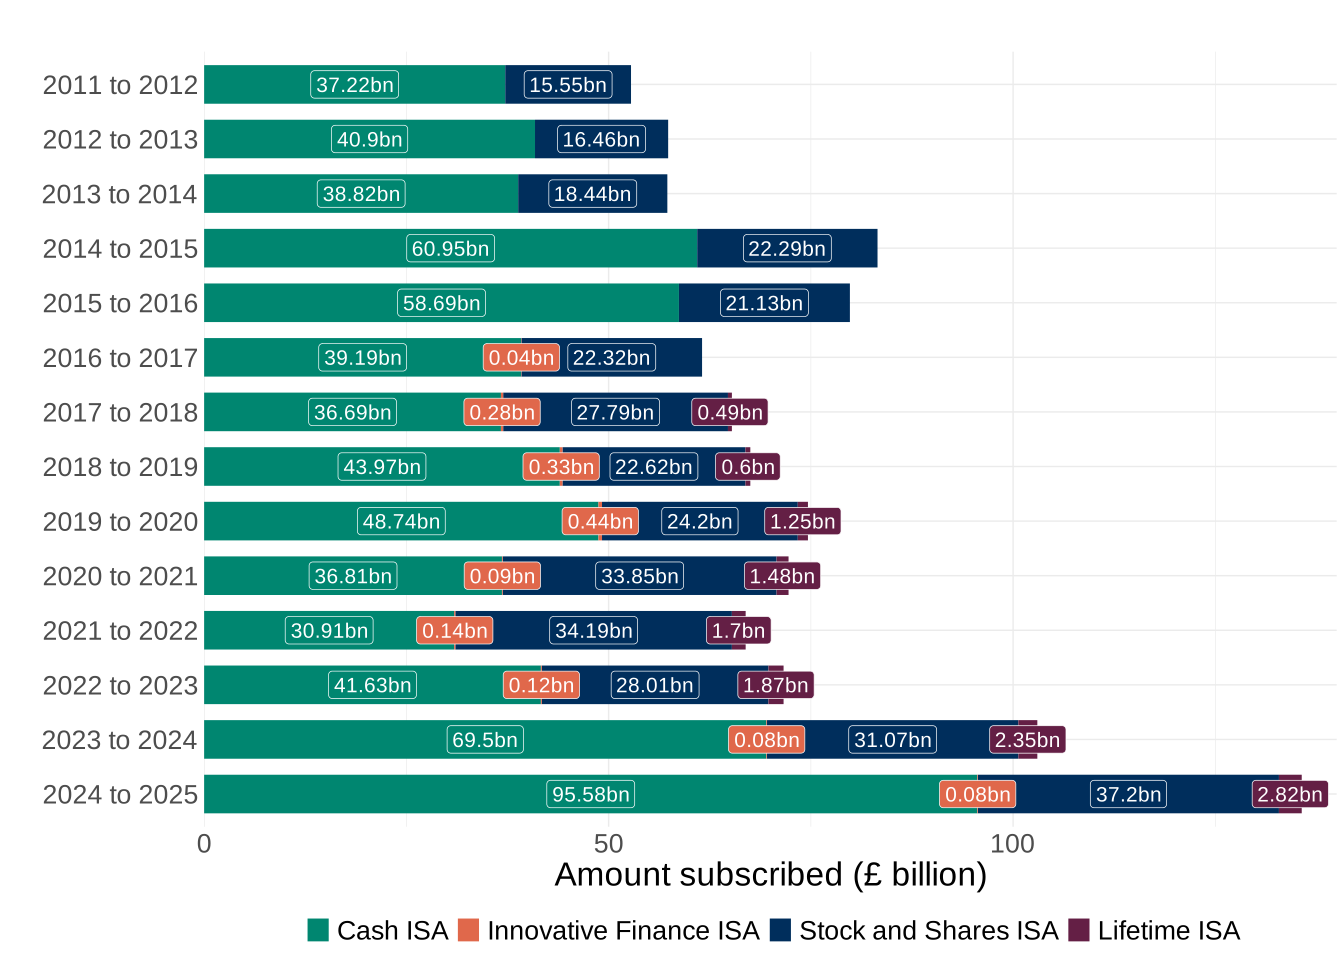
Chart 2 shows that around £135.7 billion was subscribed to Adult ISAs in 2024 to 2025, an increase of £32.7 billion compared to 2023 to 2024. This increase was driven by the rise in Cash ISA subscriptions, which grew by 37.5% (£26.1 billion). Stocks and Shares ISA subscriptions followed with a 19.7% increase (£6.1 billion) and Lifetime ISA subscriptions with a 20.1% increase (£472 million).This large increase in Cash ISA subscriptions can be explained by the Bank of England bank rate and the interest swap rates which were at their highest levels during the 2023/24 and 2024/25 tax years. Increased returns to savings are likely to have increased the attractiveness of ISAs as a means to reduce savings Income Tax liabilities.
Chart 2: Amounts subscribed to Adult ISAs per tax year
In 2024 to 2025, £2.5 billion was subscribed to Junior ISAs, around 38.3% of which was in cash. The average subscription in 2024 to 2025 increased to £1,570, an increase of 16.6% on the 2023 to 2024 figure.
1.3 Market value of ISA funds (Chart uses data from Table 9.6)
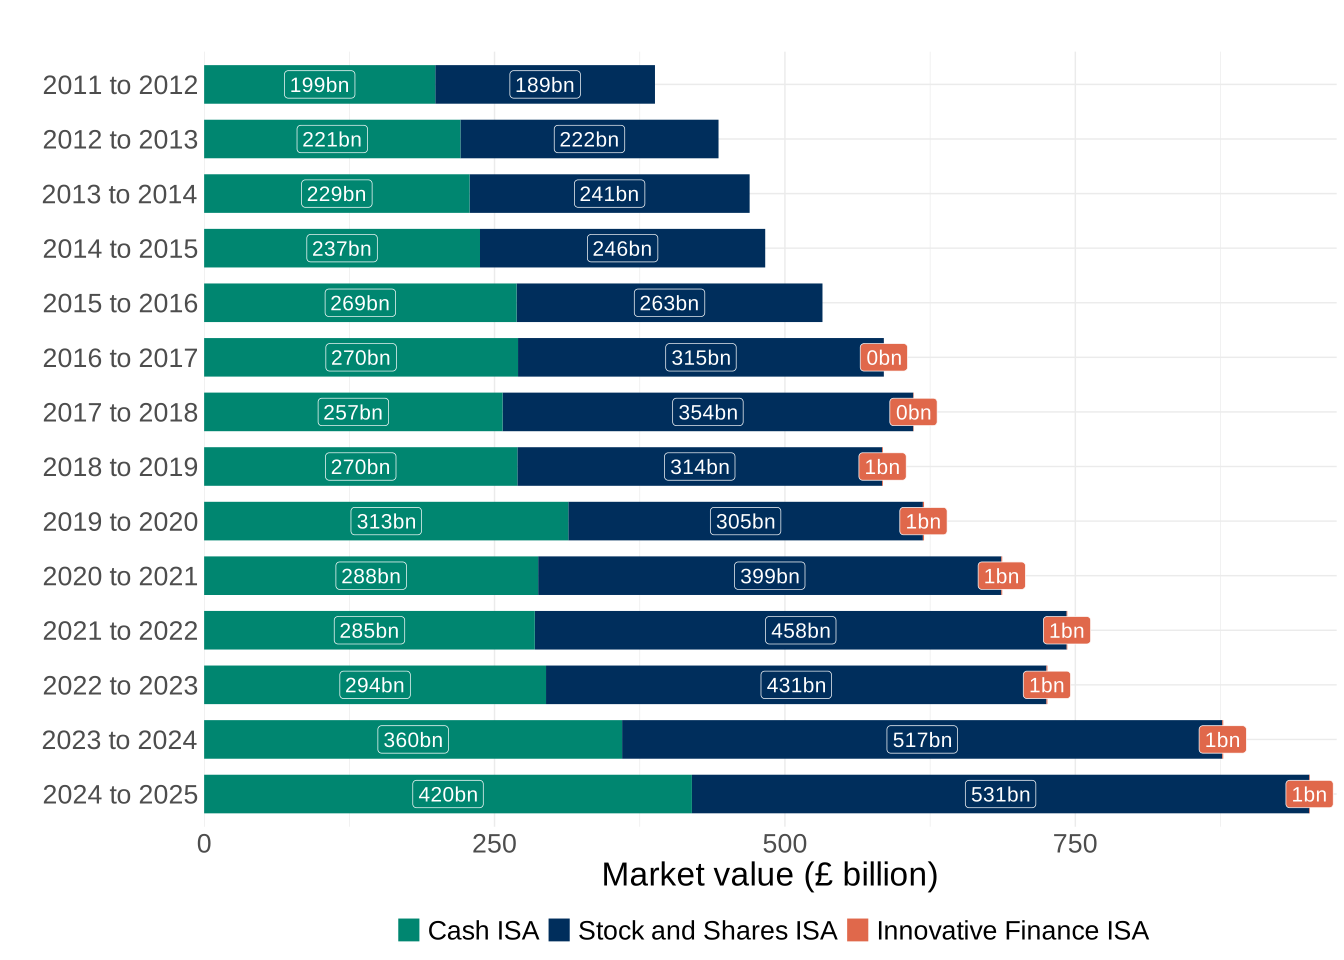
Chart 3 shows that at the end of 2024 to 2025 tax year, the market value of Adult ISA holdings stood at £952 billion. This is a 8.5% increase compared to the value at the end of 2023 to 2024. There was a 16.7% increase in the market value of funds held in Cash ISAs, and 2.9% increase for Stocks and Shares ISAs. Cash ISAs account for 44.1% of the market value, an increase from 41% in 2023 to 2024. Meanwhile, Stocks and Shares ISA holdings account for 55.8% of the market value of ISA funds, a decrease from 58.9% in 2023 to 2024.
Chart 3: Adult Cash, Stocks and Shares and Innovative Finance ISA market values per tax year
1.4 ISA holders by income (Charts use data from Tables 9.7 and 9.10)
Chart 4 shows details of the 23 million Adult ISA holders analysed by income band for the year 2023 to 2024. The median ISA holder (by income) had annual income of between £20,001 and £30,000. The average ISA market value of this income group was £34,575, representing a 9.6% increase in comparison to 2022 to 2023. At higher earnings levels, the number of ISA holders declines (due to fewer people in higher income bands), but is accompanied by a large increase in average ISA savings values. For ISA holders with income of £150,000 or more, the average market value was £103,315.
The number of ISA holders in 2023 to 2024 has risen to 23 million, from 21.3 million in 2022 to 2023. Due to the calibration done to equalise the individual and aggregate ISA returns received from providers, the reported number of ISA holders can fluctuate due to differences between these two datasets.
Chart 4: Number of ISA holders and average ISA market value by income band in 2023 to 2024
The income breakdowns have been expanded for this year’s publication and care must be taken when comparing to previous publications.
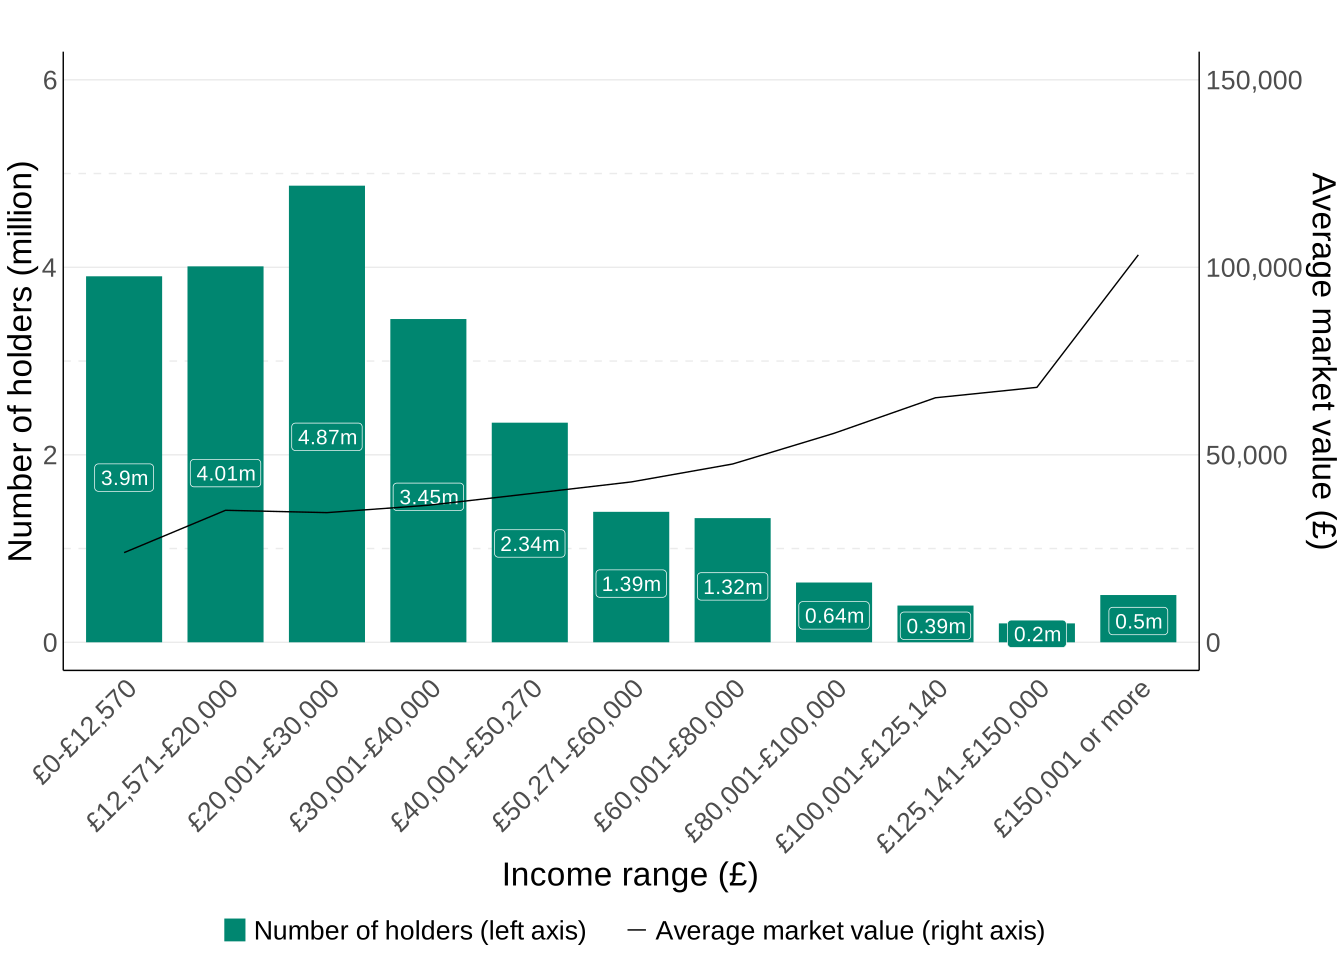
Chart 5 shows that the amount subscribed to an ISA increases with the income of the individual subscriber. 28.8% of the total subscribers saved at the maximum in 2023 to 2024, rising to 45.3% of those with income of £125,141 to £149,999, and to 62.5% of those with income of £150,001 or more. The highest proportion of savers, around 30.7%, saved between £1 and £2,499.
The chart suggests that some individuals may have contributed more to their ISAs than their annual earnings allow (such as those subscribing the maximum £20,000 with an income of less than £12,570). This may be possible where individuals have existing taxable savings that they are transferring into ISA accounts.
Alternatively, in households with more than one adult, earnings from one high income individual may enable other adults in the household to open an ISA account, in order to make the most use of the tax free allowance on their savings.
Chart 5: ISA subscriptions by income band and size of subscription in 2023 to 2024
The income and subscription amount breakdowns have been expanded for this year’s publication and care must be taken when comparing to previous publications. More granular subscription amount breakdowns can be found in the ISA tables published alongside this commentary.
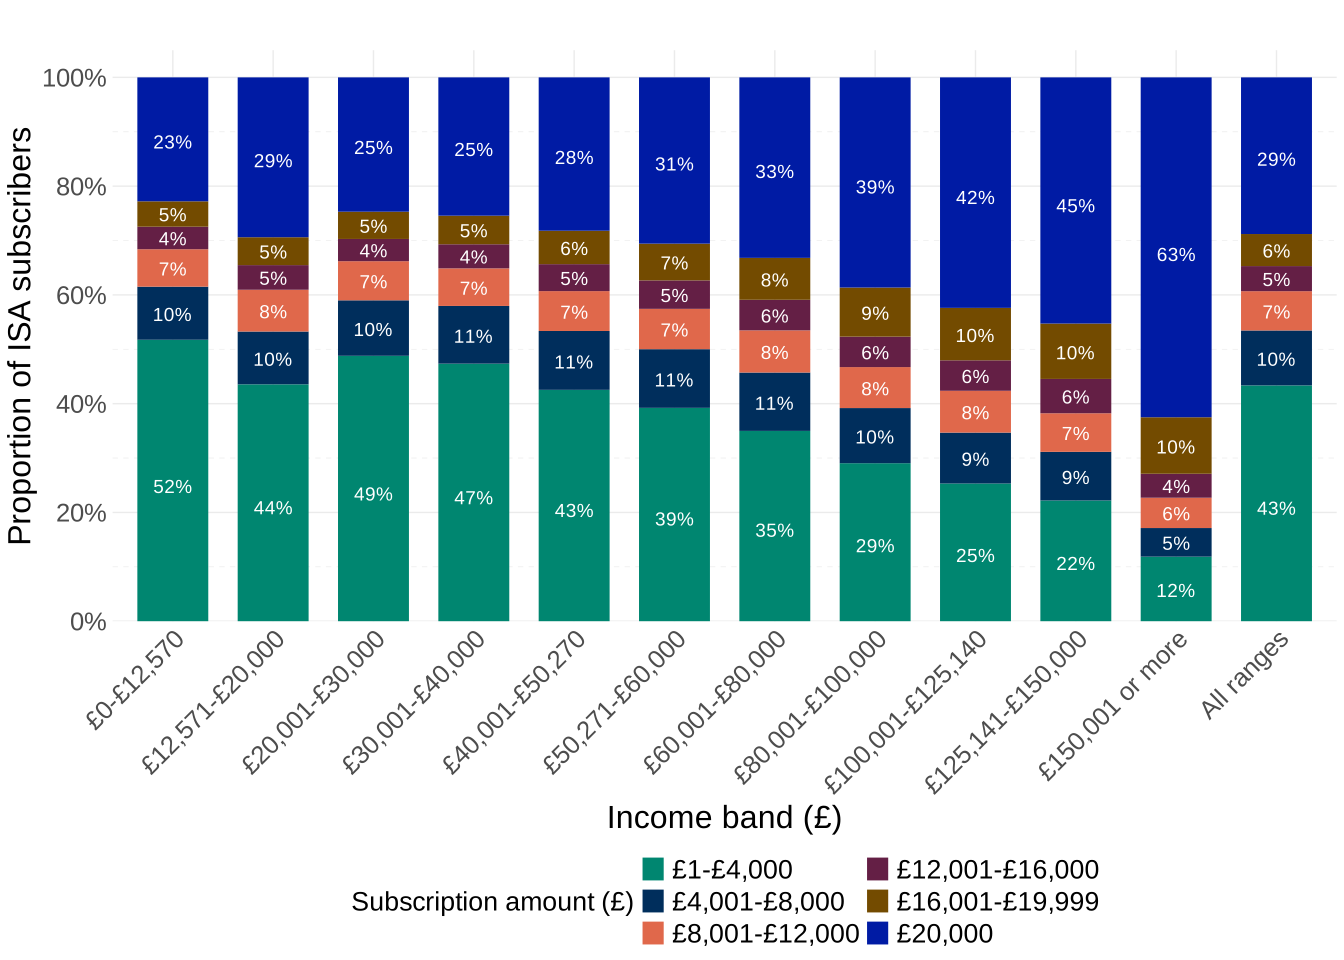
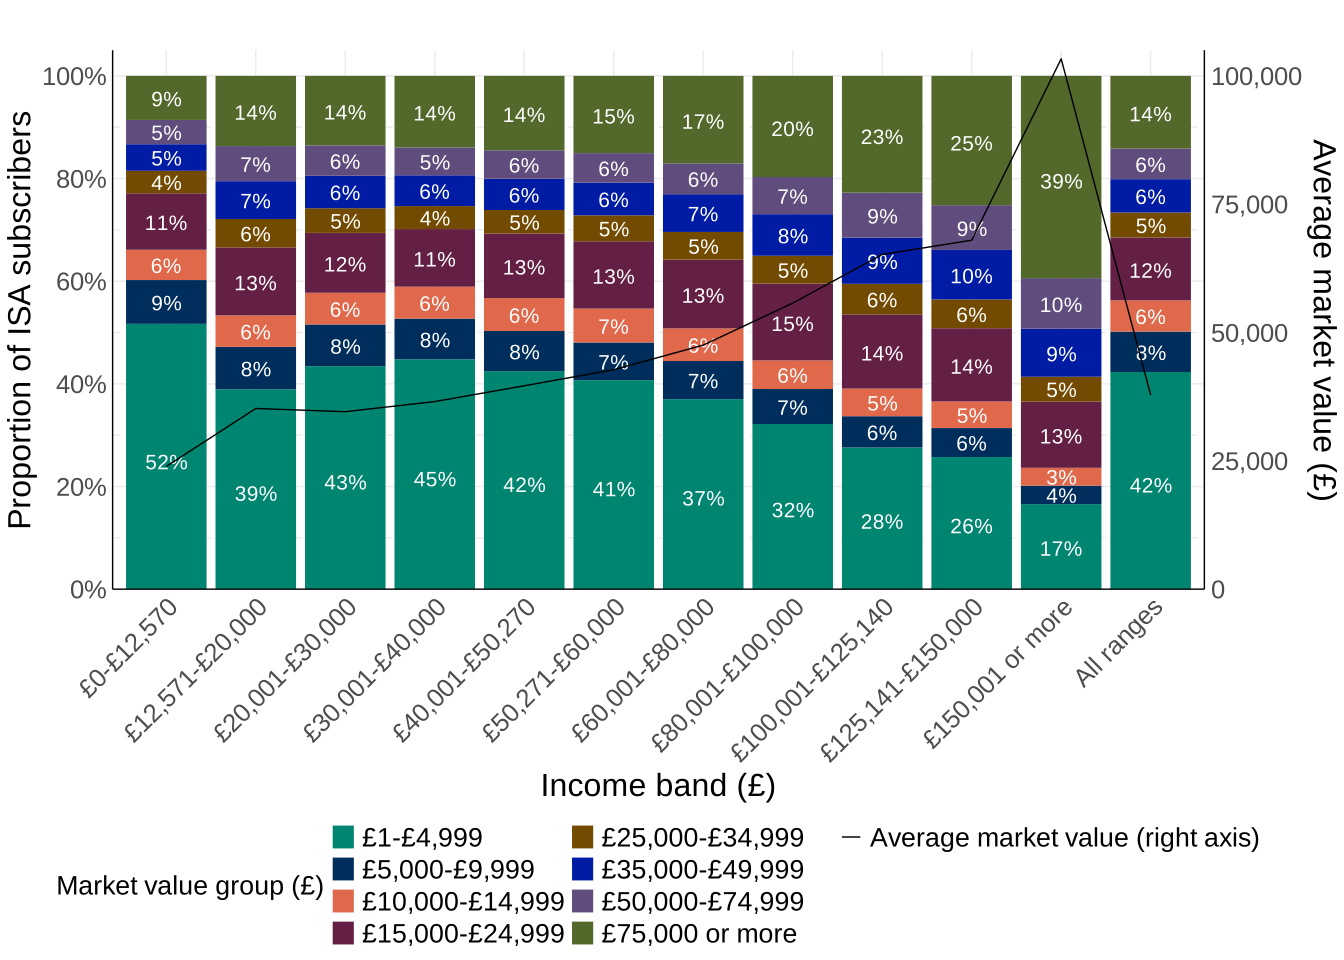
Chart 6 shows the proportion of ISA holders with different levels of ISA savings value across income bands. Amongst ISA savers with income of £150,001 or more, 39.4% have at least £75,000 in ISA savings, compared to just 8.6% of savers on an income below £12,571.
Chart 6: ISA holdings by income band and ISA market value in 2023 to 2024
The income and market value breakdowns have been expanded for this year’s publication and care must be taken when comparing to previous publications. More granular market value breakdowns can be found in the ISA tables published alongside this commentary.
1.5 ISA holders by age and sex (Charts use data from Tables 9.8 and 9.11)
Chart 7 illustrates the distribution of Adult ISA holdings across different age groups. The lowest number of ISA holders was in the youngest category (under 24), but approximately 67.8% of this group were active savers in 2023 to 2024.
The greatest number of ISA holders was in the 66 and over group. However, a large portion of this group (52.3%) were not active savers in 2023 to 2024.
Chart 7: Age distribution of ISA holders in 2023 to 2024
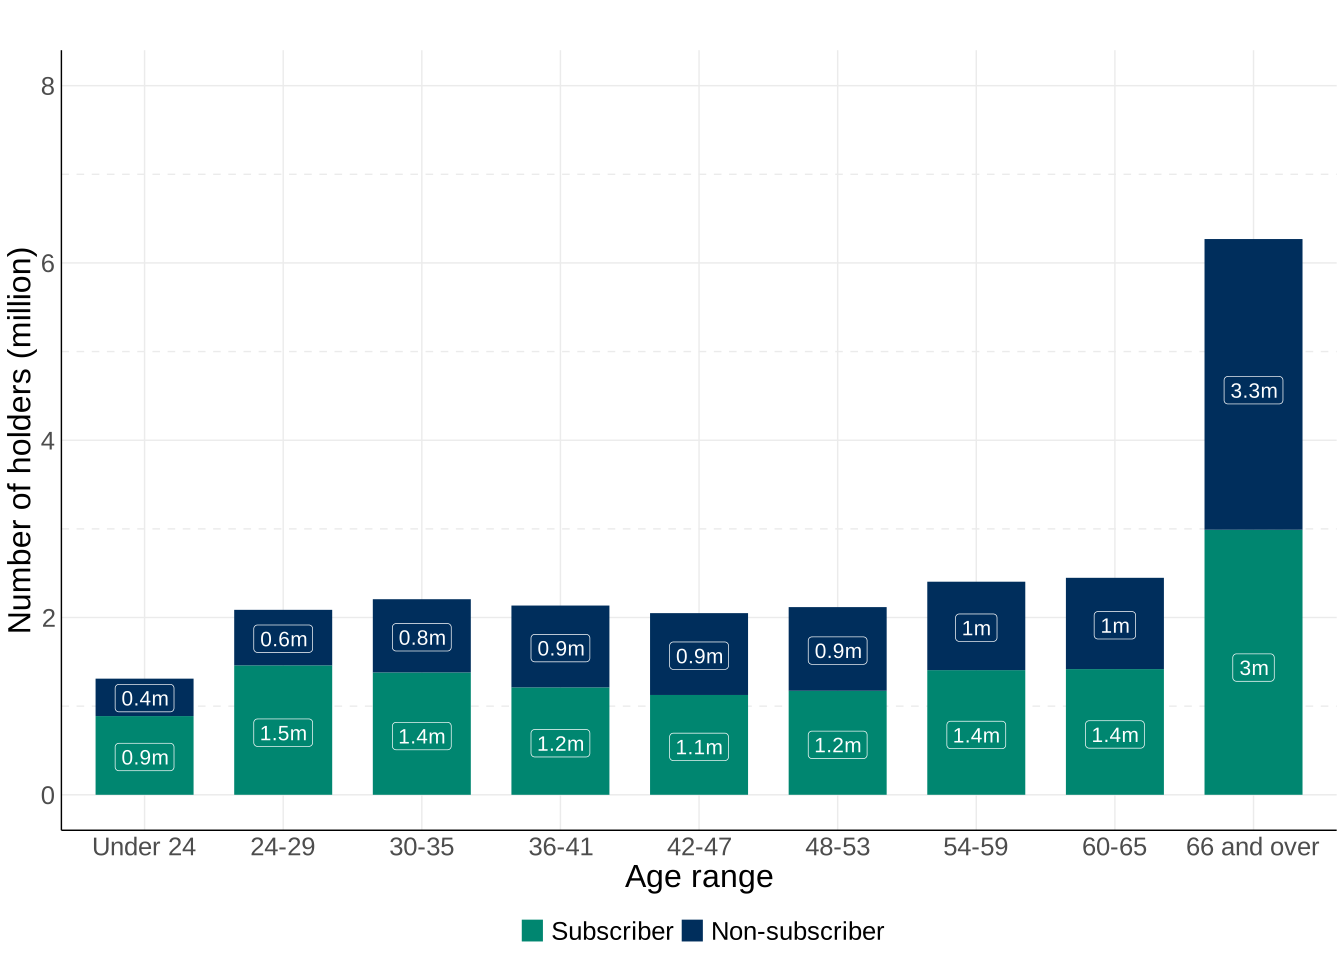
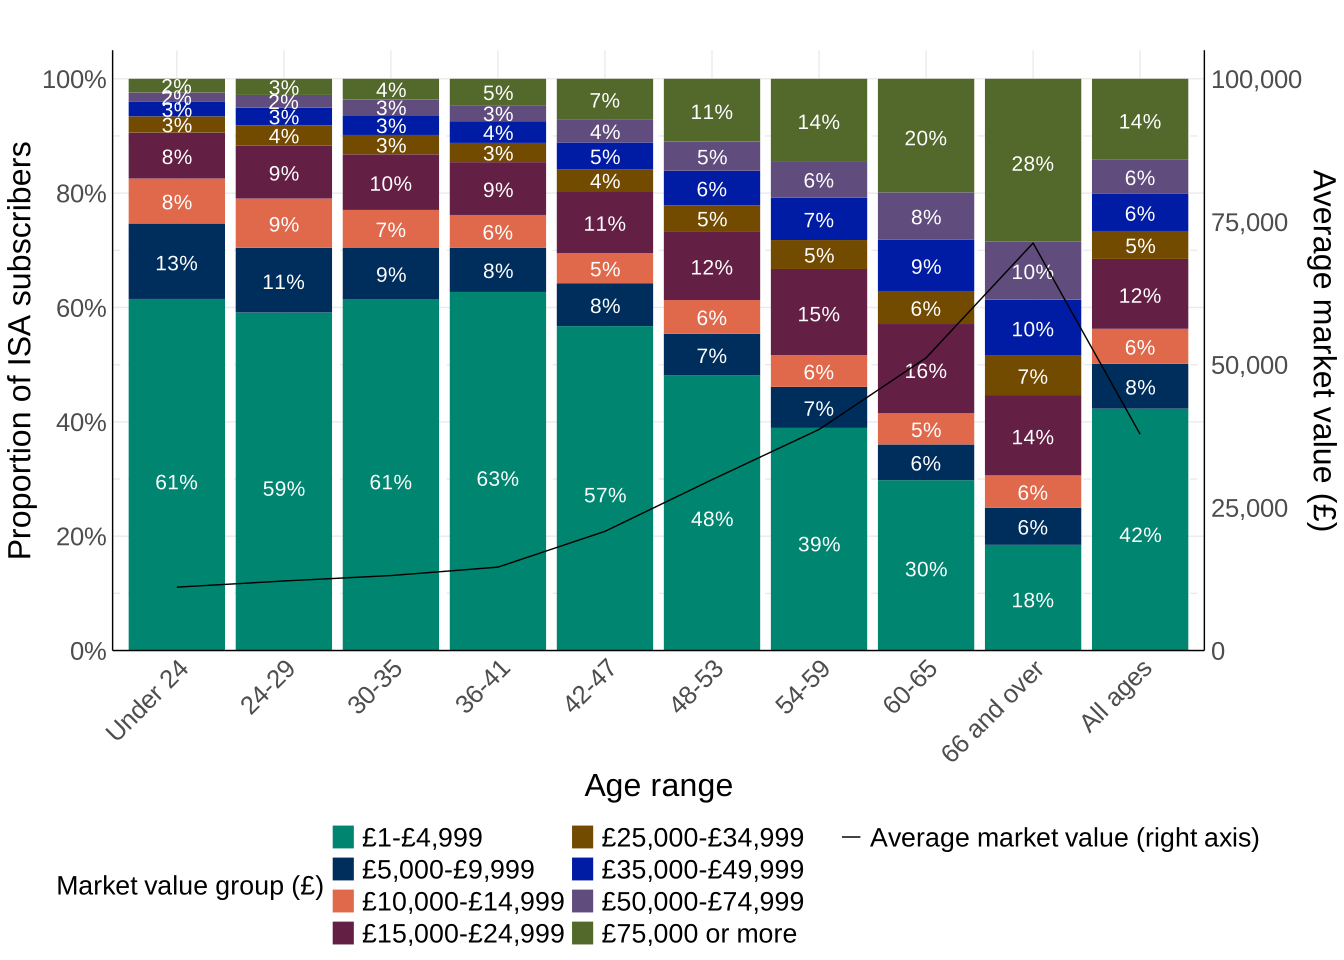
Chart 8 demonstrates the distribution of ISA subscribers across different age groups and market value groups (indicated by the coloured bands). The proportion of ISA holders with ISAs valued at £75,000 or more is highest amongst those aged 66 and above and lowest amongst those under 24.
The average ISA market value at the end of 2023 to 2024 was around £11,087 for the under 24. This is compared to around £71,272 in the 66 and over group.
Chart 8: ISA holdings by age range and ISA market value in 2023 to 2024
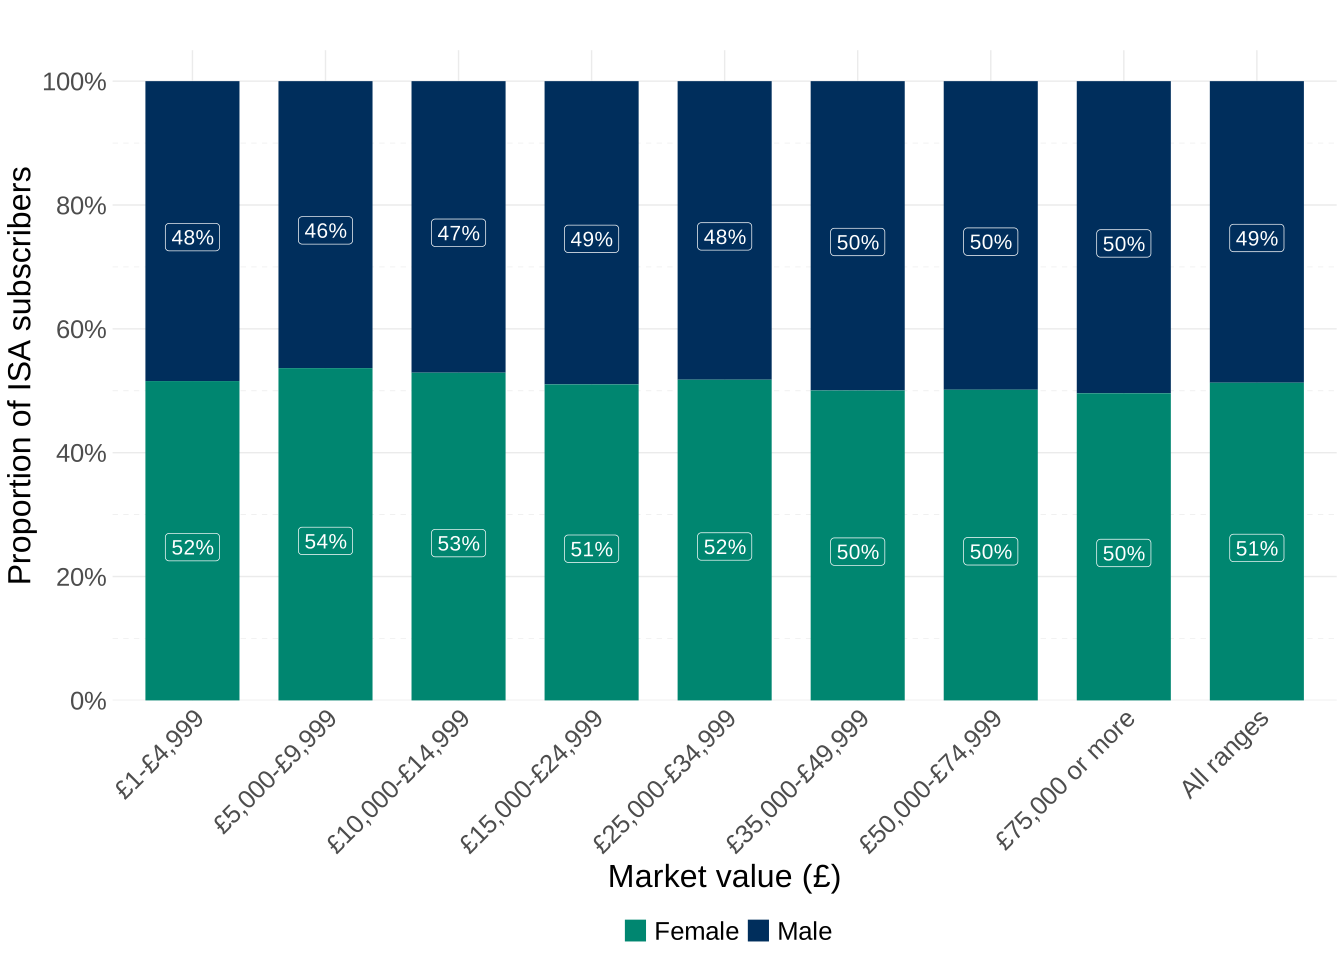
The sex split of total number of ISA holders is approximately equal. Chart 9 shows that in 2023 to 2024, females accounted for a marginally higher proportion of the total number of ISAs. Females accounted for 51.3% of all ISAs and 49.6% of ISA holdings worth £75,000 or more.
Chart 9: ISA savings by sex in 2023 to 2024
The market value breakdowns have been expanded for this year’s publication and care must be taken when comparing to previous publications. More granular market value breakdowns can be found in the ISA tables published alongside this commentary.
1.6 Geographical location of ISA holders (Charts use data from Table 9.9 and 9.12)
Chart 10 provides a breakdown of the percentage of ISA holders in England. The South West and South East regions have among the highest proportion of adults holding ISAs at 46.8% and 46.6% each, while North East, North West and Merseyside and London are at the bottom with 38-39% each.
Chart 10: Proportion of population with ISAs and average market value by English region in 2023 to 2024
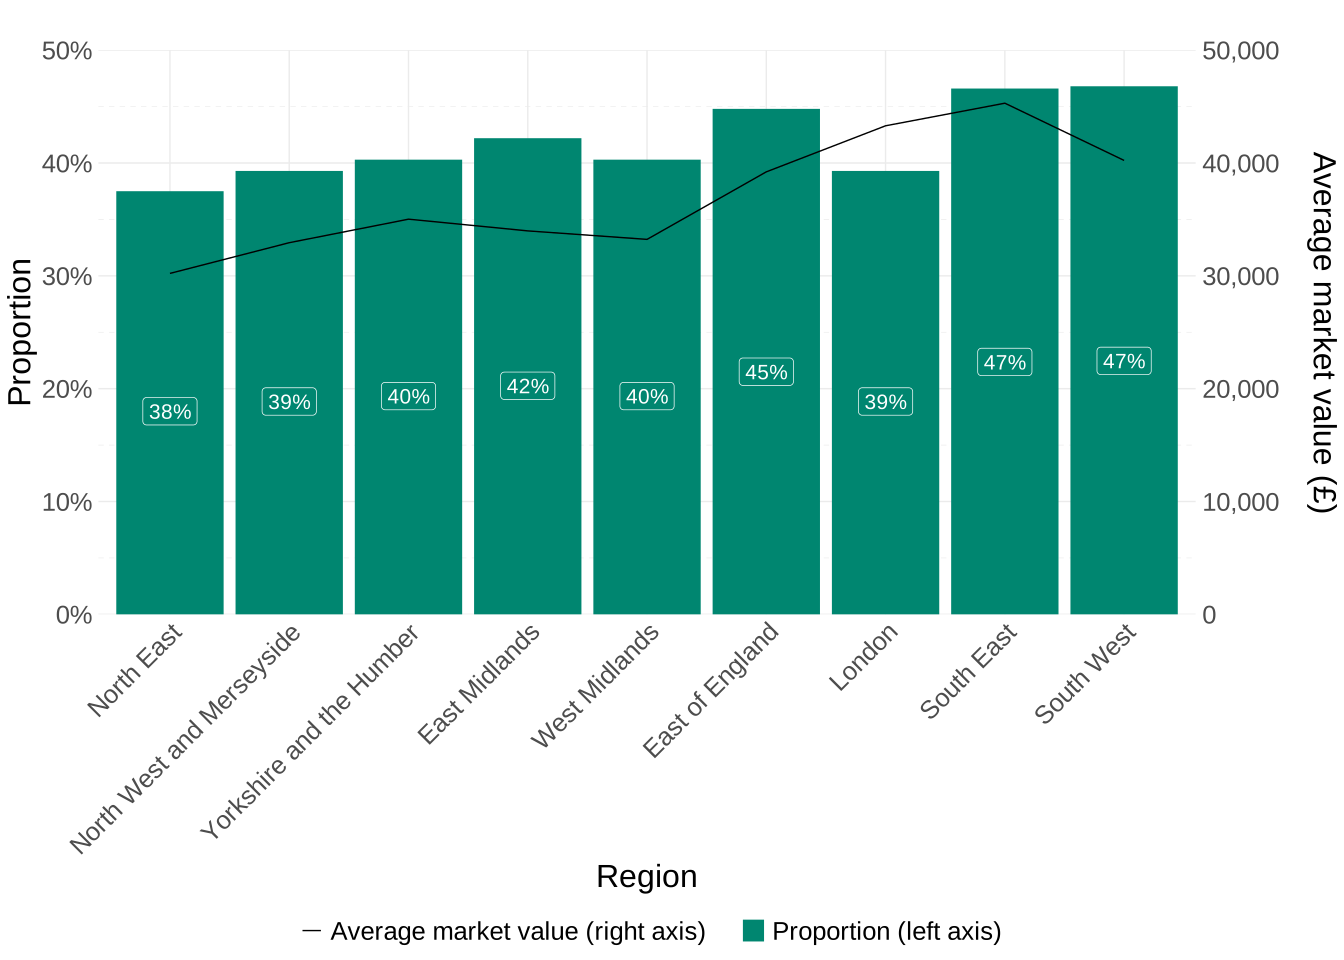
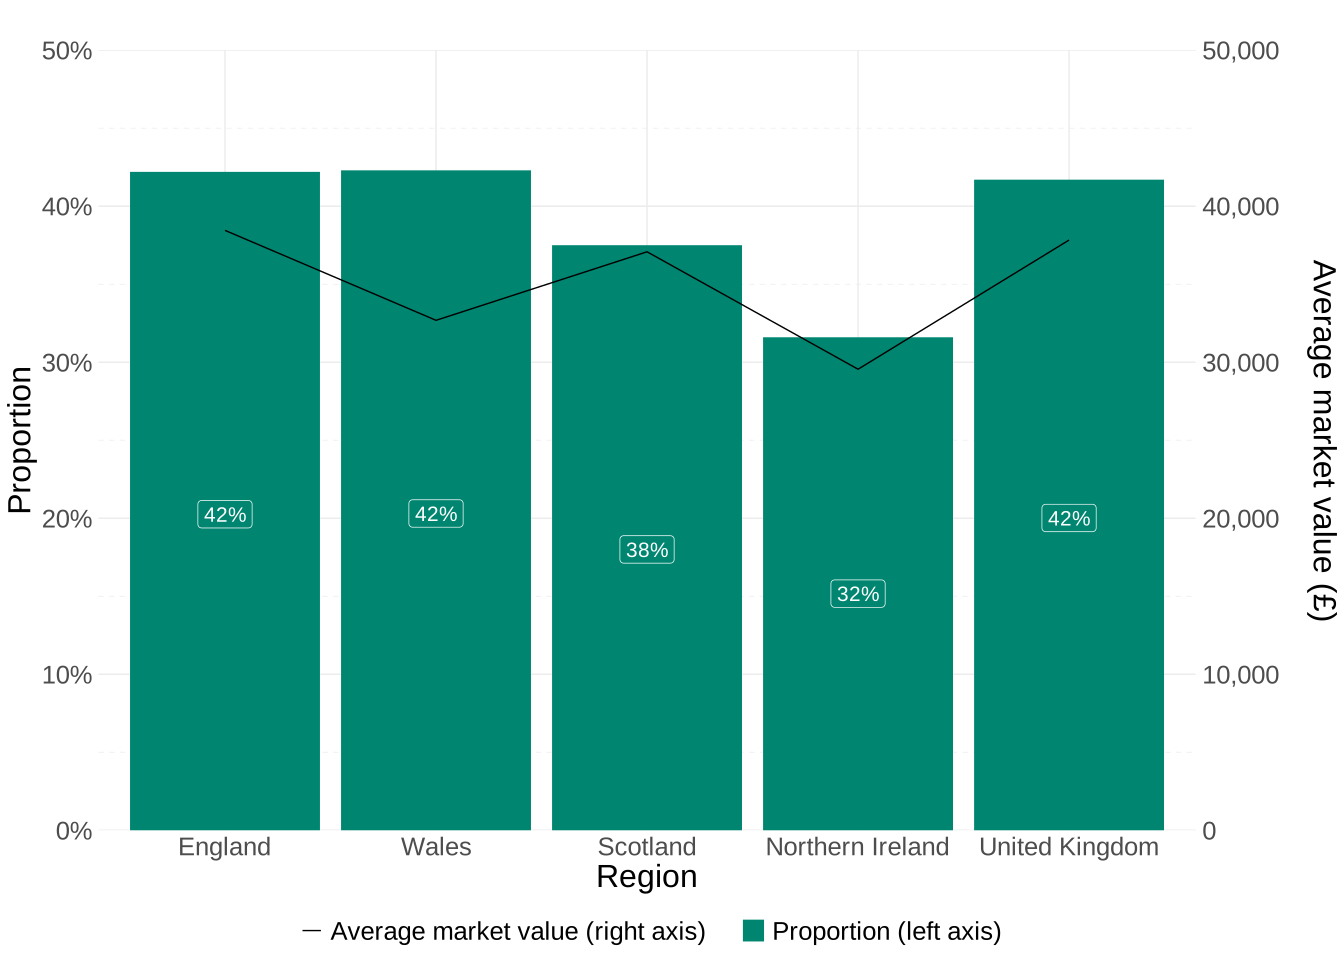
Chart 11 shows that at the end of 2023 to 2024, 42.2% of adults in England had an ISA. In comparison to 2023 to 2024, the proportion of ISA holders in the United Kingdom increased by 2.6%. Its average market value has also increased from £34,044 to £37,831, representing a growth of 11.1%. Similar to 2022 to 2023, England and Scotland have higher average market values than the rest of the United Kingdom.
Chart 11: Proportion of population with ISAs and average market value by UK region in 2023 to 2024
2. Lifetime Individual Savings Accounts (LISAs)
2.1 Withdrawals for a house purchase (Charts use data from Lifetime ISA Table 1a)
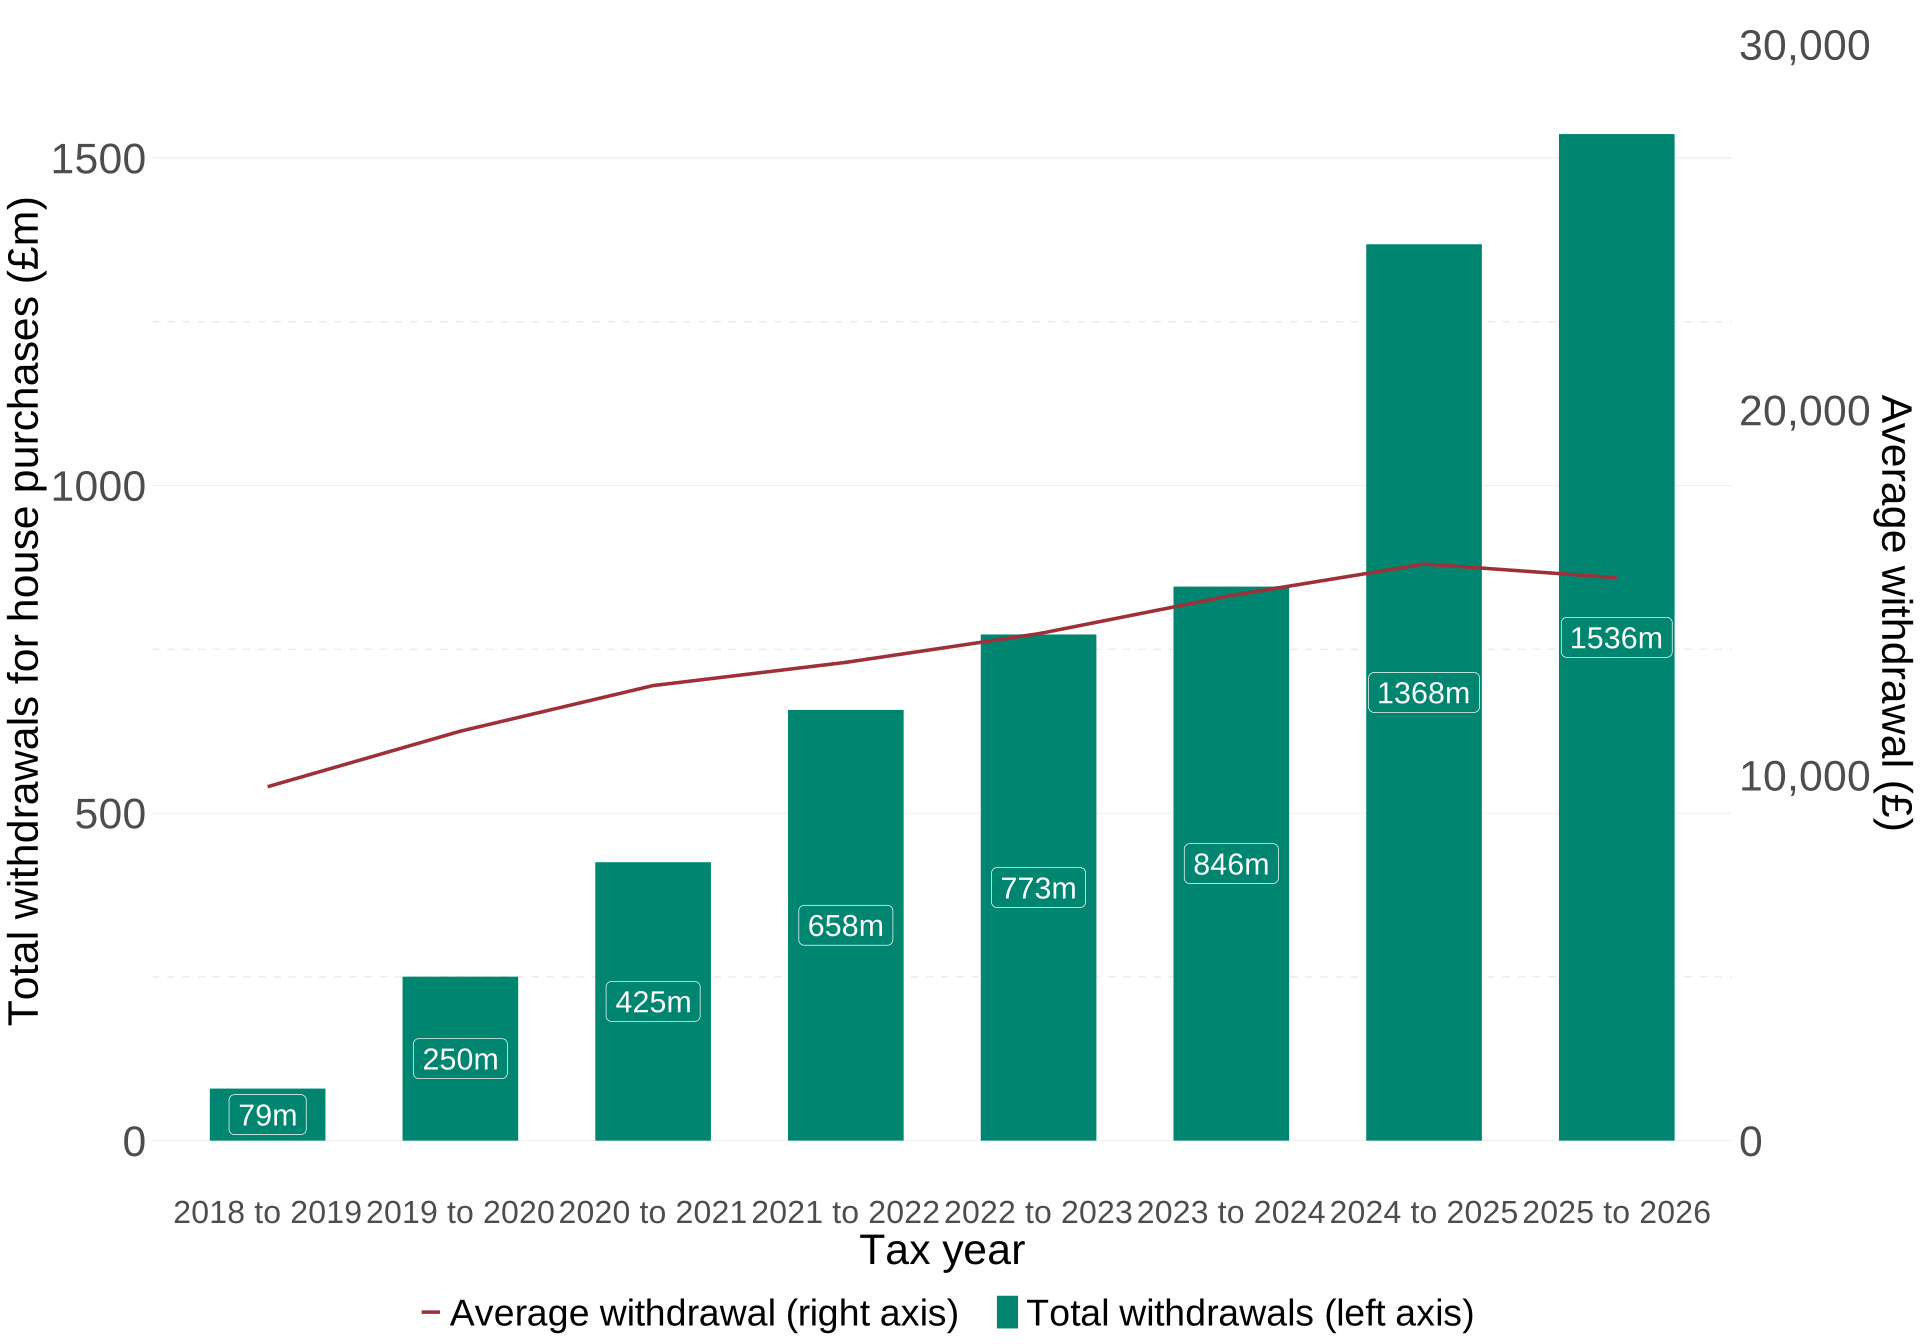
Chart 12 shows that 99,750 account holders withdrew from their Lifetime ISA in order to purchase a first time property in 2025 to 2026, an increase of around 13,050 on the previous tax year.
Chart 12: Number of individuals withdrawing for a house purchase
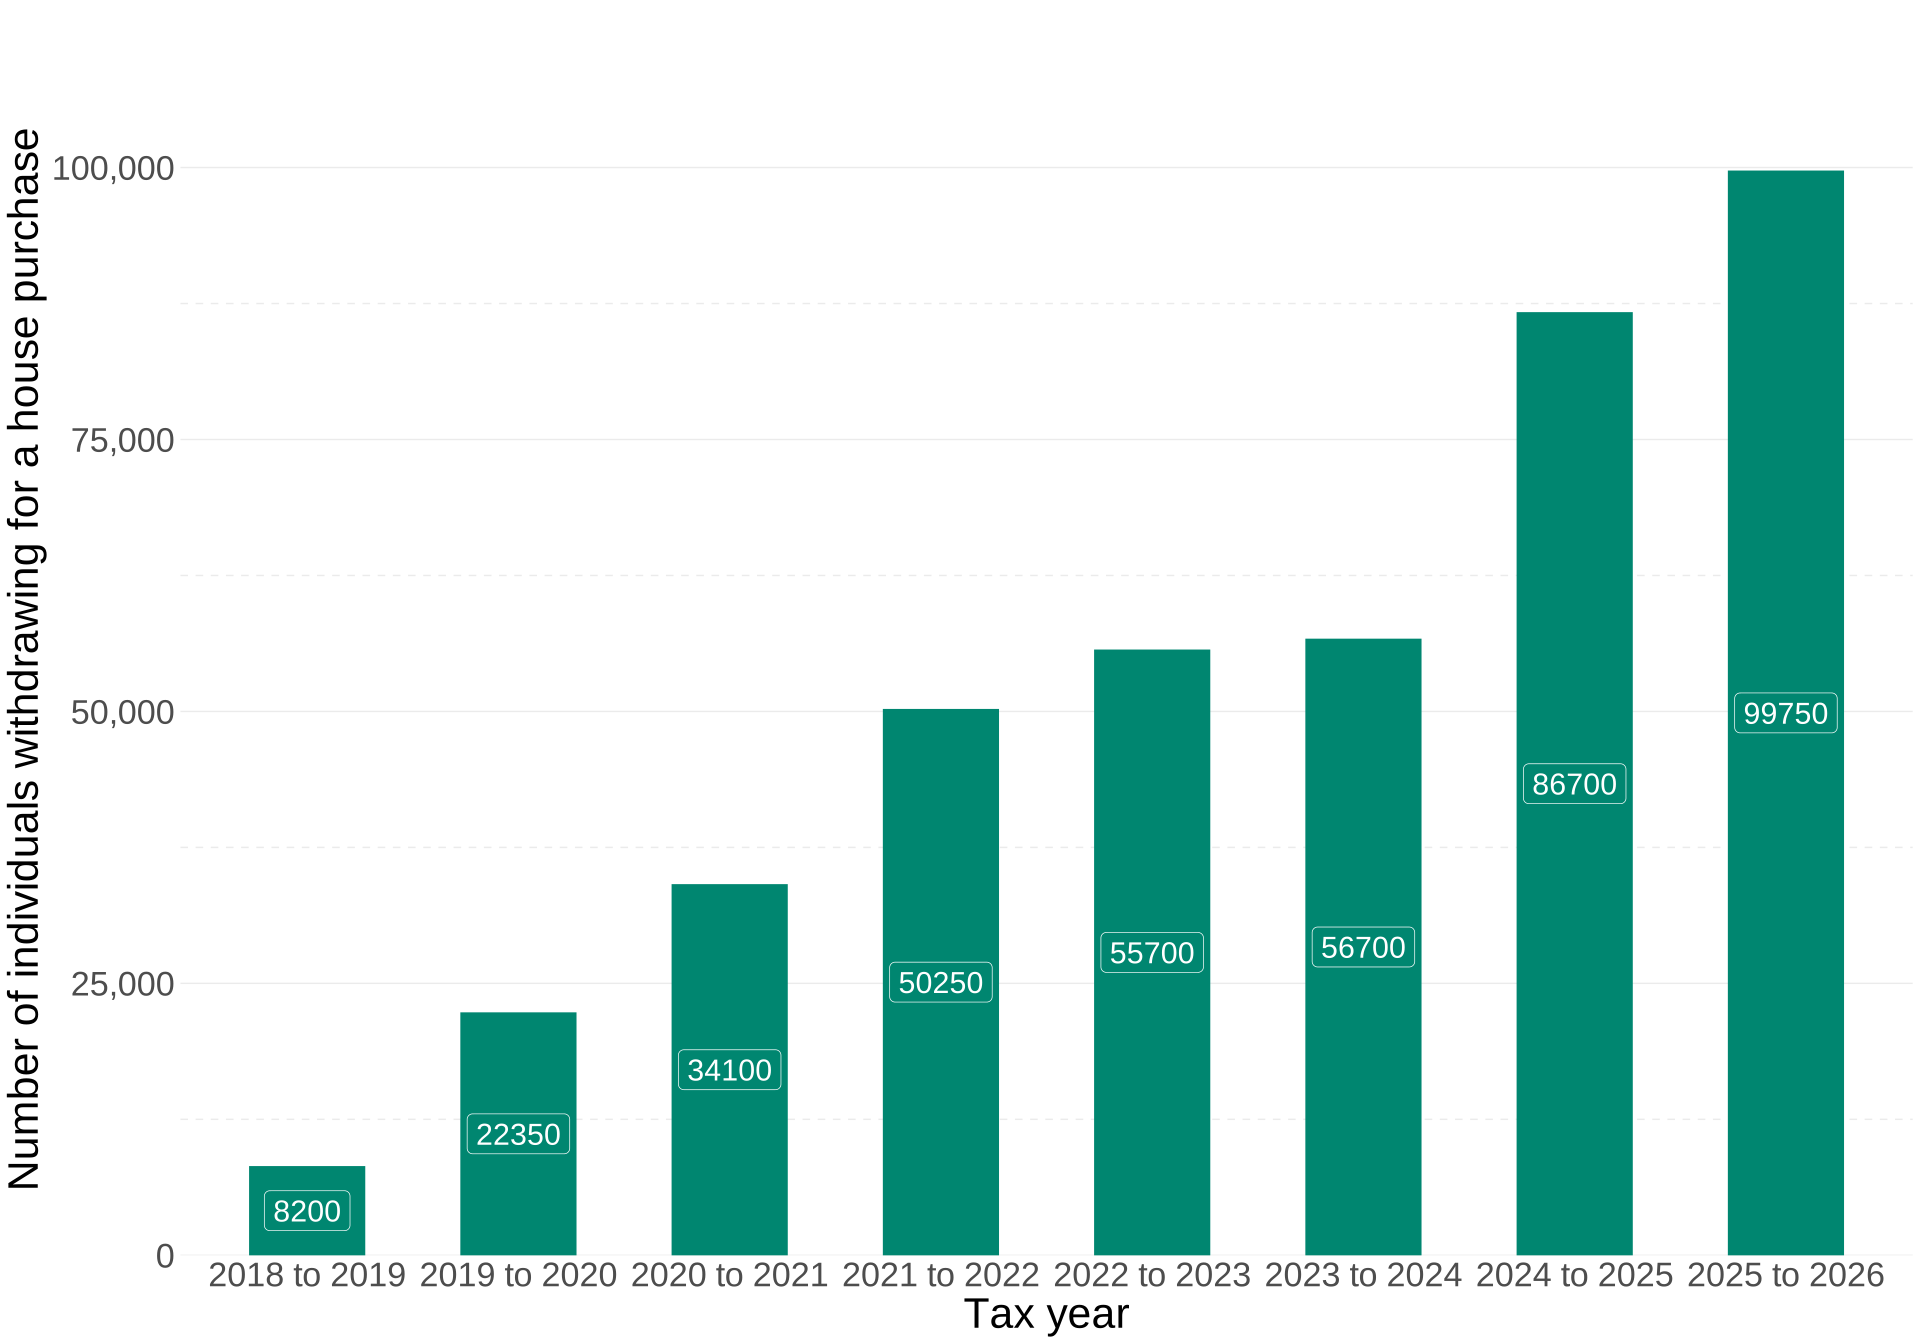
Chart 13 shows that the average withdrawal value for a house purchase was £15,407 for tax year 2025 to 2026. The average value of withdrawal for a house purchase has decreased by approximately £373 since the 2024 to 2025 tax year.
Chart 13: Value of withdrawals for a house purchase
3. Child Trust Funds
3.1 Number of CTF accounts
As of 5 April 2026, there were around 2.9 million open Child Trust Fund (CTF) accounts, of which around 827,000 were matured accounts continuing as CTF accounts. Around a further 415,000 accounts matured during the tax year 2025 to 2026 and were claimed or automatically transferred to an ISA. The number of open CTFs is decreasing, mainly due to matured accounts being claimed or transferred to ISAs, and accounts that have not yet matured being transferred to Junior ISAs.
The oldest children on the scheme turned 18 in September 2020. Between then and April 2026, around 3,784,000 accounts matured in total, of which around 2,958,000 were claimed or automatically transferred to an ISA as of April 2026.
3.2 Average market value of CTFs (Chart uses data from Table 1a)
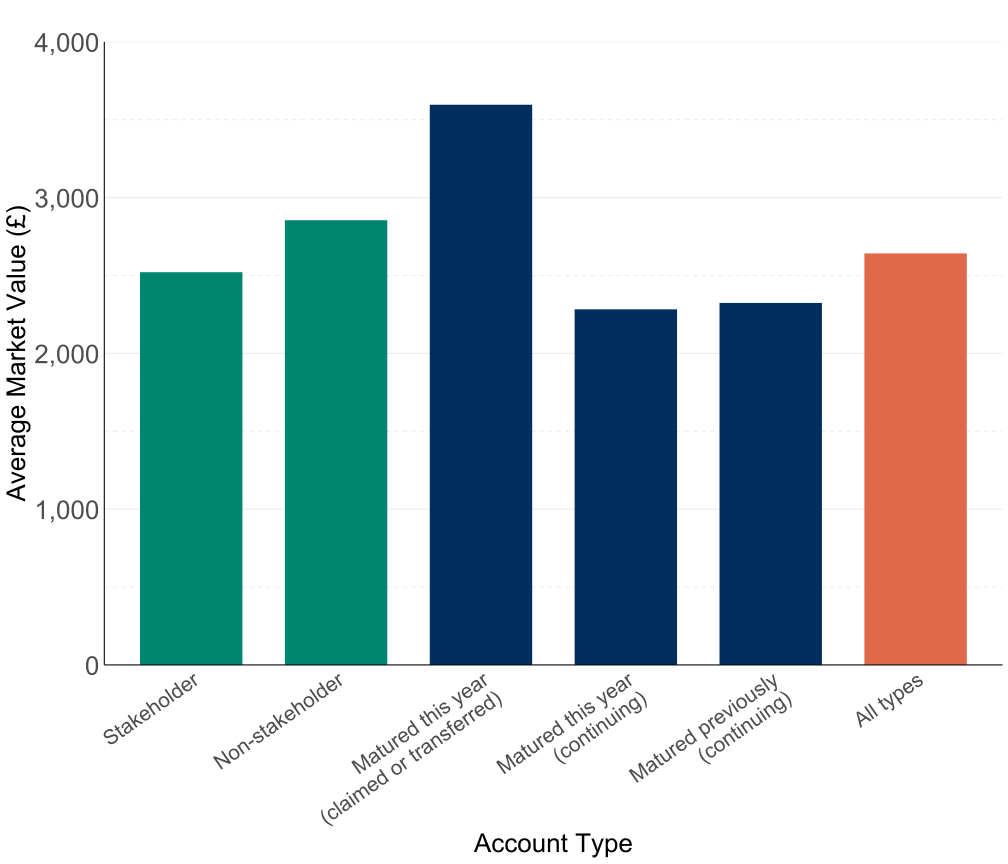
Chart 14 shows that the average market value of a CTF in April 2026 was £2,642. This is up from £2,242 in April 2025.
The average market value of stakeholder and non-stakeholder accounts as of April 2026 were £2,521 and £2,855, respectively. The average market value of a matured account that was claimed or automatically transferred to an ISA in 2025 to 2026 was £3,596. The average market value of a matured account that was continuing as a CTF as of April 2026 was £2,310.
Chart 14: Average market value of Child Trust Funds in 2025 to 2026
3.3 Amounts subscribed to CTFs (Chart uses data from Table 2a)
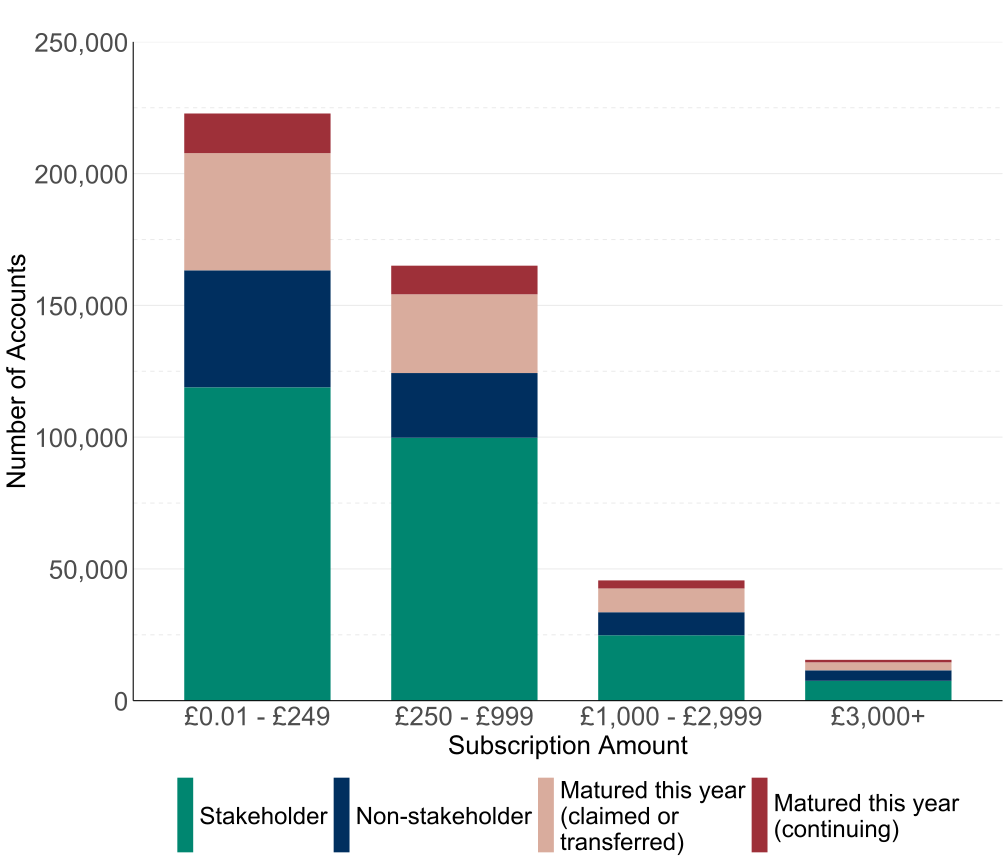
Chart 15 shows that in 2025 to 2026, as subscription amount increases, the number of individuals subscribing decreases. The majority of CTF subscriptions were in the £0.01 to £249 band, with 223,000 accounts having £0.01 to £249 subscribed to them in the tax year 2025 to 2026. The average subscription to stakeholder accounts was £605 whilst the average subscription to non-stakeholder accounts was £671. The average subscription across all CTFs was £619.
Chart 15: Child Trust Fund accounts by subscription amount in 2025 to 2026
4. Help to Save
4.1 Number of open Help to Save accounts (Chart uses data from Table 1)
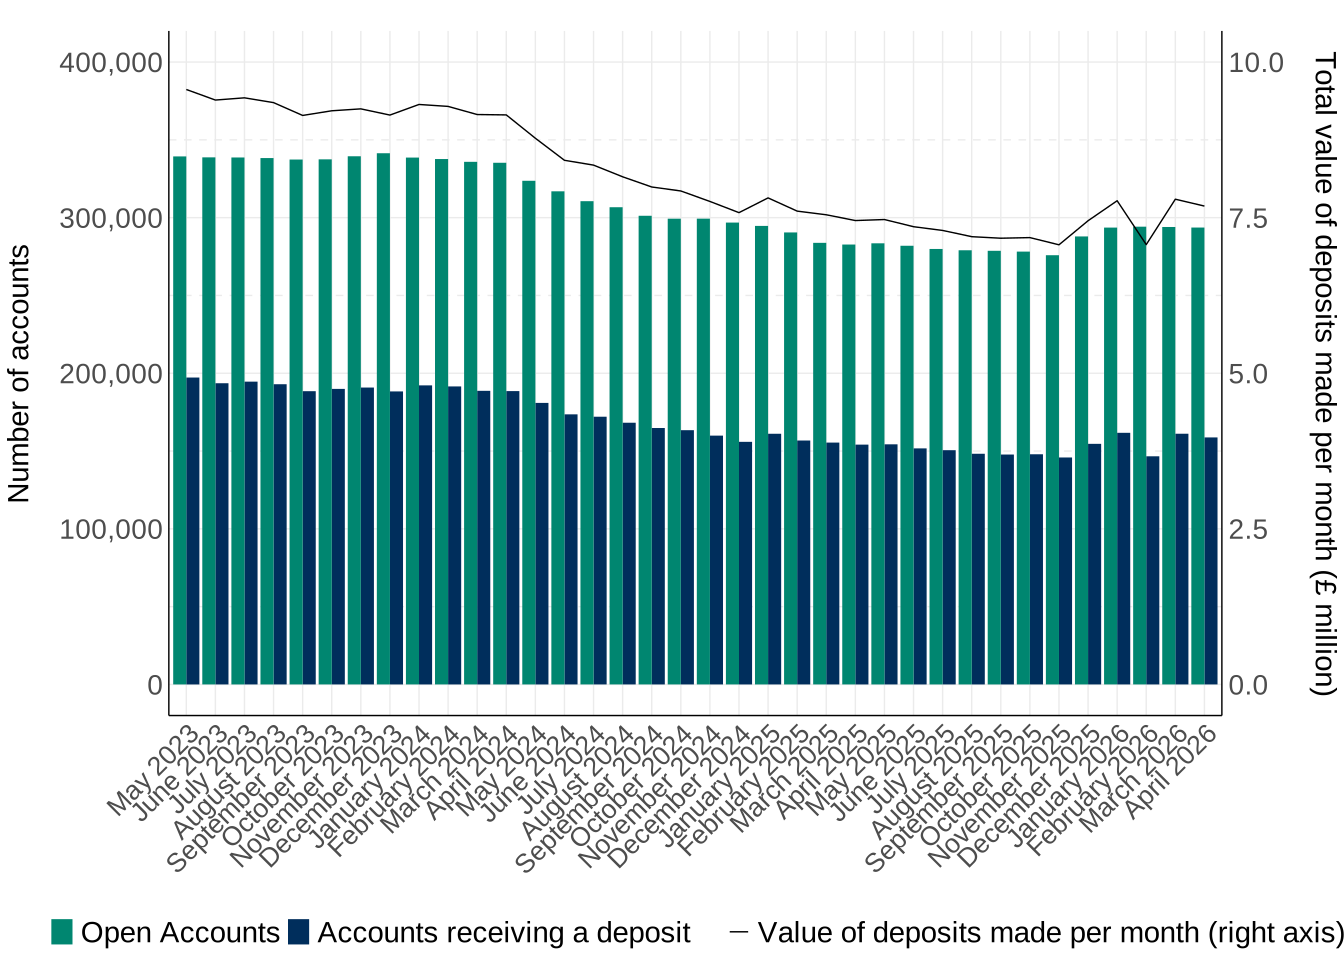
Chart 16 shows the number of Help to Save accounts that were open in each month between May 2023 and April 2026. It also shows the total number of accounts that received a deposit and the total value of deposits paid into accounts in each calendar month over this timeframe.
The total number of open Help to Save accounts was 293,600, as of April 2026. There has been a significant increase in the total number of accounts opened, where around 85,100 accounts were opened from April 2025 to March 2026, as compared to 55,750 accounts from April 2024 to March 2025. This might be a result of the expansion of the Help to Save scheme to all working UC claimants. Since the start of the scheme, 656,700 Help to Save accounts have been opened in total, as of April 2026.
This version of the release also contains statistics at the level of government office regions. Breakdowns by local authority district and parliamentary constituency level are not included in this release as HMRC has discontinued these breakdowns in response to feedback received in a statistical consultation. Please see the 2022 Annual Savings Statistics for the latest version of these tables.
4.2 Number of Help to Save accounts receiving deposits and the total value of deposit per month (Chart uses data from Table 1)
Since the start of the scheme, around 566,650 people have deposited into a Help to Save account. This is an increase of roughly 15% from March 2025. For those individuals making deposits, the average deposit per person per month has remained at £48; the maximum permitted monthly deposit is £50, with 94% of monthly deposits being the maximum. However, there are 38,600 open accounts that have still received no deposit.
Total deposits to the scheme in the 12-month period of April 2025 to March 2026 were around £88 million.
Chart 16: Total number of open Help to Save accounts, number of accounts receiving deposits per month, and total value of monthly deposits between May 2023 and April 2026
Source: HMRC data
4.3 Contact Information
The statistical contacts for this publication are:
-
N Attridge
-
L Carrick
-
J Everson
-
A How
-
B Kim
For press queries, please contact HMRC Press Office: newsdesk@hmrc.gov.uk