Alternative Claimant Count statistics January 2013 to November 2021
Published 18 January 2022
Applies to England, Scotland and Wales

© Crown copyright 2022
This publication is licensed under the terms of the Open Government Licence v3.0 except where otherwise stated. To view this licence, visit nationalarchives.gov.uk/doc/open-government-licence/version/3 or write to the Information Policy Team, The National Archives, Kew, London TW9 4DU, or email: psi@nationalarchives.gov.uk.
Where we have identified any third party copyright information you will need to obtain permission from the copyright holders concerned.
This publication is available at https://www.gov.uk/government/statistics/alternative-claimant-count-statistics-january-2013-to-november-2021/alternative-claimant-count-statistics-january-2013-to-november-2021
Find the latest release of these statistics in the collection of Alternative Claimant Count statistics.
This release of statistics is to 11 November 2021 and includes revisions to previous statistics. Figures are seasonally adjusted unless otherwise stated. Figures and rates from April 2020 onwards show higher levels of claimant unemployment given the impact of coronavirus and the UK government’s response.
The next statistical bulletin will be on 12 April 2022
Feedback and queries about the statistics can be sent by email to stats.consultation-2018@dwp.gov.uk
1. Main Stories
In the United Kingdom, the number of people claiming unemployment related benefits in November 2021 was 1.96 million.
This is a:
- 0.3% increase in the last month
- 1.9% decrease in the last quarter
- 29.3% decrease in the last year
- 49.6% increase in the last 5 years
Some claimants of unemployment related benefits are wholly unemployed and seeking work, others may be employed but with low earnings that make them eligible for unemployment related benefit support. Of the 1.96 million people claiming unemployment related benefits in November, 15.6% had evidence of earnings or hours worked. In comparison, this employment rate was 12.9% in November 2020 and 15.5% in November 2016.
In the latest quarter (September to November 2021) average monthly on-flows were 284 thousand and average monthly off-flows were 317 thousand. This is driving a small fall in the number of people claiming unemployment related benefits. Compared to pre-pandemic levels, both on-flows and off-flows remain substantially higher (207 thousand on-flows and 185 thousand off-flows monthly average September to November 2019).
The claimant unemployment rate (as a proportion of the population aged 16 to 64) in November 2021 was 4.7%. The rate has decreased by 1.9 percentage points from November 2020. In the five years from November 2016, the rate has increased by 1.5 percentage points.
Of the 1.96 million people claiming unemployment-related benefits in the United Kingdom in November 2021:
-
125,000 (6%) were claiming Jobseeker’s Allowance and 1.68 million (85%) were in the Searching for Work conditionality group under Universal Credit – the remaining 173,000 (9%) were ‘additionals’
-
1.13 million (57%) were male and 833,000 (43%) were female – in comparison, males represented 58% in November 2020
-
310,000 (16%) were young people aged 16 to 24 – this compares to 511,000 (18%) in November 2020, and 209,000 (16%) in November 2016
At regional level:
- the highest claimant unemployment rate in November 2021 was for London at 6.3%
- the lowest was for the South West at 3.5%
- all regions saw claimant unemployment rates fall over the year
At local authority level (figures not seasonally adjusted):
- the claimant unemployment rate ranges from 1.6% in the Orkney Islands to 9.3% in Birmingham
- all local authorities saw a decrease in the claimant unemployment rate between November 2020 and 2021 (with the exception of City of London where the caseload is small).
2. What you need to know
The Alternative Claimant Count measures the number of people claiming unemployment related benefits. Before 2013 this was simply the number of people claiming Jobseeker’s Allowance. However, since the introduction of Universal Credit from April 2013 the count began to incorporate Universal Credit claimants placed in the ‘Searching for Work’ conditionality group.
Under Universal Credit, a broader span of claimants are required to look for work than under Jobseeker’s Allowance. This is a feature of the design of Universal Credit which assigns claimants to conditionality groups that translate to the work-related tasks the individual must do in order to fulfil entitlement conditions. The Searching for Work conditionality group comprises people who are not working, or have very low earnings. The claimant is therefore required to take action to secure work or better paid work. Including these claimants has the effect of increasing the Office for National Statistics (ONS) measure of the Claimant Count irrespective of how the economy performs.
To address this, these Alternative Claimant Count statistics measure the number of people claiming unemployment related benefits by modelling what the count would have been if Universal Credit had been fully rolled out since 2013 (when Universal Credit began) with the broader span of people this covers, comprising:
- Jobseeker’s Allowance
- Universal Credit – Searching for Work conditionality (excluding those on the health journey pre-Work Capability Assessment)
- Estimates of those additional claimants who would have been Searching for Work under Universal Credit had it existed over the entire time period from 2013
The Alternative Claimant Count series starts from January 2013. Over a longer period, the Labour Force Survey provides a consistent measure of unemployment at national and regional level. Trends over time for local areas can be considered using the Claimant Count prior to 2013, and the Alternative Claimant Count from 2013. However, the figures cannot be directly compared as they are defined differently.
Claimant unemployment has been falling over the last year
Comparisons between Alternative Claimant Count, ONS Claimant Count and Labour Force Survey, United Kingdom, November 2006 to November 2021, seasonally adjusted.
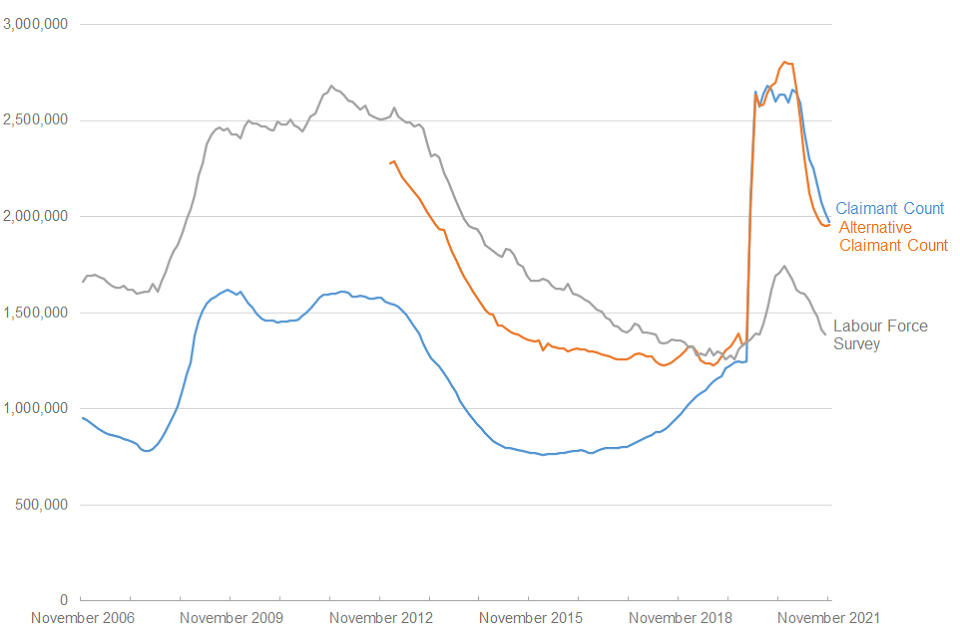
Source: DWP Alternative Claimant Count statistics and ONS Claimant Count statistics and Labour Force Survey.
To understand the impact of the differences between the two measures, Newcastle-upon-Tyne (which was one of the first local authorities to roll out Universal Credit Full Service to new claimants in May 2016) shows a sharp rise in claimant unemployment as more people were brought into Searching for Work conditionality. But this was irrespective of changes in the local labour market and gave misleading rises in local unemployment estimates, which the Alternative Claimant Count controls for and shows a much flatter trend.
DWP Alternative Claimant Count controls for the rollout of Universal Credit
Newcastle-upon-Tyne local authority – Claimant Count and Alternative Claimant Count comparisons, November 2013 to November 2021, not seasonally adjusted.
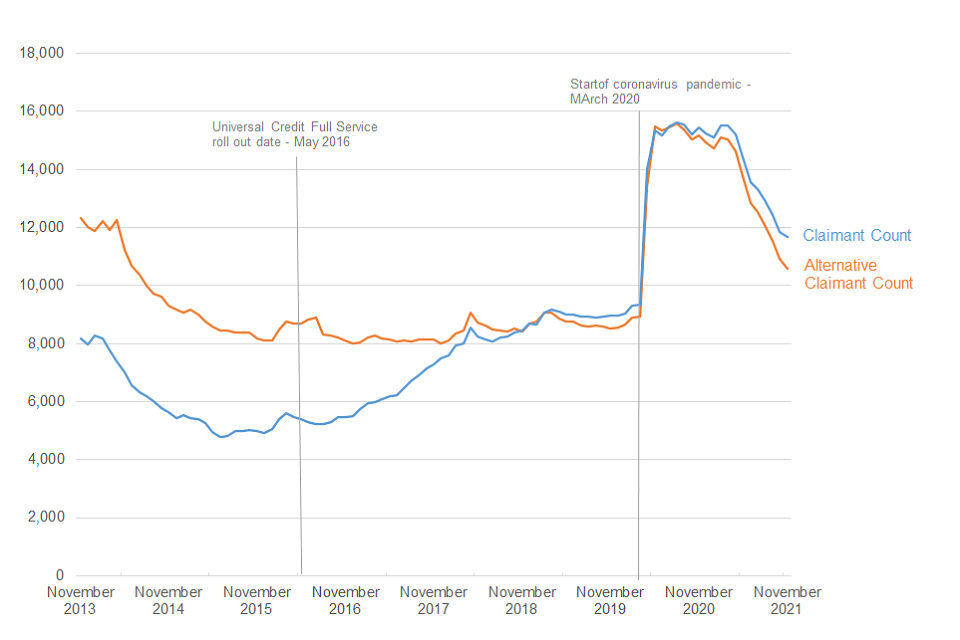
Source: DWP Alternative Claimant Count statistics and ONS Claimant Count statistics.
It is possible that the Claimant Count can surpass the Alternative Claimant Count in local areas, most usually areas where Universal Credit had been rolled out early. The Alternative Claimant Count includes estimates of those additional claimants who would have been Searching for Work under Universal Credit had it existed over the entire time period from 2013, but removes claimants on the health journey pre-Work Capability Assessment. Initially, this will cause the Alternative Claimant Count to show larger figures than the Claimant Count, as there will be more additional claimants included than health journey cases removed. However, as Universal Credit rolls out over time and the additional claimants begin to transition to Universal Credit, this weighting begins to shift.
Compared to the ONS Claimant Count, the alternative series provides a more consistent measure of trends in national and local levels of claimant unemployment over time irrespective of the rollout of Universal Credit. The ONS Claimant Count continues to provide an accurate count, at a point in time, of the number of people claiming unemployment related benefits.
Enhancements to Universal Credit as part of the UK government’s response to the coronavirus mean that an increasing number of people became eligible for unemployment-related benefit support, although still employed. Consequently, changes in the Claimant Count may not be due wholly to changes in the number of people who are unemployed.
National and regional figures are seasonally adjusted. The purpose of this is to remove systematic calendar-related variation associated with the time of the year which could otherwise cause misinterpretation of trends within the data. This facilitates comparisons between consecutive time periods, rather than just year-on-year. Our approach to seasonal adjustment is consistent with the approach used by ONS for the Claimant Count. About these statistics contains more information about the process used.
Figures in this bulletin are rounded in accordance with the DWP rounding policy for statistics. Perturbed figures from the underlying data available on Stat-Xplore or in accompanying tables may not sum exactly to the rounded totals accordingly.
3. United Kingdom
In the United Kingdom, the number of people claiming unemployment related benefits in November 2021 was 1.96 million. This is a decrease of 29.3% from November 2020.
Following a large increase from March 2020, primarily linked to the coronavirus pandemic and the UK government’s response, overall numbers of claimants on unemployment related benefits have generally been falling since the start of 2021.
At November 2021, over 4 in 5 claimants of unemployment benefits were covered by the Universal Credit Searching for Work conditionality group (85%). In comparison, at November 2020 82% were in this group. As managed migration to Universal Credit continues, this rate will continue to rise whilst the rates for the other groups will continue to fall.
Numbers claiming unemployment related benefits have been falling while the proportion of Universal Credit claimants continue to rise
Number of people claiming unemployment related benefits by type of claimant, United Kingdom, November 2013 to November 2021, seasonally adjusted.
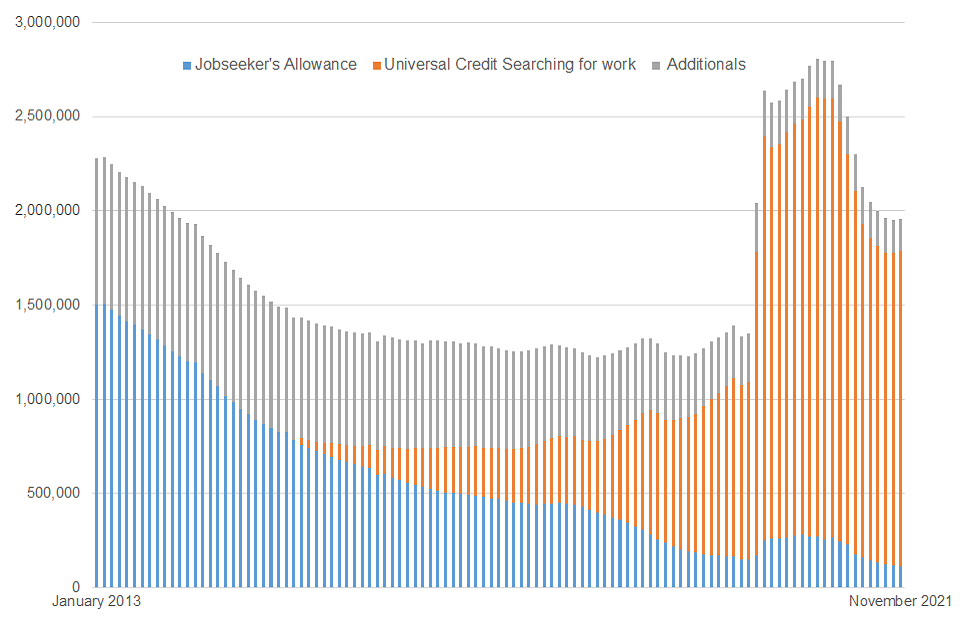
Source: DWP Alternative Claimant Count statistics.
The overall rate of people claiming unemployment related benefits as a proportion of the resident population aged 16 to 64 in November 2021 was 4.7%, a fall of 1.9 percentage points compared to November 2020 (6.6%) and a rise of 1.5 percentage points compared to November 2016 (3.2%).
Rates of people claiming unemployment related benefits have fallen over the last year
Monthly claimant unemployment rate by gender, United Kingdom, November 2013 to November 2021, seasonally adjusted.
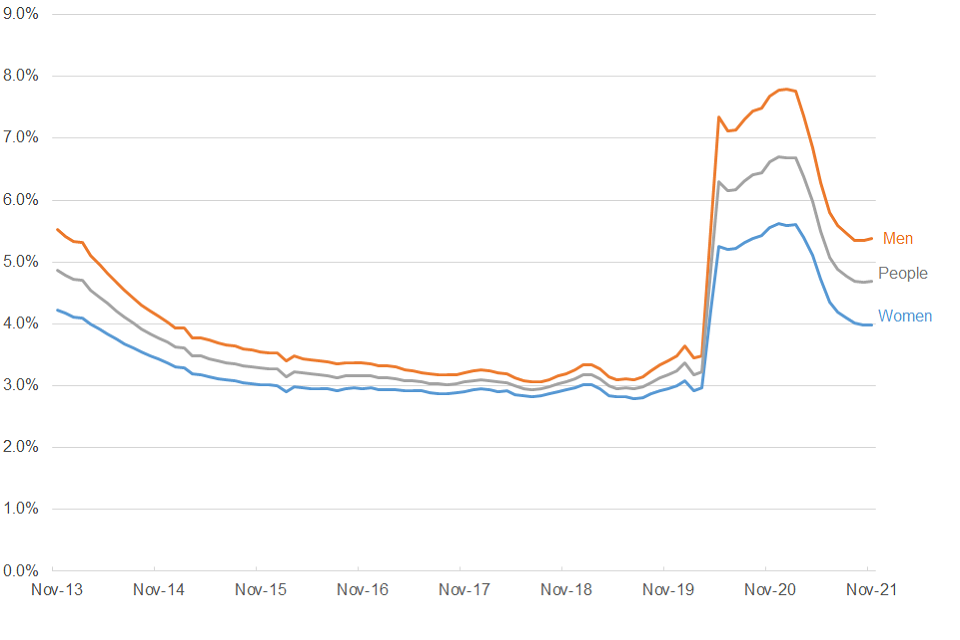
Source: DWP Alternative Claimant Count statistics and ONS Claimant Count population statistics.
Gender
Although overall rates are falling, male claimants make up a greater proportion of unemployment related benefits. In 2013, 57% of claimants were male. Over time, that proportion began to gradually decrease to around 52% in 2018 but then increased sharply at the start of the coronavirus pandemic (58% in May2020). At November 2021, men account for 57% of people on unemployment related benefits.
Male claimants make up a greater proportion of people claiming unemployment related benefits
Number of people claiming unemployment related benefits by gender, United Kingdom, November 2013 to 2021, seasonally adjusted.
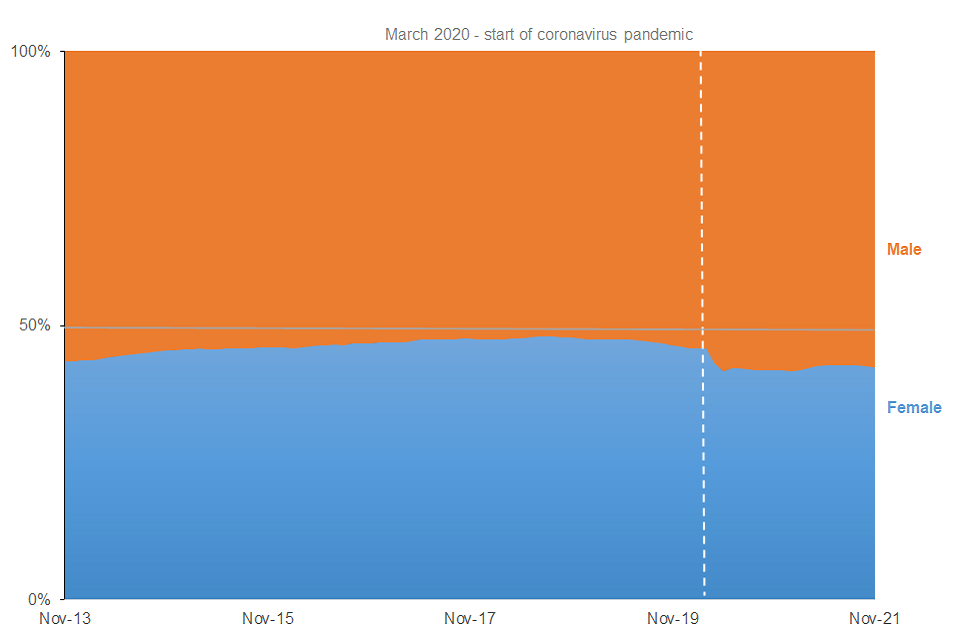
Source: DWP Alternative Claimant Count statistics.
Age
Over the last year, all age groups have seen a fall in claimant unemployment. The biggest falls have been in the 20 to 24 and 25 to 29 age groups – these groups experienced the largest increases during the coronavirus pandemic. Because of this, there has been an upward shift in the age distribution of claimants on unemployment related benefits over the year. The proportion of claimants aged 16 to 29 has fallen from 32% at November 2020 to 29% in November 2021. Over this period, the proportion aged 30 to 44 increased from 35% to 38%.
Those aged 30 to 44 make up a greater proportion of people claiming unemployment related benefits compared to the same time last year
Proportion of people claiming unemployment related benefits by age group, United Kingdom, November 2020 and 2021, seasonally adjusted.
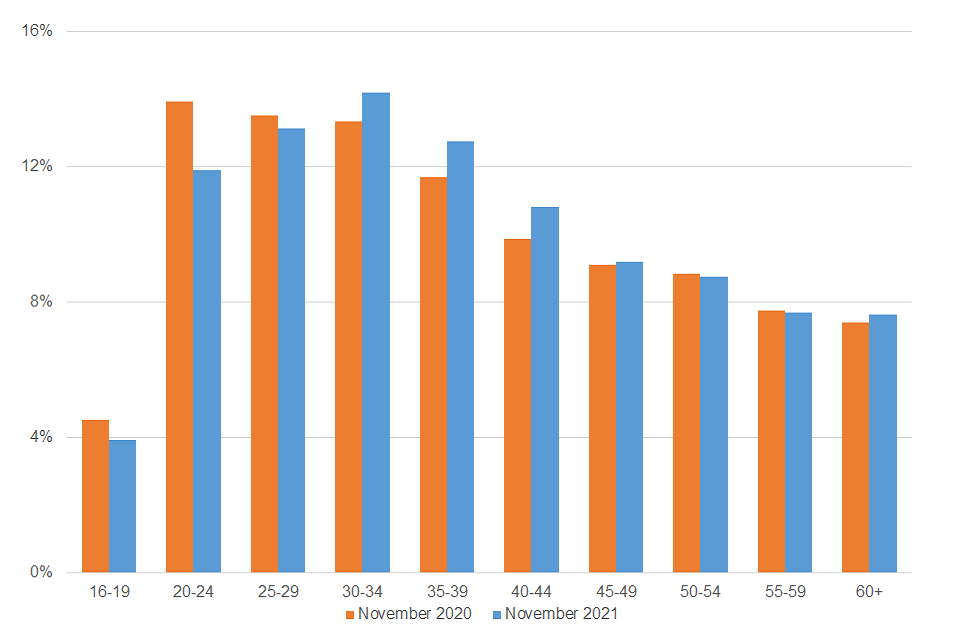
Source: DWP Alternative Claimant Count statistics.
Additionals
The additional group of unemployed claimants are estimates of those who would have been Searching for Work under Universal Credit had it existed over the entire time period from 2013. This covers:
- people who are not in work but previously claimed Housing Benefit only, this means did not claim Jobseeker’s Allowance
- people whose household previously claimed Child Tax Credit from HM Revenue and Customs (HMRC), but are not themselves earning more than the Universal Credit administrative earnings threshold; and nor do they have responsibility as the main carer for their child
- people who are the partner of a claimant of Employment and Support Allowance or Income Support, but who do not themselves have caring responsibilities, a disability or a limitation on their ability to work
Of the 1.96 million people claiming unemployment benefits in November 2021, 173,000 (9%) were ‘additionals’. This is a decrease of 43,000 (20%) on the previous year.
The majority of additional claimants are covered by two main groups. The largest group of additionals are those people not in work but claiming Housing Benefit only, followed by those claiming Child Tax Credits
4. Regional
Of the 1.96 million people claiming unemployment benefits in November 2021, a fifth (382,000) were living in London. The next highest region was the North West with 235,000 (12%), followed by the South East with 213,000 (11%).
All regions saw decreases in claimant unemployment. The largest percentage decreases were in the Scotland (35%) and Wales (32%).
The highest claimant unemployment rate in the United Kingdom in November 2021 was for London (6.3%). The next highest was for the West Midlands (5.7%). The region with the lowest claimant unemployment rate was the South West (3.5%). For information on all regions, ODS tables are provided alongside this release.
All regions have seen a fall in claimant unemployment rates compared to the same time last year.
Claimant unemployment rate by region, United Kingdom, November 2020 and November 2021, seasonally adjusted.
| Region | Claimant unemployment rate 2020 (%) | Claimant unemployment rate 2021 (%) |
|---|---|---|
| North East | 7.3 | 5.1 |
| North West | 7.2 | 5.1 |
| Yorkshire and The Humber | 6.8 | 4.9 |
| East Midlands | 5.8 | 4.0 |
| West Midlands | 7.6 | 5.7 |
| East of England | 5.8 | 4.0 |
| London | 8.5 | 6.3 |
| South East | 5.5 | 3.8 |
| South West | 5.3 | 3.5 |
| Wales | 6.2 | 4.2 |
| Scotland | 6.2 | 4.0 |
| Northern Ireland | 5.5 | 4.0 |
Source: DWP Alternative Claimant Count statistics and ONS Claimant Count population statistics.
5. Local area
In November 2021, the highest claimant unemployment rate across all local authorities was Birmingham (9.3%). The next highest was Newham (8.6%) followed by Haringey (8.5%).
The local authorities with the lowest claimant unemployment rates were Orkney Islands (1.6%), Richmondshire (1.7%) and Craven (1.8%).
Rates are calculated by dividing the number of people claiming unemployment related benefits in a local authority by the population aged 16 to 64 in that local authority. They are calculated using the mid-2020 population estimates.
At a local level, unemployment rates are falling but remain higher than pre-pandemic levels
Claimant unemployment rate by local authority, United Kingdom, November 2019, 2020 and 2021 (based on November 2021 quintiles), not seasonally adjusted.
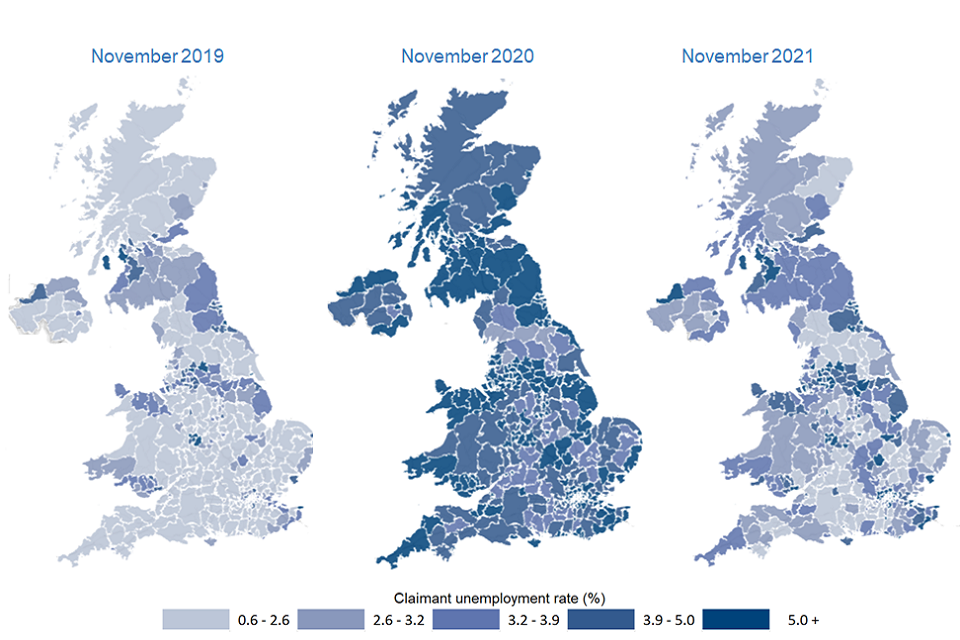
Source: DWP Alternative Claimant Count statistics and ONS Claimant Count population statistics.
When classifying claimant unemployment, data is split into quintiles (5 bands each containing approximately 76 local authorities), the top quintile is the group of local authorities with the highest levels of claimant unemployment.
The largest decrease was in Blackpool (down 3.7% percentage points), followed by Thanet (down 3.2 percentage points) and Crawley (down 3.1 percentage points).
6. Flows
Stat-Xplore includes newly published standardised statistics on:
-
On-flows: the number of people claiming unemployment related benefits in one month, who were not claiming in the previous month
-
Off-flows: the number of people no longer claiming unemployment related benefits in one month, who were claiming in the previous month
These statistics are available by month (February 2013 to August 2021), by local area, benefit type, age and gender. They offer some insights to users on monthly changes in a local area – for example the proportion of the Count which represents new claims in the previous month, and the off-flow rate – a measure of how the local labour market is performing.
Over the last quarter on-flows and off-flows remain above pre-pandemic levels
Flows between claimant unemployment, United Kingdom, November 2013 to November 2021, standardised and seasonally adjusted.
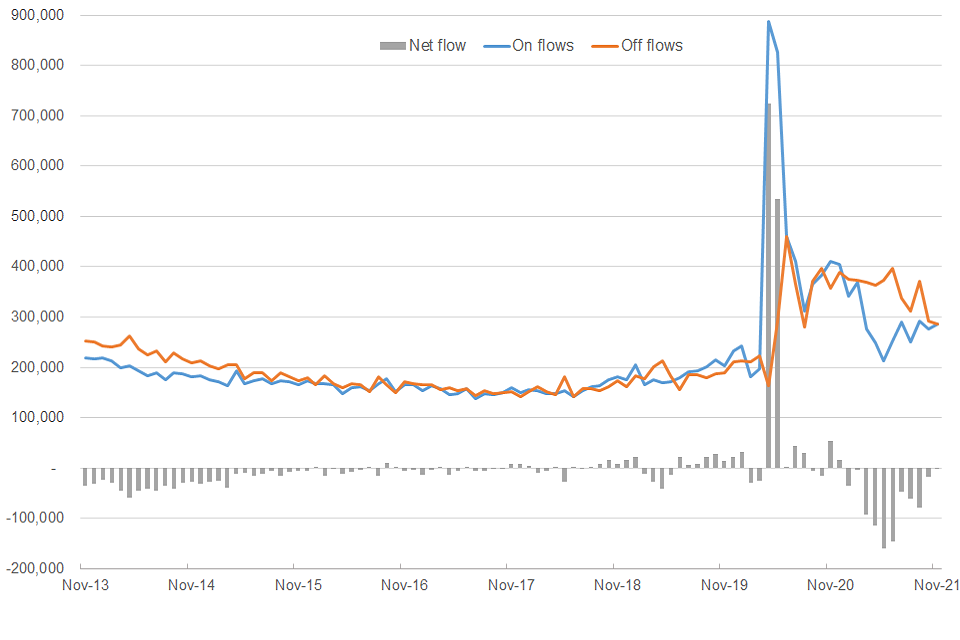
Source: DWP Alternative Claimant Count on-flow and off-flow statistics.
Net flows had been in steady state until a substantial rise in on-flows in April 2020. In the latest quarter (September to November 2021) average monthly on-flows were 284 thousand and average monthly off-flows were 317 thousand. Compared to pre-pandemic levels, both on-flows and off-flows remain substantially higher (207 thousand on-flows and 185 thousand off-flows monthly average September to November 2019).
The statistics released in Stat-Xplore allows users to produce local area analyses of flows over time.
7. About these statistics
The statistics are experimental Official Statistics, badged as provisional (for the latest 3 months) and are subject to revision in future releases.
Estimates of claimants in work: Those claiming unemployment-related benefits may be wholly unemployed and seeking work, or may be employed but with low income or hours, that make them eligible for unemployment-related benefit support.
Enhancements to Universal Credit (UC) as part of the UK government’s response to the coronavirus mean that some additional people became eligible for unemployment-related benefit support, although still employed. The reduction in individual worker’s pay, as a result of the government schemes to protect businesses (Coronavirus Job Retention Scheme and Self Employed Income Support Scheme), may have also increased the number of employed people eligible for UC through their earnings falling below income thresholds. Some of these claims will fall within the work search conditionality group within UC.
Figures are estimates; using evidence of claimants’ earnings or hours worked in their latest assessment period to estimate the proportion who are jobless and those who are (or have recently been) working (excluding those self-employed). Figures include those with reported Pay as you Earn (PAYE) income in their most recent UC Assessment Period, those reporting part-time hours worked on Jobseeker’s Allowance, and hours worked or income from earnings from those on Child Tax Credits or Housing Benefit.
Like many economic indicators, the labour market is affected by factors that tend to occur at around the same time every year; for example, school leavers entering the labour market in July and whether Easter falls in March or April. In order to compare changes over time that are not driven by seasonal factors, the data has been seasonally adjusted. This allows for comparisons between consecutive time periods, for example, to the previous quarter or month. All figures stated in this statistical release are seasonally adjusted except where otherwise stated. Figures at local authority level and below are not seasonally adjusted as a meaningful multiplicative model which contains other metrics cannot be produced at such a low level of data.
The background and methodology document provides a fuller explanation on the purpose, coverage, construction, sources and limitations of the statistics. For example, this includes an explanation of why the back series starts in 2013 (linked to data availability) and on how the claimant unemployment rates have been calculated.
Lead Statistician: Steve Watkins
ISBN: 978-1-78659-324-5