Whole of Government Accounts Handbook: Year ended 31 March 2025
Updated 18 September 2026

© Crown copyright 2026
This publication is licensed under the terms of the Open Government Licence v3.0 except where otherwise stated. To view this licence, visit nationalarchives.gov.uk/doc/open-government-licence/version/3 or write to the Information Policy Team, The National Archives, Kew, London TW9 4DU, or email: psi@nationalarchives.gov.uk.
Where we have identified any third party copyright information you will need to obtain permission from the copyright holders concerned.
This publication is available at https://www.gov.uk/government/publications/whole-of-government-accounts-2024-25/whole-of-government-accounts-handbook-year-ended-31-march-2025
1. Foreword from the Accounting Officer
I am pleased to present the Whole of Government Accounts (WGA) Handbook for 2024-25.
This handbook provides a concise overview of the UK public sector’s financial position, performance and key fiscal risks, drawing on information reported in WGA. It is intended to support understanding of the public finances and signpost readers to the relevant sections of the full WGA.
This handbook is not subject to audit. The information it contains is extracted from the audited WGA and should be read alongside, rather than as a substitute for, the full report.
While WGA received a disclaimed audit opinion for a third consecutive year, it remains a unique and comprehensive resource. This edition includes updated commentary on Data Quality and marks the successful completion of the publication recovery plan, restoring publication timeliness following earlier reporting delays.
2. 2024-25 at a Glance
Support for the NHS: £187 billion spent towards delivering NHS England in 2024-25, supporting a health service fit for the future.
Source: DHSC annual report and accounts 2024-25
Getting a good deal for taxpayer: £33 billion spent by the Crown Commercial Service. These cross-government procurement experts maximise every pound of taxpayer resource and make sure spend is directed to where it is needed most.
Source: Cabinet Office annual report and accounts 2024-25
Strengthening flood resilience: £2.7 billion committed over 2 years to building, maintaining and repairing UK flood defences. These measures are expected to provide better protection for 52,000 homes, with over 27,000 homes better protected in 2024-25.
Source: DEFRA annual report and accounts 2024-25
3. How to Read WGA
WGA provides a consolidated view of the UK public sector’s financial position and performance. It is prepared in accordance with International Financial Reporting Standards (IFRS), adapted for the public sector.
While WGA presents a complete balance sheet and income statement, it should be interpreted with an understanding of its purpose and limitations.
3.1 Understanding the Financial Position
WGA is prepared on an accruals basis, meaning that it records income and expenditure when they are earned or incurred, rather than when cash is received or paid. As a result, reported figures reflect both cash activity and accounting adjustments, including valuations of long-term assets and liabilities.
The public sector reports net liabilities, reflecting the inclusion of long-term obligations, such as pensions, provisions, and government borrowing, without recognising the government’s future ability to raise revenue through taxation.
3.2 Interpreting Year-on-Year Movements
Changes in WGA balances are driven by:
- Economic conditions, including inflation and interest rates
- Policy decisions and demand trends, particularly in areas such as social security
- Measurement effects, where changes in valuation assumptions can lead to significant movements without affecting underlying cash flows
Users should therefore distinguish between movements arising from operational activity and those resulting from accounting revaluations.
3.3 Data Quality and Assurance
Users should consider the data quality context when interpreting WGA balances and year-on-year movements. Further information on the nature and impact of these issues is provided in the Audit Opinion and Data Quality sections.
3.4 Using the Handbook
This handbook is intended to provide a concise summary of the most significant features of WGA 2024-25. It highlights key trends, balances, and risks, and should be read alongside the full version for a more detailed understanding of the underlying numbers.
4. Audit Opinion
The Whole of Government Accounts 2024–25 received a disclaimed opinion from the Comptroller and Auditor General (C&AG) for the third consecutive year. This reflects ongoing data quality limitations, concentrated in the English local government sector. HM Treasury recognises the significance of this and continues to collaborate with stakeholders to resolve it.
4.1 What is a Disclaimed Opinion?
A disclaimed opinion is issued when the auditor is unable to obtain sufficient appropriate audit evidence to support an audit conclusion. In the context of WGA, this arises where data included within the consolidation is unavailable, unaudited or itself subject to a disclaimed opinion.
4.2 Why was it issued?
The principal source of data quality challenges continues to be the local government sector. These issues affect the completeness and reliability of information used in the preparation of WGA and contribute to limitations in the audit evidence available to the C&AG.
5. Audit Qualifications
The National Audit Office (NAO) has historically reported a number of qualifications and limitations in relation to the WGA.
In 2024-25, two notable developments affected the qualifications that would otherwise have arisen from the consolidation process.
First, the Accounting Boundary Qualification was extended to reflect the treatment of Train Operating Companies, which meet the criteria for inclusion within the WGA boundary, but whose available financial information does not fully reflect their underlying economic position.
Second, HM Treasury updated its methodology for assessing the impact of Non-Coterminous Year Ends relating to academies. Following review, the impact on income was not considered material, allowing this qualification element to be removed. This represents a significant step towards resolving a long-standing issue underpinning WGA qualifications.
The underlying matters giving rise to the remaining qualifications and limitations continue to be reported in the NAO’s audit certificate.
6. Data Quality
The Data Quality risk reflects limitations in the completeness and assurance of information included in WGA. In 2024-25, this was driven by missing submissions and data with limited assurance, including unaudited and disclaimed returns.
| Data Quality | 2020-21 | 2021-22 | 2022-23 | 2023-24 | 2024-25 |
|---|---|---|---|---|---|
| Missing | 155 | 178 | 211 | 201 | 145 |
| Unaudited / Disclaimed | 120 | 211 | 227 | 280 | 338 |
| Audited | 432 | 312 | 238 | 176 | 179 |
| Total | 707 | 701 | 676 | 657 | 662 |
Between 2023-24 and 2024-25, missing entities fell by 39%, while unaudited or disclaimed submissions increased by 21%, accounting for 65% of submissions (up from 62%). While this improves overall completeness, unaudited and disclaimed data remains a material risk to data quality.
These challenges affect the reliability and comparability of WGA. Work led by MHCLG to address them is ongoing.
7. Revenue
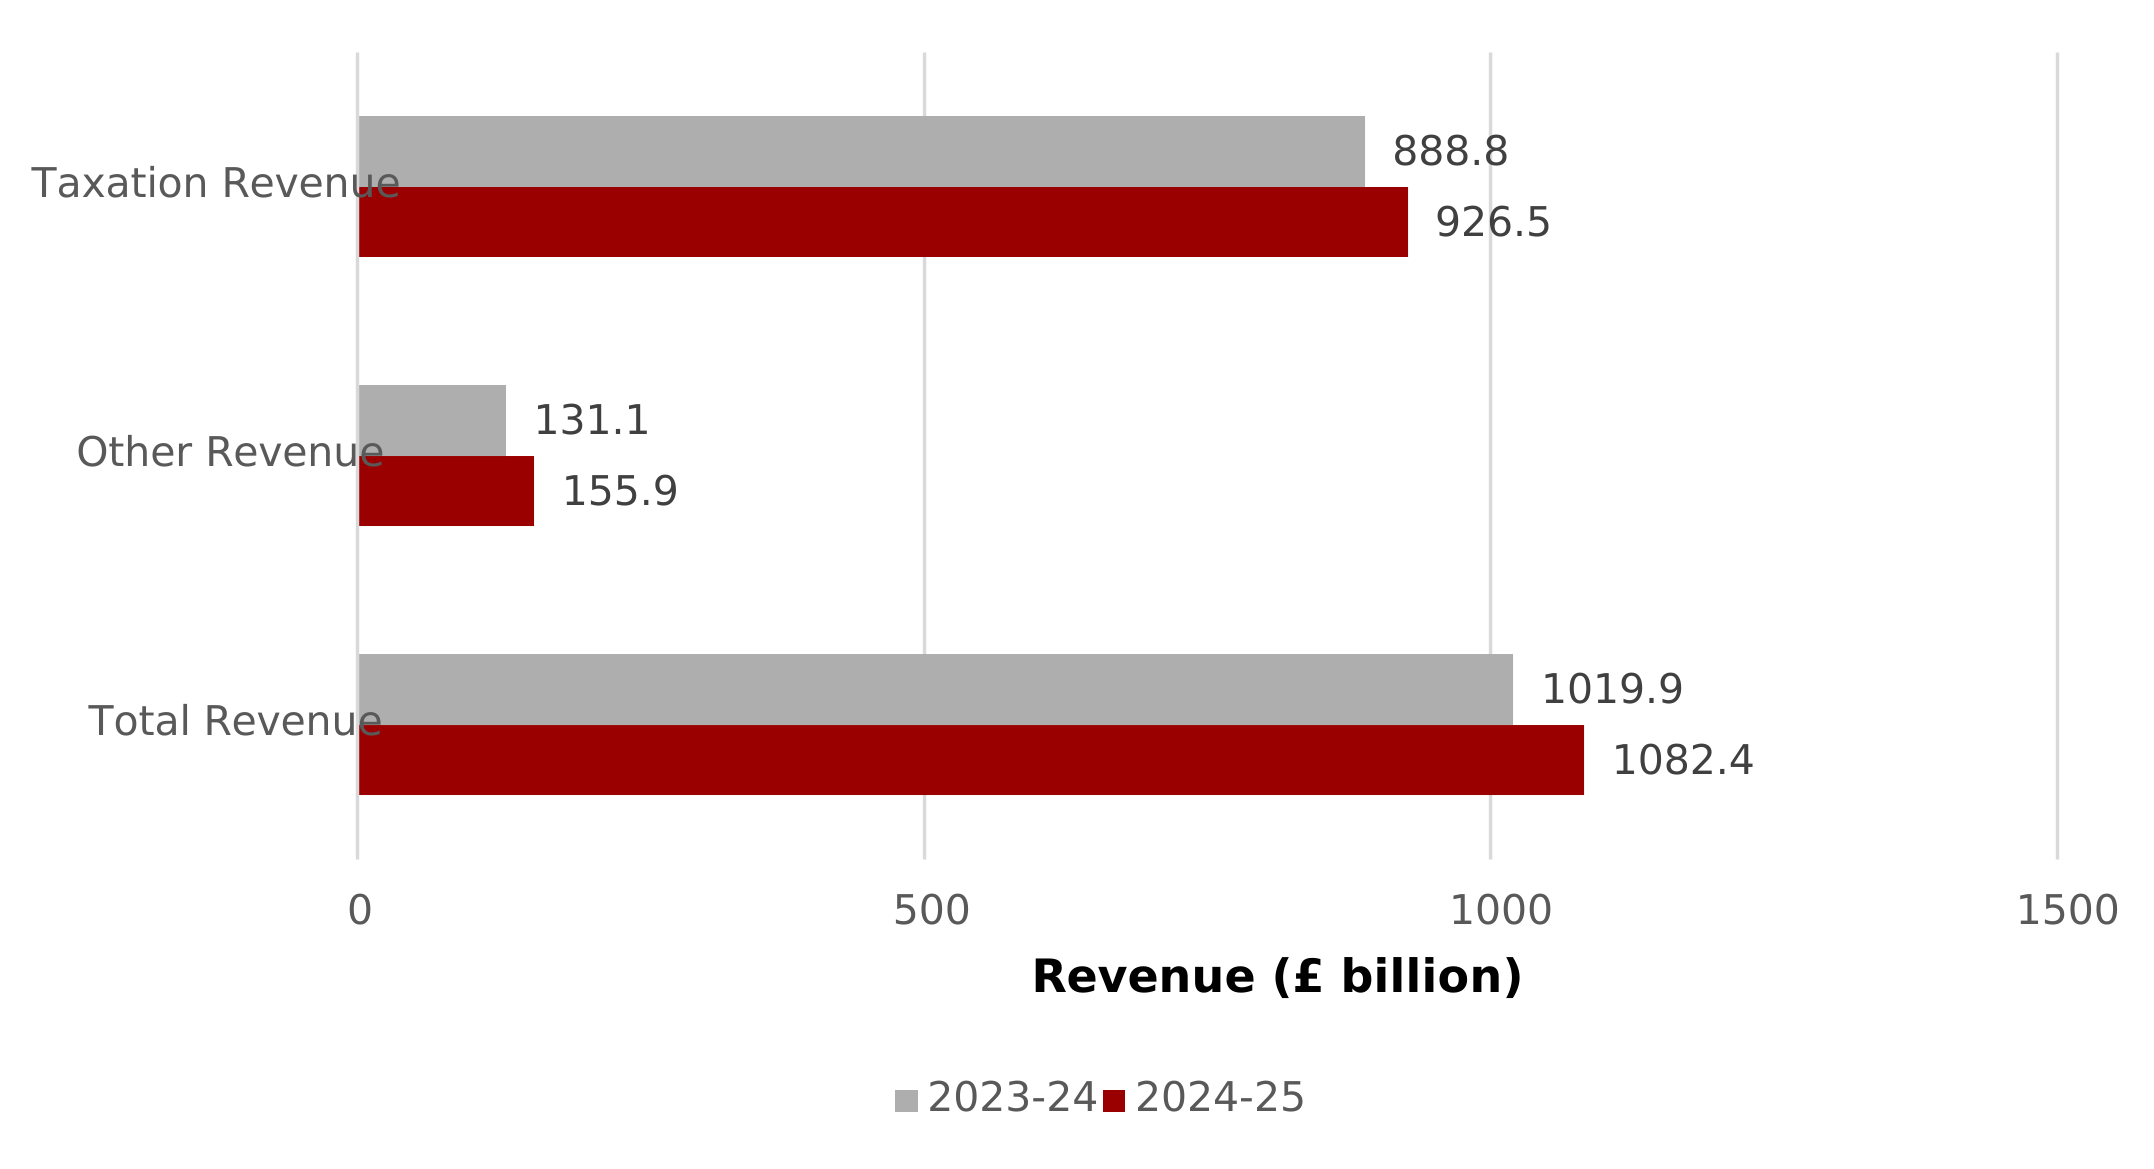
Key Facts:
- Taxation revenue remained the largest source of income, accounting for 85.6% of the income total.
- Central government tax receipts increased by £29.6 billion in 2024–25, driven by higher income tax, VAT and stamp tax revenues. Lower National Insurance Contributions (NICs) partially offset this.
- Tax revenues grew more slowly than the wider economy, with taxation revenue as a share of GDP falling by 0.5 percent.
- Local government revenues increased, particularly council tax revenues, reflecting the return of many English local authorities to the WGA boundary.
8. Expenditure
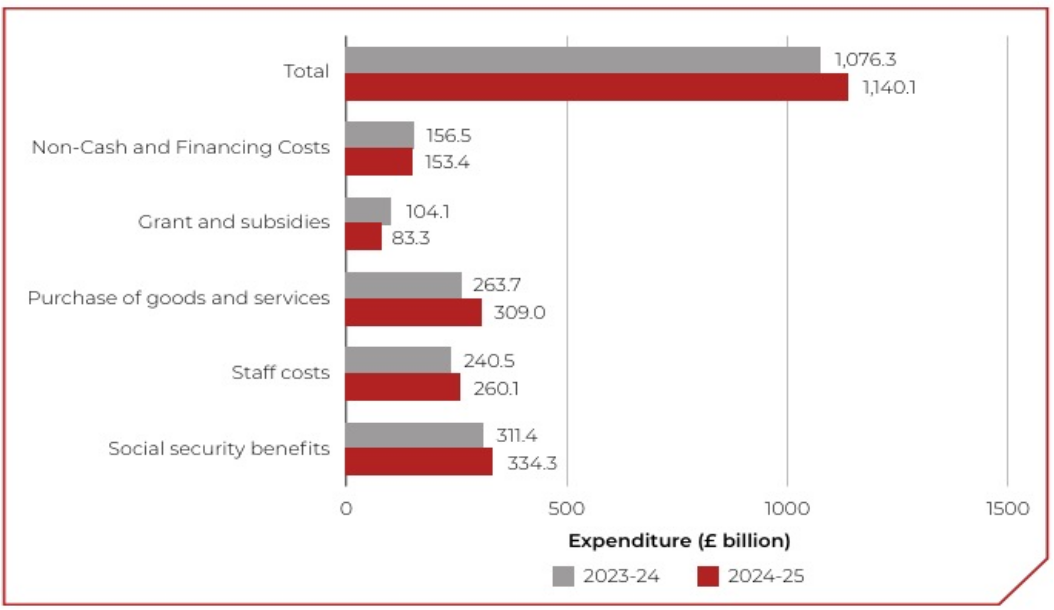
Key Facts:
- Public sector expenditure increased by £63.3 billion in 2024–25, driven by higher demand-led spending, service delivery costs and financing-related expenditure.
- Social security benefits remained a key driver of expenditure growth, reflecting demographic changes, claimant volumes and statutory uprating.
- Staff costs and spending on goods and services increased as public bodies faced higher pay, workforce and operating costs.
- Financing- related costs also rose, reflecting the impact of inflation and interest rates on debt servicing costs and non- current liabilities.
9. Assets
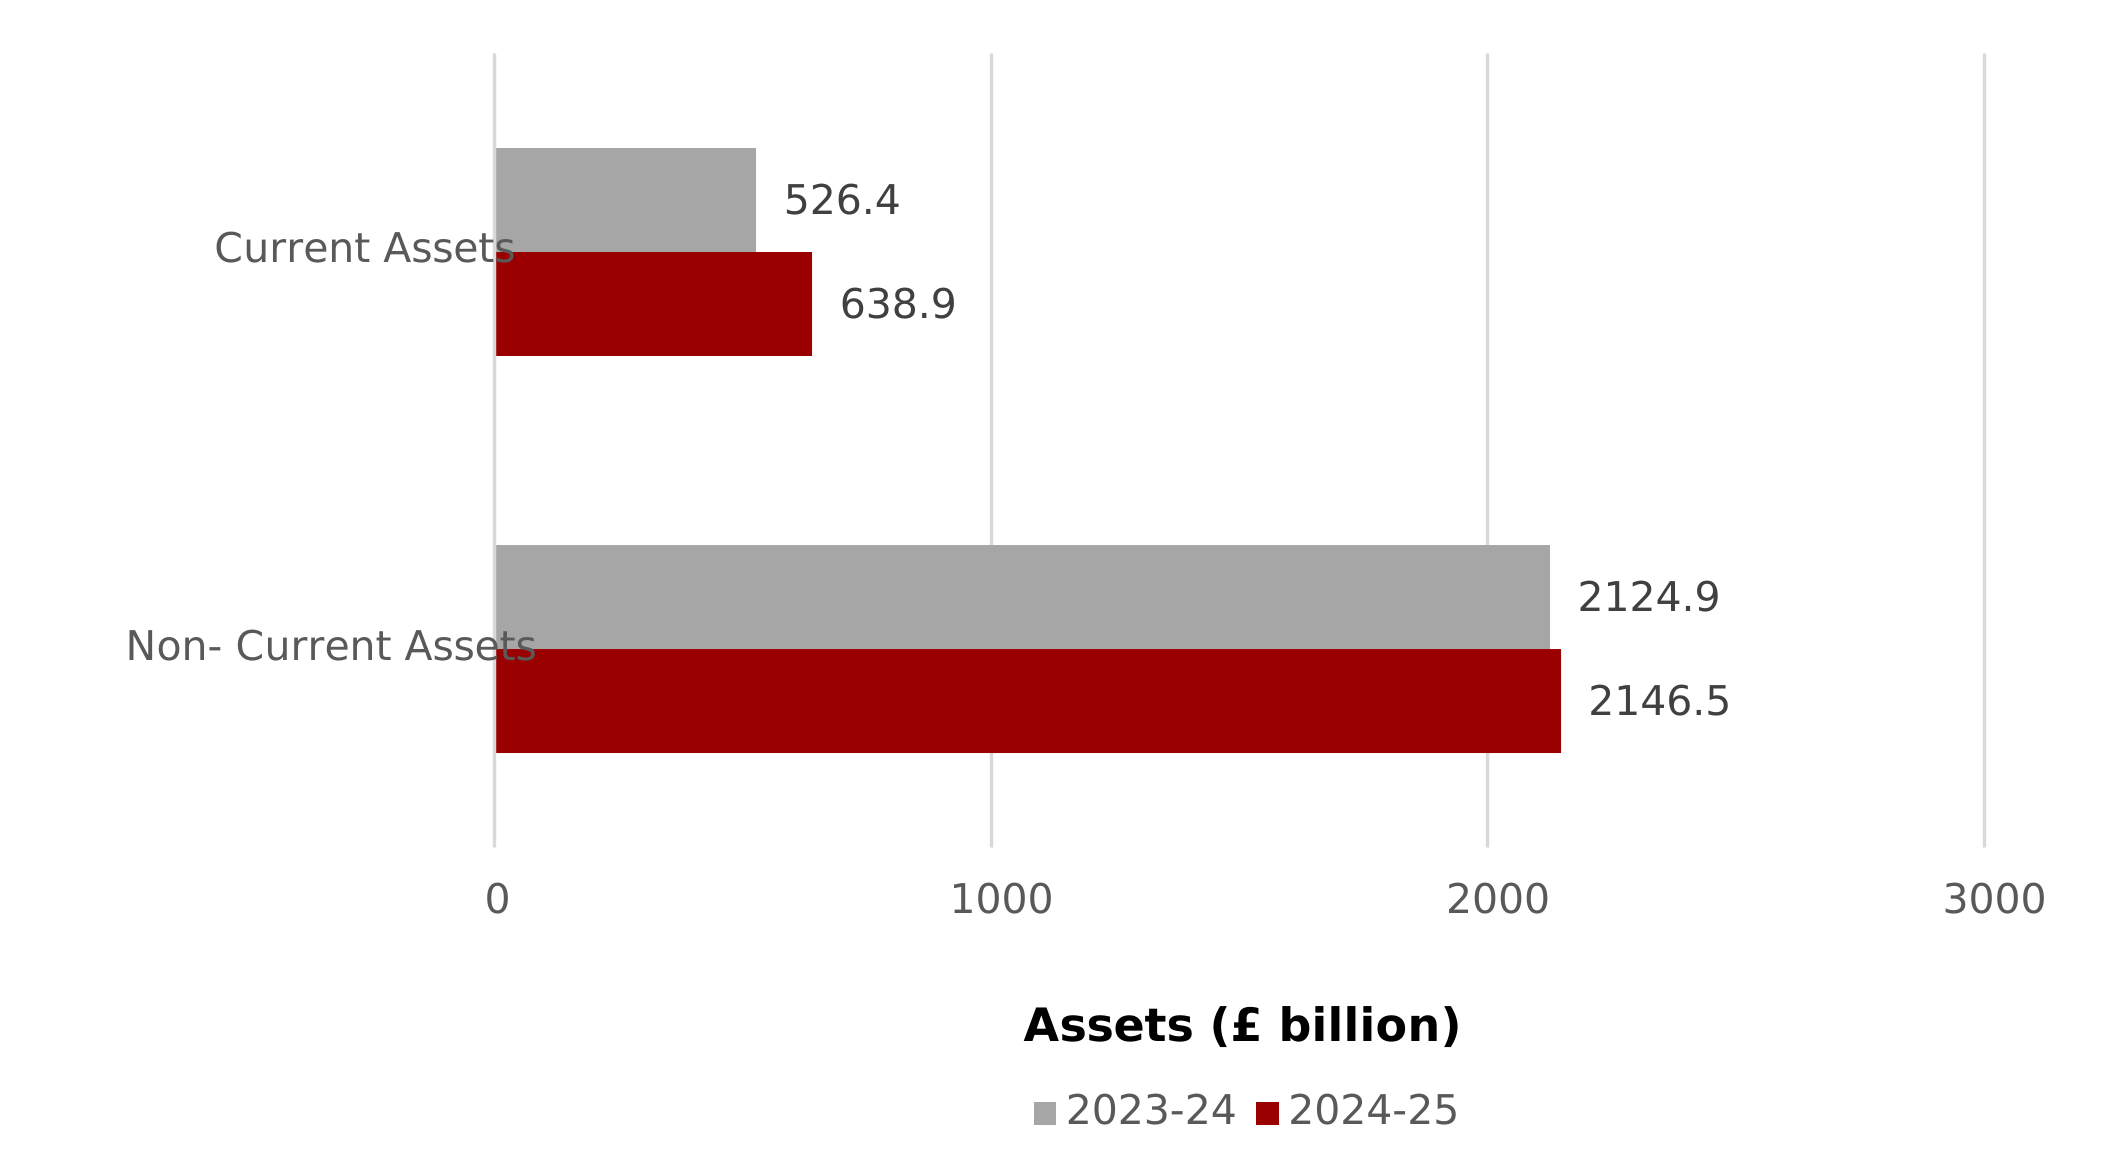
Key Facts:
- Public sector assets increased in 2024–25, reflecting growth across current and non- current assets. Property, Plant and Equipment remained the largest asset category.
- Non-current assets were supported by investment, revaluations, and movements in financial assets, with holdings concentrated in a small number of sectors and portfolios.
- Current assets increased to £638.9 billion, driven by higher receivables, short-term loans and cash balances.
- Data quality and audit coverage continue to affect the reliability of some reported asset balances, highlighting the importance of robust underlying data.
10. Liabilities
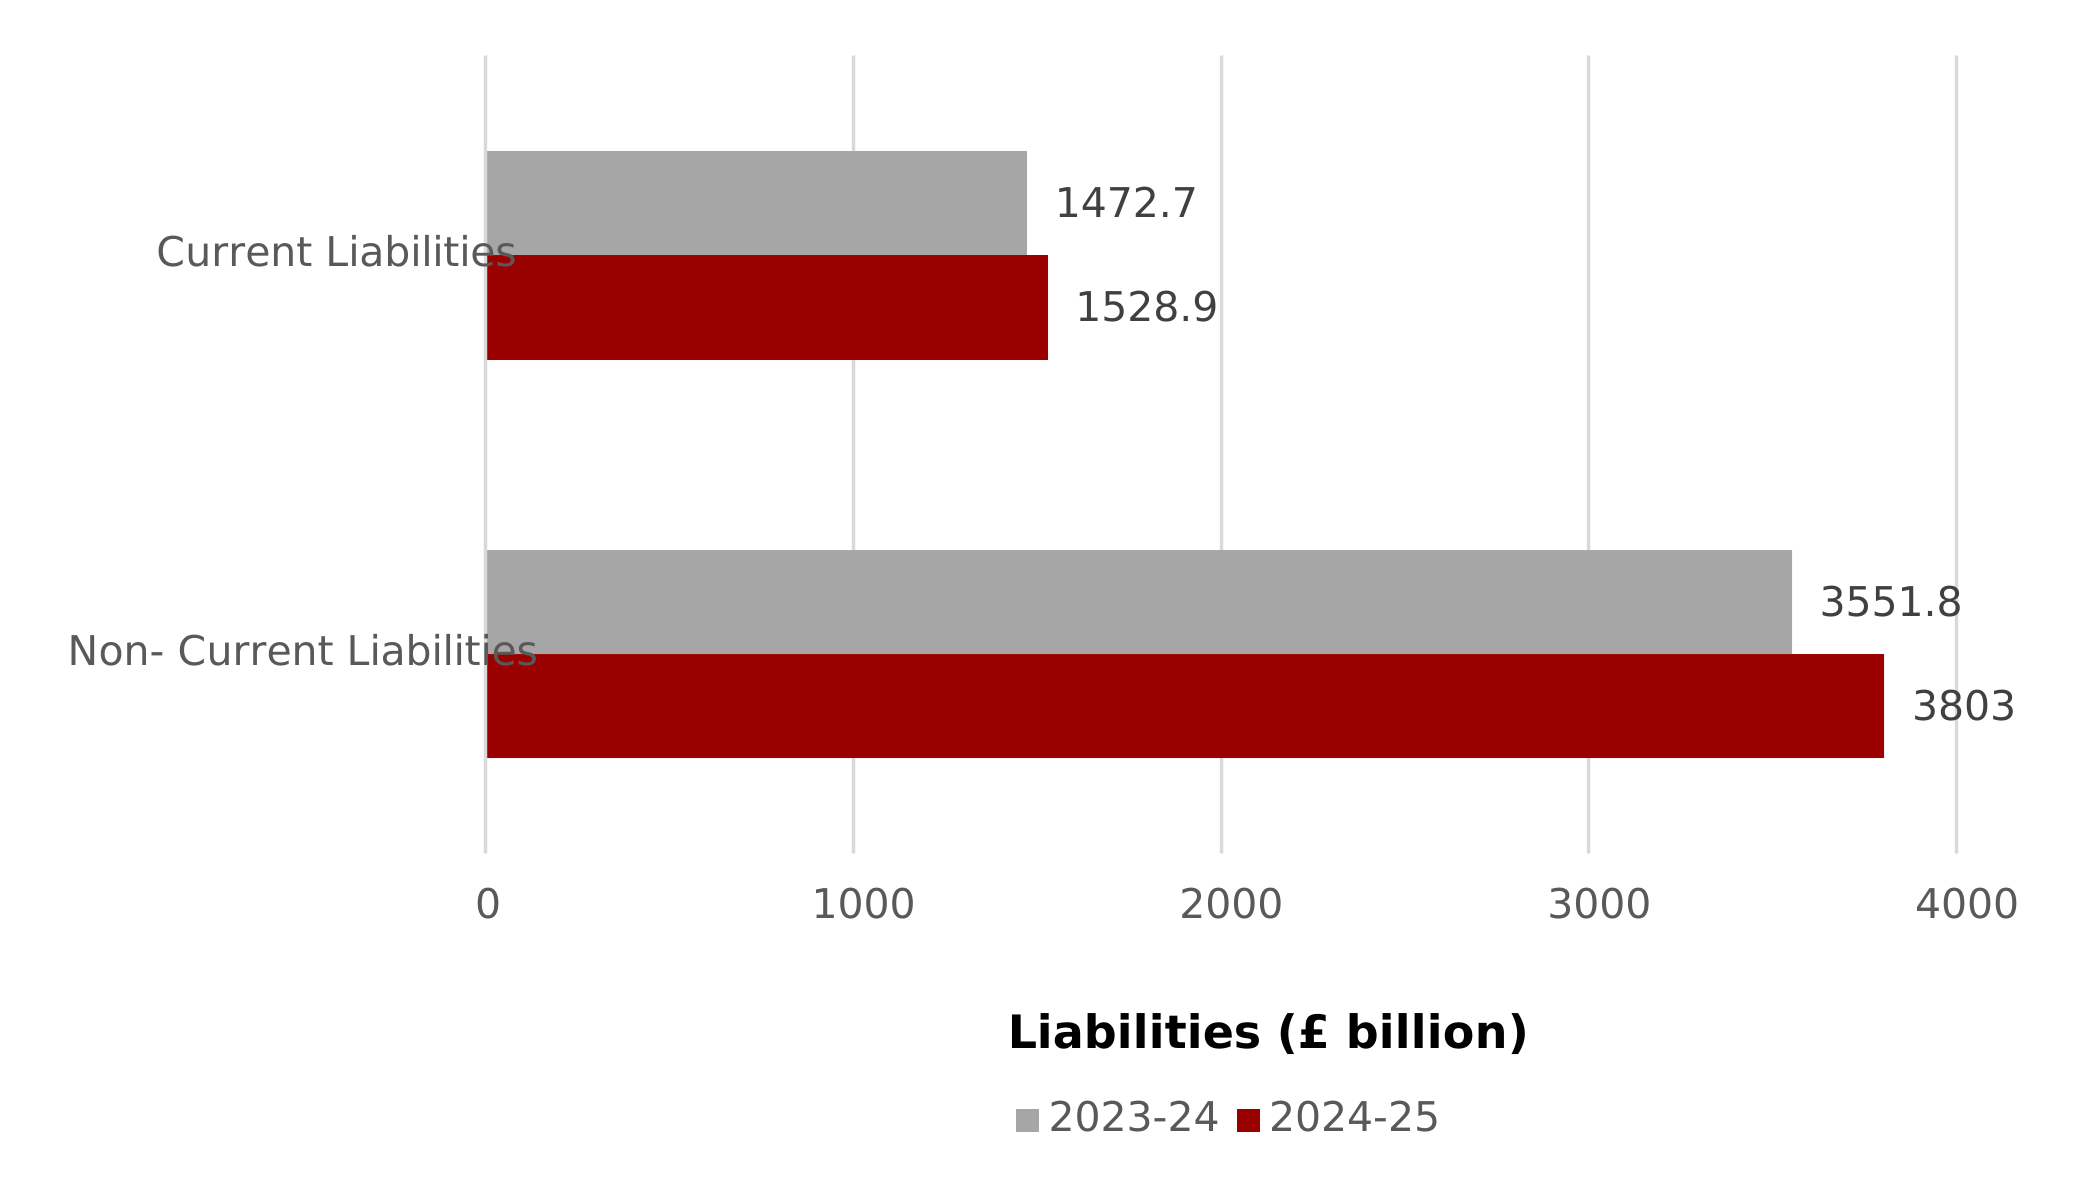
Key Facts:
- Public sector liabilities increased in 2024–25, driven by higher government borrowing and movements in long-term obligations.
- Gilts remained the principal source of borrowing, with the stock of gilts increasing by £259.9 billion and issuance totalling £297.7 billion during the year.
- The difference between WGA and National Accounts valuations of unfunded pension liabilities was £130.8 billion, highlighting the impact of discount rates on reported liabilities.
- Nuclear decommissioning and clinical negligence provisions continue to represent significant long-term obligations, contributing to overall liability movements.
11. Five Year Trend
| Data Quality | 2020-21 £bn | 2021-22 £bn | 2022-23 £bn | 2023-24 £bn | 2024-25 £bn | 5-Year Variance |
|---|---|---|---|---|---|---|
| Income | (731.5) | (881.6) | (974.5) | (1,019.9) | (1,082.4) | (350.9) |
| Expenditure | 1,135.9 | 1,241.2 | 959.9 | 1,166.5 | 1,290.1 | 154.2 |
| Assets | 2,206.7 | 2,414.3 | 2,554.3 | 2,651.3 | 2,785.4 | 578.7 |
| Liabilities | (5,533.0) | (6,289.2) | (4,943.4) | (5,024.5) | (5,331.9) | 201.1 |
| Net Expenditure | 404.4 | 359.6 | (14.6) | 146.6 | 207.7 | (196.7) |
| Net Liabilities | (3,326.3) | (3,874.9) | (2,389.1) | (2,373.2) | (2,546.5) | 779.8 |
| Gross Domestic Product (GDP), Nominal and Non- Seasonally Adjusted | 2,110 | 2,400 | 2,634 | 2,790 | 2,935 |
| As % of GDP | 2020-21 £bn | 2021-22 £bn | 2022-23 £bn | 2023-24 £bn | 2024-25 £bn | 5-Year Variance |
|---|---|---|---|---|---|---|
| Income | (35.0)% | (37.0)% | (37.0)% | (37.0)% | (37.0)% | (2.0)% |
| Expenditure | 54.0% | 52.0% | 36.0% | 42.0% | 44.0% | (10.0)% |
| Assets | 105.0% | 101.0% | 97.0% | 95.0% | 95.0% | (10.0)% |
| Liabilities | (262.0)% | (262.0)% | (188.0)% | (180.0)% | (182.0)% | 80.0% |
| Net Expenditure | 19.0% | 15.0% | (1.0)% | 5.0% | 7.0% | (12.0)% |
| Net Liabilities | (157.0)% | (161.0)% | (91.0)% | (85.0)% | (87.0)% | 71.0% |
5 Year Trend – Key Insights:
- Public sector income and expenditure increased by £350.9 and £154.2 billion respectively over the five years to 2024-25.
- Net expenditure fell from £404.4 billion in 2020–21 to £207.7 billion in 2024–25, following a temporary net income position.
- The public sector balance sheet expanded, with assets and liabilities totalling £2,785.4 and £5,331.9 billion respectively in 2024-25.
- As a share of GDP, expenditure fell from 54% to 44% and net liabilities fell from 157% to 87% over the period, indicating that both spending and liabilities represented a smaller proportion of the economy by 2024–25.
12. Discount Rate Sensitivities
Many of the largest liabilities reported in the WGA, including public service pensions, nuclear decommissioning provisions and clinical negligence provisions, are highly sensitive to discount rates. Discounting converts future cash flows into their equivalent value today, allowing obligations that arise at different points in time to be compared on a consistent basis.
The standard WGA approach applies accounting discount rates that reflect prevailing economic assumptions.
For 2024–25, WGA introduces two additional presentations for major long-term liabilities:
| National Accounts Basis | Uses a constant 2% real discount rate to provide a more stable view over time. |
| 0% Real Rate Basis | Removes discounting entirely, showing the full value of future obligations. |
These alternative presentations provide additional context by separating movements arising from changes in discount rates from those driven by changes in the underlying cash flow assumptions.
These three presentations improve transparency and provide a clearer understanding of the factors driving movements in major WGA liabilities.
The impact of the three rates on unfunded pension liabilities, nuclear decommissioning provisions and clinical negligence provisions is presented in the following tables.
12.1 Unfunded Pensions
| £ Billion | Discount Rate Applied in WGA | National Accounts Basis | Static 0% Real | |||
|---|---|---|---|---|---|---|
| 2024-25 | 2023-24 | 2024-25 | 2023-24 | 2024-25 | 2023-24 | |
| Real Discount Rate Applicable into Perpetuity (%) | 2.40% | 2.45% | 2.00% | 2.00% | 0.00% | 0.00% |
| Unfunded Liabilities: | ||||||
| NHS | 531.4 | 500.8 | 571.7 | 559.1 | 868.4 | 847.9 |
| Teachers | 333.3 | 307.8 | 357.3 | 342.1 | 526.5 | 503.4 |
| Civil Service | 216.9 | 208.1 | 225.9 | 217.8 | 323.1 | 312.4 |
| Armed Forces | 150.3 | 144.6 | 161.4 | 161.0 | 238.2 | 237.9 |
| Other Schemes | 169.0 | 154.6 | 215.4 | 183.5 | 318.7 | 271.4 |
| Total Unfunded Pensions | 1,400.9 | 1,315.9 | 1,531.7 | 1,463.5 | 2,274.9 | 2,173.0 |
12.2 Nuclear Decommissioning
| £ Billion | Discount Rate Applied in WGA | Static 2% Real | Static 0% Real | |||
|---|---|---|---|---|---|---|
| 2024-25 | 2023-24 | 2024-25 | 2023-24 | 2024-25 | 2023-24 | |
| Real Discount Rate Applicable into Perpetuity (%) | 2.55% | 2.40% | 2.00% | 2.00% | 0.00% | 0.00% |
| Nuclear Decommissioning Provisions | 110.1 | 105.3 | 125.3 | 117.0 | 215.9 | 198.9 |
12.3 Clinical Negligence
| £ Billion | Discount Rate Applied in WGA | Static 2% Real | Static 0% Real | |||
|---|---|---|---|---|---|---|
| 2024-25 | 2023-24 | 2024-25 | 2023-24 | 2024-25 | 2023-24 | |
| Real Discount Rate Applicable into Perpetuity (%) | 2.55% | 2.40% | 2.00% | 2.00% | 0.00% | 0.00% |
| CNST Scheme | 55.6 | 54.0 | 62.0 | 58.6 | 99.6 | 92.1 |
| Other Clinical Schemes | 4.4 | 4.2 | 4.8 | 4.6 | 7.6 | 7.1 |
| Non- Clinical Schemes | 0.3 | 0.3 | 0.4 | 0.3 | 0.6 | 0.5 |
| Total NHS Resolution Clinical Negligence Provisions | 60.3 | 58.5 | 67.2 | 63.5 | 107.8 | 99.7 |
13. Further Reading
WGA is part of a suite of publications used for public sector financial transparency. Further reading can be found by scanning some of the below QR codes.
13.1 Public Expenditure Statistical Analysis (HMT)
More detailed analyses of public expenditure than can be found in WGA, including spend per head in different regions of the UK.
13.2 Managing Public Money (HMT)
Guidelines for public sector entities regarding prudent management of taxpayer funds, informing the approach to broader governance and specific financial processes.
13.3 Parliamentary Accounts Committee (PAC) Reports
PAC scrutinises public sector finances directly in hearings and correspondence with relevant departments officials and issuing reports and recommendations.