Water resources 2025 to 2026: analysis of the water industry’s annual water resources performance
Published 29 October 2026
Applies to England

© Crown copyright 2026
This publication is licensed under the terms of the Open Government Licence v3.0 except where otherwise stated. To view this licence, visit nationalarchives.gov.uk/doc/open-government-licence/version/3 or write to the Information Policy Team, The National Archives, Kew, London TW9 4DU, or email: psi@nationalarchives.gov.uk.
Where we have identified any third party copyright information you will need to obtain permission from the copyright holders concerned.
This publication is available at https://www.gov.uk/government/publications/water-resources-2025-2026-analysis-of-the-water-industrys-annual-water-resources-performance/water-resources-2025-to-2026-analysis-of-the-water-industrys-annual-water-resources-performance
Foreword
The ongoing drought in 2026 has highlighted the growing pressures on England’s water resources. Although we have seen some early autumn rainfall, above-average rainfall is still needed to move out of drought and replenish reservoirs, rivers and groundwater. This year reflects the climate realities we now face: the likelihood of more frequent and prolonged dry, warm weather, more intense rainfall and greater uncertainty.
These are no longer exceptional events for future planning; they are challenges we must respond to now. Securing resilient supplies, reducing demand and protecting the environment is a national priority.
This report covers water company water resources performance during the 2025 to 2026 financial year and assesses progress against the actions needed for long-term resilience.
It comes at a critical point. New water resources management plans set out the scale of action required, and associated business plans secure investment for delivery. However, most companies are already off track in the first year of their plans. This is deeply concerning. It means more water has been taken from our environment this year than last. The plans will only deliver the resilience that customers, the economy and the environment need if companies act with pace, discipline and sustained focus.
There is significant variation across the industry. Some companies are showing what can be achieved through stronger delivery: better operational grip and a clearer focus on outcomes. Others are falling behind. Every company has a responsibility to deliver for its customers and the places it serves, but poor performance by one company can add pressure across the wider system. We need all companies to meet the expectations set out in their plans, not only the best performers.
Delivery of new supply schemes is critical. Reservoirs, transfers, water recycling and other strategic schemes are essential to secure supplies for future growth, improve drought resilience and reduce unsustainable pressure on the environment. These schemes are complex and will take time. Companies must identify and address barriers quickly, work openly with regulators and maintain confidence that the infrastructure customers are paying for will be delivered when needed.
Reducing leakage remains essential. While some companies have made significant progress, performance is diverging. Water lost before it reaches homes and businesses has been taken from the environment, treated and pumped, only to be wasted. Total leakage remains at previous year’s levels, amounting to just under 19% of all water put into distribution. That is not acceptable, particularly during drought. Regulators, and the public, expect substantial and sustained reductions. Companies must improve asset management, use data and technology better, and maintain urgency on leakage.
Water demand presents a growing risk. Household water use has increased slightly to 136.9 litres per person per day on average. Household and non-household use must fall to close the gap between the water available and the water needed. Smart metering is central to this, providing customers better information, enabling leak identification more quickly and supporting fairer, more targeted demand management. But meters alone will not be enough. Companies must combine smart metering with effective engagement, practical water efficiency support and sustained action to reduce high consumption and eliminate water wastage.
Water companies must deliver against their plans, managing risks transparently and taking timely corrective action where performance is off track. This is not simply about meeting regulatory commitments. The resilience of homes and businesses, the ability to support sustainable growth and the health of our rivers, wetlands and chalk streams are all at stake. There is no room for complacency. Significant investment in new supplies, smart metering and demand reduction must be matched by faster delivery, stronger accountability and additional action across the sector.
The response to recent dry weather has shown that companies can move further and faster, and that urgency needs to become business as usual. Securing the nation’s water resources requires sustained and coordinated effort from the water industry, government, regulators, customers and wider society. The task ahead is clear: accelerate delivery, reduce waste, cut demand and protect the environment so reliable water supplies can be secured for future generations.
Helen Wakeham, Director of Water
Executive summary
The 2025 to 2026 reporting year was characterised by significant pressure on England’s water resources with many parts of England suffering from a drought. An exceptionally dry spring and summer highlighted the increasing challenge of managing water resources in a changing climate. These events reinforced the importance of reducing demand, improving resilience and delivering new water supplies.
This report assesses the first year of delivery against water companies’ water resources management plan (WRMP24) commitments. Despite progress in some areas, overall performance indicates that the sector is not on track to achieve many of the reductions and improvements planned. The most concerning issue was the number of companies allowing leakage to rise. While high demand would be expected during a dry year, actual reported demand was higher than the forecast in plans that had only just come into effect. Equally concerning was that several companies reported delays or risks to planned supply schemes, including delays on much needed reservoirs.
The headlines of the annual review of water resources management plans are that:
-
national demand for water increased from 13,946 million litres per day (Ml/d) in 2024 to 2025 to 14,110 Ml/d in 2025 to 2026 and is higher than the WRMP24 forecast of 13,774 Ml/d
-
leakage did not reduce as forecast and remained unchanged from the previous year, despite expected performance improvements, and this lack of progress is concerning and requires further action – companies forecasted leakage of 2,441 Ml/d but actual leakage was 2,621 Ml/d and previous year was 2,617 Ml/d
-
household consumption remained stable at 136.9 litres per person per day (l/p/d) compared to 136.5 l/p/d last year
-
household metering rose to 65.2% (from 62.7% the previous year) and smart water meter rollout continued with almost 20% of all homes and over 16% of all businesses now being smart metered
-
the availability of treated water supplies, measured in terms of the level of outage, was generally better than forecast and improved from last year – average company outage reduced to 22.2 Ml/d, compared with 30.5 Ml/d in 2024 to 2025, and total national outage reduced from 518 Ml/d to 378 Ml/d
-
these results show that greater progress is needed to reduce demand and improve supply, to ensure our environment is protected and we all have a secure supply of water
Failing to reduce leakage is a significant performance issue across the sector. Some companies successfully reduced leakage while others have failed to make progress or have allowed leakage to increase. Companies are expected to take proactive and effective action to reduce leakage, particularly during periods of drought and water resource pressure. We therefore expect immediate and demonstrable action to reverse this trend, deliver sustained reductions in leakage and return performance to forecast levels.
There were also positive signs of progress. National outage remained below forecast levels, metering continued to increase and the rollout of smart meters accelerated across much of the sector. Performance varied considerably between companies and some are already behind the trajectories required to deliver their WRMP24 commitments.
The quality of annual review submissions remains a concern. Most companies submitted returns containing moderate or significant errors, with some requiring multiple resubmissions. Improving data quality is essential to support effective regulation, transparent reporting and informed decision-making.
Looking ahead, companies must demonstrate measurable progress in delivering their WRMP24 and 2024 Price Review (PR24) commitments. This includes accelerating leakage reduction, improving water efficiency, expanding smart metering, delivering supply schemes on time and strengthening resilience to future droughts. Effective delivery over the remainder of period to 2030 will be critical to securing resilient and sustainable water supplies for customers, the environment and future economic growth.
What water companies should do next
Water companies should:
- increase efforts to reduce leakage and return performance to planned levels
- accelerate delivery of WRMP24 commitments and demonstrate measurable progress against planned trajectories, taking corrective action in response to delays
- improve household and non-household water efficiency through smart water metering and customer engagement
- deliver major supply schemes, investigations and environmental improvements on time, while addressing emerging delivery risks
- apply lessons learned from the 2025 and 2026 droughts to strengthen drought planning and resilience
- significantly improve the quality, accuracy and consistency of annual review submissions
1. Introduction
1.1 Background
Effective water resources management and planning continue to be critical in protecting the environment, ensuring resilient water supplies and supporting economic growth.
In 2025, the Environment Agency published the second National Framework for Water Resources. The framework highlighted the scale of England’s water resources challenge and actions for sustainable water supplies. Without further action, England could face a public water supply deficit of around 5 billion litres per day by 2055. The framework also highlights growing pressures from climate change, population growth, environmental improvement ambitions and the increasing demand from sectors vital to economic growth.
Supporting economic growth is at the forefront of the government’s mission. Ambitious plans for housing delivery, infrastructure development, energy security and the expansion of data-driven and net-zero industries will all require reliable and sustainable water supplies. Water therefore remains a fundamental enabler of growth, strengthening the importance of effective long-term water resources planning and delivery across the sector.
Recent dry weather has demonstrated the continued vulnerability of water resources to drought and climate variability. Increasingly frequent and severe extreme weather events reinforce the need to improve resilience through both demand management and investment in new water resources infrastructure.
Reducing leakage and improving water efficiency are critical. Achieving the WRMP24 demand reduction targets will require sustained improvements in company performance, customer engagement and behavioural change. Continued smart meter rollout will help customers understand and manage water use and provide companies with better data to identify leaks and target action.
Water companies must report annually on progress against their WRMPs. This report reviews sector-wide performance in 2025 to 2026. It assesses delivery of WRMP24 and identifies actions needed to meet future targets as companies consider the evidence, challenges and opportunities to inform development of WRMP29.
This report presents our assessment of annual review submissions, including both national (England) and company-level data. It compares individual performance against national averages and company-specific WRMP forecasts. National comparisons cover the 17 principal water companies. The annex also provides a separate assessment of Veolia Water Projects. Where a company is high achieving in relation to the rest of the industry, underperformance against its own planned levels may still prompt regulatory action. Joint regulatory letters addressing such issues will be published towards the end of the 2026 calendar year.
1.2 A year in water resources
The period from April 2025 to March 2026 saw a change in weather conditions across England, as shown in Figure 1. After an exceptionally dry spring and summer 2025, followed by much wetter conditions and recovery during autumn and winter, water resources recovered. Widespread drought returned after the reporting year.
Between April and August 2025, rainfall was below average, leading to drier soils, lower groundwater levels and falling reservoir stocks. August was the driest since 2003, and the period from February to August was the driest since 1976. As a result, reservoir storage fell to 57% by the end of August.
Wetter weather during autumn 2025 and winter 2025 to 2026 helped water resources recover by March 2026. February 2026 was particularly wet, receiving 170% of average rainfall. However, dry conditions returned after the reporting year, with a widespread drought across the majority of England. This drought broke records, with:
- over 30 million people having their water use restricted through temporary use bans (TUBs)
- the driest July on record
- the hottest summer on record with 5 heatwaves
Figure 1: Monthly observed rainfall between April 2025 and March 2026
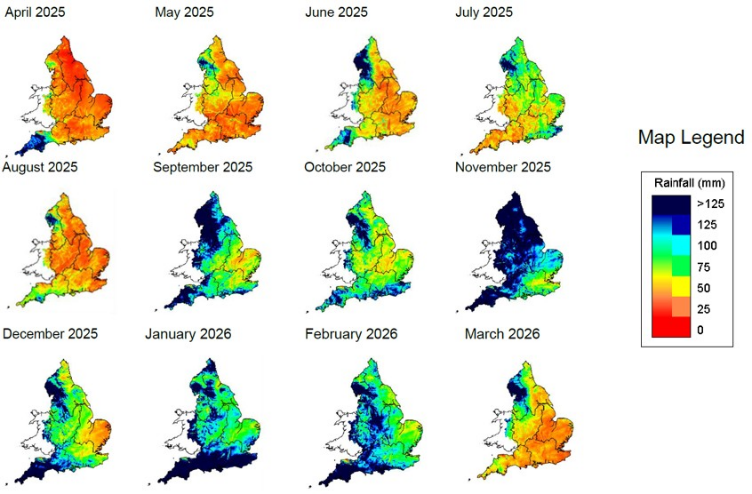
UKPP radar data (Source: Met Office. Crown copyright, 2026). All rights reserved. Environment Agency, AC0000807064, 2026.
1.3 Summary of drought impacts
The dry weather during spring and summer 2025 put water resources under significant pressure across England, although northern and central England were worst affected. Water companies acted to maintain supplies by introducing TUBs for over 10 million people. The Environment Agency and National Drought Group worked with the industry to monitor conditions and manage drought impacts.
Although wetter weather during autumn and winter 2025 to 2026 helped water resources recover, dry conditions returned during spring and summer 2026. This demonstrated how quickly water resources can come under pressure, even after substantial rainfall, highlighting the need for ongoing drought planning and preparedness.
The drought conditions experienced in 2025, and their return in 2026, highlight the growing challenges presented by climate change. More frequent and intense weather extremes, including both droughts and heavy rainfall, are expected in the future. This makes it increasingly important to reduce leakage, improve water efficiency and develop new water supplies to secure reliable water for people and the environment.
The events of 2025 and 2026 show how quickly weather conditions can change and highlight the need to plan for extreme weather and strengthen resilience to climate change. For more drought information see our Dry Weather Information 2025.
The Environment Agency publishes monthly water situation reports which provide more detail on monthly rainfall data compared to long term averages.
2. Analysis of 2025 to 2026 data
This report assesses how water companies performed in managing water resources across England during 2025 to 2026. It provides national, company and water resource zone summaries. Water resource zones are areas where customers receive water from the same sources and face similar risks to water supply.
We use the data to assess how water companies are performing compared with previous years and against the forecasts set out in their current WRMP24.
The contrasting weather conditions in 2025 to 2026 provide an important opportunity to understand how resilient water supplies are to changing weather patterns.
The annual review data submitted by water companies is available on data.gov.uk. There may be some differences between figures reported by the Environment Agency and Ofwat because the organisations use different reporting requirements and performance measures.
Data used to assess performance
We use 2 main types of data to assess how water companies are performing:
- outturn data
- dry year annual average (DYAA) adjusted data
Outturn data
Outturn data shows the actual performance achieved by a water company during the reporting year, including how much water was supplied and used. We compare this information with the forecasts in the company’s latest WRMP24 to assess whether it is on track to deliver its long-term commitments.
Dry year annual average (DYAA) adjusted data
We use DYAA adjusted data to understand how water company systems would have performed in the reporting year if it were to have experienced a severe drought.
During dry conditions, demand for water typically increases, while the amount of water available from rivers, reservoirs and groundwater sources can be reduced. To allow fair comparisons, water companies adjust their outturn data to account for the effects of weather and other temporary factors. This enables a like-for-like comparison against the DYAA scenario of its WRMP forecast.
The DYAA scenario represents the average level of demand that would be expected over an entire dry year and is an important part of water resources planning.
By planning to the DYAA scenario, this helps water companies to:
- plan for higher levels of water demand during prolonged dry weather
- maintain reliable water supplies during drought conditions
- identify where investment is needed to improve resilience and secure future water supplies
- reduce the risk of supply restrictions, like TUBs, being required during periods of water scarcity
Unless otherwise stated, the figures presented in this report are based on the latest annual review data submitted by water companies. Some published values may differ slightly from those reported by companies due to rounding and the aggregation of data at regional and national scales. Water companies may also update previously reported data where new information becomes available, and any significant revisions will be reflected in future publications.
2.1 Quality of submissions
This section is new for this year’s report. It provides an assessment of the quality of companies’ annual review data submissions. It aims to:
- improve submitted data quality
- reduce the time and resource required to resolve data issues
- ensure datasets are suitable for analysis
We assessed submissions based on the number, severity and extent of errors, including whether they triggered the templates’ inbuilt quality assurance (QA) checks. Companies were required to correct and resubmit data where issues were identified.
Table 1 sets out the scoring framework and companies’ results. Most companies scored 3 or above, reflecting moderate or significant errors, and some required multiple resubmissions. Only one company submitted a return requiring no amendments, while a small number needed only minor corrections. With six companies scoring 4 or 5, there is considerable scope to improve submission quality across the industry.
High-quality data is essential for effective regulation, transparent reporting and informed decision-making. Annual Review 2026 (AR26) performance falls short of our expectations. Companies should have the systems, governance and QA processes needed to provide accurate and reliable data at first submission. For AR27, we expect a significant improvement, with companies achieving a score of 3 or below.
Table 1: Quality Scores for AR26 submissions showing the assessment categories used to evaluate submission quality and the companies allocated to each score
| Score | Definition | Companies receiving score |
|---|---|---|
| 1 | No errors found, no resubmission required | SES Water |
| 2 | Minor errors, resubmission required | Bristol Water, Severn Trent Water, Wessex Water |
| 3 | Moderate errors or incomplete data fields (or both) but not impacting key metrics nor flagged by inbuilt QA system, requiring at least one resubmission | Affinity Water, Northumbrian Water, Portsmouth Water, South East Water, South Staffordshire Water, Thames Water, United Utilities, Veolia Water Projects |
| 4 | Significant errors impacting key metrics or flagged by inbuilt QA system (or both), often several resubmissions required | Cambridge Water, Essex & Suffolk Water, South West Water, Southern Water, Yorkshire Water |
| 5 | Alteration of formulae or the template format resulting in a change to calculation (or calculations), often in conjunction with moderate or significant errors, one or more resubmissions required | Anglian Water |
2.2 Overall supply-demand balance (SDB)
SDB measures whether a water company has enough water to meet customer needs while protecting the environment during dry conditions. A surplus means there is expected to be sufficient water available to manage droughts and other pressures. A deficit means available supplies may not be sufficient to meet demand during a drought without further action.
The 2025 to 2026 reporting year was much drier than the previous year, with dry conditions and regional drought impacts during spring and summer 2025. As a result, the overall surplus of water available across England fell compared with 2024 to 2025.
While some water companies improved their position, several reported lower surpluses than the previous year and some water resource zones continued to report deficits. This means that, in some areas, there may not be enough water available to meet demand during severe drought conditions. Unlike the other data presented in this report, the SDB figures are based on DYAA conditions rather than reported outturn conditions, to reflect the supply-demand position under a dry-year scenario. Under this dry year adjusted scenario, the data submitted showed that in one or more resource zones:
- South East Water, South West Water and Southern Water reported a significant SDB deficit, meaning forecast demand was greater than the available water supply
- Anglian Water, Essex & Suffolk Water, Thames Water and Wessex Water reported small supply-demand deficits, meaning that the buffer for uncertainty (known as ‘headroom’) was used to maintain supplies
- Affinity Water, Bristol Water, Cambridge Water, Northumbrian Water, Portsmouth Water, SES Water, Severn Trent Water, South Staffordshire Water, United Utilities and Yorkshire Water were able to maintain a surplus of supplies
The drought highlighted the importance of delivering the actions set out in WRMP24s. This included reducing leakage, helping customers use water efficiently and bringing new water supply schemes into operation on time. Although progress has been made in some areas, the overall picture shows that more needs to be done faster to improve resilience to future droughts.
Regulators will continue to work closely with water companies to make improvements. Where future droughts risk disrupting supplies, companies are expected to take urgent action to reduce the risks and improve resilience for customers and the environment.
2.3 Water abstracted, water losses and operational use
In 2025 to 2026, water companies in England abstracted 14,874 Ml/d from the environment. This is an increase from 14,615 Ml/d the previous year. This rise in abstraction can be partly explained by the dry weather and associated increase in customer demand. Reducing the water taken from rivers, reservoirs and groundwater is important to help protect the environment and improve long term water resilience.
Before water enters the supply network (that is, being distributed to customers), some is lost during transport, treatment and operational activities. In 2025 to 2026, around 655 Ml/d, or 4.4% of all water abstracted, was lost or used before entering the distribution network. This is an increase from 526 Ml/d (3.8%) in 2024 to 2025.
These losses are not classified as leakage and there will be legitimate reasons for some of this. However, water companies need to minimise the losses before water enters the supply network. This will support a more resilient and reliable water supply, particularly during periods of increased demand and environmental pressure.
Figure 2 shows considerable variation between companies for water losses and operational use as a percentage of Distribution Input (DI). This is the amount of water put into supply or entering the distribution network. Some differences are expected due to factors such as geography, the length and design of raw water networks, and raw water quality requiring treatment.
The volume of water lost or used before entering the supply network increased by almost 129 Ml/d (24%) compared with the previous year. Several companies reported notable increases, with Thames Water showing the largest rise in losses and operational use. We will continue to engage with companies whose performance is significantly above the national average. We expect them to explain the reasons for higher losses and take appropriate action to reduce them.
Some companies demonstrated that lower levels of losses are achievable. South East Water again reported very low levels of water losses and operational use before supply. We continue to work with companies to understand and share good practice that can help reduce losses and improve the efficient use of water resources.
Figure 2: Water losses and operational use as a percentage of DI per company in 2025 to 2026
| Water company | Water losses as % of DI |
|---|---|
| Thames Water | 10.0% |
| South Staffordshire Water | 7.1% |
| Bristol Water | 6.4% |
| Anglian Water | 4.9% |
| Southern Water | 4.8% |
| National average | 4.6% |
| SES Water | 4.6% |
| Wessex Water | 4.4% |
| Essex & Suffolk Water | 4.4% |
| South West Water | 4.1% |
| Northumbrian Water | 4.1% |
| Yorkshire Water | 3.8% |
| United Utilities | 2.7% |
| Severn Trent Water | 2.6% |
| Affinity Water | 1.9% |
| Cambridge Water | 1.8% |
| Portsmouth Water | 1.8% |
| South East Water | 0.2% |
2.4 Outage
Outage measures the temporary reduction in water supply capacity resulting from planned maintenance activities or unplanned events. This includes equipment failures, power interruptions, treatment process issues and raw water quality incidents.
In 2025 to 2026, water companies reported outages of 378 Ml/d in total. This is around 140 Ml/d lower than the 518 Ml/d reported in 2024 to 2025, representing a reduction of 27%. Nationally, outage also remained well below the WRMP24 forecast level of 572 Ml/d, indicating that the sector performed better than anticipated overall.
Outage events that exceed 6 months are not counted in the outage figures but are reflected in a lower amount of water available for supply. This means companies can have a lower than planned level of outage but have less supplies available than expected.
Reported figures reflect DYAA conditions and represent the impact of outages on the amount of water available for use. As a result, data reported to the Environment Agency may differ from outage figures reported through Ofwat’s annual performance reporting.
Performance across individual companies remained varied:
- 11 companies reduced outage compared with the previous year, with the largest reductions reported by Affinity Water, Anglian Water, Thames Water and United Utilities
- 6 companies recorded higher outage levels than in 2024 to 2025, including notable increases at South West Water and Wessex Water
- while most companies reported outage below their WRMP24 forecasts, 7 companies remained above forecast levels, with Wessex and Southern showing the largest deviation from forecast – they will need to maintain focus on improving asset reliability and operational resilience
The reduction in total outage was driven largely by improvements at several of the larger water companies. This demonstrates that targeted asset management and operational interventions can deliver substantial benefits. However, the continued variation in performance between companies suggests that the causes of outage are not yet being managed consistently across the sector.
Water companies should continue to strengthen both preventative maintenance and incident response arrangements. This is to minimise the impact of outages on available water supplies while ensuring assets remain fit for the long term.
2.5 Distribution input (DI)
DI represents the volume of treated water entering the distribution network for supply to customers. In 2025 to 2026, water companies reported total DI of 14,110 Ml/d nationally, an increase of approximately 168 Ml/d (1.2%) compared with 2024 to 2025.
The breakdown of national DI for 2025 to 2026 is presented in Figure 3. The overall composition of DI has remained broadly unchanged from 2024 to 2025. Household consumption accounts for the largest proportion of water supplied, followed by non-household consumption and leakage.
Figure 3: National demand and leakage contribution to total DI in 2025 to 2026
| National demand and leakage | % of total DI |
|---|---|
| Leakage | 18.57% |
| Non-household consumption | 19.24% |
| Measured household consumption | 33.05% |
| Unmeasured household consumption | 25.65% |
| Other | 3.49% |
At a water company level, trends were mixed:
- 14 companies reported higher DI than the previous year, while 3 reported reductions
- the largest increases were reported by Anglian Water, Thames Water and United Utilities
- Severn Trent Water, Southern Water and Yorkshire Water reported decreases
- only 2 companies were below forecast – Cambridge Water and Southern Water
Over the same period, the reported population served by water companies increased by around 700,000 people. As a result, DI on a person basis remained broadly unchanged at around 229 l/p/d. This suggests that the increase in water supplied was largely associated with population growth rather than a significant increase in water use per person.
Under the Environment Act 2021, the Environmental Targets (Water) (England) Regulations 2022 established a national target to reduce DI per person by 20% by 2037 to 2038, relative to 2019 to 2020 levels. This equates to a reduction of around 1.1% a year.
Progress against this target is set out in Table 2. In 2025 to 2026, national DI per person was 229 l/p/d, a reduction of approximately 5% compared with the 2019 to 2020 baseline. Whilst this indicates that progress has been made towards the long-term target, there has been no reduction in the past year. Further reductions will be required over the coming years to remain on track for delivery. Continued progress on leakage reduction, water efficiency and metering is important to offset future population growth, strengthen resilience to drought and other water resources pressures. This progress is expected to be supported by national level interventions from government such as mandatory water efficiency labelling of water-using products.
Table 2: Nationally reported DI and population data and progress against the water demand target
| Metric | Unit | 2019 to 2020 | 2020 to 2021 | 2021 to 2022 | 2022 to 2023 | 2023 to 2024 | 2024 to 2025 | 2025 to 2026 |
|---|---|---|---|---|---|---|---|---|
| DI | Million litres per day (Ml/d) | 13,732 | 14,175 | 13,927 | 14,075 | 13,877 | 13,946 | 14,110 |
| Population | Thousands | 56,895 | 57,636 | 58,405 | 58,883 | 59,617 | 60,848 | 61,535 |
| DI per person | Litres per person per day (l/p/d) | 241.4 | 245.9 | 238.5 | 239 | 232.8 | 229.2 | 229.3 |
| DI per population reduction from 2019 to 2020 baseline | % reduction | 0.00% | -1.90% | 1.20% | 1.00% | 3.60% | 5.06% | 5.01% |
Figure 4 compares company-level DI per capita against the national average. In 2025 to 2026, the national average was approximately 229 l/p/d. Company performance continued to vary, with values ranging from 202.2 l/p/d in the Southern Water area to 278.4 l/p/d in the South West Water area. That is a difference of approximately 76 l/p/d across the sector. This variation reflects differences in demand characteristics, metering levels, leakage performance, operational factors and local circumstances.
Figure 4: Reported DI per person at a water company level for 2025 to 2026
| Water company | DI per capita in litres |
|---|---|
| South West Water | 278.4 |
| Northumbrian Water | 249.0 |
| Wessex Water | 247.4 |
| Portsmouth Water | 240.2 |
| Thames Water | 239.8 |
| Affinity Water | 234.5 |
| United Utilities | 230.7 |
| South East Water | 230.2 |
| National average | 229.3 |
| Yorkshire Water | 225.2 |
| Cambridge Water | 221.7 |
| Bristol Water | 221.5 |
| Anglian Water | 221.3 |
| Essex & Suffolk Water | 218.8 |
| South Staffordshire Water | 216.3 |
| SES Water | 214.3 |
| Severn Trent Water | 213.6 |
| Southern Water | 202.2 |
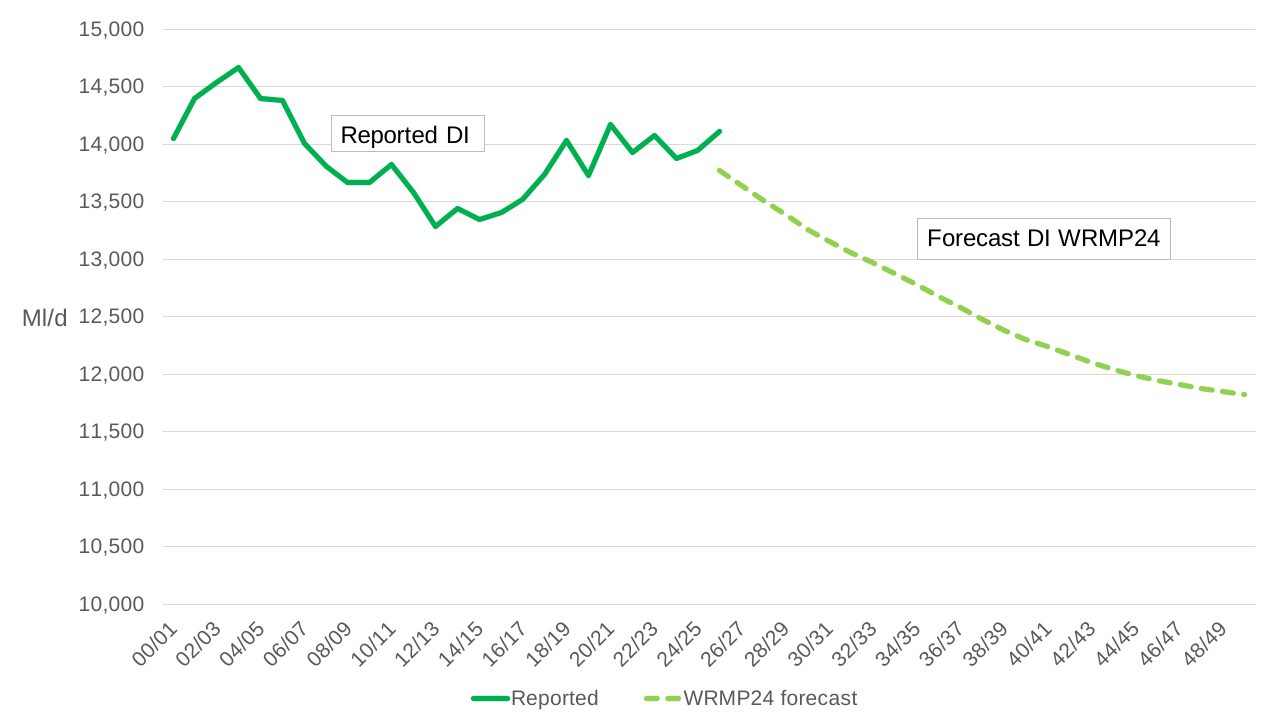
In their WRMP24 plans, in total, water companies forecasted a dry year DI of 13,774 Ml/d for 2025 to 2026. However, the industry reported a DI of 14,110 Ml/d through the annual review process, that is around 336 Ml/d above the forecast level. This suggests that, despite progress in some areas, the sector as a whole is not yet delivering the level of demand reductions anticipated in WRMP24.
To meet the 2025 to 2026 forecast, a reduction of around 172 Ml/d from the 2024 to 2025 reported DI would have been required. Instead, DI increased by around 168 Ml/d during the year, as shown in Figure 5. The population served by water companies increased by around 700,000 people. As a result, while total water supplied increased, DI per person remained broadly stable compared with the previous year.
Figure 5: England-wide reported DI from 2000 to 2001 through 2025 to 2026, and WRMP24 forecast DI thereafter (based on WRMP24 plans)
2.6 Leakage
Water companies have an important role in ensuring water is used efficiently. While many factors affect how much water is available to meet demand, companies have direct control over leakage. They are responsible for finding and fixing leaks to reduce water waste.
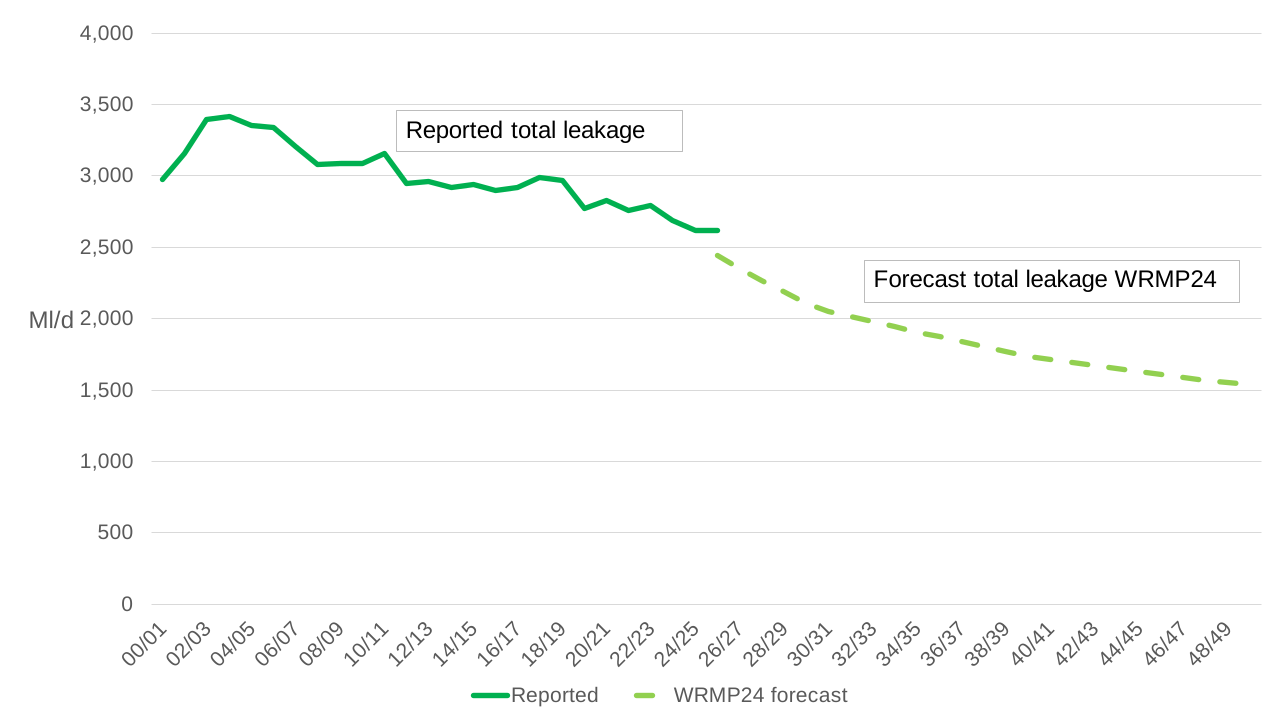
As Figure 6 shows, progress in leakage reduction over the past two decades has been variable. Nationally, total leakage was 2,621 Ml/d in 2025 to 2026. This is broadly unchanged from the 2,617 Ml/d reported in 2024 to 2025. Whilst it remains among the lowest levels reported over the last two decades, it is not on track to meet the reduction targets the industry has committed to.
Leakage is above forecast levels in WRMP24, by 180 Ml/d, despite the plans only being in place one year. The drought conditions last year would have led to higher levels of ground movement resulting in more underground pipe damage. However, we expect that water companies experiencing drought conditions should dedicate more resources to finding and repairing leaks in line with their drought plans.
Leakage continues to be a significant component of water put into supply. Leakage accounted for 18.6% of DI in 2025 to 2026, meaning that almost one in every 5 litres entering the network was lost before reaching customers. We do not consider this level of water loss acceptable and expect companies to continue reducing leakage to improve water efficiency and resilience.
The drought conditions of 2025 and 2026 showed that protecting supplies and reducing leakage remain critical priorities for the industry. This is particularly important where TUBs are in place, or where consumers are being asked to reduce their consumption voluntarily. Yorkshire Water, United Utilities and Severn Trent Water were companies in drought affected areas and they all achieved leakage reductions and met or exceeded their own forecasts. Other companies should explore how they can learn from these companies to reduce leakage.
The water industry, through Water UK, has committed to halve leakage by 2050 compared with 2017 to 2018 levels. At that time leakage was 2,987 Ml/d. Figure 6 shows that leakage has reduced to 2,621 Ml/d, around 12% reduction from that baseline, equivalent to an average of around 1.5% per year. While this represents progress, a faster rate of improvement will be needed if the sector is to meet its long-term commitment. Achieving the 2050 target of 1,494 Ml/d requires a further 1,127 Ml/d reduction, averaging 47 Ml/d or around 1.8% per year.
Figure 6: England-wide reported total leakage from 2000 to 2001 through 2025 to 2026, and WRMP24 forecast total leakage thereafter (based on WRMP24 plans)
Leakage reduction must remain a priority across the water industry. Through WRMP24, companies have identified measures to achieve the reductions required over the coming decades, including smart metering, pressure management and mains replacement. We expect companies to deliver on these commitments and minimise the amount of treated water lost from the public supply network. Additional resources will be needed to get leakage levels back on track with planned levels over the coming years.
This year reflects increasingly disparate leakage performance among water companies. Figures 7, 8 and 9 show company performance using 3 different leakage metrics. In 2025 to 2026, average leakage across England was 18.6% of DI, 42.6 l/p/d, and 101 litres per property per day. These figures highlight the continuing scale of leakage across the sector despite the reductions achieved over recent years. This percentage is influenced by consumption and should be considered alongside leakage per person and per property.
Performance varied considerably between companies. Figures 7, 8 and 9 show that leakage ranged from around:
- 11% to 22% of DI
- 24 to 55 l/p/d
- 60 to 137 litres per property per day
This variation demonstrates that opportunities remain for some companies to improve performance and reduce water losses further. Leakage as a percentage of DI is impacted by the level of consumption. In years where consumption from households and non-households has increased, the figure will reduce even if leakage is stable.
Essex & Suffolk Water and Bristol Water recorded the lowest leakage as a proportion of DI at approximately 11%. Thames Water and Wessex Water reported the highest values at around 22%. Leakage per person was also lowest for Essex & Suffolk Water and Bristol Water, at under 30 l/p/d. In comparison, over 50 l/p/d was reported by Wessex Water and Thames Water. Leakage per property was also highest for Thames Water, at around 137 litres per property per day. Bristol Water was much lower, reporting around 60 litres per property per day. These differences highlight the range of performance across the sector and demonstrate that there remains scope for some companies to reduce leakage further.
Figure 7: Leakage as a percentage of DI at a water company level for 2025 to 2026
| Water company | leakage as % of DI |
|---|---|
| Thames Water | 22.4% |
| Wessex Water | 22.1% |
| United Utilities | 21.1% |
| Yorkshire Water | 19.8% |
| National average | 18.6% |
| Portsmouth Water | 18.5% |
| South East Water | 18.4% |
| Anglian Water | 18.1% |
| South West Water | 17.6% |
| Severn Trent Water | 17.1% |
| South Staffordshire Water | 17.0% |
| Southern Water | 16.2% |
| Northumbrian Water | 15.7% |
| Affinity Water | 15.5% |
| SES Water | 14.4% |
| Cambridge Water | 14.1% |
| Bristol Water | 11.9% |
| Essex & Suffolk Water | 11.0% |
Figure 8: Leakage per person at a water company level for 2025 to 2026
| Water company | Leakage per person in litres |
|---|---|
| Wessex Water | 54.6 |
| Thames Water | 53.8 |
| South West Water | 49.0 |
| United Utilities | 48.6 |
| Yorkshire Water | 44.6 |
| Portsmouth Water | 44.4 |
| National average | 42.6 |
| South East Water | 42.3 |
| Anglian Water | 40.1 |
| Northumbrian Water | 39.2 |
| South Staffordshire Water | 36.7 |
| Severn Trent Water | 36.5 |
| Affinity Water | 36.3 |
| Southern Water | 32.8 |
| Cambridge Water | 31.2 |
| SES Water | 30.9 |
| Bristol Water | 26.4 |
| Essex & Suffolk Water | 24.1 |
Figure 9: Leakage per property at water company level for 2025 to 2026
| Water company | leakage per property |
|---|---|
| Thames Water | 136.71 |
| Wessex Water | 119.05 |
| United Utilities | 113.08 |
| Yorkshire Water | 103.77 |
| South West Water | 102.22 |
| South East Water | 101.57 |
| Portsmouth Water | 101.30 |
| National average | 101.29 |
| Affinity Water | 93.37 |
| Anglian Water | 92.15 |
| South Staffordshire Water | 91.49 |
| Severn Trent Water | 87.15 |
| Northumbrian Water | 87.07 |
| Cambridge Water | 80.80 |
| Southern Water | 76.56 |
| SES Water | 74.84 |
| Essex & Suffolk Water | 61.21 |
| Bristol Water | 60.21 |
Figure 10 shows the normalised values for the components of leakage per person, as a percentage of DI and per property for each water company. This allows performance to be compared between companies.
Figure 10: Normalised leakage at water company level 2025 to 2026
| Water company | leakage per property | leakage as % of DI | Leakage per person in litres |
|---|---|---|---|
| Bristol Water | 60.21 | 11.93 | 26.43 |
| Essex & Suffolk Water | 61.21 | 11.00 | 24.06 |
| SES Water | 74.84 | 14.44 | 30.94 |
| Southern Water | 76.56 | 16.23 | 32.81 |
| Cambridge Water | 80.80 | 14.08 | 31.20 |
| Northumbrian Water | 87.07 | 15.74 | 39.18 |
| Severn Trent Water | 87.15 | 17.11 | 36.54 |
| South Staffordshire Water | 91.49 | 16.96 | 36.67 |
| Anglian Water | 92.15 | 18.12 | 40.10 |
| Affinity Water | 93.37 | 15.46 | 36.26 |
| National average | 101.29 | 18.57 | 42.59 |
| Portsmouth Water | 101.30 | 18.50 | 44.42 |
| South East Water | 101.57 | 18.38 | 42.33 |
| South West Water | 102.22 | 17.60 | 49.01 |
| Yorkshire Water | 103.77 | 19.83 | 44.64 |
| United Utilities | 113.08 | 21.09 | 48.65 |
| Wessex Water | 119.05 | 22.07 | 54.60 |
| Thames Water | 136.71 | 22.44 | 53.82 |
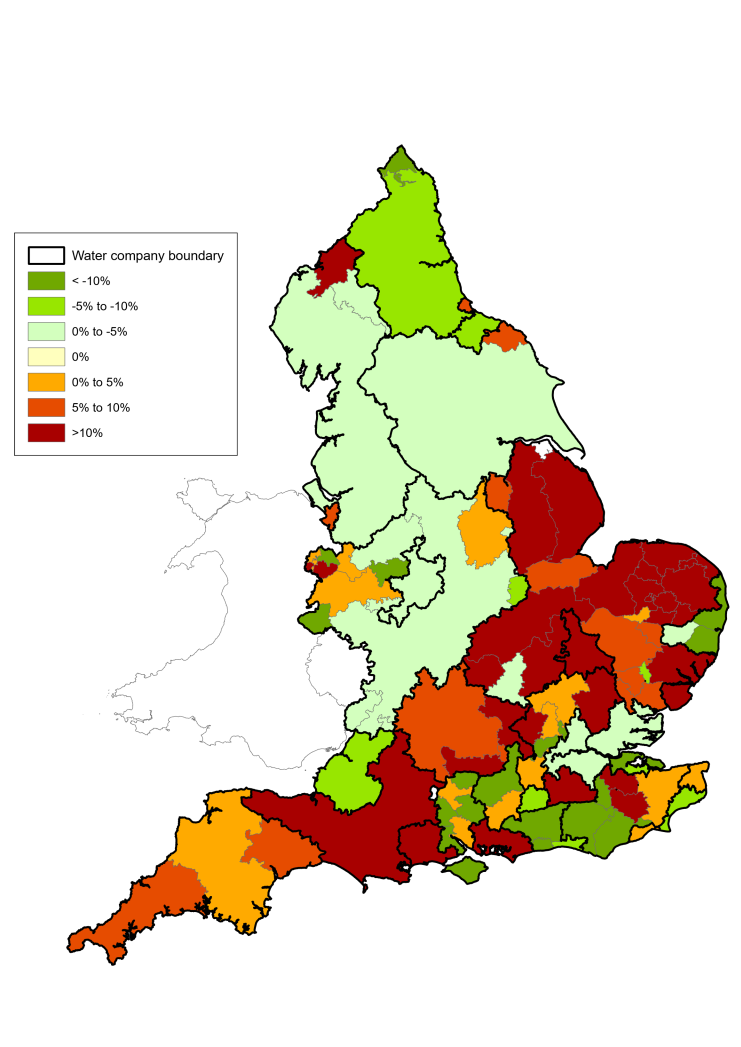
Changes since 2024 to 2025 were also mixed. Anglian Water reported the largest company-wide increase in leakage, with levels rising by more than 28 Ml/d (15%). Leakage also increased at Cambridge Water, Portsmouth Water, SES Water and Wessex Water by more than 10%. In contrast, several companies reported reductions of over 5%, including Southern Water, Northumbrian Water, Essex & Suffolk Water and Bristol Water. Nine out of 17 companies have reported lower leakage in comparison to the previous year. This progress is welcome and shows that substantial benefits can be achieved where investment is prioritised and targeted. Despite these improvements, the overall national position remained broadly unchanged as the reductions were largely offset by those companies where leakage increased.
Although national leakage remained broadly stable, Figure 11 shows that performance at the water resource zone level was mixed. Some zones achieved notable reductions in leakage, while others reported increases. This variation demonstrates the importance of maintaining a continued focus on leakage management at a local level. Once leakage increases, it can be difficult and costly to return to previous levels.
Weather conditions can have a significant influence on leakage performance. Periods of prolonged dry weather and freeze-thaw conditions can increase the frequency of bursts and pipe failures. This has been evident in the summer of 2025 and has continued into summer 2026, with record-breaking spells of hot, dry weather. As climate change is expected to increase the occurrence of these conditions, companies must ensure that their networks remain resilient. Further action is needed to ensure better leakage preparedness ahead of weather events to minimise leakage breakouts and their impact. Leakage reduction programmes must continue to deliver sustained improvements under the operating conditions now being experienced, and also those which could be even more challenging.
Nationally, leakage increased slightly by 4 Ml/d (0.1%) and remained above the WRMP24 forecast. Performance varied substantially between companies and water resource zones.
Figure 11: Percentage change of total leakage from 2024 to 2025, to 2025 to 2026 at a water resource zone level, using data reported through the annual review
2.7 Household consumption
Water companies play a key role in helping customers use water efficiently at home.
In 2025 to 2026, reported household consumption across England was 8,283 Ml/d, an increase of 114 Ml/d (1.4%) compared with 8,169 Ml/d in 2024 to 2025.
Household water use per person, known as per capita consumption (PCC), can be used as a way of comparing household consumption across the country. It can also be used to track progress from year-to-year. We acknowledge that trends are affected by changes to estimates of population. Reducing PCC remains critical to achieving long-term reductions in water demand and supporting delivery of national water resource and environmental objectives. These objectives include the water demand target set out in the Environment Act 2021 and the Department for Environment, Food and Rural Affairs’ (Defra’s) Environmental Improvement Plan.
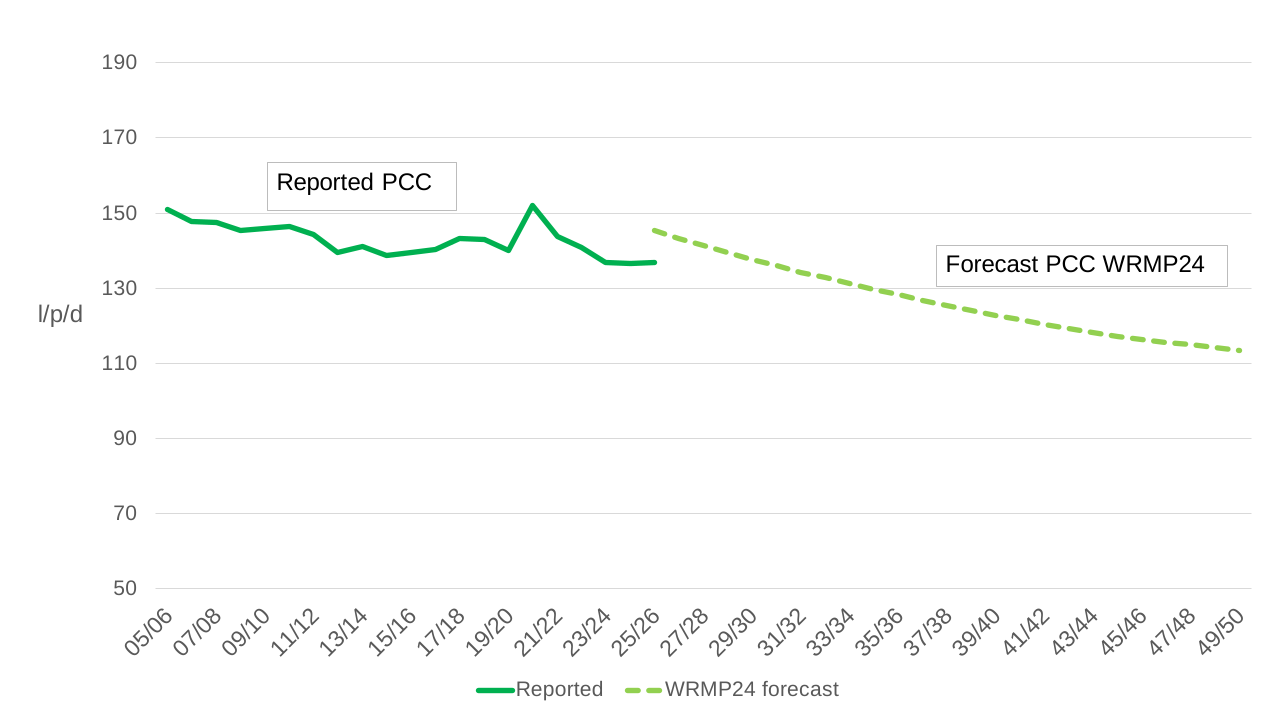
In 2025 to 2026, average household PCC across England was 136.9 l/p/d, broadly unchanged from 136.5 l/p/d in 2024 to 2025. PCC remained stable despite dry conditions across much of England, which would typically increase household water demand. Hotter and drier weather increases water use, particularly in households with gardens, and can place pressure on the water supply systems to meet demand peaks.
Water-efficiency activities, customer communications and TUBs may have influenced demand, alongside weather and demographic factors.
Figure 12 illustrates the longer-term trend in PCC. Following the increase in household water use observed during the COVID-19 pandemic, PCC reduced in subsequent years before remaining broadly unchanged in 2025 to 2026. This highlights the importance of maintaining momentum on water efficiency measures if future demand reduction targets are to be achieved.
Figure 12: England-wide reported average PCC from 2000 to 2001, through 2025 to 2026, and WRMP24 forecast average PCC thereafter (based on WRMP24 plans)
Average household PCC varied considerably between companies, ranging from 120.7 l/p/d in the Cambridge Water area to 155.4 l/p/d in the Northumbrian Water area (Figure 13). Differences between companies reflect a range of factors both inside and outside the company’s control. These include levels of household metering (and smart metering), water efficiency activities, customer demographics, housing characteristics, weather conditions and patterns of water use. As in previous years, these factors continue to influence regional variation in customer demand.
Figure 13: Average water company PCC reported in 2025 to 2026
| Water company | Average household PCC (l/p/d) |
|---|---|
| Northumbrian Water | 155.39 |
| Affinity Water | 154.49 |
| Essex & Suffolk Water | 154.30 |
| Bristol Water | 153.82 |
| Portsmouth Water | 153.82 |
| South West Water | 152.57 |
| SES Water | 151.86 |
| South East Water | 141.97 |
| Thames Water | 139.01 |
| National average | 136.87 |
| South Staffordshire Water | 135.01 |
| Severn Trent Water | 134.26 |
| Wessex Water | 132.43 |
| United Utilities | 127.24 |
| Southern Water | 126.60 |
| Yorkshire Water | 126.10 |
| Anglian Water | 123.31 |
| Cambridge Water | 120.72 |
Performance at company level in comparison to the previous year was mixed. Eight companies reported lower PCC than in 2024 to 2025, with the largest reductions reported by Portsmouth Water, South Staffordshire Water and Anglian Water. In contrast, several companies recorded increases in household consumption, including Bristol Water, SES Water and Northumbrian Water. This variation indicates that progress in improving water efficiency is not being achieved consistently across the sector.
Comparison with planned levels, set out in the WRMP24 forecasts, shows a similarly varied picture. Seven companies reported PCC below forecast. However, most companies were above forecast levels, with the largest variances reported by Affinity Water and Northumbrian Water. While some companies are surpassing planned demand reduction trajectories, others are finding it more challenging to deliver the reductions anticipated in their WRMP24 forecasts.
Further effort will be needed across the industry to reduce household water consumption. Accelerated delivery of smart water metering programmes (see section 2.9), water efficiency initiatives and customer engagement activities will be important in supporting long-term reductions in demand. These will come alongside national policies and interventions (see section 3.3). Reducing demand will improve resilience for future water resource pressures particularly with the challenge of climate change and more frequent droughts and heatwaves.
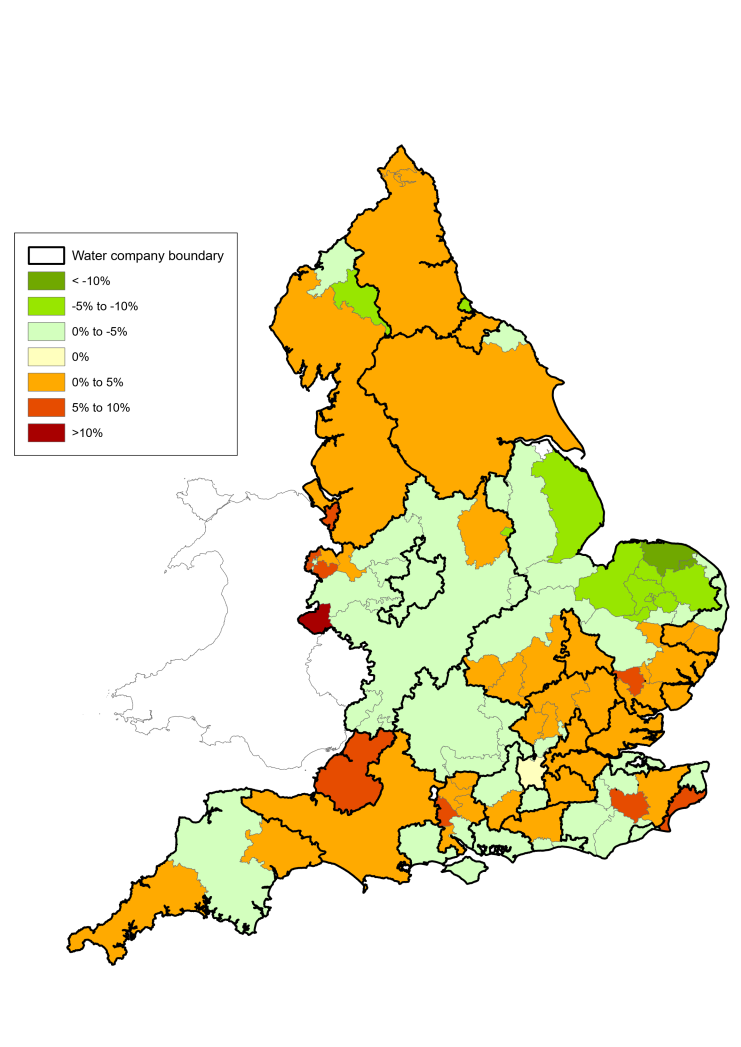
At the water resource zone level, more than half of all zones reported a decrease in PCC, despite drought conditions in many areas. This is shown in Figure 14. For a list of all zones that reported a PCC increase between 2024 to 2025, and 2025 to 2026, see PCC and leakage increases: zone data.
Figure 14: Map showing percentage change in reported average PCC between 2024 to 2025 and 2025 to 2026 at a water resource zone level
2.8 Non-household consumption
Non-household consumption represents water used by properties that are not classified as households, including businesses, schools, hospitals and student accommodation.
In 2025 to 2026, non-household consumption across England was 2,715 Ml/d, an increase of 9 Ml/d (0.4%) compared with 2,706 Ml/d in 2024 to 2025. The number of non-household properties decreased by 0.3% over the same period, demonstrating the increase in use was not caused by a growth in new connections.
Although consumption increased slightly compared with the previous year, it remains lower than in earlier years. This shows that non-household water use has stayed broadly stable over the longer term, despite changes in the number of non-household properties.
The government’s long-term ambition is to achieve a 9% reduction in non-household water use by 2037 to 2038, relative to 2019 to 2020 levels. This is set out in the Environmental Improvement Plan. Based on current reporting, the sector has achieved a reduction of 2.8% to date against this baseline, although progress remains uneven between companies and regions.
Significant reductions were reported by Anglian Water, at over 16 Ml/d, while smaller reductions were achieved across several other companies. In contrast, 9 companies recorded increases in non-household consumption, including South Staffordshire Water, Wessex Water and South East Water, all over 5 Ml/d. Several companies in East Anglia have temporary restrictions or moratoriums in place limiting the connection of new non-household properties. These restrictions are in place due to the lack of available water supplies in these areas.
Regional growth pressures continue to present challenges, particularly in areas already experiencing water resource constraints. In some locations, increasing business demand and population growth are placing additional pressure on available supplies, reinforcing the need for continued improvements in water efficiency.
The warm, dry summer of 2025 also led to increased demand from agricultural and horticultural businesses. Reducing consumption in the non-household sector will require sustained collaboration between water companies, retailers and customers, identifying savings opportunities and supporting more efficient water use.
The wider rollout of smart metering remains a key enabler of these ambitions. Improved consumption data can help businesses and other non-households better understand and manage their water use, while also supporting the identification of leakage and inefficiencies.
We expect companies to continue prioritising demand management and water efficiency initiatives to facilitate economic growth and protect the resilience of water supplies and the environment.
2.9 Metering of households and non-households
In 2025 to 2026, water company data shows that 65.2% of households in England were measured through a water meter, including unoccupied void properties. This is an increase from 62.7% in 2024 to 2025 and reflects continued progress in expanding household metering across England.
Water companies continue to identify metering as an important tool for reducing demand and improving water efficiency. Household metering rates remain highly variable between companies, as shown in Figure 15.
Several companies report rates above 80%, while others remain below 50%. South East Water reported the highest household metering rate at almost 89%, while Northumbrian Water reported the lowest at 45.5%. These differences reflect variations in water resource pressures, historic metering policies and the scale of meter installation programmes. An additional factor is whether the company is classified as being in an area of serious water stress. This classification permits the use of compulsory metering. Some properties may have a meter installed but remain on an unmeasured tariff. These properties are not counted as being measured.
Figure 15: Percentage of household properties with a meter installed, including void properties, reported by water companies in 2025 to 2026
| Water company | % meters installed |
|---|---|
| Northumbrian Water | 45.5% |
| Portsmouth Water | 46.4% |
| South Staffordshire Water | 47.8% |
| United Utilities | 49.8% |
| Severn Trent Water | 59.3% |
| Yorkshire Water | 60.9% |
| Thames Water | 61.7% |
| National average | 65.2% |
| Essex & Suffolk Water | 67.5% |
| Bristol Water | 69.4% |
| Affinity Water | 73.5% |
| SES Water | 73.6% |
| Wessex Water | 75.2% |
| Cambridge Water | 75.6% |
| Southern Water | 84.0% |
| South West Water | 84.4% |
| Anglian Water | 85.9% |
| South East Water | 88.7% |
For non-household customers, metering coverage remains significantly higher than for households, as shown in Figure 16. In 2025 to 2026, around 91% of non-household properties were billed on a metered tariff, excluding void properties. This is broadly unchanged from the previous year. Opportunities remain to meter the remaining unmeasured properties and replace older meters with newer technologies. Greater metering coverage can help customers understand water use and identify opportunities to reduce consumption.
Figure 16: Percentage of non-households being charged on a metered tariff excluding void properties, reported by water companies in 2025 to 2026
| Water company | % non-households excluding voids |
|---|---|
| Thames Water | 83.6% |
| SES Water | 86.3% |
| Affinity Water | 87.1% |
| Yorkshire Water | 87.1% |
| Portsmouth Water | 89.0% |
| Northumbrian Water | 89.1% |
| United Utilities | 90.2% |
| South Staffordshire Water | 90.6% |
| National average | 91.3% |
| Southern Water | 93.1% |
| Essex & Suffolk Water | 93.4% |
| Wessex Water | 93.7% |
| Cambridge Water | 94.6% |
| Severn Trent Water | 94.7% |
| South East Water | 96.1% |
| South West Water | 96.4% |
| Bristol Water | 97.0% |
| Anglian Water | 98.7% |
2.10 Smart water metering of households and non-households
Smart water meters are now expected to be the standard water meters being installed. Water companies continued to expand the installation of smart water meters during 2025 to 2026. Almost 20% of households in England had an Advanced Metering Infrastructure (AMI) smart meter, compared with approximately 12% in 2024 to 2025. This increase is significant nationally and if this pace is maintained, we can expect close to half of households to be smart water metered by 2030. Smart meters provide automatic and frequent readings of water use that can be viewed by the customer with the appropriate data systems in place. This can help identify leaks, improve customer understanding of water consumption and support more efficient water use.
The pace of smart meter rollout continues to vary between companies. With additional installations reported this year, Anglian Water has a household smart meter coverage of around 61%, with Thames Water and Essex & Suffolk Water having a coverage of over 30%. However, many companies remain at an earlier stage of deployment and currently report much lower levels of smart metering. This difference in household smart water metering between companies can be seen in Figure 17. Further growth is expected as companies deliver commitments set out in their WRMP24 and PR24 plans. Where appropriate, data from 2025 to 2026 and 2024 to 2025 has been combined to address data quality issues or gaps (or both). The Environment Agency is working with the industry to improve smart meter data reporting.
Figure 17: Percentage of households with a smart meter (AMI)
| Water company | % households with a smart water meter |
|---|---|
| South East Water | 1.4% |
| Cambridge Water | 3.2% |
| South Staffordshire Water | 4.0% |
| Bristol Water | 4.6% |
| Portsmouth Water | 4.7% |
| United Utilities | 6.1% |
| SES Water | 6.2% |
| Southern Water | 8.1% |
| Wessex Water | 8.2% |
| Affinity Water | 8.8% |
| Yorkshire Water | 11.3% |
| Northumbrian Water | 11.8% |
| South West Water | 17.3% |
| Severn Trent Water | 18.4% |
| National average | 19.9% |
| Essex & Suffolk Water | 30.9% |
| Thames Water | 36.4% |
| Anglian Water | 61.0% |
Smart meter coverage for non-household properties increased significantly during 2025 to 2026. Over 16% of non-household properties in England were reported to have a smart meter installed, up from around 9% in 2024 to 2025. This accounts for data reported in 2025 to 2026 and 2024 to 2025 where coverage remains highly variable between companies as seen in Figure 18. This reflects different investment programmes and delivery schedules, with Anglian Water leading with over half of their non-households with a smart meter. Expanding smart metering will help businesses understand water use, identify leaks and improve water efficiency. Water retailers also have an important role in both enabling the deployment of smart water meters and delivering their customers the benefits of smart water meter data insights provided by wholesaler water companies.
Figure 18: Percentage of non-households with a smart meter (AMI)
| Water company | % non-households with a smart water meter (AMI) |
|---|---|
| South East Water | 0.15% |
| Bristol Water | 0.90% |
| SES Water | 1.17% |
| Wessex Water | 1.89% |
| Affinity Water | 2.38% |
| Portsmouth Water | 2.68% |
| Southern Water | 3.17% |
| South Staffordshire Water | 3.96% |
| United Utilities | 5.49% |
| Cambridge Water | 5.72% |
| Severn Trent Water | 7.64% |
| Northumbrian Water | 8.21% |
| Yorkshire Water | 10.32% |
| South West Water | 11.68% |
| Essex & Suffolk water | 16.11% |
| National level (England) | 16.15% |
| Thames Water | 42.60% |
| Anglian Water | 51.78% |
2.11 WRMP and water industry national environment programme (WINEP) scheme delivery
The delivery of WRMP schemes remains essential to maintaining secure water supplies and protecting the environment. Annual review 2025 to 2026 submissions show continued progress in demand management activities, particularly smart metering, leakage reduction and water efficiency programmes.
Several companies have reported delays, revised delivery dates or changes to major supply schemes. These delivery issues are deeply concerning and where necessary they have been escalated with Defra. Regulators are working with the industry using the Regulators Alliance for Progressing Infrastructure Development (RAPID) to help address delivery challenges. We expect water companies to take proactive steps to enable delivery without delay. This increases reliance on adaptive planning, alternative options or interim drought measures in some areas.
Individual company WRMP and WINEP delivery progress is as follows:
- Affinity Water – A transfer, originally planned for March 2025, is now expected in summer 2027, and further delays remain possible which affects supply resilience and planned levels of service
- Anglian Water – Several strategic supply schemes have been reprofiled, with increased reliance on adaptive planning
- Cambridge Water – 3 WRMP supply schemes remain delayed due to planning constraints
- Essex & Suffolk Water – Delivery schedules for several major resource schemes have been revised and are under review through adaptive planning
- South East Water – As a result of high demand, the Greywell or Itchel licence reductions have not been implemented and the Bewl/Darwell INNS WINEP scheme, due to be completed in 2025, has been delayed
- South West Water – Some major future supply schemes face delivery risks associated with revised timescales and funding challenges
- Southern Water – Multiple major WRMP supply schemes have been delayed, increasing reliance on environmentally damaging drought measures in Hampshire. Completed environmental investigations that improved understanding of abstraction sustainability and may reduce the need for some future abstraction reductions
- Thames Water – Reduced deployable output from desalination continues to affect resilience and SDB
- Wessex Water – delivered 7 WINEP investigations ahead of schedule, resulting in abstraction licence reductions equivalent to 18.2 Ml/d
- Yorkshire Water – Delivery of 2 schemes has been affected by unexpectedly low yields and additional infrastructure requirements, and alternative options are now being developed. Completed major groundwater investigations and continues to progress Environmental Destination assessments
WINEP investigations are playing an increasingly important role in water resources planning. Water companies are progressing investigations into sustainable abstraction, Environmental Destination requirements and measures to meet Water Framework Directive objectives. The outcomes will inform future abstraction licences, environmental improvements and WRMP decisions.
For some companies, future WRMP delivery remains dependent on the timely completion of these investigations and greater certainty around future abstraction reductions. We therefore expect companies to continue prioritising delivery of both WRMP and WINEP programmes to support long-term resilience for customers and the environment.
2.12 New appointments and variations (NAVs)
NAVs are companies appointed by Ofwat. They provide water or wastewater services (or both) in areas that would otherwise be served by incumbent water companies. Most NAVs get water through bulk supply agreements with neighbouring water companies. Annex 1 contains a summary of the annual review report for each NAV.
The NAV sector continues to grow, supplying an increasing number of customers across England and playing a larger role in water resource management and demand reduction. This assessment covers 7 NAV companies with published WRMPs. Together, they serve around 413,000 people across 1,855 sites, importing around 82 Ml/d of water through bulk supply arrangements. NAVs now serve 0.67% of England’s population.
Overall, NAV companies reported lower demand, population growth and imported water volumes than forecast in their WRMPs:
- actual demand was approximately 74% of forecast
- actual population growth was 30% of forecast
- actual imported water was 47% of forecast
The population growth comparison excludes Leaf Water and Matrix Water because comparable actual population data were unavailable for 2024 to 2025. This was largely due to slower-than-expected development build-out rates and lower occupancy across many sites. Most companies maintained a positive SDB, with available supplies exceeding demand. Several NAVs also reported lower PCC than forecast and continued investment in smart metering, leakage monitoring and data collection systems.
While reporting quality continues to improve, there remains variation in the accuracy and maturity of data across the sector. We expect NAV companies to continue strengthening their monitoring and reporting processes, while maintaining a focus on water efficiency, demand management and leakage reduction to support delivery of their WRMP commitments.
3. Looking to 2026 to 2027 and beyond
3.1 Focus and expectations of the industry for 2026 to 2027
The 2026 to 2027 reporting year is the second year of asset management period 8 (AMP8), the water industry’s 5-year investment period from 2025 to 2030. Water companies should demonstrate clear progress in delivering the schemes, investigations and demand management activities committed to in their WRMP24s and PR24 business plans.
We expect companies to continue prioritising WRMP24 delivery and maintaining progress towards improving long-term water supply resilience. While some companies have reported positive progress, other AR26 submissions identified delays, changes to schemes and emerging delivery risks. Companies should take action to address these issues and demonstrate progress through future annual reviews.
Prolonged dry weather and drought conditions during 2026 placed additional pressure on water resources across England. Several companies implemented TUBs and applied for drought permits to take more water from the environment. We expect companies to evaluate the effectiveness of these measures and use lessons learned to strengthen future drought planning and demand management.
The year also highlighted supply resilience challenges, including pressures on water availability, infrastructure performance and the delivery of supply schemes. Companies should use these experiences to improve resilience and clearly explain how identified risks and lessons learned have informed future plans.
We expect companies to respond to issues identified through the AR26 process, particularly where performance has fallen short of forecasts or planned trajectories. Companies should also improve the quality, consistency and transparency of annual review submissions to support effective scrutiny and accountability.
We continue to expect all water companies to publish annual review reports and supporting performance data on their websites in a timely manner. Transparent reporting helps customers and stakeholders understand progress towards securing resilient and sustainable water supplies.
3.2 Smart water metering
The first year of AMP8 has seen smart water meter rollouts expand across England. Approximately 20% of households and 16% of non-household properties now have smart meters. However, progress varies between water companies. Some have established large programmes, while others are at an earlier stage of deployment.
Smart meters can help customers understand how much water they use. They can also help companies identify leaks more quickly and improve water efficiency. These benefits depend on companies collecting, managing and using large volumes of data that will be generated.
To deliver these benefits, water companies need:
- reliable systems to collect and manage smart meter data
- effective tools to identify leaks and high water use
- clear communication that helps customers understand and use the information provided
We understand that companies are at different stages in the development of their smart metering programmes and supporting systems. Smart Water Metering Customer Minimum Expectations have been developed to support a more consistent customer experience. This work was facilitated by Ofwat and supported by the Smart Water Metering Delivery Group, regulators, government, the Consumer Council for Water (CCW), MOSL and industry representatives. These expectations provide a common reference point as companies continue to develop their smart metering services and realise the benefits of smart metering. The Environment Agency expects companies to rapidly get systems in place to ensure they can deliver an appropriate smart water metering service to their customers.
As deployment increases, companies should provide customers with timely information about their water use. This can help customers reduce consumption and detect leaks sooner. A positive customer experience will underpin the success of smart metering programmes. Information should be clear, accessible and easy to act on.
Regulators will continue to work with the water industry to monitor progress and share good practice. Lessons learned during AMP8 should help improve delivery and increase water savings.
3.3 Government water efficiency policies and Ofwat water efficiency fund
Government continues to support delivery of the statutory target to reduce public water supply demand by 20% per person by 2038. These include smart metering, leakage reduction, water-efficient products and wider demand management policies.
A key development is the introduction of the mandatory water efficiency labelling scheme (MWELS), expected to be rolled out during 2027. The scheme will provide standardised water efficiency ratings for a range of water-using products. This aims to help consumers make more informed choices and support long-term reductions in water use.
Ofwat’s £100 million Water Efficiency Fund is now underway and comprises 2 programmes:
- Water Efficiency Lab
- Water Efficiency Campaign
The Water Efficiency Lab is a funding innovation to reduce water demand. It has initial projects focused on improving understanding of water use and a second funding round targeting customer-side leakage. The Water Efficiency Campaign, Let’s Save Water, aims to increase awareness of water efficiency and encourage water-saving behaviours among households and businesses. The campaign launched in the summer of 2026.
These initiatives are expected to make an important contribution to reducing water demand, with monitoring in place to evaluate their impact. Combined with continued action by water companies to reduce leakage and expand smart metering, these government, regulator-led programmes aim to achieve long-term water efficiency and resilience objectives.
3.4 Monitoring and adaptation
Water companies are expected to deliver the commitments set out in their published WRMPs to provide resilient water supplies for customers and the environment. Through PR24, Ofwat has introduced closer monitoring of major investment programmes and delivery commitments to help ensure companies deliver the improvements funded by customer bills.
Companies should have effective systems in place to monitor progress, identify emerging risks and respond where delivery is not on track. This includes taking timely action to address potential shortfalls in increasing supplies or reducing demand.
Where challenges arise, we expect clear and timely communication with regulators, customers and other stakeholders. Effective monitoring and adaptation are essential to maintain progress towards long-term water resource objectives.
3.5 Regional water resources planning and strategic resource options
Regional water resources planning continues to strengthen collaboration between water companies and other sectors that rely on water. Through regional water resources groups, organisations are working together to plan how water resources will be managed and shared to meet future needs. Work will include collaborating with other sectors such as agriculture and energy.
Regional plans include a range of strategic resource options, such as reservoirs, water transfers and water recycling schemes. Many schemes continue to progress through the RAPID gated process, detailed on Ofwat’s website. These schemes aim to improve long-term resilience and help ensure reliable water supplies while protecting the environment.
Regional water resources groups are working with regulators to prepare for the reconciliation of strategic inter-regional supply options, ahead of draft WRMP29. This is important to ensure that inter-regional options are being considered, evaluated and selected consistently, whilst taking account of the expected water needs in each region. We expect initial summary outputs on the options identified for reconciliation to be available in 2027.
As plans are delivered, it remains important for regional groups to track and monitor progress. It is important to understand how actions taken by one company, such as reducing demand or developing new supplies, may affect others. Effective regional coordination will be essential to delivering resilient and sustainable water resources for customers, communities and the environment.
4. Conclusions
The 2025 to 2026 annual review shows mixed progress and continuing challenges in managing England’s water resources. The dry conditions placed significant pressure on water supplies and demonstrated the need to strengthen resilience to drought and climate change.
National DI increased to 14,110 Ml/d and was 336 Ml/d above the WRMP24 forecast. This shows demand reductions are not yet on track. DI per person remained broadly unchanged at 229 l/p/d. Further reductions are needed to meet the statutory 2038 target.
Leakage remained broadly unchanged at 2,621 Ml/d and was 180 Ml/d above the WRMP24 forecast. Almost one-fifth of water entering networks was lost. Companies must increase leakage reduction and deliver planned improvements through smart metering, pressure management and mains replacement. This includes improving their preparation for and response to weather events to avoid significant rises in leakage. As water companies deploy smart water meters, they have a key role in alerting customers of any continuous flow and supporting the customer journey around suspected underground supply pipe leaks.
Household consumption remained broadly stable at 136.9 l/p/d. Most companies reported consumption above their WRMP24 forecasts. Non-household consumption also increased slightly. Progress against the government’s long-term reduction ambition remains limited and varies considerably between companies and regions.
Metering continued to improve, with meters installed at 65.2% of households. Household smart meter coverage increased to approximately 20%. Smart metering provides an important opportunity to reduce consumption, identify leaks and give customers better information about their water use.
Although national outage reduced and remained below the WRMP24 forecast, this should not be interpreted as evidence that all supply systems are becoming more resilient. Companies must balance the need to minimise outages with maintaining and investing in critical assets to ensure long-term reliability of supplies. Performance remained variable, with 7 companies reporting outage above forecast levels.
Water losses and operational use before distribution increased to 655 Ml/d. We expect companies to understand the causes of these losses and take action to reduce them, protecting both water supplies and the environment.
There has been positive progress in delivering some WRMP and WINEP activities. However, delays and delivery risks remain for several major supply schemes. Companies must closely monitor delivery, address emerging risks and communicate clearly when schemes or demand reductions are not progressing as planned.
The quality of annual review submissions also requires substantial improvement. Most submissions contained moderate or significant errors, and some required several resubmissions before they could be used for analysis. Our expectation is higher. Companies should have the systems, governance and QA processes in place to produce accurate, complete and reliable annual returns at the first submission. Poor-quality data creates unnecessary delays, increases regulatory effort and reduces confidence in reported performance.
Looking ahead, companies must demonstrate measurable progress against their WRMP24 and PR24 commitments during the remainder of AMP8. This requires sustained action to reduce leakage and demand, expand smart metering and deliver new water supplies on time. Effective delivery, transparent reporting and regional collaboration are essential to secure resilient supplies, protect the environment and support future growth.
Some companies have started the WRMP24 period in a worse position than their plans forecasted. One year into delivery, national performance for key metrics remains above forecast levels and several companies are reporting delays or risks to planned improvements.
As a result, some companies are already behind the trajectories needed to deliver their WRMP24 commitments. This increases the challenge of delivering future commitments and achieving long-term resilience objectives. We expect companies to understand and address the causes of underperformance and demonstrate clear evidence of progress towards planned WRMP24 trajectories.