Where we have identified any third party copyright information you will need to obtain permission from the copyright holders concerned.
This publication is available at https://www.gov.uk/government/publications/water-and-sewerage-companies-in-england-environmental-performance-report-2025/united-utilities-epa-data-report-2025
This report provides company specific data and information on the Environmental Performance Assessment (EPA) metrics. It contains current year and historic performance data (as published at the time, based on data provided in part by the water and sewerage companies). For further information on what each EPA metric and performance star ratings mean see our EPA metric guide.
In addition to the EPA metrics, this report contains a section on event duration monitoring (EDM) of storm overflows. For a comparison between water and sewerage companies and wider regulatory information see the environmental performance of the water and sewerage companies in 2025 report.
We set targets for each EPA metric. Water and sewerage company performance is then given a red, amber or green (RAG) status:
red – significantly below target
amber – below target
green – achieved target
We review and revise thresholds every 5 years.
1. EPA metric status and performance star rating
Main facts
For 2025:
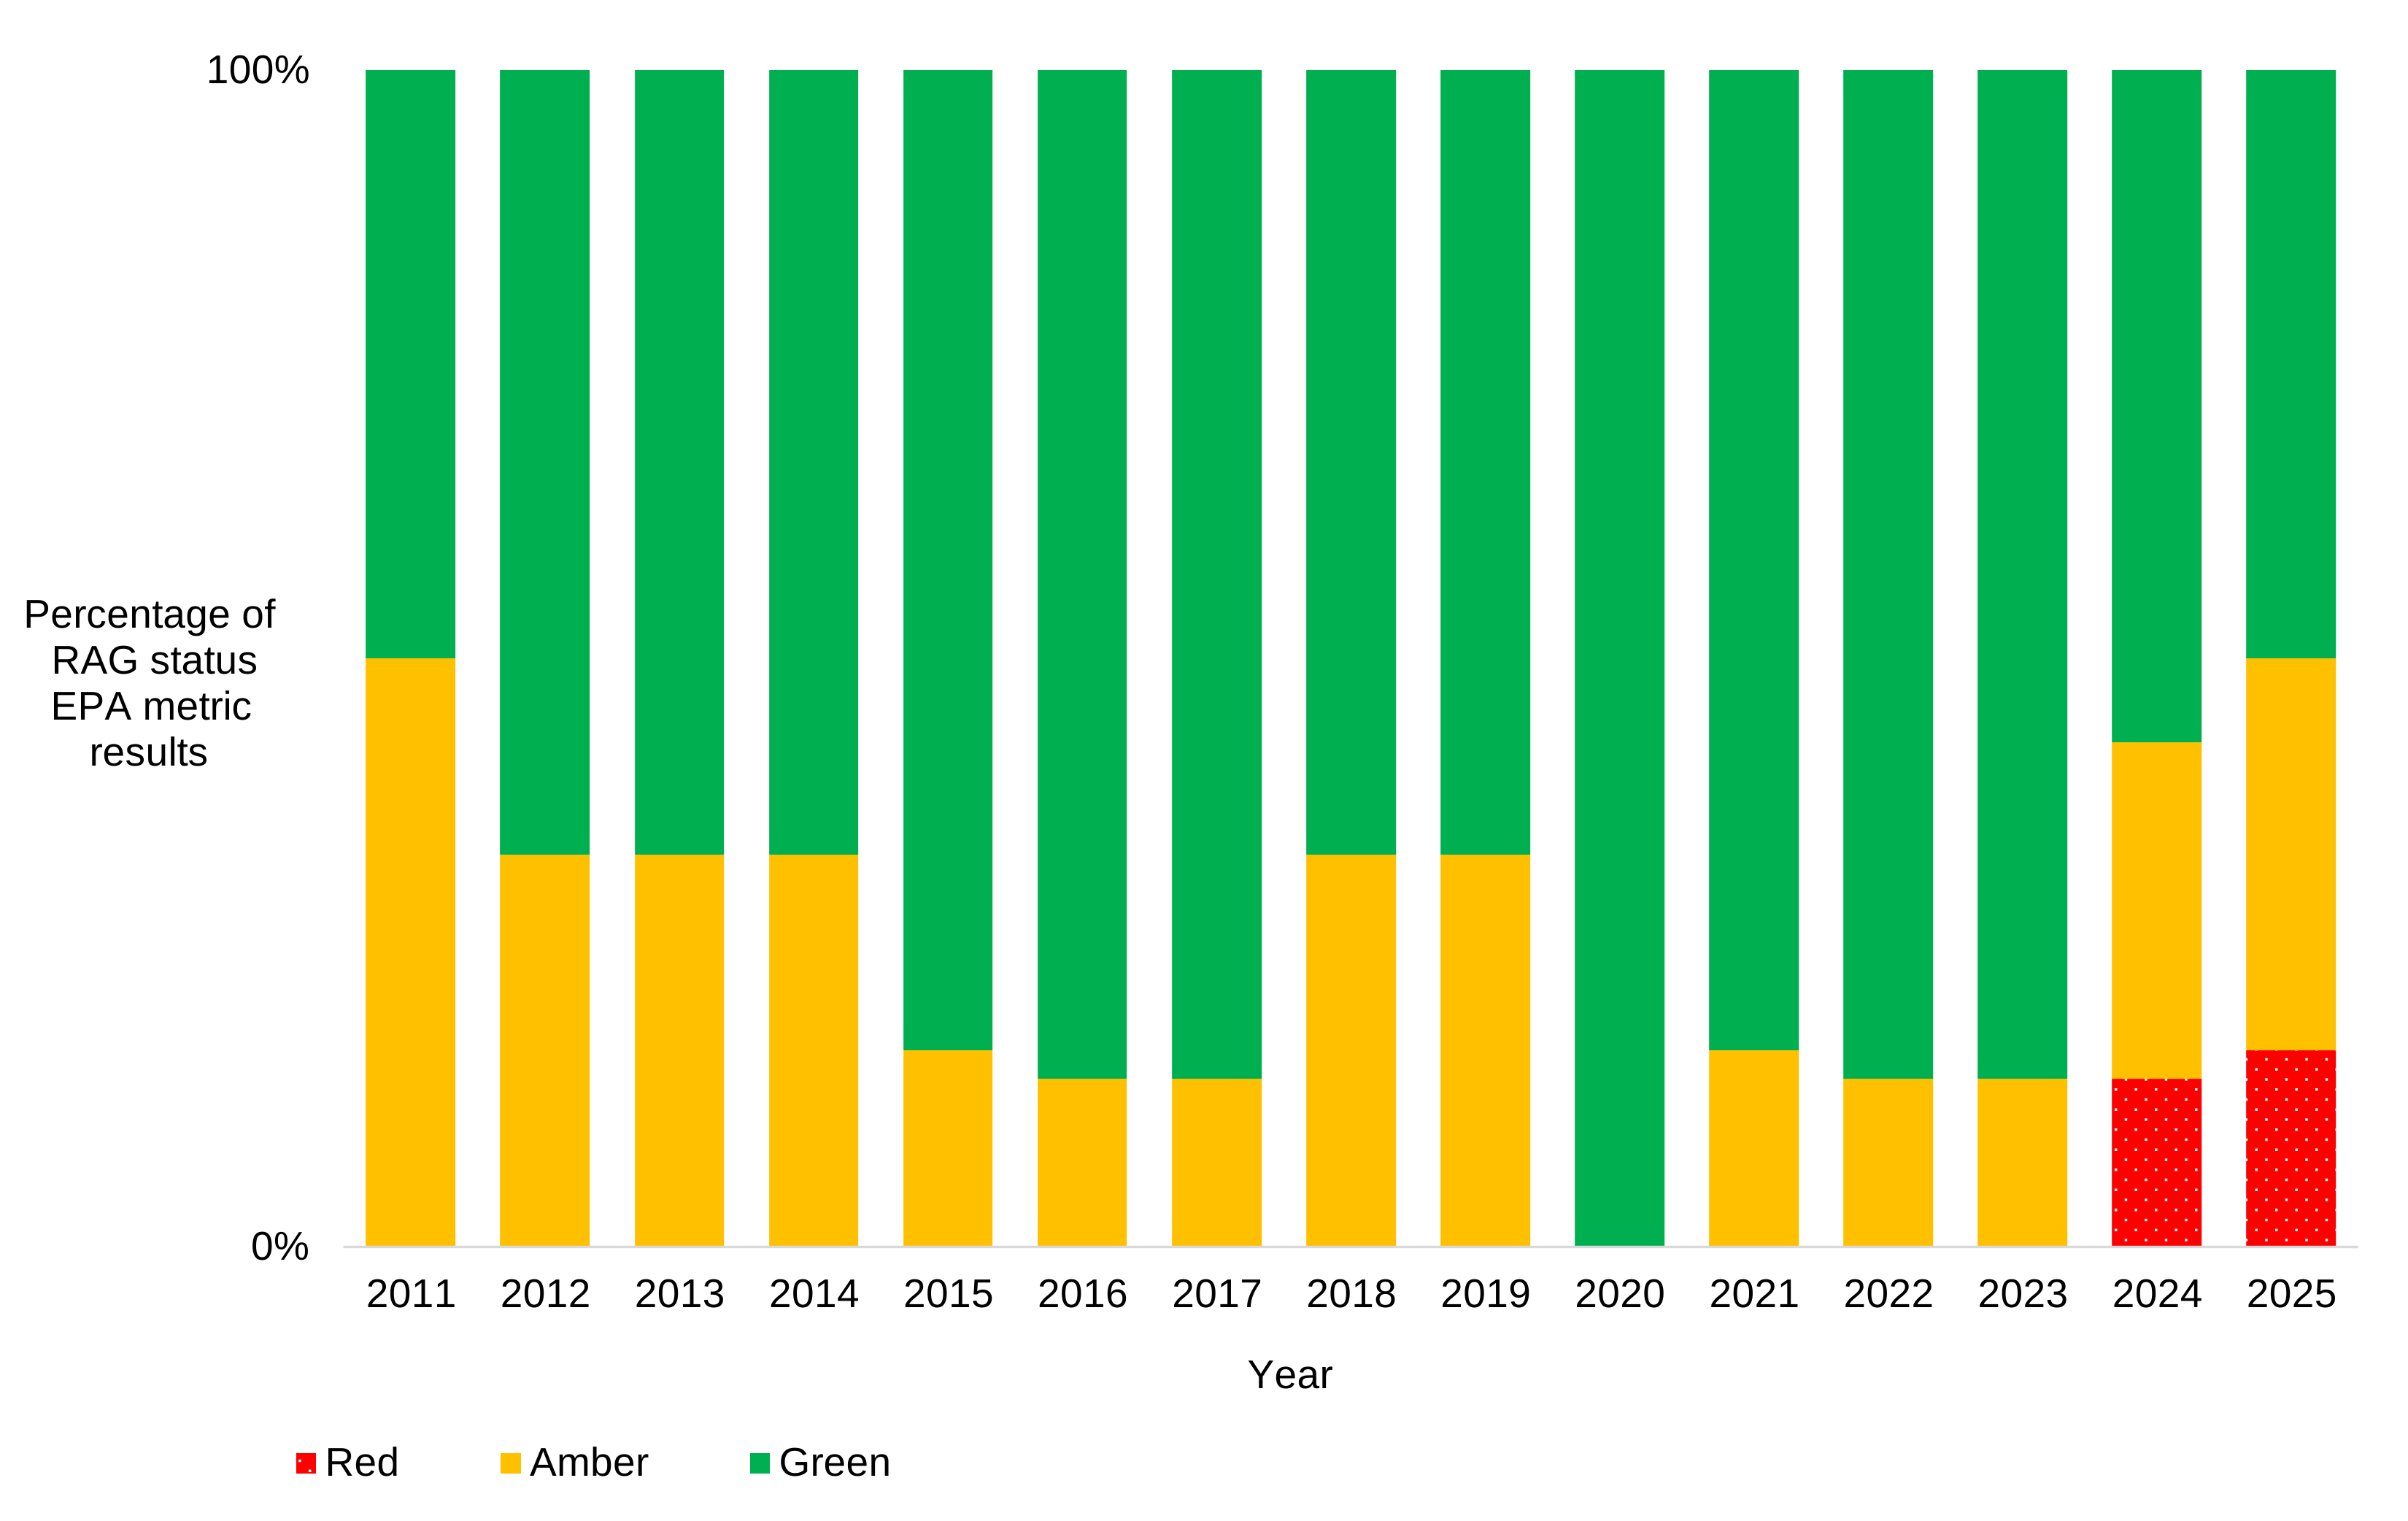
red status for 1 metric, amber status for 2 metrics and green status for 3 metrics
1 of 4 water and sewerage companies (out of 9) rated as requires improvement (2 stars)
Annual performance star rating after assessment of United Utilities’ performance across all EPA metrics
Year
Overall EPA star rating (out of 4)
Star rating description
2011
3 stars
Above average company
2012
3 stars
Above average company
2013
3 stars
Above average company
2014
3 stars
Above average company
2015
4 stars
Industry leading company
2016
4 stars
Industry leading company
2017
4 stars
Industry leading company
2018
3 stars
Good company
2019
3 stars
Good company
2020
4 stars
Industry leading company
2021
4 stars
Industry leading company
2022
3 stars
Good company
2023
4 stars
Industry leading company
2024
2 stars
Company requires improvement
2025
2 stars
Company requires improvement
Annual percentage of red, amber or green (RAG) status EPA metric results for United Utilities
Graph note: there were 6 EPA metrics in the years 2011 to 2015, 2018 to 2021, and 2025. There were 7 EPA metrics in the years 2016, 2017, 2022, 2023 and 2024.
Annual number of EPA metrics and their RAG status results for United Utilities
Year
Number of metrics in EPA
Number of red metrics
Number of amber metrics
Number of green metrics
2011
6
0
3
3
2012
6
0
2
4
2013
6
0
2
4
2014
6
0
2
4
2015
6
0
1
5
2016
7
0
1
6
2017
7
0
1
6
2018
6
0
2
4
2019
6
0
2
4
2020
6
0
0
6
2021
6
0
1
5
2022
7
0
1
6
2023
7
0
1
6
2024
7
1
2
4
2025
6
1
2
3
2. Total pollution incidents (sewerage) metric (category 1 to 3)
Main facts
For 2025:
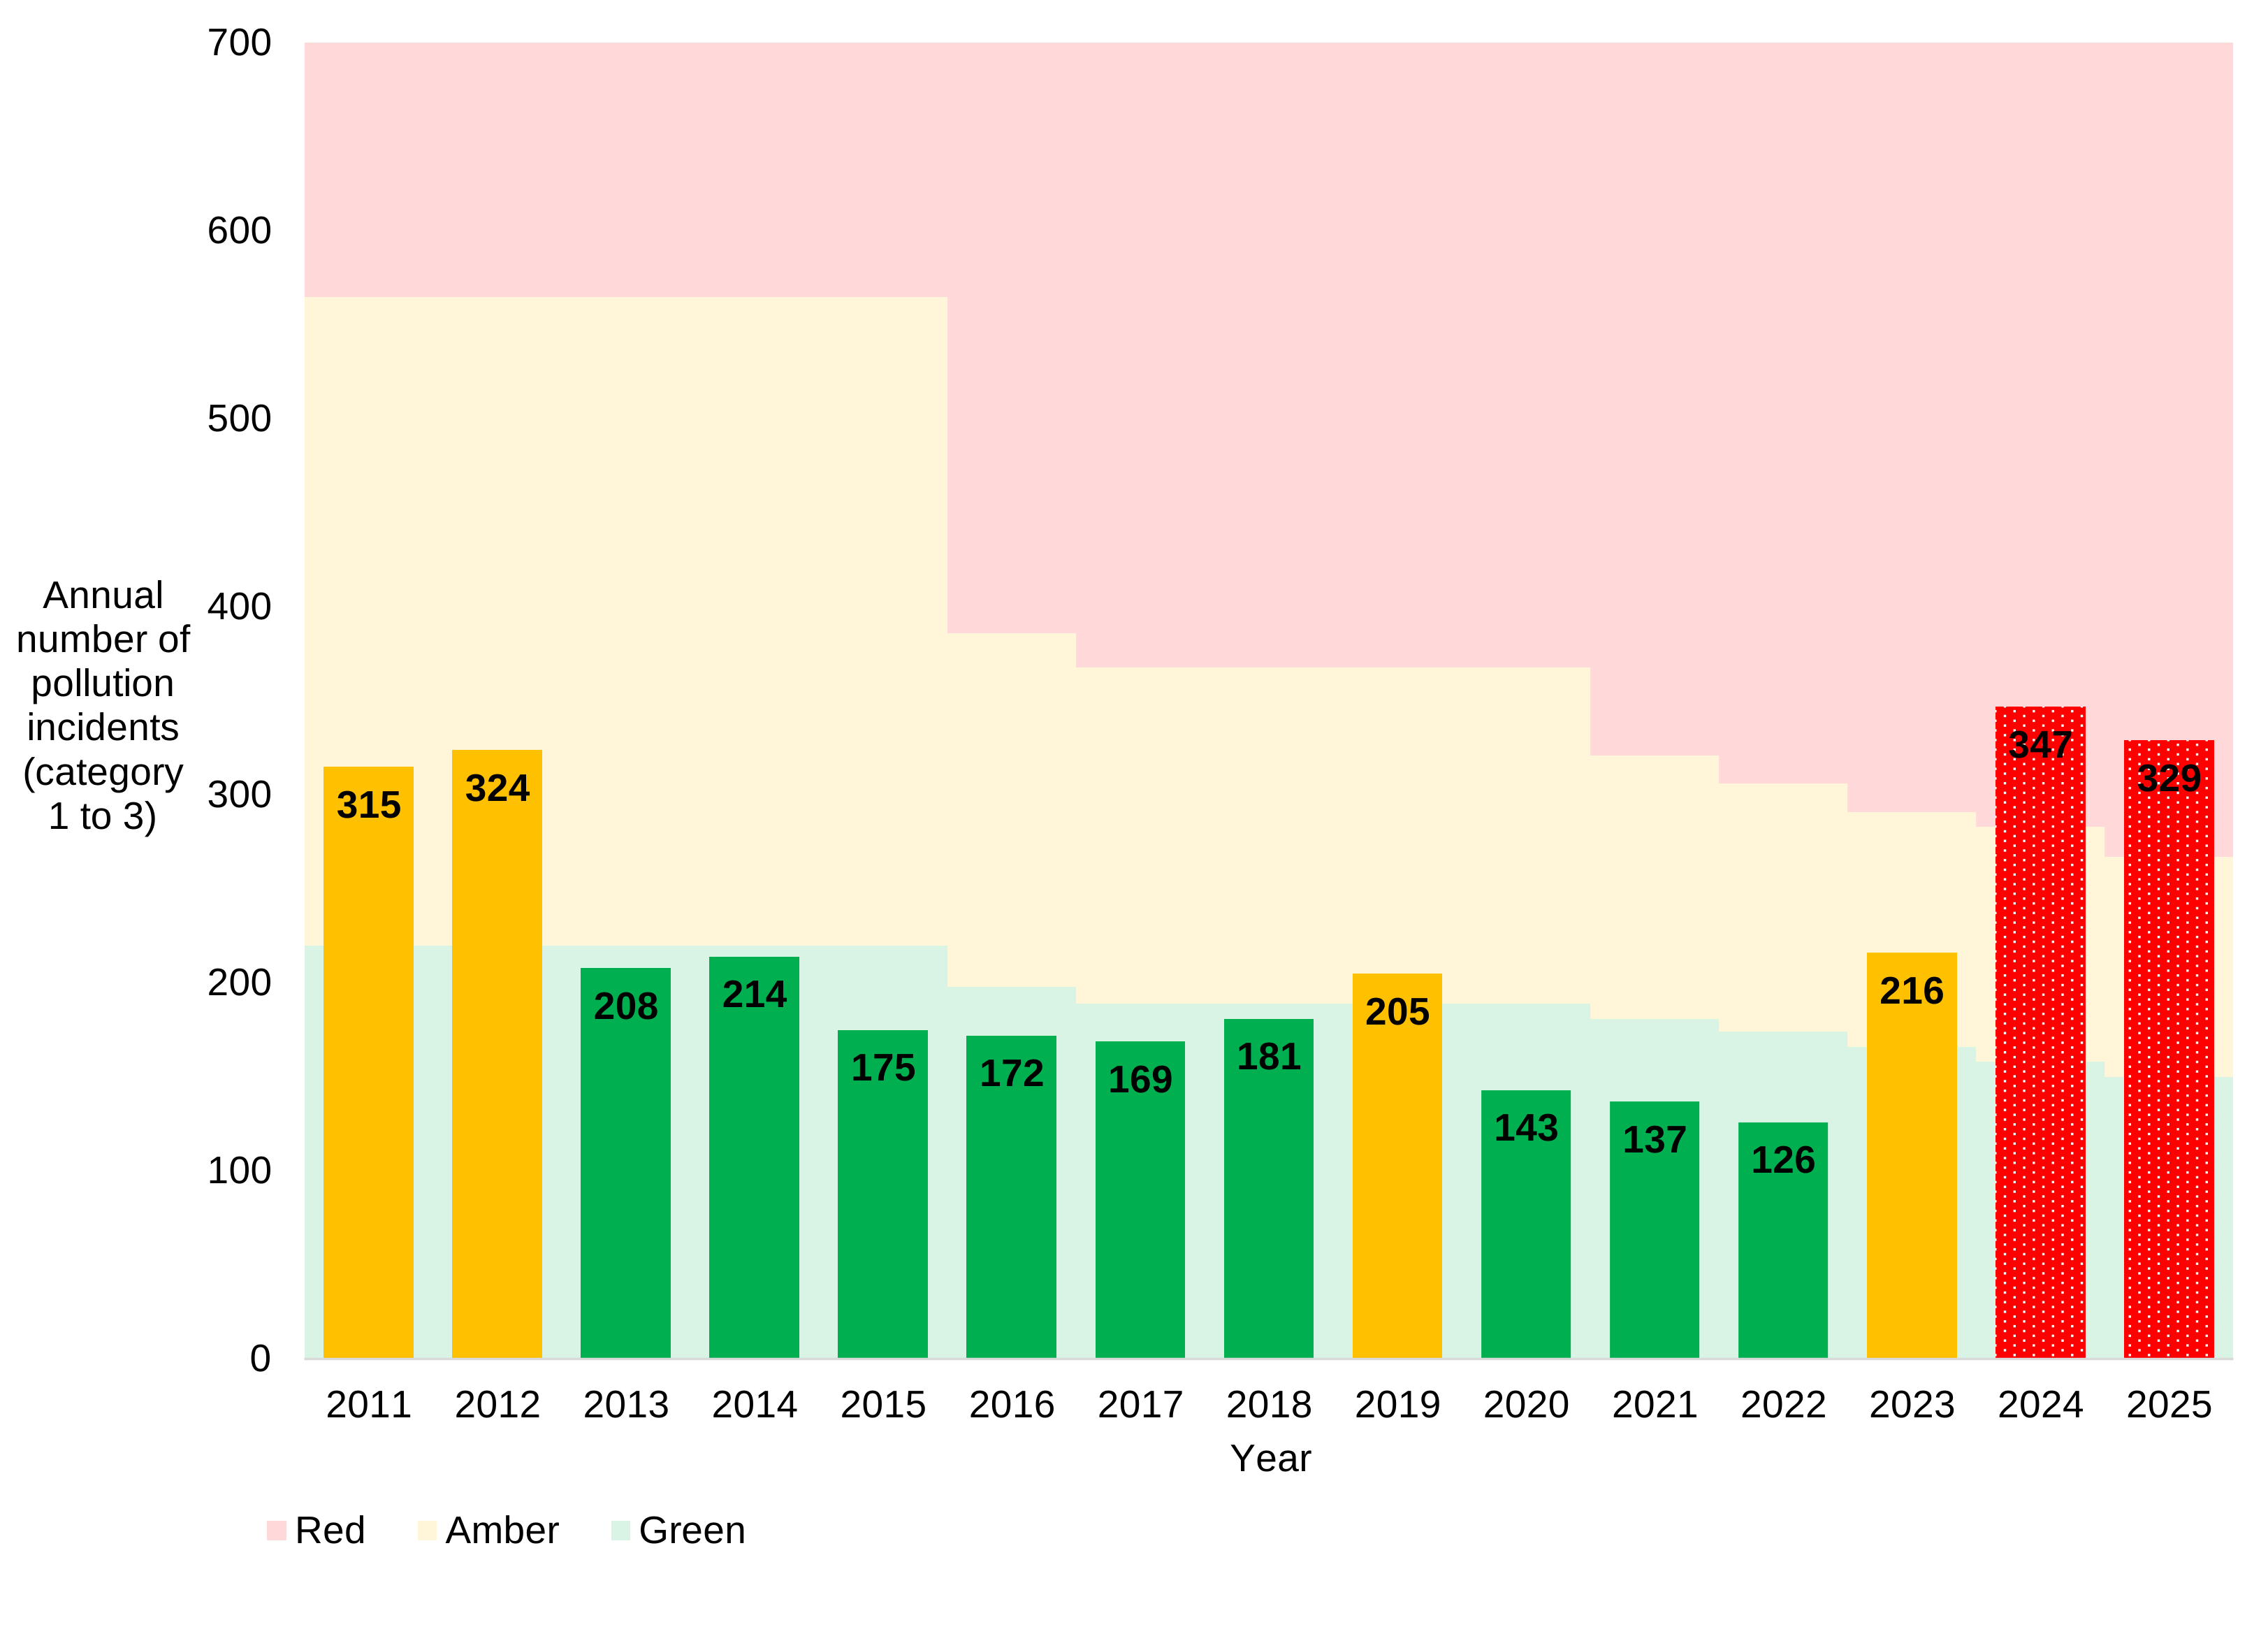
43 sewerage pollution incidents per 10,000km of sewer – this is rated as red
329 actual incidents (needed 150 or fewer to be rated as green)
77,339km sewer length – from financial year ending 2018 (this baseline is used in the EPA)
performance was worse than the sector (41) for sewerage pollution incidents per 10,000km of sewer
1 of 8 water and sewerage companies (out of 9) to be rated red
Annual number of pollution incidents (category 1 to 3) from United Utilities sewerage assets, with EPA status
2011 to 2015 data
Year
2011
2012
2013
2014
2015
EPA status
amber
amber
green
green
green
Incidents per 10,000km sewer
72
74
48
49
40
Actual incident numbers
315
324
208
214
175
2016 to 2020 data
Year
2016
2017
2018
2019
2020
EPA status
green
green
green
amber
green
Incidents per 10,000km sewer
22
23
24
28
19
Actual incident numbers
172
169
181
205
143
2021 to 2025 data
Year
2021
2022
2023
2024
2025
EPA status
green
green
amber
red
red
Incidents per 10,000km sewer
18
16
28
45
43
Actual incident numbers
137
126
216
347
329
Annual number of pollution incidents (category 1 to 3) from United Utilities sewerage assets, also showing EPA status and thresholds
Graph note: the EPA RAG status thresholds are set for normalised (per 10,000km sewer) numbers of sewerage incidents (see our EPA metric guide). We review and revise thresholds every 5 years. Equivalent thresholds for actual incident numbers are calculated using water and sewerage company sewer length data – these are shown in the graph background and the table below.
EPA thresholds for actual number of United Utilities sewerage incidents for the calendar years 2011 to 2025
Calendar year
Red status
Amber status
Green status
2011 to 2015
565 or above
221 to 564
220 or below
2016
386 or above
199 to 385
198 or below
2017 to 2020
368 or above
190 to 367
189 or below
2021
321 or above
182 to 320
181 or below
2022
306 or above
175 to 305
174 or below
2023
291 or above
167 to 290
166 or below
2024
283 or above
159 to 282
158 or below
2025
267 or above
151 to 266
150 or below
Number of pollution incidents (category 1 to 3) from United Utilities Water sewerage and water supply assets in 2025
Asset type
Number of pollution incidents (category 1 to 3)
Combined sewer overflow
20
Foul sewer
70
Other water industry premises
1
Pumping station
113
Rising main
18
Sewage treatment works
103
Storm tank
1
Surface water outfall
3
Water distribution system (water supply)
52
Water treatment works (water supply)
7
Note: water distribution system and water treatment works (both water supply assets) are not part of the EPA total pollution incidents (sewerage) metric.
Number of pollution incidents (total and breakdown of categories 1 to 3) from United Utilities Water sewerage and water supply assets in 2025
Asset type
Category 1 to 3
Category 1
Category 2
Category 3
Combined sewer overflow
20
0
0
20
Foul sewer
70
0
1
69
Other water industry premises
1
0
0
1
Pumping station
113
0
0
113
Rising main
18
0
0
18
Sewage treatment works
103
0
1
102
Storm tank
1
0
0
1
Surface water outfall
3
0
0
3
Water distribution system (water supply)
52
0
0
52
Water treatment works (water supply)
7
0
0
7
3. Serious pollution incidents (sewerage and water supply) metric (category 1 and 2)
Main facts
For 2025:
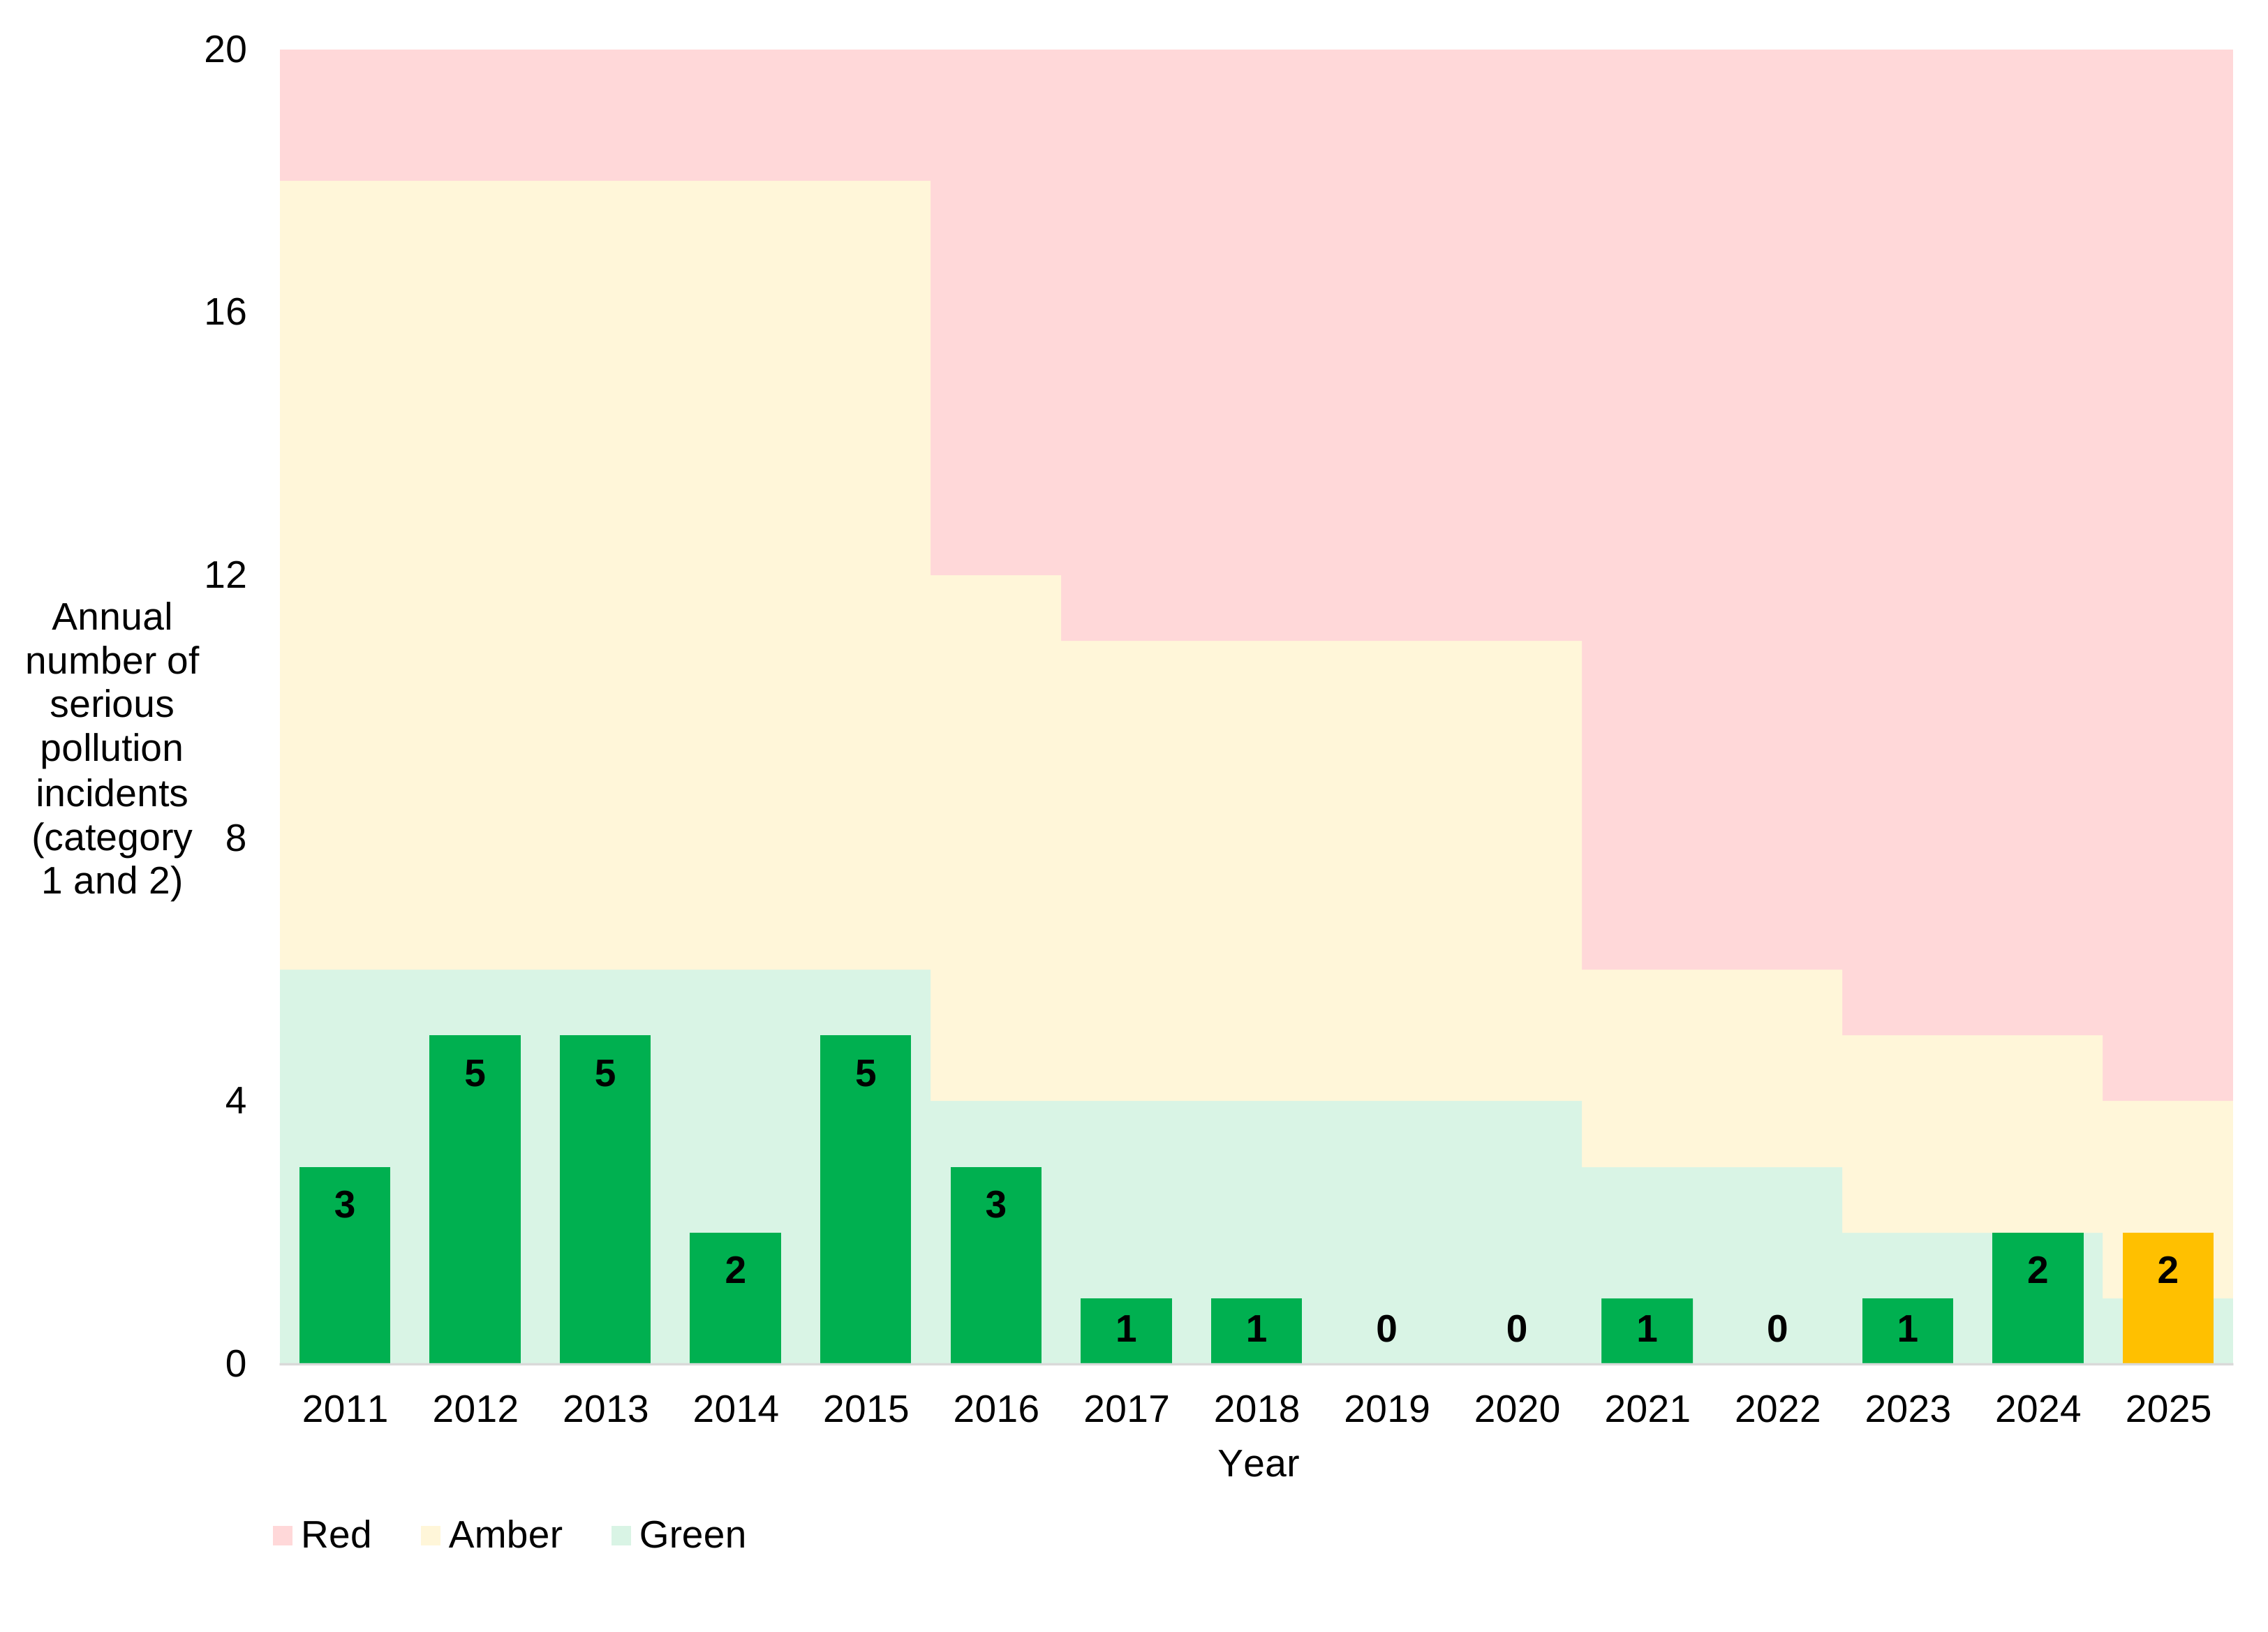
2 serious incidents – this is rated as amber (needed 1 or fewer to be rated as green)
2 serious incidents from sewerage assets
0 serious incidents from water supply assets
1 of 2 water and sewerage companies (out of 9) to be rated amber, no companies rated green
Annual number of serious pollution incidents (category 1 and 2) from United Utilities assets (sewerage and from 2021 including water supply), with EPA status
2011 to 2015 data
Year
2011
2012
2013
2014
2015
EPA status
green
green
green
green
green
Serious incidents per 10,000km sewer
0.7
1.1
1.1
0.5
1.2
Actual serious incident numbers – sewerage
3
5
5
2
5
2016 to 2020 data
Year
2016
2017
2018
2019
2020
EPA status
green
green
green
green
green
Serious incidents per 10,000km sewer
0.4
0.1
0.1
0
0
Actual serious incident numbers – sewerage
3
1
1
0
0
2021 to 2025 data
Year
2021
2022
2023
2024
2025
EPA status
green
green
green
green
amber
Serious incident numbers – all assets
1
0
1
2
2
Serious incident numbers – sewerage
1
0
1
1
2
Serious incident numbers – water supply
0
0
0
1
0
Annual number of serious pollution incidents (category 1 and 2) from United Utilities assets (sewerage and from 2021 including water supply), also showing EPA status and thresholds
Graph note: for 2011 to 2020 EPA RAG status thresholds were set for normalised (per 10,000km sewer) numbers of serious sewerage incidents (see our EPA metric guide). Equivalent thresholds for actual serious sewerage incident numbers were calculated using water and sewerage company sewer length data. We review and revise thresholds every 5 years. For 2021 to 2025 water and sewerage companies are in one of two groups with different thresholds set for actual serious sewerage and water supply incident numbers. The thresholds for actual serious incident numbers are shown in the graph background and the table below.
EPA thresholds for number of serious incidents from United Utilities assets (sewerage and from 2021 including water supply) for the calendar years 2011 to 2025
Calendar year
Red status
Amber status
Green status
2011 to 2015
18 or above
7 to 17
6 or below
2016
12 or above
5 to 11
4 or below
2017 to 2020
11 or above
5 to 10
4 or below
2021 and 2022
6 or above
4 or 5
3 or below
2023 and 2024
5 or above
3 or 4
2 or below
2025
4 or above
2 or 3
1 or 0
Number of serious pollution incidents (category 1 and 2) from United Utilities sewerage and water supply assets in 2025
Asset type
Number of serious pollution incidents (category 1 and 2)
Combined sewer overflow
0
Foul sewer
1
Other water industry premises
0
Pumping station
0
Rising main
0
Sewage treatment works
1
Storm tank
0
Surface water outfall
0
Water distribution system (water supply)
0
Water treatment works (water supply)
0
4. Self-reporting of pollution incidents (sewerage and water supply) metric
Main facts
For 2025:
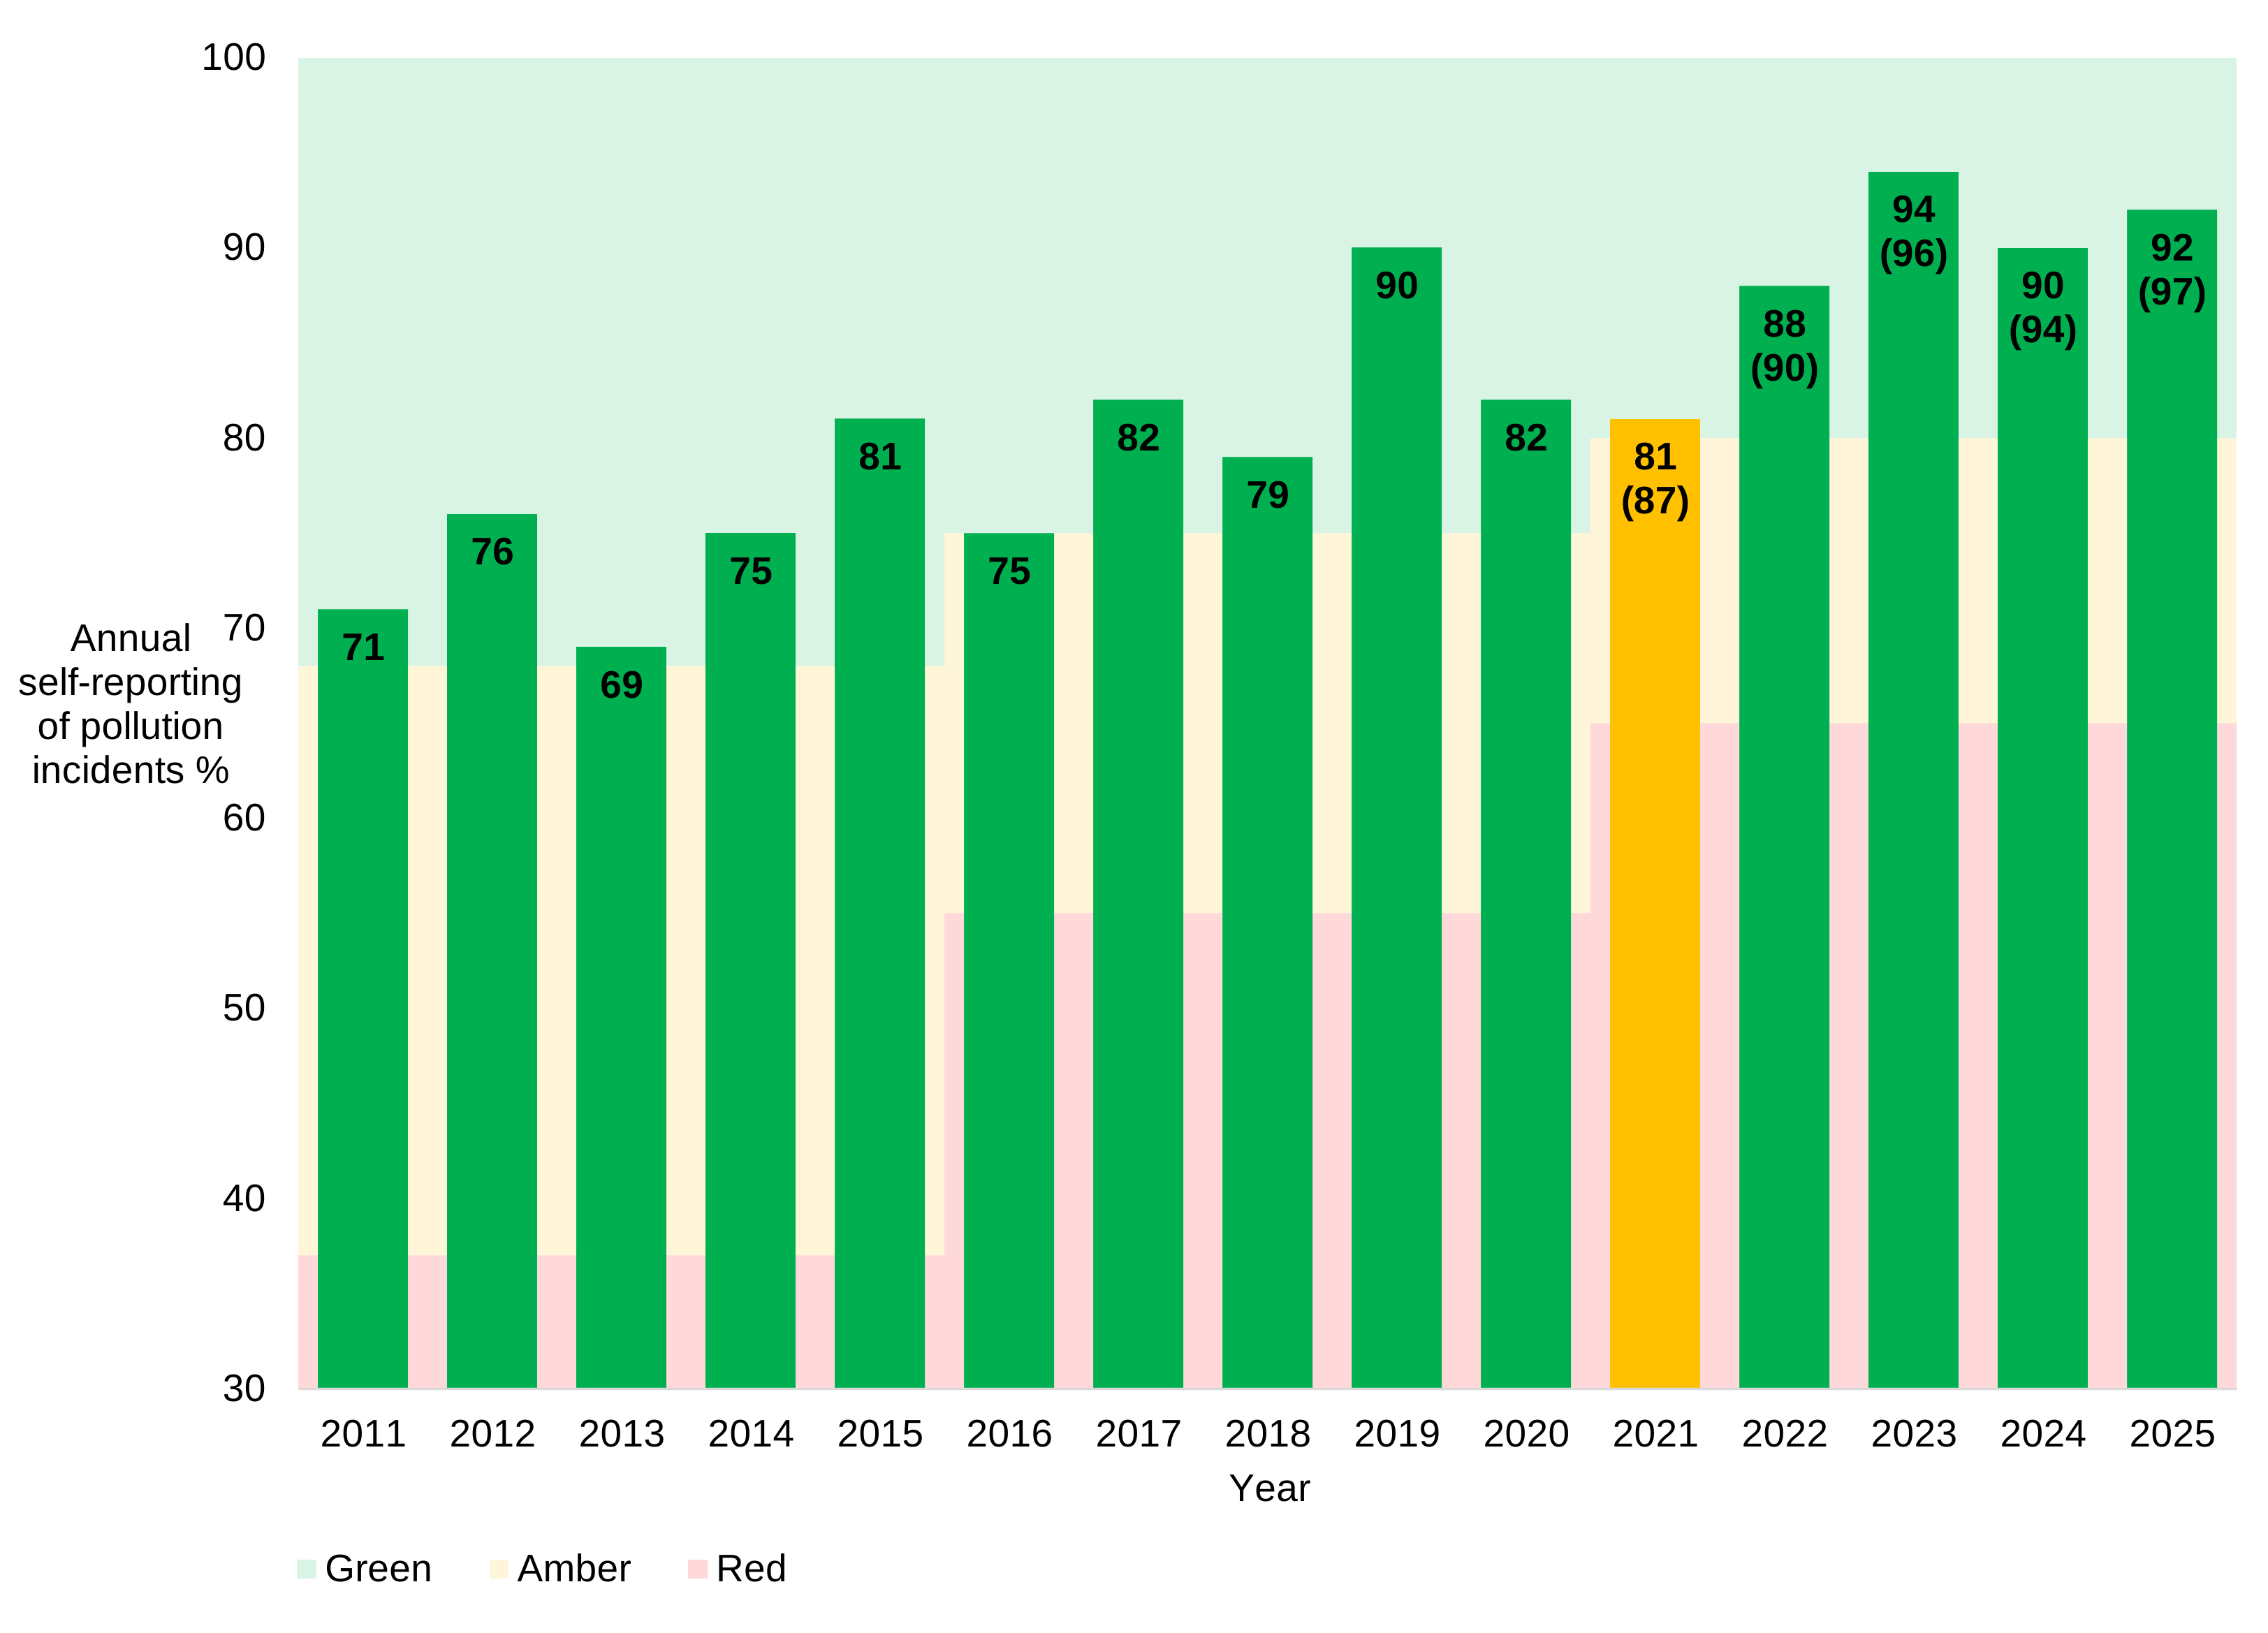
92% of all incidents self-reported, 97% from just pumping stations (PS) and sewage treatment works (STW) combined – this is rated as green
357 self-reported incidents, 31 incidents reported by others
performance was better than the sector (87%) for self-reporting of all pollution incidents
performance was better than the sector (93%) for self-reporting of just PS and STW pollution incidents combined
1 of 8 water and sewerage companies (out of 9) to be rated green
Annual self-reporting of pollution incidents (category 1 to 3) from United Utilities sewerage and water supply assets, with EPA rating
2011 to 2015 data
Year
2011
2012
2013
2014
2015
EPA status
green
green
green
green
green
Percentage of incidents self-reported
71
76
69
75
81
Number of incidents self-reported
229
253
155
175
163
2016 to 2020 data
Year
2016
2017
2018
2019
2020
EPA status
green
green
green
green
green
Percentage of incidents self-reported
75
82
79
90
82
Number of incidents self-reported
144
151
154
194
119
2021 to 2025 data
Year
2021
2022
2023
2024
2025
EPA status
amber
green
green
green
green
Percentage of incidents self-reported
81
88
94
90
92
Number of incidents self-reported
118
138
229
339
357
Percentage of PS and STW incidents self-reported
87
90
96
94
97
Number of PS and STW incidents self-reported
66
46
132
250
209
Annual self-reporting of pollution incidents (category 1 to 3) from United Utilities sewerage and water supply assets, also showing EPA status and thresholds
Graph note: the EPA RAG status thresholds (for all sewerage and water supply assets) are shown in the graph background and in the EPA metric guide. We review and revise thresholds every 5 years. From 2021 the additional number in brackets is the self-reporting percentage for just PS and STW incidents combined. To achieve green status self-reporting for all assets must be 80% or above and for just STW and PS combined must be 90% or above.
Self-reporting of pollution incidents (category 1 to 3) from United Utilities sewerage and water supply assets in 2025
Asset type
Number of pollution incidents self-reported (category 1 to 3)
Number of pollution incidents not self-reported (category 1 to 3)
Combined sewer overflow
19
1
Foul sewer
56
14
Other water industry premises
0
1
Pumping station
111
2
Rising main
14
4
Sewage treatment works
98
5
Storm tank
1
0
Surface water outfall
2
1
Water distribution system (water supply)
49
3
Water treatment works (water supply)
7
0
Self-reporting of serious pollution incidents (category 1 to 2) from United Utilities sewerage and water supply assets in 2025
Asset type
Number of serious pollution incidents self-reported (category 1 to 2)
Number of serious pollution incidents not self-reported (category 1 to 2)
Combined sewer overflow
0
0
Foul sewer
1
0
Other water industry premises
0
0
Pumping station
0
0
Rising main
0
0
Sewage treatment works
1
0
Storm tank
0
0
Surface water outfall
0
0
Water distribution system (water supply)
0
0
Water treatment works (water supply)
0
0
5. Discharge permit compliance (numeric) metric
Main facts
For 2025:
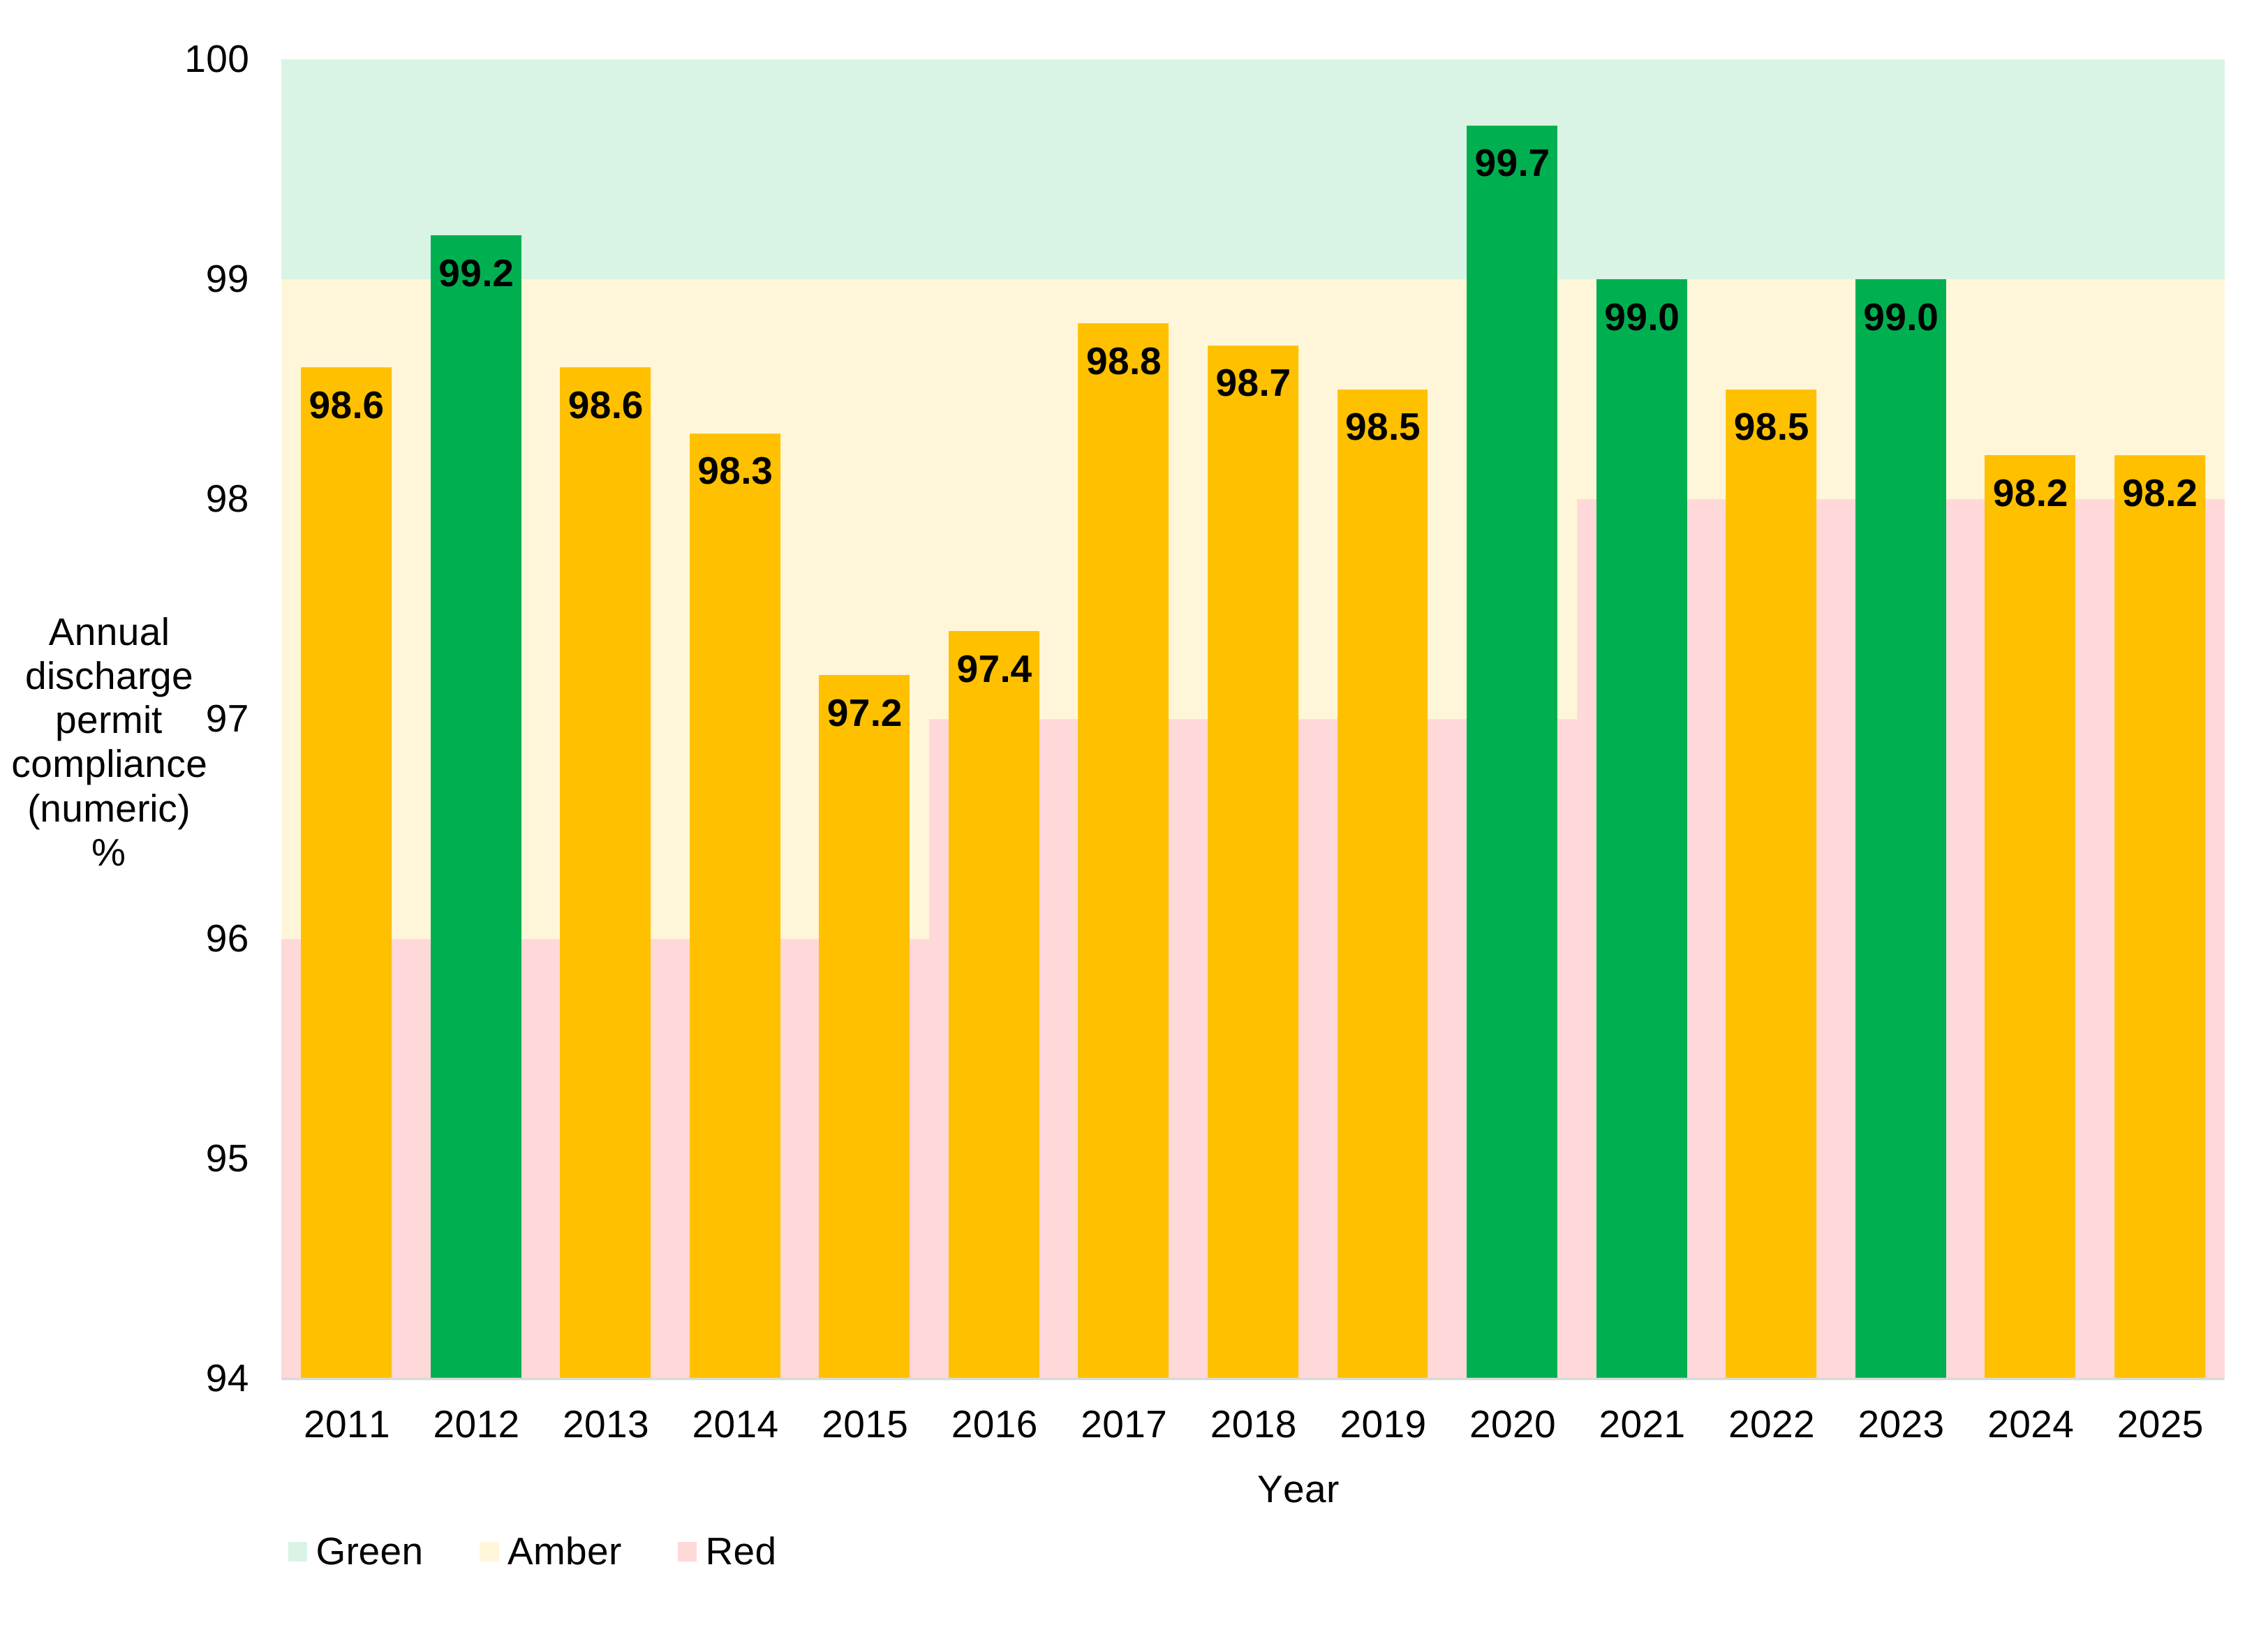
98.2% numeric discharge permit compliance – this is rated as amber (needed 4 or fewer non-complaint treatment works to be rated as green)
13 permitted discharge outlets from water treatment works (WTW) – 92.3% compliance (1 non-compliant WTW)
performance was better than the sector (97.4%) for numeric discharge permit compliance
1 of 5 water and sewerage companies (out of 9) to be rated amber
Annual discharge permit compliance (numeric) for United Utilities (STW and from 2016 includes WTW), with EPA status
2011 to 2015 data
Year
2011
2012
2013
2014
2015
EPA status
amber
green
amber
amber
amber
Percentage permit compliance
98.6
99.2
98.6
98.3
97.2
Number of permitted discharge outlets from STW
360
359
359
360
358
Number of non-compliant STW
5
3
5
6
10
2016 to 2020 data
Year
2016
2017
2018
2019
2020
EPA status
amber
amber
amber
amber
green
Percentage permit compliance
97.4
98.8
98.7
98.5
99.7
Number of permitted discharge outlets from STW
369
374
370
372
377
Number of permitted discharge outlets from WTW
50
30
26
20
20
Number of non-compliant STW
7
4
4
6
0
Number of non-compliant WTW
4
1
1
0
1
2021 to 2025 data
Year
2021
2022
2023
2024
2025
EPA status
green
amber
green
amber
amber
Percentage permit compliance
99.0
98.5
99.0
98.2
98.2
Number of permitted discharge outlets from STW
375
374
374
376
376
Number of permitted discharge outlets from WTW
16
14
14
13
13
Number of non-compliant STW
3
6
4
6
6
Percentage compliance STW
99.2
98.4
98.9
98.4
98.4
Number of non-compliant WTW
1
0
0
1
1
Percentage compliance WTW
93.8
100
100
92.3
92.3
Annual discharge permit compliance (numeric) for United Utilities (STW and from 2016 includes WTW), also showing EPA status and thresholds
Graph note: the EPA RAG status thresholds are shown in the graph background and in the EPA metric guide. We review and revise thresholds every 5 years.
6. Delivery of the Water Industry National Environment Programme (WINEP) metric
Main facts
For the financial year ending March 2026 (cumulative progress years 1 to 5 of the WINEP):
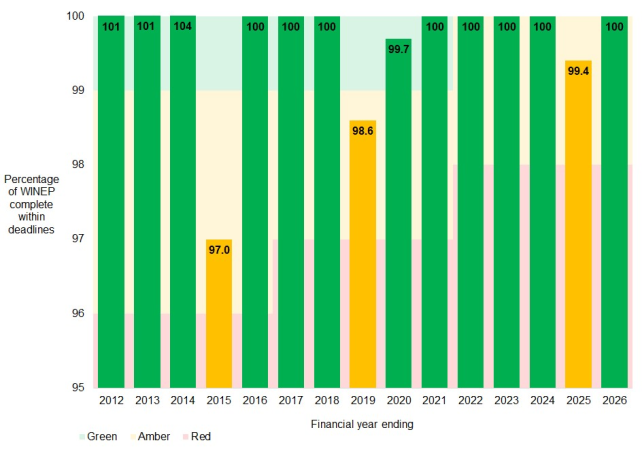
100% EPA schemes completed within planned deadlines – this is rated as green
54 EPA schemes completed within planned deadlines
performance was better than the sector (80.2%)
1 of 5 water and sewerage companies (out of 9) to be rated green
4 non-EPA WINEP schemes completed out of 4 planned – 100% total WINEP delivery (EPA and non-EPA schemes)
Annual delivery of the WINEP (National Environment Programme up to the financial year ending 2020) by United Utilities, with EPA rating
Data for financial years ending 2012 to 2016
Financial year ending
2012
2013
2014
2015
2016
Asset Management Plan (AMP)
AMP5
AMP5
AMP5
AMP5
AMP6
EPA status
green
green
green
amber
green
Percentage of NEP complete to date (cumulative)
101
101
104
97
100
Cumulative number of schemes completed during AMP period
93
150
193
256
8
Data for financial years ending 2017 to 2021
Financial year ending
2017
2018
2019
2020
2021
Asset Management Plan (AMP)
AMP6
AMP6
AMP6
AMP6
AMP7
EPA status
green
green
amber
green
green
Percentage of NEP/WINEP complete to date (cumulative)
100
100
98.6
99.7
100
Cumulative number of schemes completed during AMP period
63
106
162
290
5
Data for financial years ending 2022 to 2026
Financial year ending
2022
2023
2024
2025
2026
Asset Management Plan (AMP)
AMP7
AMP7
AMP7
AMP7
AMP8
EPA status
green
green
green
amber
green
Percentage of WINEP complete within deadlines (to date)
100
100
100
99.4
100
Cumulative number of schemes completed during AMP period
208
316
446
625
54
Cumulative number of water quality schemes completed during AMP period
190
294
421
584
46
Cumulative number of water resources schemes completed during AMP period
10
13
15
21
2
Cumulative number of fisheries, biodiversity and geomorphology schemes completed during AMP period
8
9
10
20
6
Annual delivery of the WINEP (National Environment Programme up to the financial year ending 2020) by United Utilities, also showing EPA status and thresholds
Table and graph note: AMP5 schemes that were completed early before their planned year were included in the cumulative delivery percentage (in some cases resulting in percentages over 100%). AMP6 and AMP7 schemes that were completed early before their planned year are not included in the cumulative delivery percentage until their planned year (cannot report over 100%). The EPA RAG status thresholds are in the EPA metric guide. We review and revise thresholds every 5 years.
7. Sludge disposal and use metric
Main facts
For 2025:
99.94% satisfactory sludge disposal and use – this is rated as green
121,137t (tonnes dry solid) total volume dispatched
21,986ha (hectares) land used by them for spreading
91.84% of sludge dispatched was used by them in agriculture
only water and sewerage company (out of 9) to not report 100% satisfactory sludge disposal and use – all water and sewerage companies rated green
Annual compliance with sludge disposal and use metric by United Utilities, with EPA ratings
2011 to 2015 data
Year
2011
2012
2013
2014
2015
EPA status
amber
amber
amber
green
green
Percentage of sludge compliant
99.1
99.2
99.9
100
100
Total volume of sludge dispatched (t thousands dry solid)
191.9
145.6
111.1
106.1
99.1
2016 to 2020 data
Year
2016
2017
2018
2019
2020
EPA status
green
green
no data
no data
no data
Percentage of sludge compliant
100
100
no data
no data
no data
Total volume of sludge dispatched (t thousands dry solid)
98.2
112.7
112.1
113.0
116.8
2021 to 2025 data
Year
2021
2022
2023
2024
2025
EPA status
no data
green
green
green
green
Percentage of sludge compliant
no data
98.93
100
99.64
99.94
Total volume of sludge dispatched (t thousands dry solid)
99.6
101.1
102.6
107.2
121.1
Table note: for the 2018 to 2021 calendar years, we suspended the metric from the EPA whilst we reviewed our regulatory regime for sludge. The EPA RAG status thresholds are in the EPA metric guide.
Annual summary of sewage sludge disposal and use (dry matter) by United Utilities
Year
Sewage sludge used by them in agriculture (t thousands)
Sewage sludge recovered by them non-agriculture (t thousands)
Sewage sludge disposed of by them or passed to other outlets(t thousands)
2021
97.1
2.5
0.0
2022
98.9
2.2
0.0
2023
102.0
0.6
0.0
2024
107.2
0.0
0.0
2025
111.2
0.0
9.9
Note that data in this section includes some sludge that was dispatched and used in agriculture on land in Wales, regulated by Natural Resources Wales.
8. Event Duration Monitoring (EDM) delivery
We have published the EDM storm overflow annual return dataset received from water and sewerage companies. This shows how often and how long the monitored storm overflows operated during 2025. The dataset also includes water and sewerage company reasons for performance issues with monitors and reasons for high spill counts.
United Utilities storm overflows
Year
2025
Total number of active storm overflows listed in the annual return
2,270
Total number of active storm overflows with EDM commissioned
2,270
Percentage of active storm overflows listed with EDM commissioned
100%
Total number of storm overflows with spill data
2,270
Percentage of storm overflows listed with spill data
100%
Average number of spills per storm overflow with spill data
26.8
Average duration (hours) per monitored spill event
5.4
Percentage storm overflows with ≥90% EDM operation during reporting period