Environmental performance assessment (EPA) star ratings 2011 to 2025
Published 29 October 2026
Applies to England

© Crown copyright 2026
This publication is licensed under the terms of the Open Government Licence v3.0 except where otherwise stated. To view this licence, visit nationalarchives.gov.uk/doc/open-government-licence/version/3 or write to the Information Policy Team, The National Archives, Kew, London TW9 4DU, or email: psi@nationalarchives.gov.uk.
Where we have identified any third party copyright information you will need to obtain permission from the copyright holders concerned.
This publication is available at https://www.gov.uk/government/publications/water-and-sewerage-companies-in-england-environmental-performance-report-2025/environmental-performance-assessment-epa-star-ratings-2011-to-2025
We introduced the EPA in 2011 as a tool for comparing performance between water and sewerage companies and across years for several core requirements.
Every 5 years we review how we report on water and sewerage company environmental performance and review the EPA. We deliberately tighten our metrics over time in response to investment made by the water industry in industry assets and public expectation of better performance. Please see our EPA metric guide for more information on our regulation and how we set targets for water and sewerage companies. We have shared our EPA methodology for 2021 to 2025 with the water and sewerage companies.
We have published our annual environmental performance of the water and sewerage companies in 2025 report and Environmental Performance Assessment results 2011 to 2025. This document provides a summary of the EPA star ratings since 2011. All water and sewerage companies can achieve 4 stars (industry leading).
From 2011 to 2025:
- 4 water and sewerage companies have been rated 1 star (poor) – Southern Water 4 times, South West Water 5 times, Thames Water twice, and Yorkshire Water once (Table 1)
- South West Water has consistently been rated 1 star (poor) or 2 stars (requiring improvement), and Southern Water has mostly been rated 1 star or 2 stars – Anglian Water and Thames Water have deteriorated to be 1 or 2 star throughout the most recent 5 year period (Table 1)
- 5 water and sewerage companies have achieved 4 stars (industry leading) – Northumbrian Water 3 times, Severn Trent Water 10 times (including consistently in all of the last 7 years), United Utilities 6 times, Wessex Water 8 times and Yorkshire Water twice (Table 1)
- sector star ratings ranged between 16 stars and 30 stars (out of a possible 36) – 2025 has the lowest star rating (Table 1 and Figure 1)
Between 2011 and 2025 we have progressively updated and tightened EPA metrics to reflect environmental expectations. Although it is not straightforward to make a direct comparison across the lifespan of the EPA, we have re-assessed all previous years of data using the 2025 methodology (Figure 1). We do this to indicate if there have been EPA performance improvements over time. The results show an improving trend with some progress in sector star ratings from 11 stars in 2011 to a high of 22 stars in 2022 and 2023 (out of 36) – however the sector deteriorated to 19 stars in 2024 and 16 stars in 2025.
Table 1. EPA performance star ratings for the 9 water and sewerage companies 2011 to 2025 (maximum of 4 stars per year)
2011 to 2015 data
| Year | 2011 | 2012 | 2013 | 2014 | 2015 |
|---|---|---|---|---|---|
| Anglian Water | 3 | 3 | 3 | 3 | 3 |
| Northumbrian Water | 2 | 3 | 3 | 3 | 3 |
| Severn Trent Water | 3 | 3 | 4 | 3 | 4 |
| Southern Water | 2 | 2 | 1 | 2 | 3 |
| South West Water | 1 | 2 | 1 | 2 | 1 |
| Thames Water | 3 | 3 | 2 | 3 | 3 |
| United Utilities | 3 | 3 | 3 | 3 | 4 |
| Wessex Water | 4 | 4 | 3 | 3 | 4 |
| Yorkshire Water | 2 | 2 | 3 | 4 | 3 |
| Sector | 23 | 25 | 23 | 26 | 28 |
2016 to 2020 data
| Year | 2016 | 2017 | 2018 | 2019 | 2020 |
|---|---|---|---|---|---|
| Anglian Water | 3 | 3 | 3 | 2 | 3 |
| Northumbrian Water | 2 | 2 | 4 | 2 | 4 |
| Severn Trent Water | 3 | 4 | 3 | 4 | 4 |
| Southern Water | 3 | 3 | 2 | 1 | 2 |
| South West Water | 2 | 2 | 2 | 2 | 2 |
| Thames Water | 2 | 3 | 3 | 3 | 3 |
| United Utilities | 4 | 4 | 3 | 3 | 4 |
| Wessex Water | 4 | 4 | 3 | 4 | 4 |
| Yorkshire Water | 3 | 3 | 2 | 3 | 4 |
| Sector | 26 | 28 | 25 | 24 | 30 |
2021 to 2025 data
| Year | 2021 | 2022 | 2023 | 2024 | 2025 |
|---|---|---|---|---|---|
| Anglian Water | 2 | 2 | 2 | 2 | 2 |
| Northumbrian Water | 4 | 3 | 3 | 2 | 2 |
| Severn Trent Water | 4 | 4 | 4 | 4 | 4 |
| Southern Water | 1 | 2 | 2 | 2 | 1 |
| South West Water | 1 | 2 | 2 | 2 | 1 |
| Thames Water | 2 | 2 | 2 | 1 | 1 |
| United Utilities | 4 | 3 | 4 | 2 | 2 |
| Wessex Water | 2 | 2 | 4 | 2 | 2 |
| Yorkshire Water | 2 | 3 | 2 | 2 | 1 |
| Sector | 22 | 23 | 25 | 19 | 16 |
Figure 1. Total EPA star ratings for the 9 water and sewerage companies 2011 to 2025 – using the methodology at the time compared to the 2025 methodology
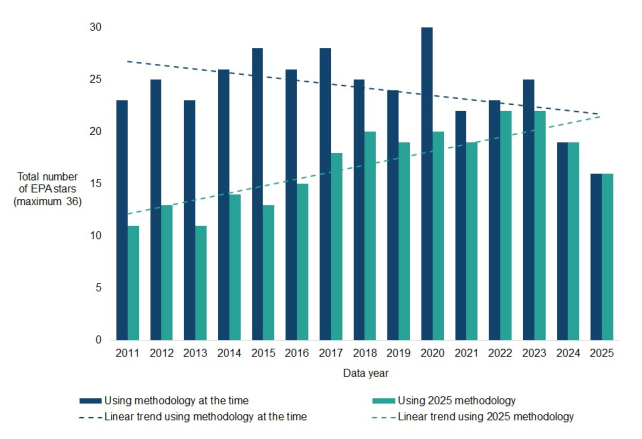
Chart note: application of the current EPA methodology for 2025 data to previous years of data is subject to caveats due to changes in our expectations and EPA metric definitions.