VFM metrics – Technical regression report
Published 27 September 2018
Applies to England

© Crown copyright 2018
This publication is licensed under the terms of the Open Government Licence v3.0 except where otherwise stated. To view this licence, visit nationalarchives.gov.uk/doc/open-government-licence/version/3 or write to the Information Policy Team, The National Archives, Kew, London TW9 4DU, or email: psi@nationalarchives.gov.uk.
Where we have identified any third party copyright information you will need to obtain permission from the copyright holders concerned.
This publication is available at https://www.gov.uk/government/publications/value-for-money-summary-and-technical-reports/vfm-metrics-technical-regression-report
Contents
-
Introduction
-
Value for Money
-
Regression analysis – headline results:
-
Regression analysis – additional testing
-
Annex A – Details of diagnostic testing
-
Annex B – Full explanatory variable list
-
Annex C – VfM metrics and measurements, FVA 2018
-
Annex D – Breaks in the time series
Introduction
This technical report sets out the detail of regression analysis undertaken by the Regulator of Social Housing on Value for Money (VfM) metrics of private registered providers of social housing (‘providers’) in England. This report is intended for a technical audience and presents detail of data definitions and the statistical process. Key messages drawn from this analysis are set out in the accompanying VfM metrics – summary report. The analysis extends similar work published in 2016.
This analysis aims to understand how VfM metrics of providers are related to a range of measured explanatory factors. Regression analysis is the standard statistical method to estimate such relationships. This is a powerful analysis, drawing on group level data for all providers in England with more than 1,000 social housing units. However, there are limits to the power of the work especially as there is a lack of data for many important factors that may affect VfM metrics – for example, scope and quality of services, condition of stock, housing demand, and cost of development.
The aim of the analysis is to better understand the relationship between the regulator’s metrics and providers’ characteristics and to test a range of other key variables including economies of scale. The regulator also intends to use the Technical Regression report to support future publications on Value for Money.
The approach to analysis, summarised in the figure overleaf, is explained in this report in three main sections:
- VfM metric data and explanatory variables – sources, definitions and descriptive statistics for key variables.
- Regression analysis: headline results – results for the streamlined final models, which explain the relationship between VfM metrics and seven explanatory variables (Table 3).
- Regression analysis: additional testing – results from the full models, which explain cost variation using 33 explanatory variables and were used as the initial basis for modelling (Table 4), plus testing of economies of scale (Figure 6 and Figure 7).
The Annex sets out detail of diagnostic testing, definitions of explanatory and additional variables.
Figure 1: Schematic outline of statistical process:
| Data preparation | |
|---|---|
| ↓ | Gathered and calculated variables for each group (2017) |
| ↓ | Cleaned data |
| ↓ | Replaced missing data |
| ↓ | Removed outliers and influential observations |
| ↓ | Final dataset used for regression testing |
Regression using full models
Models tested:
Ordinary Least Squares
Regression Models:
Explanatory Factors
| Variables in full models | VfM Metrics | |
| Type of units (general needs housing for older people, supported housing, affordable rent, shared-ownershop, non-social) | Reinvestment | |
| Scale of provider i.e. total units by type | New Suppy (Social) | |
| Valuation | New Suppy (Non-Social) | |
| Group membership (parent and subsidiary) | Gearing | |
| Stock transfers (LSVT) | → | EBITDA MRI Interest Rate Cover |
| Non-decent homes - reduction and residual | Headline social housing cost | |
| Regional wages | Operating Margin (SHL) | |
| Neighbourhood-level deprivation (IMD rank) | Operating Margin (Overall) | |
| ROCE |
Extensions and Diagnostic Testing
Additional variables tested:
Economies of Scale
Diagnostic testing:
Stability checks Misspecification of functional form
| Primary VfM Metrics |
|---|
| Reinvestment |
| New Supply (Social |
| Gearing |
| Headline social housing cost |
| Operating Margin (Overall) |
Regression using streamlined models
Streamlined final models
Tested against default model using R^2, BIC and F-test statistics. Consistent final models that are simple and intuitive.
VfM metrics data and explanatory variables
In 2016/17 a number of mergers and business reorganisations occurred amongst some of the sector’s largest registered providers. These registered providers accounted for c.10% of total sector stock. The accounting treatment for these business combinations has a material one-off effect on the aggregate financial results in that year.
We chose to include this group of registered providers in the non-regression based analysis because they comprise such a significant proportion of the sector’s total stock, and include some of the sector’s largest organisations. Excluding them from the analysis would have left an incomplete view of the sector.
However, we have had to exclude this group of registered providers from the regression analysis because the one-off effects of the merger on their accounts lead to them being extreme outliers, for reasons unrelated to the performance of the business. Their inclusion would therefore have risked distorting the conclusions of the regression analysis.
Leasehold providers are excluded from all the analysis as they have no tangible fixed assets (housing properties), making it difficult to draw meaningful comparisons with more traditional organisations on several of the measures including gearing, reinvestment and ROCE.
Similarly providers who changed their accounting periods to align with the sector, and subsequently reported on a fifteen month accounting period in 2016/17, have also been removed from all of the analysis.
Analysis is based on a cross sectional dataset of VfM metrics and contextual information for groups with more than 1,000 units for 2017 (the Unit Cost regression analysis was drawn from 11 years’ data for all providers. However due to FRS102 reporting requirements and for the purpose of consistent reporting the VfM metrics Regression has been based on the 2017 FVA data only); data is complete for 223 observations, once the providers outlined above have been removed. This dataset includes the vast majority of groups with at least 1,000 units (owned or managed) each year.
Analysis is primarily based on data submitted by providers and already published by the regulator: for VfM metrics data this is primarily Global Accounts data (supplemented in some instances by 2017 Statistical Data Return data). As outlined in Data on VfM metrics., and for most explanatory factors it is the Statistical Data Return (SDR). For a small number of variables this is supplemented with other available data including: the Continuous Recording of Lettings and Sales in Social Housing in England (CORE), the Annual Survey of Hours and Earnings (ASHE) for regional wages and the Index of Multiple Deprivation (IMD) for neighbourhood deprivation.
Data on Value for Money metrics
The data used for the VfM metrics has been primarily derived from the electronic accounts data returns database for 2017. This is the same database the regulator uses to develop the annual Global Accounts publication.
The VfM metrics have been defined as per the Value for Money metrics: Technical note feedback and response and providers’ future reporting against the VfM metrics will be based on the structure of the 2018 electronic accounts data return (FVA). However, as the 2018 FVAs have not yet been submitted the regression analysis uses historic data derived from the 2017 FVA returns. As there is not a direct read across between the 2017 and 2018 FVA returns, in a number of instances slight amendments have been made to the metric derivations (highlighted below in red):
-
The 2017 FVA only contains data on units managed therefore the stock figures used in the calculation of the Reinvestment, New Supply and Headline Social Housing Cost metrics have been formulated using 2017 SDR data which identifies both stock owned and managed.
-
The tangible fixed assets: Housing properties at Deemed Cost data line used to calculate the denominator of the Reinvestment and Gearing metrics will no longer exist under the 2018 electronic accounts data return (FVA).
Metric 1 – Reinvestment %
This metric looks at the investment in properties (existing stock as well as New Supply) as a percentage of the value of total properties held.
Measurement of VfM Cost Chain – Efficiency
[Development of new properties (total housing properties)]
+Newly built properties acquired (total housing properties)
+Works to Existing (total housing properties)
+Capitalised Interest (total housing properties)
+Schemes completed (total housing properties)]
Divided by
[Tangible fixed assets: Housing properties at Cost]
+Tangible fixed assets: Housing properties at Valuation
+Tangible fixed assets: Housing properties at Deemed Cost]
Metric 2 – New Supply delivered %
The New Supply metric sets out the number of new social housing and non-social housing units that have been acquired or developed in the year as a proportion of total social housing units and non-social housing units owned at period end.
Measurement of VfM Cost Chain – Effectiveness
A. New supply delivered (Social housing units)
[Total social housing units developed or newly built units acquired in-year (owned)
(Social rent general needs housing (excluding Affordable Rent), Affordable Rent general needs housing, social rent supported housing and housing for older people (excluding Affordable Rent), Affordable Rent supported housing and housing for older people, Low Cost Home Ownership, care homes, other social housing units, social leasehold)]
Divided by
Total social housing units owned at period end (‘social units’ as defined in numerator) (derived using 2017 SDR Data).
Measurement of VfM Cost Chain – Effectiveness
B. New supply delivered ( Non-social housing units)
[Total non-social housing units developed or newly built units acquired in-year (owned)
(Total non-social rental housing units owned, non-social leasehold units owned, New outright sale units developed or acquired)]
Divided by
[Total social and non-social housing units owned (period end)
(Total social housing units owned, Total non-social rental housing units owned, social leasehold units owned, non-social leasehold units owned (period end))] (derived using 2017 SDR Data)
Metric 3 – Gearing %
This metric assesses how much of the adjusted assets are made up of debt and the degree of dependence on debt finance. It is often a key indicator of a registered provider’s appetite for growth.
Measurement of VfM Cost Chain – Efficiency
[Short term loans +Long term loans
-Cash and cash equivalents
+Amounts owed to group undertakings
+Finance lease obligations]
Divided by
[Tangible fixed assets: Housing properties at cost
+Tangible fixed assets: Housing properties at Valuation
+Tangible fixed assets: Housing properties at Deemed Cost]
Metric 4 –EBITDA MRI Interest Cover %
The EBITDA MRI interest cover measure is a key indicator for liquidity and investment capacity. It seeks to measure the level of surplus that a registered provider generates compared to interest payable; the measure avoids any distortions stemming from the depreciation charge.
Measurement of VfM Cost Chain – Efficiency
[Operating surplus / (deficit) - (overall)
-Gain/(loss) on disposal of fixed assets (housing properties)
-Amortised government grant
-Government grants taken to income
+Interest receivable
-Capitalised major repairs expenditure for period
+Total depreciation charge]
Divided by
[Interest capitalised
+Interest payable and financing costs]
Metric 5 – Headline Social Housing Cost per unit (£’000)
The Unit Cost metric assesses the headline social housing cost per unit as defined by the regulator. The cost measures set out in the metric are unchanged from the metric used in the regulator’s 2016 publication Delivering better value for money However, the denominator has been changed from units managed to units owned and/or managed. This change is intended to reduce the distortion of the results that could previously affect a minority of providers where there is a big mismatch between the number of units owned and the number of units managed.
Measurement of VfM Cost Chain – Economy
[Management costs
+Service charge costs
+Routine maintenance costs
+Planned maintenance costs
+Major repairs expenditure
+Capitalised major repairs expenditure for period
+Other (social housing letting) costs
+Development services
+Community / neighbourhood services
+Other social housing activities: Other (operating expenditure)
+Other social housing activities: charges for support services (operating expenditure)]
Divided by
Total social housing units owned and/ or managed at period end.
(Social rent general needs housing (excluding Affordable Rent), Affordable Rent general needs housing, social rent supported housing and housing for older people (excluding Affordable Rent), Affordable Rent supported housing and housing for older people, Low Cost Home Ownership, care homes, other social housing units) (Derived using 2017 SDR data)
Metric 6 – Operating Margin %
The Operating Margin demonstrates the profitability of operating assets before exceptional expenses are taken into account. Increasing margins are one way to improve the financial efficiency of a business. In assessing this ratio, it is important that consideration is given to registered providers’ purpose and objectives (including their social objectives). Further consideration should also be given to specialist providers who tend to have lower margins than average.
Measurement of VfM Cost Chain – Efficiency
A. Operating Margin (social housing lettings only)
Operating surplus / (deficit) from social housing lettings
Divided by
Turnover from social housing lettings
Measurement of VfM Cost Chain – Efficiency
B. Operating Margin (overall)
[Operating surplus / (deficit) - (overall)
–Gain/(loss) on disposal of fixed assets (housing properties)]
Divided by
Turnover (overall)
Metric 7 – Return on capital employed (ROCE) %
This metric compares the operating surplus to total assets less current liabilities and is a common measure in the commercial sector to assess the efficient investment of capital resources. The ROCE metric would support registered providers with a wide range of capital investment programmers.
Measurement of VfM Cost Chain – Efficiency
[Operating surplus / (deficit) - (overall)
(including gain / (loss) on disposal of fixed assets (housing properties)
+Share of operating surplus/(deficit) in joint ventures or associates]
Divided by
Total assets less current liabilities
Data on explanatory variables
This section describes the key explanatory variables used in the streamlined models. Unless otherwise stated, data is drawn from SDR submissions by providers to the regulator, collated to the group level. A full variable definition list is included in Annex B. Descriptive data refers to groups with more than 1,000 units that complete electronic accounts returns and are hence included in this analysis. For a full profile of the provider sector, including the large number of providers with less than 1,000 units, please refer to the 2017 SDR.
Supported housing (% total)
The variable measures supported housing (SH) units (excluding housing for older people) owned and managed as a proportion of total social housing stock owned and managed. The figure excludes a small number of Affordable Rent SH stock as it is not possible to separate it from Affordable Rent housing for older people (HOP) stock within the SDR.
There are a limited number of SH providers, with more than 1,000 units. Out of the 223 providers with complete data, only ten providers had SH stock greater than 30% and for 75% of providers the figure was below 5%. However, there is no clear dividing line between ‘SH’ providers and others – 80% of providers own or manage at least one SH unit.
Figure 2: Number of providers by percentage of SH (2017 group level data)
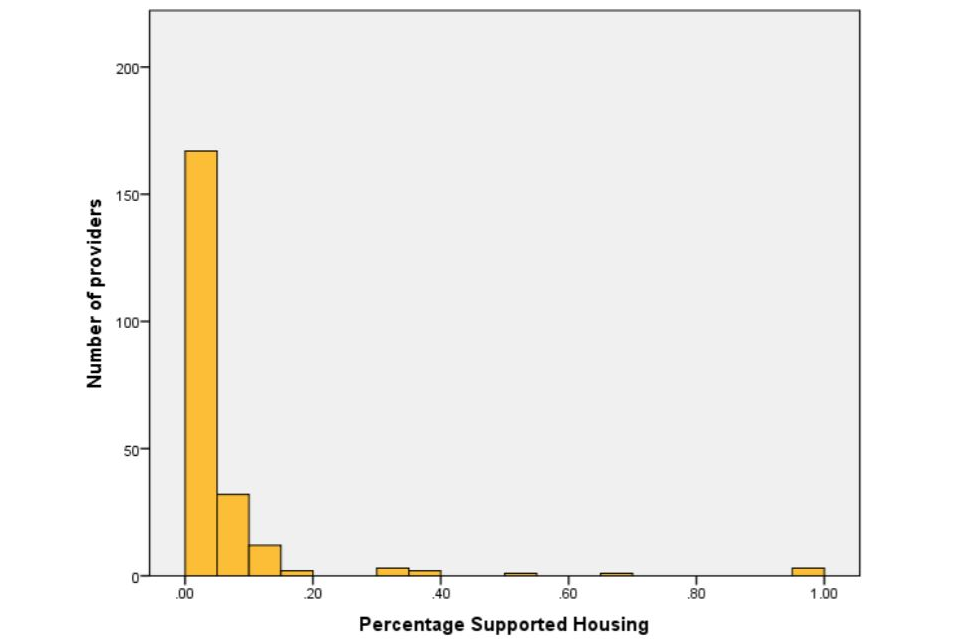
Figure 2: Number of providers by percentage of SH (2017 group level data)
Housing for older people (% total)
The variable measures HOP units owned and managed as a proportion of total social housing stock owned and managed. The figure includes care home units recorded as social housing. It excludes a small number of Affordable Rent HOP stock as it is not possible to separate it from Affordable Rent SH stock within the SDR.
Out of the 223 providers with complete data (and over a 1,000 units) only 10 providers had over 30% HOP stock. The median in the sector is 7.3% housing for older people stock and the mean is 11.4%, with 87% of providers holding some HOP stock.
Figure 3: Number of providers by percentage of HOP (2017 group level data)

Bar chart showing number of providers by percentage housing for older people
Stock transfers (LSVTs)
A group was defined as a stock transfer (or Large Scale Voluntary Transfer, LSVT) if over 50% of their stock was obtained through transfers, with the age of the LSVT being determined by the date of the largest transfer. Three time-dependent dummy variables categorise the maturity of LSVT. The categories are based on whether the provider transferred six or fewer years ago, seven to 12 years ago, or more than 12 years ago.
Table 1: Providers by LSVT category (2017 group level data)
| LSVT < 7 years | LSVT 7-12 years | LSVT > 12 years | Non-LSVT | |
|---|---|---|---|---|
| Number of providers | 7 | 25 | 78 | 113 |
Neighbourhood deprivation (IMD)
The deprivation variable indicates the degree to which a provider operates in deprived neighbourhoods (Lower Super Output Areas – LSOAs). The neighbourhood stock profile of the provider is estimated using CORE data on general needs lettings by LSOA for each provider. This is combined with the LSOA percentile rank from the Government’s published IMD to generate a weighted IMD for each provider.
The sector, as a whole, is generally concentrated in relatively deprived areas in England. The distribution of IMD ranks exhibits a negative skew, with the median group operating in neighbourhoods that are in the 30% most deprived in England (median of 0.70).
Figure 4: Number of providers by deprivation rank (2017 group level data)
Figure 4: Number of providers by deprivation rank (2017 group level data)
Regional wage index
The Annual Survey of Hours and Earnings (ASHE) regional index was calculated for each provider. This uses published 2017 ASHE data, using the mean salary for full-time employers with a split of two thirds administration and one third construction workers in each region. The group level wage index was then calculated by multiplying the provider’s share of stock in each region by the index and subtracting 1 so that the England average was 0.00.
The vast majority of providers operate mainly in one region; with 92.8% having over 50% of the stock that they own or manage in a single region. The index and the accompanying graph both have a positive skew caused by the fact that wages are significantly higher in London than in any other region. This means that 61% of groups are operating in regions where the wage index is lower than the average for England.
Table 2: Percentage of providers by region and associated wage index (2017 group level data)
Here the region of operation is used as an indicator and does not refer directly to the ASHE Regional Wage index of the providers. For example a London based provider will only have an associated ASHE regional wage index of 0.25 if all of their stock holding is in London.
| ASHE Regional Wage Index | % of providers | |
|---|---|---|
| North East | -0.10 | 5.4% |
| North West | -0.08 | 18.4% |
| Yorkshire and the Humber | -0.05 | 7.2% |
| East Midlands | -0.08 | 4.0% |
| West Midlands | -0.08 | 10.8% |
| East of England | 0.00 | 11.7% |
| London | 0.25 | 13.5% |
| South East | 0.01 | 11.7% |
| South West | -0.03 | 10.3% |
| Mixed | N/A | 7.2% |
Total social stock (000s)
The total social stock (000s) variable is inclusive of general needs social rented, owned/managed, general needs Affordable Rent owned, SH social rent owned/ managed, HOP social rent owned/ managed, intermediate rent owned/ managed, care homes (meeting definition of social housing) owned/ managed, and social leased units (<100%) owned/managed.
The size of groups ranges from 1,005 units up to 108,500 units; with a median of 6,186 units and a mean of 10,791 units. Overall, 86% of groups have less than 20,000 units.
Figure 5: Number of providers by Total social stock (‘000’s) (2017 group level data)

Figure 5: Number of providers by Total social stock (‘000’s) (2017 group level data)
Missing data
Where possible all data was included in the analysis and there were few instances of missing data. The largest source of missing data was from the CORE dataset, which is used in the formation of the IMD variable. In cases where no CORE data was available the missing data was replaced by the global average, as in the 2016 Unit Cost work. This only affected a relatively small number of data points and was deemed preferable to removing observations from the regression analysis.
Regression analysis – headline results
This section sets out the results of the regression analysis of VfM metrics using the streamlined models (7 variables).
Primary metrics
Initial analysis using the full models (the full models include 33 variables. These are shown in Table 4, page 29) identified five VfM metrics where the results of the models were economically and statistically more powerful than the remaining four metrics.
These “primary metrics” were:
- Reinvestment
- New Supply (Social)
- Gearing
- Headline Social Housing Cost
- Operating Margin (Overall).
Regression results will be presented for all nine metrics but commentary and inferences will be drawn mainly from the primary metrics.
Overview of regression
Results are derived from standard Ordinary Least Squares (OLS) (commonly referred to as linear regression analysis) regression analysis. The summary results are drawn from the ‘streamlined models’ which show the relationship between VfM metrics and the seven most important explanatory variables. The subsequent section shows results for the broader default models, which were used for initial testing, and provides a discussion of those variables where there was no clear evidence of any relationship with the VfM metrics.
Outliers and influential observations which can disproportionately skew regression analysis were removed. These were identified using standard thresholds for studentised and standardised residuals, Cook’s distances and Leverage metrics. This resulted in the removal of 267 observations (13.3%) across the nine metrics. Analysis was ultimately based on 1,740 observations – on average 193 groups per metric.
In order to get assurance on the robustness of results, default and streamlined regressions were also run for models including outliers and influential variables. Results stated in this section were, unless stated otherwise, robust to these alternative forms
Headline results
Headline results are based on the final Streamlined OLS models. Commentary is focused on results of the primary metric models and coefficients quoted are all significant at 90% confidence levels, or above, unless otherwise stated.
The baseline definition for all headline results is based on the following:
- Traditional provider
- 100% General Needs stock
- Operating in a median deprivation level
- Operating in a region of England average wage
- Holding a median level of stock.
Reinvestment
Baseline
The baseline level of reinvestment is 5.4% when measured as the total investment in social housing properties as a proportion of the net book value of housing properties. This is based on a traditional provider with the median number of units all of which are general needs, operating in an area with average deprivation and wages. It is composed of the regression intercept, 6.1%, plus the effect of average neighbourhood deprivation.
Stock transfers
LSVT providers had reinvestment levels significantly above the sector average. In years 1-6 post-transfer reinvestment is 12.6%, 132% higher than a comparable traditional provider. This reduces to 9.6% for transfer providers 7-12 years after transfer.
The higher levels of reinvestment are driven by the completion of maintenance and major repairs work undertaken on existing stock as part of the post-transfer agreements. These works are typically completed over the first 5-10 years after transfer; highlighted by the fact that reinvestment levels for providers more than 12 years after transfer are much more in line with traditional providers.
Supported housing
Providers with 30% SH properties will have reinvestment levels, on average, 20% lower than providers with solely general needs stock. This appears to be driven by significantly lower levels of investment in new stock, as opposed to investment in existing stock. This is intuitive given the higher costs and lower operating margins associated with owning and/or managing SH stock, will mean that fewer resources are available for new development.
Housing for older people
Once other factors have been held constant a provider with 30% HOP stock will have reinvestment levels 15% higher than the sector average. The difference appears to be driven by higher levels of investment in existing stock seen across specialised HOP providers.
New Supply (Social)
Baseline
The baseline level of New Supply (social) is 1.4% when measured as New Supply delivered as a proportion of average stock holding. This is based on a traditional provider with the median number of units, all of which are general needs, operating in an area with average deprivation and wages. It is composed of the regression intercept, 2.9%, plus the effect of average neighbourhood deprivation and stock holding.
Stock transfers
Transfer in their first seven years had New Supply (social) figures of 0.3%, 79% below the baseline figure. Early years transfers typically have higher costs, associated with the completion of post-transfer maintenance and major repairs works, and lower turnover, as Local Authority rent levels tend to be below those in housing associations, meaning that they have limited capacity to focus on the development of New Supply.
This affect dissipates relatively quickly after transfer with the coefficient of the LSVT 7-12 years (DV) variable not being statistically different from zero.
Housing for older people
Providers with entirely HOP units have a New Supply (social) figure 82% below the equivalent general needs figure. Whilst the New Supply figure remains relatively constant for providers with up to 20% HOP stock there is a sharp reduction across specialised HOP providers which appear to be causing the result.
Deprivation
There is a significant relationship between deprivation and New Supply, with those providers operating in the most deprived percentile developing 76% less new social supply than those operating in the least deprived percentile. This is likely to be driven by three factors. More deprived areas tend to have higher costs associated with more extensive regeneration and community initiatives, higher voids and turnover, and potentially greater crime and anti-social behaviour. The turnover per unit is also lower in more deprived areas, due to typically lower rents, meaning that operating margins are significantly lower and thus capacity to develop is curtailed. Alongside this, demand for housing tends to be lower in deprived areas which are likely to further reduce development activity.
Supported housing
There is no statistically significant relationship between the level of SH held by a provider and the level of New Supply (social) which is surprising given the lower operating margins across SH providers which one would expect to hinder development. Looking at the data in more detail this appears to be driven by lower levels of development by providers with 0-1% SH units, due in part to the concentration of LSVT providers in this cohort and also a handful of providers with between 10-20% SH stock with above average New Supply figures.
Total Social Stock
There is no clear linear relationship between the size of the provider and the New Supply (social) metric, with the variable not being significant. Other measures of economies of scale were also tested; the results of which are outlined in more detail in the following section.
Gearing
Baseline
The baseline level of gearing is 48% when measured as net debt as a proportion of the net book value of housing properties. This is based on a traditional provider with the median number of units all of which are general needs, operating in an area with average deprivation and wages. It is composed of the regression intercept, 67%, plus the effect of average neighbourhood deprivation and stock holding.
Stock transfers
The analysis found that early years transfers, those in years 1-6 after transfer, had gearing level 38% lower than traditional providers, reducing to 12% for transfers in years 7-12.
These findings appear to have been driven by the particular cohort of transfer providers and are not typical of historic transfers. Most of the recent transfers have had low initial property valuations, meaning that providers have had lower debt levels on transfer than has been typical for LSVTs, and have tended to borrow steadily post-transfer to support the completion of agreed maintenance and major repairs works.
Providers that transferred over 12 years ago have gearing levels in line with traditional providers.
Supported housing and housing for older people
Both SH and housing for older people variables have a significant effect on gearing levels. A provider with 30% SH will have gearing levels 30%, lower than that of an equivalent general needs provider. Whereas, a provider with 30% HOP stock, will have gearing levels 17% lower.
In both instances this appears to be driven by supported housing/housing for older people providers; with the gearing levels remaining relatively flat up to around the 20% level before reducing markedly. It is particularly pronounced in specialised SH providers driven by a handful of providers that hold very low levels of debt.
Wages
The wage index has an impact on both the numerator and denominator of the gearing metric, with a cancelling effect. Providers operating in high wage areas have higher average property values but also a greater capacity to borrow and hence also have higher net debt levels per property.
Overall the effect on the property values is greater than on net debt per property and hence there is a negative relationship between the index and gearing levels. With providers operating in London typically having gearing levels 14% lower than the England average.
Deprivation
Deprivation has a similar cancelling impact, with providers operating in more deprived areas tending to have lower property values but also lower net debt per property. This is due to lower borrowing capacity and lower levels of development, as highlighted by the New Supply metrics.
The impact on net debt is greater than the impact on property valuations and subsequently providers operating in the most deprived percentile having gearing levels 42% lower than providers operating in the least deprived percentile.
Headline Social Housing Cost
The results of the Headline Social Housing Cost model are broadly comparable to those seen in the 2016 Unit Cost work. There are however a number of differences between the two pieces of analysis which may help to explain the differences observed.
The data used in 2017 is at the group level, rather than the Entity level used data in 2016 analysis. Alongside this, the latest iteration only includes data from 2017, the first year after the rent reduction was introduced. The majority of providers made significant cost reductions in response to the rent changes which will feed through into the model.
Baseline
The baseline headline social housing cost per unit is £3,300. This is based on a traditional provider with the median number of units all of which are general needs, operating in an area with average deprivation and wages. It is composed of the regression intercept (£2,900) plus the effect of average neighbourhood deprivation and stock holding.
Supported housing
Each unit of SH is associated with costs of £6,700 above general needs properties. This is likely to be associated with the high support costs and a broader scope of activities undertaken by organisations with a specialised focus. The precise estimate of associated costs is sensitive to the inclusion or removal of more specialised SH organisations – with model estimates increasing to £10,800 when all outliers are included. There is likely to be considerable diversity with the cost associated with each SH unit in the sector, for example by the client group and the level of service supplied.
Housing for older people
Each unit is associated with cost of £1,400 above general needs units. This average is likely to include a range of service levels and costs, from very intensive facilities offering services akin to care homes to properties where costs may be broadly similar to other general needs properties. As with SH the coefficient is sensitive to the inclusion and/or exclusion of a small number of specialised providers with the coefficient reaching £5,500 when all outliers are included.
Wages
Cost differences in providers operating in different regions broadly follow the differences in underlying regional wages, once all factors are taken into account. The average coefficient from the streamlined regression means that providers in London have average costs of £1,900 per unit above the England average.
Stock transfers
Stock transfer providers have average headline costs of £1,100 per unit higher than traditional providers in years 1-6 post-transfer. This gap narrows to £100 per unit for providers in years 7-11 (although the variables is not statistically significant), and disappears after 12 years. There are also significant differences between the cost profiles of LSVT and traditional providers at a more granular level. LSVTs have on average significantly higher combined maintenance and major repairs costs and lower management, service charge and other social housing costs than the traditional sub-sector.
There are two main reasons for cost differences. Firstly, the higher maintenance and major repairs cost for many LSVT providers is in all probability attributable to high capital investment, regeneration and community engagement programmes typically undertaken in the first few years after transfer. The higher management and service charges of traditional providers can be explained, at least to some extent, by the greater proportion of SH and HOP units held.
Neighbourhood deprivation
Providers operating in neighbourhoods ranked in the most 1% most deprived according to the Index of Multiple Deprivation have costs on average £350 per unit higher than providers operating in an area with median levels of deprivation for England; down from £500 in the 2016 Unit Cost analysis. The additional costs are likely to be associated with a range of factors including: more extensive regeneration and community initiatives, higher voids and turnover, and potentially greater crime and anti-social behaviour.
Total Social Stock
There is no clear linear relationship between the size of the provider and the headline social housing cost with the variable not being significant.
Operating Margin (Overall)
Baseline
The baseline Operating Margin (overall) is 35%, combined of: an intercept, 46%, the impact of operating in the area with average deprivation levels and holding the median number of general needs units.
Stock transfers
Early years transfers, those in years 1-6 after transfer, have operating margins 14% lower than the baseline provider, reducing to 8% for transfers in years 7-12. This is linked to higher costs, associated with completing maintenance and major repairs works posttransfer and typically lower turnover due to Local Authority rents typically being lower than those seen in the housing association sector. Both these factors reduce over time, as transfer agreements are met and providers have the ability to rebase rents to the Social Rent Rate (Formerly Formula Rent (FR) and before that Target Rent (TR)) (on re-let).
Supported housing and Housing for older people
A provider with 30% SH units will have, on average, an Operating Margin (Overall) 37% lower than a provider with only general needs units. This is linked to the higher costs associated with providing support and that a larger proportion of supported providers income comes via service charges which can only cover costs incurred.
The relationship is the same for HOP providers, although the difference is not as pronounced. The Operating Margin for a provider with 30% HOP units is 13% lower than that of a general needs provider.
Deprivation
Higher costs and lower rental levels, driven by lower property prices and lower wages, alongside typically lower demand for social housing properties means that operating margins are lower in more deprived areas. Operating margins for providers with stock in the most deprived percentile are on average 33% lower than those of providers with stock in the least deprived percentile.
Wages
High wage areas are associated with greater costs for providers, as staff remuneration will be higher, as well as higher turnover, as rental incomes tend to be above the national averages; particularly income from social rented properties where the Social Rent Rate is explicitly linked to localised wages and property prices. This leads to a cancelling effect on the Operating Margin. Overall the impact is slightly negative with providers in London typically having operating margins 4% below providers operating in the average wage area. The variable however is only significant at a 15% confidence level.
Table 3: Final streamlined models
| VfM metric | Reinvestment % | New Supply (Social) % | New Supply (Non-Social) % | Gearing % | EBITDA MRI Interest Rate Cover % | Headline Social Housing Cost (£’000) | Operating Margin (SHL) % | Operating Margin (Overall) % | ROCE % |
|---|---|---|---|---|---|---|---|---|---|
| Intercept | 0.061*** | 0.029*** | 0.0015*** | 0.67*** | 1.52*** | 2.85*** | 0.51*** | 0.46*** | 0.033*** |
| LSVT <7 years (DV) | 0.072*** | -0.011*** | -0.0006*** | -0.18*** | -0.37 | 1.11*** | -0.08*** | -0.05*** | 0.008*** |
| LSVT 7-12 years (DV) | 0.041*** | -0.001 | -0.0001 | -0.06** | 0.41*** | 0.10 | -0.03*** | -0.03*** | 0.015*** |
| % Supported housing | -0.036*** | 0.006 | 0.0010 | -0.48*** | -0.25 | 6.72*** | -0.31*** | -0.44*** | -0.044*** |
| % Housing for older people | 0.032** | -0.012*** | -0.0007 | -0.26*** | 1.38*** | 1.39** | -0.20*** | -0.15*** | -0.005 |
| Regional wage index (Combined) | -0.007 | 0.000 | 0.0015 | -0.28*** | -0.98** | 7.48*** | -0.15*** | -0.06* | -0.044*** |
| Index of Multiple Deprivation (% rank) | -0.009 | -0.023*** | -0.0018** | -0.28*** | 1.22*** | 0.70* | -0.19*** | -0.15*** | 0.024*** |
| Total Social Stock (000s) | 0.000 | 0.000 | 0.0001*** | 0.00 | -0.01* | 0.00 | 0.00 | -0.0006* | 0.000 |
| N (total observations) | 193 | 193 | 197 | 193 | 202 | 194 | 185 | 189 | 194 |
| Mean | 0.0610 | 0.0132 | 0.0008 | 0.431 | 2.41 | 3.67 | 0.344 | 0.313 | 0.049 |
| Standard deviation | 0.0339 | 0.0105 | 0.0020 | 0.162 | 1.06 | 1.22 | 0.075 | 0.075 | 0.020 |
| Standard error | 0.0303 | 0.0098 | 0.0020 | 0.144 | 1.02 | 0.84 | 0.062 | 0.060 | 0.018 |
| R-squared | 0.232 | 0.156 | 0.092 | 0.241 | 0.102 | 0.545 | 0.345 | 0.386 | 0.271 |
| Adjusted R-squared | 0.203 | 0.124 | 0.059 | 0.212 | 0.069 | 0.528 | 0.319 | 0.362 | 0.243 |
Unless indicated otherwise, figures presented in the main body of the table are the regression coefficients. DV indicates dummy variable.
***Significant at 95% confidence level
**Significant at 90%
*Significant at 80% (standard t-tests)
Regression analysis – additional testing
This section sets out the results of wider regression testing, above and beyond the streamlined final models presented in the previous section. It includes results from the broader default models (33 explanatory variables).
Explanatory factors excluded from the streamlined models
Economies of scale
Significant testing based on the size of providers has been undertaken. Using variables both of Total Stock and stock figures broken down into the main stock categories, General Needs, Supported Housing and Housing for older people and including different functional forms, linear, squared and logged terms. From this, there was no significant evidence of a clear relationship between scale of a provider and the primary VfM metrics (once factors are controlled for).
Models that used the broken down stock figures did result in a number of significant relationships, particularly across the logged terms. However, their inclusion altered the significance and coefficients of existing variables and the Bayesian Information Criterion (BIC) figures were significantly lower across all the models. They were hence not included in the final streamlined models.
There were no significant stock variables in models that use just linear or quadratic Total Stock variables. Models that included logged stock variables are significant across New Supply (Social) and Gearing and models inclusive of linear and quadratic stock variable are significant across Reinvestment, New Supply (Social) and Gearing.
Across the two variables, New Supply (Social) and Gearing, the log and linear and quadratic models give similar results up to 20k units, with both models indicating economies of scale. However, they then diverge – with the log models suggesting that economies of scale continue to be achieved, while the linear and quadratic models suggest the inverse.
Figure 6: Economies of scale testing – New Supply (Social) (2017 group level data)
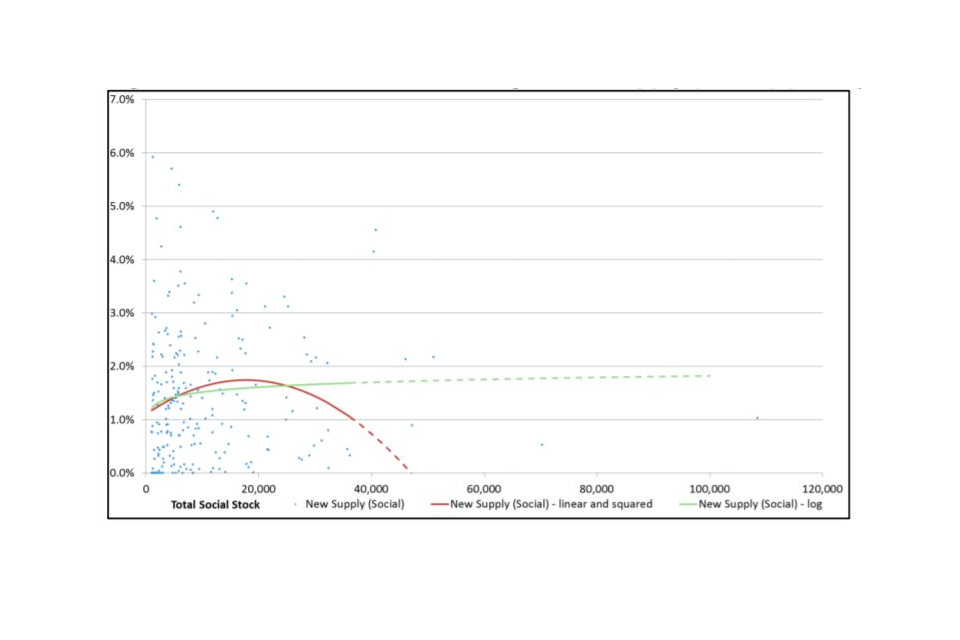
Figure 6: Economies of scale testing – New Supply (Social) (2017 group level data)
Figure 7: Economies of scale testing – Gearing (2017 group level data)
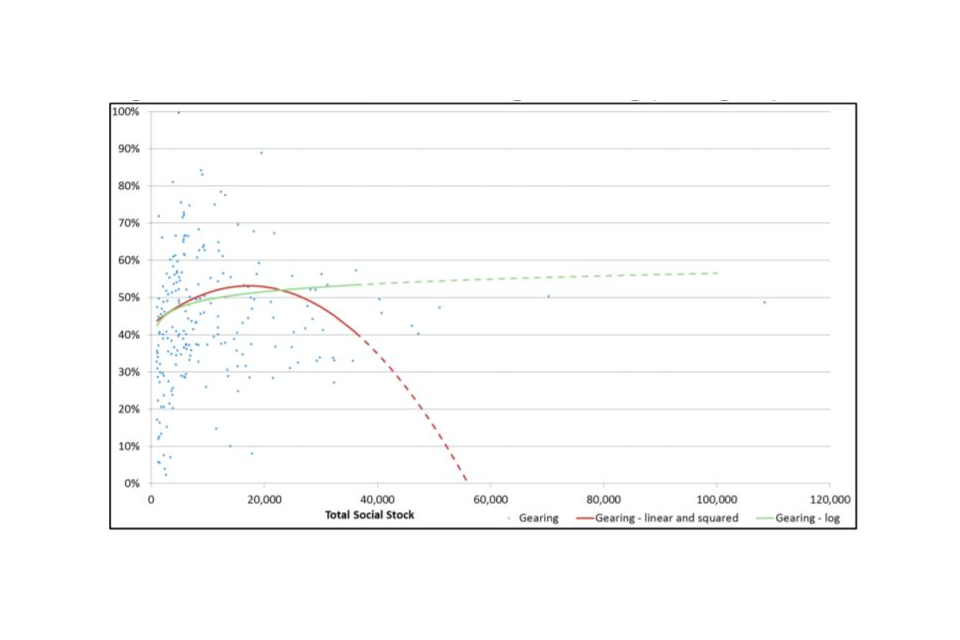
Figure 7: Economies of scale testing – Gearing (2017 group level data)
% Reduction non-decent
The % Reduction non-decent variable was the only variable included within the streamlined model from the 2016 analysis into Headline Social Housing Cost per Unit that was not included in the streamlined models of the VfM metrics. The level of non-decent stock has reduced markedly in the sector over the last eight years, from 8.3% of social rented units in 2009 to 0.3% and 0.5% in 2016 and 2017 respectively (2017 Statistical Data Return SDR); meaning that the number of units made decent in the year to 2017 was low and hence the variable was not significant across any of the primary metrics.
% Affordable Rent stock variables
The % Affordable Rent stock variable was significant across a number of the primary metrics but was not included in the final streamlined models as further analysis suggested that the variable was acting as a proxy for medium term development.
There is a positive relationship between Affordable Rent (AR) Percentage and New Supply (Social) but causation is complex. As AR did not exist prior to 2011 and has been the predominant form of grant funded New Supply in recent years (with little funding available for other tenures) it is to be expected that those providers with the highest level of New Supply will also have the highest proportion of AR stock.
However, given that in lieu of grant, providers were able to convert existing Social Rent units to AR to subsidise the development of social stock, the proportion of AR in the stock will increase providers’ financial capacity to deliver New Supply, which will further reinforce this relationship.
Percentage AR stock variable appears to be acting as a proxy for (medium term) development which would explain the significant relationships seen between the variable and the Reinvestment and Gearing metrics.
LSVT > 12 years
After 12 years the VfM metrics of LSVT providers more closely resemble traditional providers; with the LSVT > 12 years variable only statistically significant across two of the five primary metrics. Therefore, the variable was not included in the streamlined models.
Group member (DV)
The variable is only significant across two out of the five primary metrics and in the instances where it is significant the relationship is not clear and intuitive. It was therefore not included in the streamlined models.
Valuation method (DV)
Once outliers had been removed none of the three groups using Valuation as their valuation method were left in the dataset. Hence to avoid a perfectly linearly correlated model the Mixed variable also had to be removed; meaning that the two variables used in the full models were the Cost and Deemed Cost valuation methods. Neither Cost nor Deemed Cost were significant across any of the five primary metrics and hence were not included in the streamlined models.
Supported housing and Housing for older people specialist (DV)
Both variables are clearly correlated with the % Supported Housing and % Housing for older people variables respectively, leading to material changes to existing coefficients, and performance of the models inclusive of the dummy variables was only significantly better than the existing models across one out of the five primary metrics. Therefore, the variables were not added to the streamlined models.
Low Cost Home Ownership and Non-social stock variables
The Low Cost Home Ownership and Non-social stock variables are not significant across the majority of the primary VfM metrics and the instances where there are significant relationships the causation is not clear. As such, none of the variables have been included in the streamlined models.
Table 4: Full variable models
| VfM metric | Reinvestment % | New Supply (Social) % | New Supply (Non-Social) % | Gearing % | EBITDA MRI Interest Rate Cover % | Headline Social Housing Cost (£’000) | Operating Margin (SHL) % | Operating Margin (Overall) % | ROCE % |
|---|---|---|---|---|---|---|---|---|---|
| Intercept | 0.027 | 0.013* | 0.0006 | 0.36*** | 3.28*** | 2.43*** | 0.55*** | 0.47*** | 0.010 |
| LSVT <7 years (DV) | 0.082*** | 0.002 | -0.0004 | -0.14*** | -0.51 | 1.22*** | -0.08*** | -0.05* | 0.003 |
| LSVT 7-12 years (DV) | 0.050*** | 0.009*** | -0.0001 | -0.12*** | 0.36 | 0.41* | -0.03* | -0.02 | 0.007 |
| LSVT >12 years (DV) | 0.023*** | 0.007*** | 0.0004 | 0.01 | 0.15 | 0.14 | -0.01 | 0.00 | 0.009*** |
| Group member (DV) | -0.0009 | 0.001 | -0.0002 | 0.00 | -0.02 | 0.36** | -0.03*** | -0.03*** | -0.008*** |
| Valuation method (Cost) | 0.009 | 0.000 | 0.0005 | 0.04 | 0.22 | -0.09 | 0.00 | 0.01 | 0.015*** |
| Valuation method (Deemed cost) | -0.006 | -0.001 | -0.0009 | -0.01 | 0.33 | -0.30 | 0.01 | 0.03 | 0.005 |
| SH Specialist (DV) | 0.028** | -0.005 | -0.0006 | -0.22*** | -0.34 | -3.52*** | -0.02 | 0.06* | -0.012* |
| HOP Specialist (DV) | -0.002 | -0.006 | 0.0004 | -0.11 | -0.13 | 0.26 | -0.01 | -0.04 | 0.027** |
| Total social stock (000s) | 0.166 | -0.010 | 0.0078 | 0.45 | 5.60 | 4.13 | -0.16 | -0.28 | 0.201*** |
| % Reduction non-decent | 0.319 | 0.048 | -0.0229 | -4.25*** | -7.90 | -1.22 | -0.90 | 0.19 | -0.318 |
| GN stock (000s) | -0.157 | 0.010 | -0.0087 | -0.48 | -5.10 | -4.37 | 0.15 | 0.28 | -0.201*** |
| GN stock (000s) squared | -0.001 | 0.000 | 0.0000* | 0.00 | 0.00* | 0.00 | 0.00 | 0.00 | 0.000 |
| GN stock (000s) cubed | 0.000* | 0.000 | 0.0000 | 0.00 | 0.00* | 0.00 | 0.00 | 0.00 | 0.000 |
| GN stock (000s) log | -0.016 | -0.005 | 0.0036** | 0.25* | -1.80* | 0.72 | 0.03 | -0.02 | 0.024** |
| % Supported housing | -0.040 | 0.019 | -0.0017 | 0.23 | 0.22 | 14.08*** | -0.16 | -0.31*** | 0.030* |
| SH stock (000s) | -0.353 | 0.422* | 0.0608* | -0.33 | -6.90 | 12.13 | -2.23* | 0.68 | -0.186 |
| SH stock (000s) squared | 0.049 | -0.145** | -0.0282** | 0.13 | 2.24 | -5.90 | 0.81* | -0.05 | 0.035 |
| SH stock (000s) cubed | -0.006 | 0.027*** | 0.0061*** | -0.05 | -0.65 | 1.15 | -0.13* | 0.00 | -0.011 |
| SH stock (000s) log | 0.198 | -0.421* | 0.0655* | -0.34 | -1.54 | -16.86 | 2.36* | -0.65 | -0.086 |
| % Housing for older people | 0.050 | 0.003 | 0.0026 | 0.12 | 0.96 | 0.78 | -0.28*** | -0.18** | -0.013 |
| HOP stock (000s) | -0.062 | 0.016 | -0.0096 | -1.14 | 0.34 | -5.34 | 0.30 | 0.43 | -0.188** |
| HOP stock (000s) squared | -0.020 | -0.001 | 0.0008 | 0.11 | -1.03 | 0.25 | -0.03 | -0.03 | -0.001 |
| HOP stock (000s) cubed | -0.001 | 0.000 | -0.0001 | -0.01 | 0.07 | -0.02 | 0.00 | 0.00 | 0.000 |
| HOP stock (000s) log | -0.124 | -0.010 | -0.0004 | 0.84 | -7.82* | 1.47 | -0.13 | -0.16 | -0.016 |
| % Low Cost Home Ownership | 0.057 | -0.039* | 0.0018 | -0.17 | -4.12* | 2.89* | -0.97*** | -0.82*** | -0.003 |
| LCHO stock (000s) squared | -0.027 | -0.001 | -0.0015 | -0.08 | -1.46* | -0.75 | 0.02 | 0.04 | -0.039*** |
| LCHO stock (000s) cubed | 0.002 | 0.000 | 0.0002 | 0.01 | 0.16* | 0.06 | 0.00 | 0.00 | 0.003*** |
| LCHO stock (000s) log | -0.213 | 0.044 | -0.0109 | -0.66 | -5.10 | -5.51 | 0.40 | 0.55* | -0.253*** |
| % Non-social stock | -0.019 | 0.003 | -0.0016 | 0.21 | -0.22 | 6.46*** | -0.25** | 0.00 | 0.015 |
| Non-social stock (000s) | 0.001 | 0.000 | 0.0011*** | 0.01 | -0.08 | -0.16 | 0.01* | 0.00 | -0.001 |
| % AR (GN only) | 0.117*** | 0.069*** | 0.0000 | 0.32** | -1.33 | -2.10** | 0.13* | 0.23*** | -0.023 |
| Regional wage index (Combined) | 0.019 | -0.009 | -0.0025*** | -0.16** | -0.90* | 6.53*** | -0.19*** | -0.06* | -0.024*** |
| Index of Multiple Deprivation (% rank) | 0.010 | -0.007 | -0.0021*** | -0.33*** | 0.75 | 0.39 | -0.18*** | -0.11*** | 0.013* |
| N (total observations) | 193 | 193 | 197 | 193 | 202 | 194 | 185 | 189 | 194 |
| Mean | 0.0610 | 0.0132 | 0.0008 | 0.431 | 2.41 | 3.67 | 0.344 | 0.313 | 0.049 |
| Standard deviation | 0.0339 | 0.0105 | 0.0020 | 0.162 | 1.06 | 1.22 | 0.075 | 0.075 | 0.020 |
| Standard error | 0.0285 | 0.0088 | 0.0018 | 0.135 | 1.01 | 0.78 | 0.057 | 0.054 | 0.014 |
| R-squared | 0.417 | 0.426 | 0.339 | 0.430 | 0.223 | 0.663 | 0.532 | 0.581 | 0.605 |
| Adjusted R-squared | 0.296 | 0.306 | 0.205 | 0.312 | 0.082 | 0.594 | 0.430 | 0.491 | 0.524 |
Unless indicated otherwise, figures presented in the main body of the table are the regression coefficients. DV indicated dummy variable.
***Significant at 95% confidence level
**Significant at 90%
*Significant at 80% (standard t-tests)
Annex A – Details of diagnostic testing
This Annex summarises the diagnostic testing on the streamlined and full models presented above. This is to ensure that assumptions necessary to draw statistical inferences are met and that results are stable to different formulations to the models.
Heteroskedasticity, autocorrelation and normality of residuals
Heteroskedasticity and Autocorrelation Corrected (HAC) standard errors were used throughout the analysis. Normality of residuals was tested and they failed the Jarque-Bera test at conventional confidence levels in three out of the five primary metrics. However, standard statistical tests and inferences are still valid given the large sample size and the use HAC standard errors.
Mulitcollinearity
Multicollinearity is where that two or more explanatory variables are closely linearly related. The primary concern is that as the degree of multicollinearity increases, the regression model estimates of the coefficients become unstable and the standard errors for the coefficients are inflated. Multicollinearity was tested using the variance inflation factor values for each of the explanatory variables in the full models, with no further action required. Each time new variables were added, the models were tested for multicollinearity. In instances where the new variables created problems of multicollinearity with existing variables the new models were carefully compared to the existing models to determine which of the variables should be included.
Specification testing
Potential miss-specification of the models was tested using the Ramsey RESET test. Across the five primary metrics the models passed the RESET test in all instances indicating that the models are correctly specified.
Across the four wider metrics the RESET test failed on three occasions, indicating potential issues of miss-specification across the New Supply (Non-social), EBITDA MRI Interest Rate Cover and ROCE models. However, given the limited focus on these models and the desire to produce consistent (inclusive of the same explanatory variables) intuitive models across all of the metrics, no changes were made.
Model selection
The aim of the process was to obtain consistent models across each of the metrics that included all variables that were economically and statistically significant, and were intuitive and easy to communicate. Using the full models as the basis of testing, decisions to omit or add variables described in previous sections were made both with reference to R^2, Bayesian Information Criterion (BIC) and F-test statistics and the intuitive interpretation of results.
Annex B – Full explanatory variable list
Table 5: List of variables to be used in regression analysis
| Variable name | Description | Source |
|---|---|---|
| Independent variables | ||
| Total social housing (SH) stock | Sum of: General Needs (GN) social rent owned/ managed, GN AR owned, SH social rent owned/managed, Housing for older people social rent owned/ managed, Intermediate rent owned/ managed, Care homes (meeting definition of social housing) owned/ managed, and social leased units (<100%) owned/managed. | SDR17 |
| GN stock (000s) | GN units owned or managed in units of 000s. GN social rent, GN AR (owned only) and Intermediate Rent stock are included. | SDR17 |
| GN stock (000s) squared | GN units owned or managed in units of 000s, squared. GN social rent, GN AR (owned only) and Intermediate Rent stock are included. | SDR17 |
| GN stock (000s) cubed | GN units owned or managed in units of 000s, cubed. GN social rent, GN AR (owned only) and Intermediate Rent stock are included. | SDR17 |
| GN stock (000s) log | GN units owned or managed in units of 000s, log (natural log, base e; ln). GN social rent, GN AR (owned only) and Intermediate Rent stock are included. | SDR17 |
| Housing for older people (% total) | Housing for older people (HOP) units owned or managed, as a proportion of total social housing stock. HOP social rent, and Care homes (meeting the definition of social housing) are included. | SDR17 |
| HOP stock (000s) | HOP units owned or managed, in units of 000s. HOP social rent, and Care homes (meeting the definition of social housing) are included. | SDR17 |
| HOP stock (000s) squared | HOP units owned or managed in units of 000s, squared. HOP social rent, and Care homes (meeting the definition of social housing) are included. | SDR17 |
| HOP stock (000s) cubed | HOP units owned or managed in units of 000s, cubed. HOP social rent, and Care homes (meeting the definition of social housing) are included. | SDR17 |
| HOP stock (000s) log | HOP units owned or managed in units of 000s, log (natural log, base e; ln). HOP social rent, and Care homes (meeting the definition of social housing) are included. | SDR17 |
| SH (% total) | SH units (excluding HOP) owned or managed, as a proportion of total social housing stock. SH social rent only is included. | SDR17 |
| SH stock (000s) | SH units (excluding HOP) owned or managed, in units of 000s. SH social rent only is included. | SDR17 |
| SH stock (000s) squared | SH units owned or managed in units of 000s, squared. SH social rent only is included. | SDR17 |
| SH stock (000s) cubed | SH units owned or managed in units of 000s, cubed. SH social rent only is included. | SDR17 |
| SH stock (000s) log | SH units owned or managed in units of 000s, log (natural log, base e; ln). SH social rent only is included. | SDR17 |
| Shared ownership (LCHO) (% total) | Total Low Cost Home Ownership (LCHO) stock owned or managed, where the purchaser has not acquired 100% of the equity. Given as a proportion of total social housing stock. | SDR17 |
| LCHO stock (000s) | Total LCHO owned or managed, where the purchaser has not acquired 100% of the equity, in units of 000s | SDR17 |
| LCHO stock (000s) squared | LCHO units owned or managed in units of 000s, squared. | SDR17 |
| LCHO stock (000s) cubed | LCHO units owned or managed in units of 000s, cubed. | SDR17 |
| LCHO stock (000s) log | LCHO units owned or managed in units of 000s, log (natural log, base e; ln). | SDR17 |
| Non-social housing (% total) | Total non-social housing which is owned or managed as a proportion of total social housing stock. | SDR17 |
| Non-social stock (000s) | Total non-social housing which is owned or managed, in units of 000s | SDR17 |
| Affordable Rent (% total) | Affordable GN AR units owned, as a proportion of total social housing stock | SDR17 |
| % reduction in non-decent stock | Reduction in non-decent stock owned since the previous year, as a proportion of total social housing stock. This is a proxy for major repairs. Therefore all recorded increases in non-decent stock owned by a provider during a year – due to transfers of stock from local authorities for example – are excluded. Reduction in Decent Home Standard owned only as data not collected on managed units. | SDR16, SDR17 |
| LSVT < 7 years (DV) | Dummy variable to indicate where a provider has been a stock transfer organisation for under 7 years (i.e. =1 if the provider is a stock transfer organisation & has been so for less than 7 year, =0 if not). Providers classed as LSVT where >50% of social stock is transfer stock, and LSVT age based on the date of the largest stock transfer. Where groups contain a mixture of LSVT and traditional providers, the group will be classed as LSVT if >50% of the group social stock is transfer stock. | SDR17 |
| LSVT 7 - 12 years (DV) | Dummy variable to indicate where a provider has been a stock transfer organisation for between 7 to 12 years (i.e. =1 if the provider is a stock transfer organisation & has been so for between 7 and 12 year, =0 if not). LSVT definitions as above. | SDR17 |
| LSVT > 12 years (DV) | Dummy variable to indicate where a provider has been a stock transfer organisation for over 12 years (i.e. =1 if the provider is a stock transfer organisation & has been so for more than 12 year, =0 if not). LSVT definitions as above. | SDR17 |
| DV for HOP provider | A dummy variable to indicate whether the provider can be termed a HOP specialist provider (=1 if SH for older people) is more than 30% of stock owned or managed, =0 if less). | SDR17 |
| DV for SH provider | A dummy variable to indicate whether the provider can be termed a SH specialist provider (excluding older people’s units) (=1 if SH (excl. older) is more than 30% of stock owned or managed, =0 if less). | SDR17 |
| Group member (DV) | Dummy variable to indicate whether the FVA return is part of a group (i.e. =1 if in a group, =0 if not). | FVA17 |
| Valuation method (Cost) | Dummy variable to indicate whether assets reported solely at Cost in FVA reporting (i.e. =1 if Cost, =0 if not). | FVA17 |
| Valuation method (Valuation) | Dummy variable to indicate whether assets reported solely at Valuation in FVA reporting (i.e. =1 if Valuation, =0 if not). | FVA17 |
| Valuation method (Deemed Cost) | Dummy variable to indicate whether assets reported solely at Deemed Cost in FVA reporting (i.e. =1 if Deemed Cost, =0 if not). | FVA17 |
| Valuation method used (Mixed) | Dummy variable to indicate whether assets reported using a mixture of Cost, Valuation and Deemed Cost in FVA reporting (i.e. =1 if Mixed, =0 if not). | FVA17 |
| Weighted wage index Combined | A composite regional wage index has been calculated for every provider. This is based on a regional wage index Annual Survey of Hours and Earnings data for relevant occupations, 2017) and the share of GN, SH & HOP stock owned by each English region. In the wage index the England average is indexed at 1.0. In the final regression we take 1.0 off each variable, so the England average is 0.0. | SDR17, ASHE 2017 |
| Weighted Index of Deprivation | Weighted Index of Multiple Deprivation (IMD) for each landlord. Constructed by the Social Housing Regulator on the basis of lettings per Lower Super Output Area (LSOA) (from CORE data) and the percentile rank from the 2015 IMD for each LSOA. Where data does not exist, the median value is imputed. | SDR17, CORE 2016, IMD 2015 |
Annex C – VfM metrics and measurements, FVA 2018
VfM metrics and measurements, FVA 2018
FVA 2018 - Value codes: Negative (-), Positive (+), Either (- OR +)
1) Reinvestment %
[Development of new properties (Total housing properties)
+Newly built properties acquired (Total housing properties)
+Works to Existing (Total housing properties)
+Capitalised Interest (Total housing properties)
+Schemes completed (Total housing properties)] (- OR +)
Divided by
[Tangible fixed assets: Housing properties at cost (Current period) / Tangible fixed assets Housing properties at valuation (Current period)]
2) New supply delivered % (social housing and non-social housing)
A) New supply delivered (Social housing units)%
[Total social units developed or newly built units acquired in-year (owned)
(Social rent general needs housing (excluding AR), AR general needs housing, social rent SH and HOP (excluding AR), AR SH and HOP, Low Cost Home Ownership, care homes
+social leasehold units owned)]
Divided by
[Total social housing units owned (Period end)
+social leasehold units owned (Period end)]
B) New supply delivered (Non-social housing units)%
[Total non-social housing units developed or newly built units acquired (owned)
(Total non-social rental housing units owned
+non-social leasehold units owned
+New outright sale units developed or acquired)]
Divided by
[Total social and non-social housing units owned (Period end)
Total social housing units owned (Period end)
+Total non-social rental housing units owned (Period end)
+Social leasehold units owned (Period end)
+Non-social leasehold units owned (Period end)]
3) Gearing %
[Short term loans
+Long term loans
-Cash and cash equivalents
+Amounts owed to group undertakings
+Finance lease obligations]
Divided by
[Tangible fixed assets: Housing properties at cost ( Current period) / Tangible fixed assets: Housing properties at valuation (Current period)]
4) EBITDA MRI Interest Cover %
[Operating surplus/(deficit) (overall)
-Gain/(loss) on disposal of fixed assets (housing properties) (- OR +)
-Amortised government grant
-Government grants taken to income
+Interest receivable
-Capitalised major repairs expenditure for period
+Total depreciation charge for period]
Divided by
[Interest capitalised +Interest payable and financing costs] (-)
5) Headline Social Housing Cost per unit £’000
[Management costs
+Service charge costs
+Routine maintenance costs
+Planned maintenance costs
+Major repairs expenditure
+Capitalised major repairs expenditure for period
+Other (social housing letting) costs
+Development services
+Community/neighbourhood services
+Other social housing activities: Other
+Other social housing activities: charges for support services]
Divided by
Total social housing units owned and/or managed at period end
6) Operating Margin %
A) Operating Margin (social housing lettings)%
[Operating surplus/(deficit) (social housing lettings) (- OR +)
Divided by
Turnover from social housing lettings]
B) Operating Margin (overall)%
[Operating surplus/(deficit) (overall)
-Gain/(loss) on disposal of fixed assets (housing properties)] (- OR +)
Divided by
Turnover (overall)]
7) Return on capital employed %
[Operating surplus/(deficit) (overall)
( including gain/(loss) disposal fixed assets)
+Share of operating surplus/(deficit) in joint ventures or associates] (- OR +)
Divided by
Total assets less current liabilities
Annex D – Breaks in the time series
The accounts published in 2016 were the first where all registered providers reported under the new Standard and SORP (Statement of Recommended Practice) 2014. The most significant difference is the treatment of grant. Grant was previously ‘netted off’ the value of the housing properties to which it relates in fixed assets. Under FRS102, grant is now disclosed as a creditor. FRS102 also introduces changes to the valuation of housing properties and the measurement of debt in the financial statements.
The metrics set out by the regulator in 2018 are consistent with these reporting requirements, but historic data is not always available on this basis. This means that we may not have collected the data required to calculate the regulator’s metrics in one or more years. Any breaks in the time series are outlined below (Table 7.)
Table 7: Breaks in the time series
(Key: Green - data available, Red - data unavailable, Amber - some omissions)
| 2016 | 2015 | |
| Reinvestment % | (Green) | Data not available for the following Additions: Properties acquired, Development of new properties, Works to existing properties, Capitalised interest, and Schemes completed. (Red) |
| New supply (social) % | (Green) | (Green) |
| New supply (non-social) % | Data not available for number of non-social units acquired or developed in 2017 (Red) | Data not available for number of non-social units acquired or developed in 2017 (Red) |
| Gearing % | (Green) | Denominator only inclusive of: Tangible fixed assets: Housing properties at cost and Housing properties at valuation. No data on Tangible fixed assets: Housing properties at Deemed Cost. (Amber) |
| EBITDA MRI interest rate cover % | Denominator is inclusive of Capitalised Interest for period(£000) instead of: Interest Payable and Financing Cost - Interest capitalised in housing properties (Amber) | No data on: Amortised |
| Government Grant Current Total or Government Grant taken to income_-_Current Total. Denominator is inclusive of Capitalised Interest for period(£000) instead of: Interest Payable and Financing Cost - Interest capitalised in housing properties (Amber) | ||
| Headline Social Housing Cost (£’000) | Other social housing costs were not split out in the same way as in 2017 - does not include data on Development Services (Operating Expenditure) or Community/neighbourhood services (Operating Expenditure). (Amber) | Other social housing costs were not split out in the same way as in 2017 |
| - does not include data on Development Services (Operating Expenditure) or Community/neighbourhood services (Operating Expenditure). (Amber) | ||
| Operating Margin (SHL) % | (Green) | (Green) |
| Operating Margin (overall)% | (Green) | (Green) |
| ROCE % | (Green) | No data available for Share of operating surplus / (deficit) in joint ventures or associates. (Red) |
© RSH copyright 2020
This publication is licensed under the terms of the Open Government Licence v3.0 except where otherwise stated. Where we have identified any third party copyright information you will need to obtain permission from the copyright holders concerned.
Any enquiries regarding this publication should be sent via enquiries@rsh.gov.uk or call 0300 124 5225 or write to:
Regulator of Social Housing
Level 2
7-8 Wellington Place
Leeds
LS1 4AP