Understanding the gender pay gap in the UK: Drivers and barriers, evidence from UKLHS 2009 to 2023
Published 14 July 2026

© Crown copyright 2026
This publication is licensed under the terms of the Open Government Licence v3.0 except where otherwise stated. To view this licence, visit nationalarchives.gov.uk/doc/open-government-licence/version/3 or write to the Information Policy Team, The National Archives, Kew, London TW9 4DU, or email: psi@nationalarchives.gov.uk.
Where we have identified any third party copyright information you will need to obtain permission from the copyright holders concerned.
This publication is available at https://www.gov.uk/government/publications/understanding-the-gender-pay-gap-in-the-uk/understanding-the-gender-pay-gap-in-the-uk-drivers-and-barriers-evidence-from-uklhs-2009-to-2023
Understanding the gender pay gap in the UK: Drivers and barriers, evidence from UKLHS 2009 to 2023
Report for the Cabinet Office
National Institute of Economic and Social Research
Anisa Butt, Edoardo Masset, Eliza da Silva Gomes, Larissa Marioni, Tibor Szendrei
April 2026
Executive summary
This report examines the gender pay gap (GPG) in the UK between 2009 and 2023. The GPG is defined as the percentage difference in pay between men and women.
The analysis uses data from the Understanding Society UK Household Longitudinal Study (UKHLS), a large, nationally representative longitudinal survey covering the period from 2009 to 2023. We estimate the level of the GPG and how it has changed over time. We examine the main factors associated with the gap and assess how their contribution has evolved over time. We also analyse differences in the GPG between low-paid and high-paid workers. Finally, we investigate how the GPG can be reduced by targeting the main drivers identified by our analysis.
Main findings
We estimate the GPG among all employees to be around 16% in recent years. The UK GPG is slightly above the OECD (Organisation for Economic Co-operation and Development) average and lower than that observed in countries such as Germany and Canada.
We find little evidence of a reduction of the GPG in recent years. Over the last 10 years the GPG has remained broadly stable. It declined slightly between 2009 and 2016 and then levelled off thereafter.
Around 30% of the GPG is explained by differences in occupations and industry. Women are disproportionally employed in low-pay industries (such as hospitality), and occupations (such as care and administration). Men are more likely to be employed in managerial and professional roles.
A further 20% of the GPG is explained by differences in work history. On average, across our entire sample, women employees have 1 to 2 fewer years of accumulated work than men. Women are more likely to take time out of paid work and to work part-time, mainly because of caring responsibilities. These factors reduce opportunities for career progression and pay growth.
Around 50% of the GPG remains unexplained by the factors included in our model.[footnote 1] This implies that even if occupational and industrial allocation, and caring responsibilities were equalised between men and women, a substantial pay gap would remain. The unexplained component may reflect factors such as differences between men and women in which fields they choose to study, workplace practices, social norms, and institutional arrangements that negatively affect women’s position in labour markets.
Some important factors do not appear to contribute to the GPG, while others play a protective role. Place of residence, including region and urban or rural location, does not explain the gap. Ethnicity also does not account for differences in pay between men and women. Education reduces the gap as it is associated with higher pay and women are now, on average, more highly educated than men.
Our analysis of trends over time shows limited change in the drivers of the GPG over the past 15 years. The occupational segregation between men and women has remained approximately stable. Similarly, the amount of time women spend out of paid work because of caring responsibilities has changed little. As a result, the relative contribution of the main observed drivers of the GPG has remained broadly stable, and the GPG itself has changed only slightly.
The GPG is largest among moderately and highly paid workers. We find that, for the top 30% of earners, the gap is less strongly associated with occupation or work experience and more strongly associated with factors that are not directly observed in the data. This pattern is commonly described as a “glass ceiling” effect, referring to invisible barriers that limit women’s progression into the highest-paid roles. These barriers may include informal workplace practices and discrimination.
We conducted a review of evidence to provide a discussion of the UK gender pay gap and the policies that may influence it. Based on this, we conclude that the following actions may help address the causes of the pay gaps identified in our analysis. Given the limited scope of our review of the existing literature and practice, the following list of recommendations is not exhaustive and should be viewed as indicative of potential actions:
- equal pay legislation[footnote 2] could be implemented more rigorously, through more transparent pay structures and promotion processes
- affordable, high-quality childcare could be expanded, and Shared Parental Leave (SPL) could be reformed with higher pay and longer, flexible leave for partners to support continuous maternal employment and shared caregiving
- women’s access to senior roles could be promoted through structured career pathways, mentoring and sponsorship programs
- high-quality part-time and flexible roles could be embedded in career-advancing positions to prevent flexibility from limiting pay, status, or long-term progression – this may be supported by measuring performance on output rather than hours, providing mentoring and structured career development, and ensuring equal access to training, development and high-impact projects
1. Introduction
This report analyses the main factors driving the gender pay gap (GPG) in the UK between 2009 and 2023 using data from Understanding Society: the UK Household Longitudinal Study (UKLHS). Despite sustained policy attention and progress in women’s educational attainment and labour market participation, the GPG remains a persistent feature of the UK labour market. Understanding why this gap endures, and how its drivers have changed over time, is central to the design of effective and targeted policy interventions.
The objective of this research is to provide an up-to-date and detailed assessment of the drivers of the GPG in the UK. In particular, the study aims to identify the relative importance of labour market experience, occupational segregation, education, and industry factors in shaping pay differences between men and women, and to examine how these factors have evolved over time. Labour market experience plays an important role in explaining gender pay differentials. We therefore examine differences in accumulated full-time experience across gender and parental status over time. In addition, we conceptualise the motherhood penalty as a mechanism creating differences in overall work experience, through reduced full-time employment among mothers relative to fathers and people with no children.
A further aim, which adds to previous studies of the GPG, is to assess whether its underlying drivers differ between lower-paid and higher-paid workers, recognising that gender inequalities may operate differently at the bottom and at the top of the pay distribution.
The analysis builds on and updates earlier work in this area, including previous studies using British Household Panel Survey (BHPS) and UKHLS data (Olsen and others, 2010 and 2018). It does this by:
- extending the period of analysis through to 2023
- examining patterns across the full range of earnings, rather than solely focusing on the average earnings
This allows us to capture recent changes in the labour market and to assess whether progress in narrowing the GPG has been sustained.
To achieve these aims, we draw on UKHLS data, a large-scale panel survey representative of the UK population that has followed individuals and households annually since 2009. UKHLS interviews all members of selected households on a wide range of social, economic, and behavioural topics. Beginning in 2009, the study has now collected 14 waves of adult response data (2009 to 2023). The UKHLS offers advantages for studying the GPG. Its nationally representative sample and its breadth of content provide detailed measures of earnings, employment history, and educational outcomes. By modelling the factors associated with men’s and women’s pay, we identify the main contributors to pay differences and assess how their importance varies across the pay distribution.
In addition to the quantitative analysis, the report draws on existing literature to corroborate the findings, to understand how the drivers of the GPG have changed over time, and to explore what policies have been suggested to address the GPG.
2. Data and methodology
This analysis uses data from the UKLHS covering the period 2009 to 2023. The UKLHS is a nationally representative survey of individuals and households, with information on labour market histories and pay.
Although the UKLHS data is organised into waves spanning 2 to 3 years, we organise the data by calendar year to better analyse time trends.
The UKHLS data include approximately 38,000 individual observations per year. We restrict our analysis to individuals of working age (16 to 64 years old) who are employed, thus excluding the self-employed. After applying these restrictions, the sample consists of about 17,000 individuals per year.
The years at the beginning and at the end of the period considered rely on a smaller number of observations. This is because each UKHLS wave runs over a period of 3 years, in such a way that the years at the tails have fewer observations. This implies that estimations of the pay gap and other variables at the tails of the period (years 2009 and 2023 in particular) are less precisely estimated.
All results are weighted using the survey weights provided with the data to correct for non-response and to ensure that the findings are representative of the UK population. Further technical details on weighting and sample construction are provided in Appendix A.1.1.
2.1 Pay measure
We measure pay by calculating gross hourly wages in respondents’ main job. Hourly pay is calculated from reported monthly earnings and usual weekly working hours. Extreme or implausible values are excluded to reduce measurement error. Weights are used for all estimations and charts in the report (see Appendix A.1.2. for detailed understanding of the survey weights used).
We present 2 estimates of the GPG:
- the unconditional GPG
- the conditional GPG
The unconditional GPG is the percentage difference in average hourly pay between men and women. This is estimated using a logarithmic regression model as explained in Appendix A.1.2.
A substantial share of the observed pay difference between men and women reflects differences in characteristics. For example, women are more likely to work part-time, and to be employed in occupations such as education and care, which tend to be lower paid. For this reason, it is important to estimate the conditional GPG, which measures the pay difference between men and women after controlling for observable characteristics.
We estimate the conditional gender pay gap using a regression model of the logarithm of wages on a set of control variables which represent individual characteristics. Details of the methodology are presented in Appendix A.2.
2.2 Key explanatory factors
To examine the determinants of the GPG and its evolution over time, we consider a range of factors commonly used in the literature (see for example the extensive review of the literature on the GPG by Blau and others (2017)). The factors are summarised in Table 1, with a brief description of how they were constructed. They are grouped into human capital factors (such as education and years of work experience), institutional factors (such as occupation and industry of employment), and demographic factors (such as geographical residence and ethnicity). A more detailed description of the variables, including the names of the survey variables used in their construction, is provided in Appendix A.1.5.
Table 1 Variables explaining the GPG included in the analysis
| Explanatory variable | Description |
|---|---|
| Human capital factors | |
| Years of education | Continuous variable derived from respondent’s highest qualification and recorded as years of education (no qualifications=9, other=10, GCSE=11, A-level=13, degree=16, higher degree=19). |
| Full-time experience | Continuous: total cumulative reported number of months spent in full-time employment at the time of the interview, obtained from work history interviews. |
| Part-time experience | Continuous: total cumulative reported number of months spent in part-time employment at the time of the interview, obtained from work history interviews. |
| Institutional factors | |
| Occupation | Binary variables for different job types using SOC 2000 1-digit codes. Major occupational groups include: managers, professionals, associate professionals and technicians, administrative and secretarial, skilled trades, caring and leisure and other services, sales and customer services, process/plant/machine operatives, and elementary occupations. |
| Industry | Binary variables for the sector of employment based on SIC codes. Groups include: Primary industries, Energy and Water, Primary manufacturing, Manufacturing, Construction, Hotel and catering, Transport and Communications, Banking and financial services, other services. |
| Union membership | Binary variable for reported union membership. |
| Part time worker | Binary variable for part-time employment defined as a job with less or equal to 30 hours per week. |
| Private sector | Binary variable for employment in the private sector, to the exclusion of the public sector, charities, and other sectors. |
| Firm size | Binary variables for employment in firms of different size: micro (under 25 employees), small (25 to 49), medium (50 to 499), and large (500 and above). |
| Overtime | Binary variable for workers who reported any overtime hour in a normal working week. |
| Demographic factors | |
| Female | Binary indicator for self-reported sex. |
| Ethnicity | Binary variables derived from self-reported ethnicity. Includes: White Irish, Indian, Pakistani, Bangladeshi, Chinese, other Asian, Black, Mixed, and other. |
| Urban | Binary variable for urban versus rural residence based on ONS classification (urban is an area with over ~10,000 people). |
| Years of caregiving | Continuous: cumulative number of years spent in caregiving responsibilities (example caring for family members), obtained from work life histories. |
| Years of maternity leave | Continuous: total cumulative number of maternity leave or related breaks from work. |
| Years of unemployment | Continuous: cumulative duration of all unemployment spells. |
| Years of sickness | Continuous: total cumulative number of years spent on sick leave or out of work due to health reasons. |
2.3 Decomposition methodology
The goal of our study is to identify the main drivers of the GPG and their evolution over time through a decomposition analysis. To achieve this task:
-
We estimate the conditional GPG for each calendar year. This consists of a regression model of the logarithm of wages on an indicator for whether the worker is male or female and a set of explanatory variables
-
We calculate from the output of the regression model the percentage of the GPG that is explained by each variable (such as education or work experience) and by the indicator for whether the worker is male or female. The female indicator captures all factors affecting the GPG that are not included in the model and that are associated with sex. These may reflect, for example, preferences, stereotyping or task-discrimination in the workplace.
-
We observe the evolution over time on the proportions of the GPG explained by each component and we present the results with the use of charts and summary tables.
-
Finally, we repeat the entire analysis at different levels of the pay distribution to assess whether the drivers of the gap differ for low-pay and highly paid jobs. In the distributional analysis we differentiate a “composition effect”, reflecting differences in factors associated with pay, such as experience, education, and occupation, from a “pay structure effect” reflecting how much those factors are rewarded. The latter captures the extent to which men and women are rewarded differently for similar skills and jobs and incorporates unobserved factors such as behavioural differences, stereotyping and social norms.
Further technical details on the models and estimation methods are provided in Appendix A.2.
2.4 Research discussion
In addition to the quantitative analysis, the study draws on a review of the existing literature on the GPG in the UK and internationally to assess to what extent the findings are reflected in wider research. This includes academic research and policy reports examining the causes of pay inequality and trends over time.
2.5 Limitations
We highlight here the main methodological limitations of the study. First, the UKHLS data rely on self-reported pay, which is subject to measurement error. This may affect both the direction and the precision of the estimates. Second, we limit the analysis to people in paid employment because it is difficult to calculate a wage-equivalent income for the self-employed. This means that a large and important part of the workforce is not included in the analysis. Third, data coverage is not uniform across all years and estimates for the earliest and latest years of the period analysed are less precise. Fourth, not all factors relevant to explaining the GPG are captured in the UKHLS data. For example, while the data include information on educational attainment, they do not record the type or field of study, which may be important to understand differences in pay.
Other limitations relate to the methodological approach. First, the analysis does not account for selective participation in the labour market. Fewer women are employed than men: according to Labour Force Survey data, in 2025 the female employment rate was 72.4% compared with 77.6% for men (Francis-Devine and others, 2026). Women’s lower participation reflects a range of factors, including children and caring responsibilities, the availability of childcare, and trade-offs between full-time and part-time work (Andrew and others, 2024). In contrast, men’s participation is mainly driven by factors such as age, health status, education, and skills. Our pay gap estimates are based only on individuals who are in employment and were offered a job. Accounting for selection into employment might produce different estimates. For example, if women in employment have higher unobserved ability or stronger career motivation than average, the observed pay gap may understate the true gap because it compares a positively selected group of women to average men.
Second, we conduct limited robustness analysis. We estimated the same econometric model using alternative specifications and sets of explanatory variables. However, we did not compare alternative decomposition methods such as the Oaxaca-Blinder approach.
Third, we specify the model following the existing GPG literature with the objective of including all policy relevant variables. However, at closer inspection, some regressors may be “bad” control variables in the sense that they may themselves be outcomes (Cinelli and others, 2024). For example, the model includes both part-time work and years of caregiving. Although the regressions estimate the impact of caregiving holding part-time status constant, part-time employment may itself be influenced by caregiving responsibilities. Including “bad” controls can generate spurious correlations or bias the estimated coefficients. Addressing this issue would require additional robustness analysis across alternative model specification and a more rigorous causal modelling of the wage determinants.
2.6 Relationship with the existing literature
Our estimation methods are similar to those employed by the Office for National Statistics (ONS) in measuring the gender pay gap, and our econometric approach broadly follows Olsen and others (2010, 2018). However, our results differ in some respects from both the ONS estimates and those reported in Olsen and others
Our yearly pay gap estimates are slightly lower than those reported by ONS for most of the period between 2009 and 2019, and slightly higher thereafter, with differences remaining within 2 percentage points in all years. These differences are largely driven by differences in data sources: ONS relies on the Annual Survey of Hours and Earnings (ASHE), whereas our analysis uses the UKHLS (see Appendix A.1.6 for a comparison and a discussion of the differences between our estimates and those by ONS). Both datasets have distinct strengths and limitations, and neither can be considered superior without reference to the goals of the analysis. Our primary objective is to examine the determinants of the pay gap, for which the UKHLS is particularly well suited due to its rich information on individual and household characteristics. By contrast, ASHE lacks this level of detail and cannot be used to carry out a decomposition analysis.
Differences between our results and those reported by Olsen and others (2010, 2018) reflect both the use of different data and modelling choices. The main difference between the results is the estimated size of the unexplained component of the pay gap. For the period from 2009 to 2023, we estimate that 54% of the gap is unexplained, declining from 64% in 2009 to 49% in 2023. These estimates are higher than the 36% reported by Olsen and others (2010 and 2018). There are several reasons for this difference.
First, the 36% figure in Olsen and others is based on wave Q of the BHPS data (2007), while our analysis uses the UKHLS data from 2009 to 2023. A more recent study by Olsen and others (2025), using wave 7 of UKHLS (2015 to 2016), estimates an unexplained gap of 43%, which is closer to our results. Second, the 36% figure is based on a preferred model specification, while alternative models estimated by Olsen and others yield a wider range of results.[footnote 3] Third, our studies differ in how work history is constructed, with alternative ways of measuring career breaks, employment and caring activities, which are important determinants of the pay gap. In our analysis, we use the method developed by Wright (2020), which differs from Olsen’s approach.
Overall, the discrepancy between our results and those of Olsen and others largely reflect differences in data, model specification, variable definitions, and especially the measurement of work history, underscoring how sensitive such estimates are to methodological choices.
3. Results
Our results suggest that the GPG has remained broadly stable since 2017, with women earning approximately 16% less than men. This is mostly caused by the persistence of observed differences between men and women — especially full-time work experience, occupations and industry of employment — and of the unobserved component, which could entail for instance behavioural differences, stereotyping and social norms.
Years of education act as a protective factor, contributing to reducing the GPG by almost 5%, as women are on average more highly educated than men. Nonetheless, our distributional analysis (Section 4) points out that women are less remunerated than men for the same educational level. This might be a result from differences in degree areas — for instance men are more likely than women to graduate in STEM subjects (science, technology, engineering and maths), which tend to be better paid — or be caused by other unobserved factors.
Despite being more educated, women work part-time more often than men. Less than 10% of men work part-time throughout the analysed period, while over 30% of women work part-time. As a result, over their lifetime, men accumulate on average 5 more years of work experience than women. We find that this difference drives almost 19% of the GPG, highlighting the importance of flexible working ( further discussed in Section 5).
Our analysis also finds discrepancies in occupation sorting between men and women, which show little change over 2009 to 2023. Men are more likely to be employed in the highest paid occupations (managers and professionals) than women. This difference stands out for managerial roles, which men are approximately 7 percentage points more likely to occupy. This could be a symptom of women’s shorter full-time work experience, which results in fewer promotion opportunities, as also discussed in Section 5. Our distributional analysis (Section 4) further points out that the negative effect of occupation on the GPG is mostly compositional rather than structural, that is, women earn less because of differences in job roles, not because they receive less for the same role.
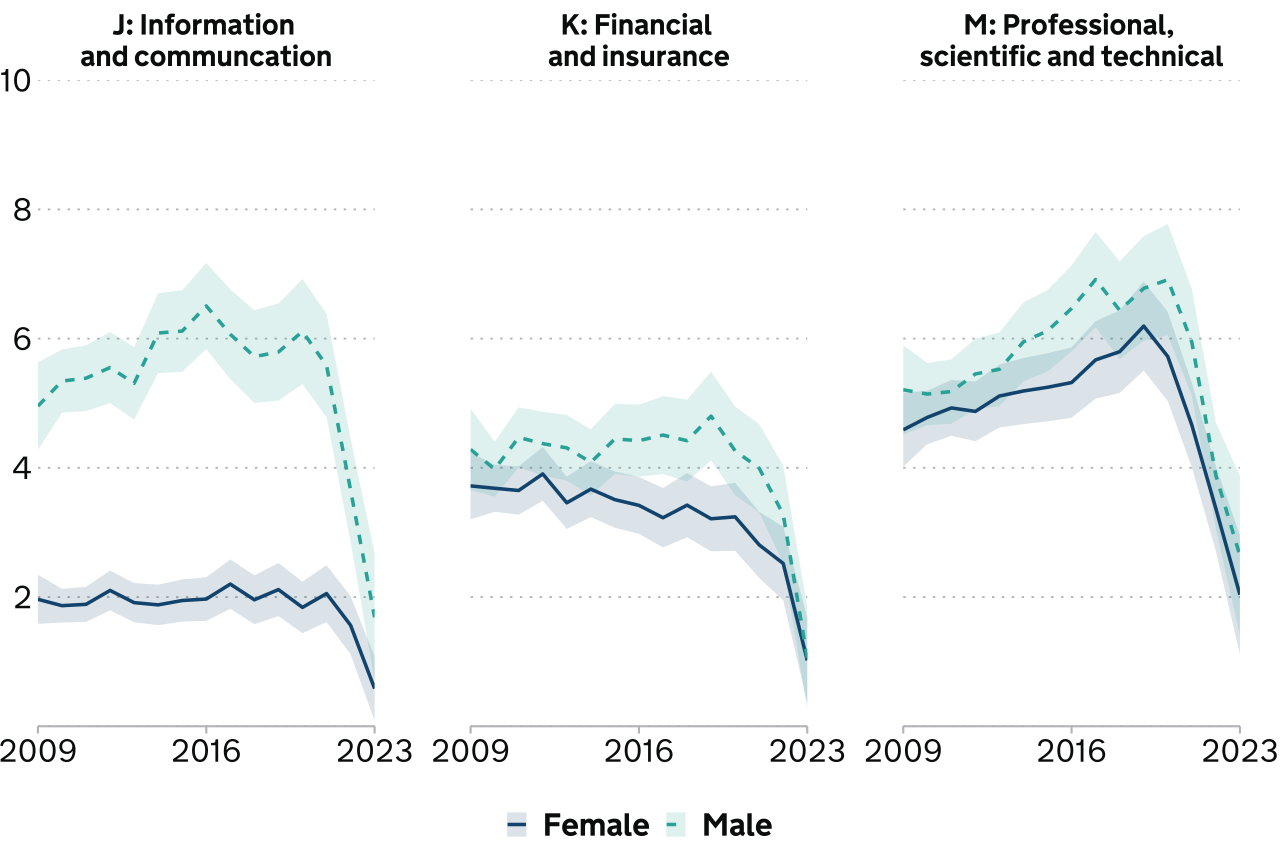
Men are also more likely to be employed in the highest paid industries, in particular the information and communication sector, where 6% of men work in contrast to 2% of women.
This difference accounts for just over 9% of the GPG. Our distributional analysis in Section 4 shows that the compositional effect of industry on the GPG is mostly present for earners below median pay. This reflects the fact that women are more likely to work in lower-paying industries (such as retail, hospitality, and social care) while men at the lower end of their pay distribution are more likely to take up employment in higher paying sectors (such as construction). Therefore, apprenticeships and other higher education courses with advertisements targeted at women could be pathways to improve female employment quality. Further discussion in our evidence review in Section 5.
Unobserved factors are the main driver of the GPG, accounting for over 50% of differences in pay. Consequently, the interventions that could have the highest impact are also those which are hardest to determine. These unobserved components include the differences in pay between men and women for the same characteristics (for example, same educational level) as well as differences in pay solely attributed to sex. The latter become the main driver of the GPG at wages above the 60th percentile.
3.1 Trends in the drivers of the GPG, 2009 to 2023
This section presents the overall trends in the observed main drivers of the GPG: occupation indicators, full-time experience and industry indicators. It also shows the differences in male and female work hours and pay distribution.
3.1.1 Education
Women have more years of education than men.
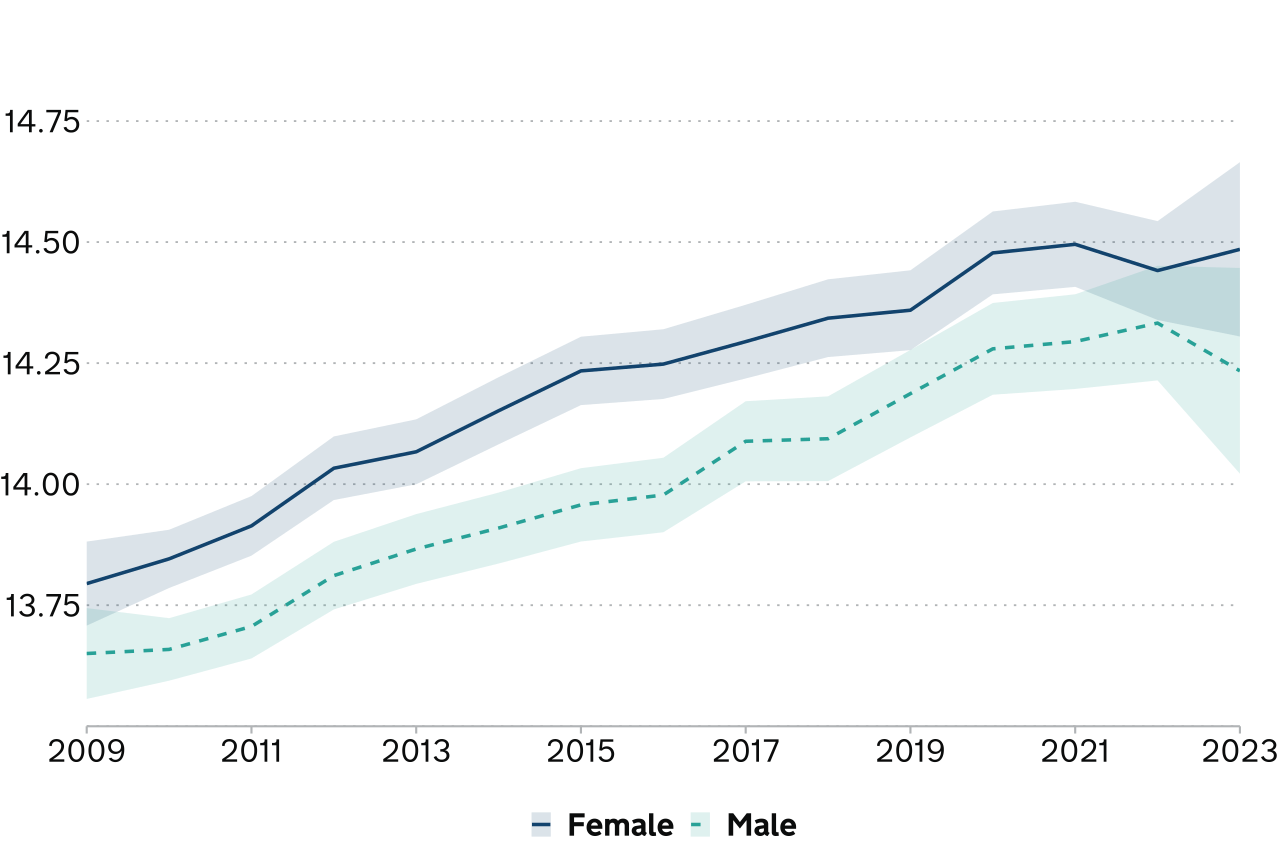
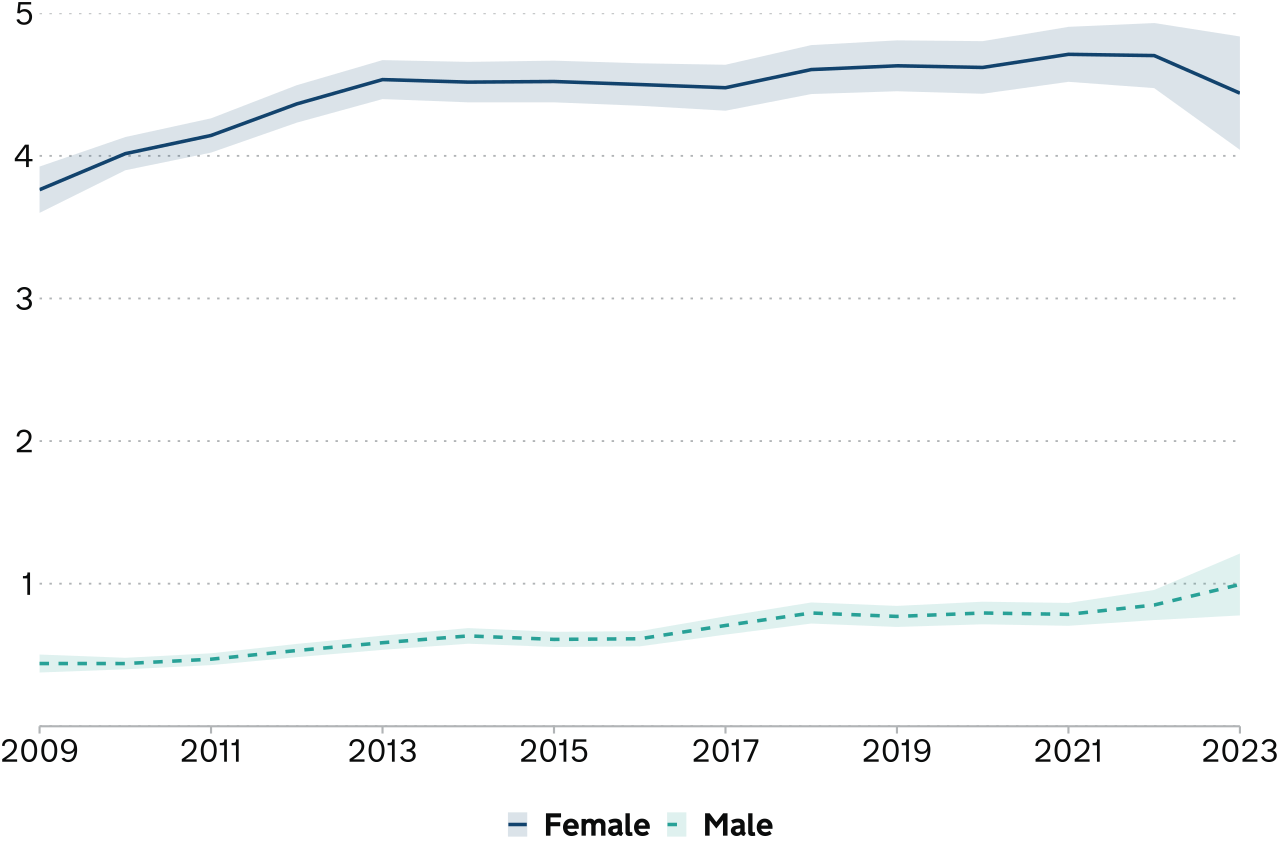
Between 2009 and 2023 the average number of years of education increased steadily for both men and women. Throughout the entire period, females had consistently higher average years of education than males (Figure 1).
Figure 1: Years of education by sex, 2009 to 2023
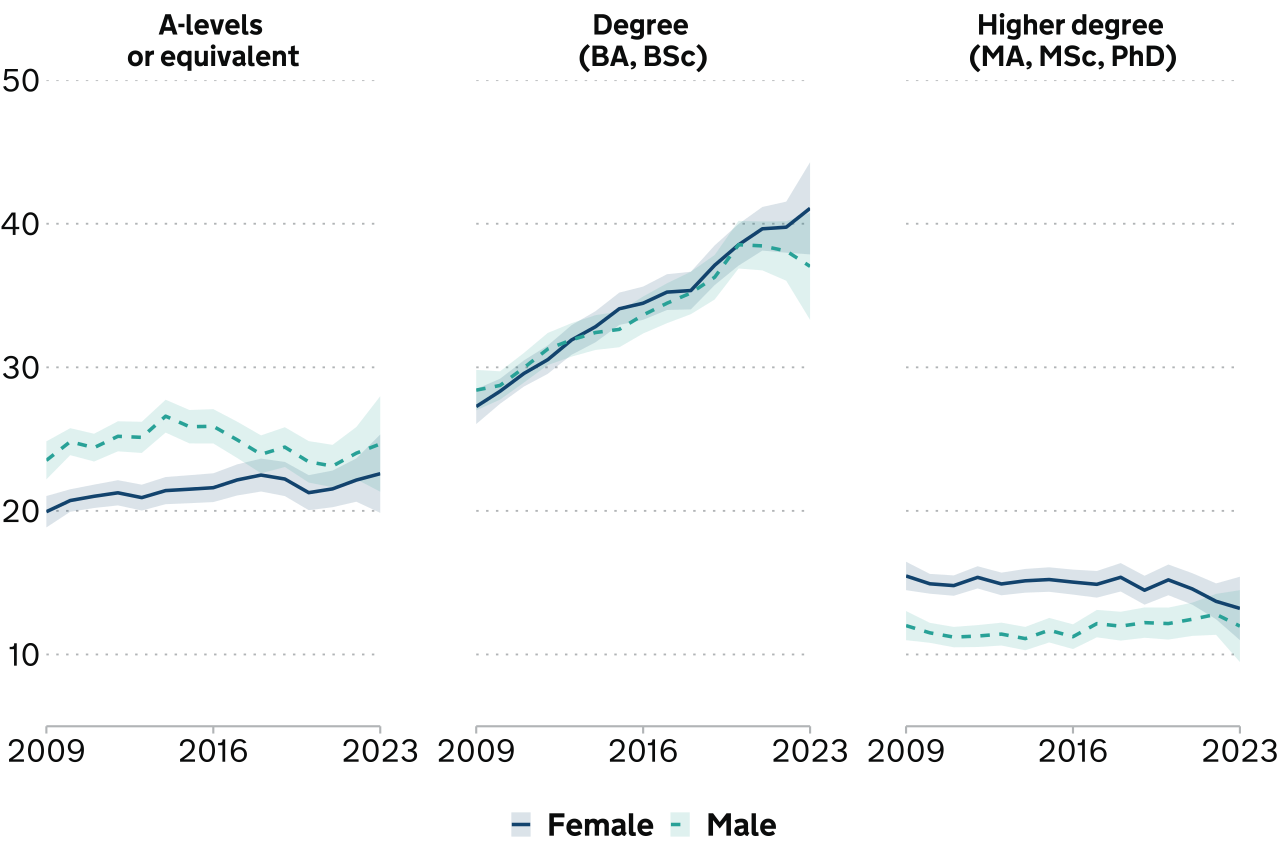
There were also differences in the type of education achieved by men and women. A higher percentage of men achieved A-levels as their highest educational attainment than women (Figure 2). For most years between 2009 and 2023, similar and increasing shares of men and women achieved a degree, but in 2021 women overtook men, with their share continuing to rise while men’s share started to decline. Finally, a higher percentage of women achieved higher degrees, such as master’s, PhDs or equivalent qualifications until 2020, when the female share started to decline, narrowing the gap.
Figure 2: Percentage of men and women at different education levels (A-Levels, degree, higher degree), 2009 to 2023
3.1.2 Working patterns
Women tend to work fewer hours than men, accumulating fewer years of full-time work.
Despite having more years of education, women tend to work for reduced hours. The percentage of part-time employment is substantially higher for women, over 30%, whereas just under 10% of men are in part-time employment (Figure 3).
Figure 3: Percentage in part-time contract by sex, 2009 to 2023
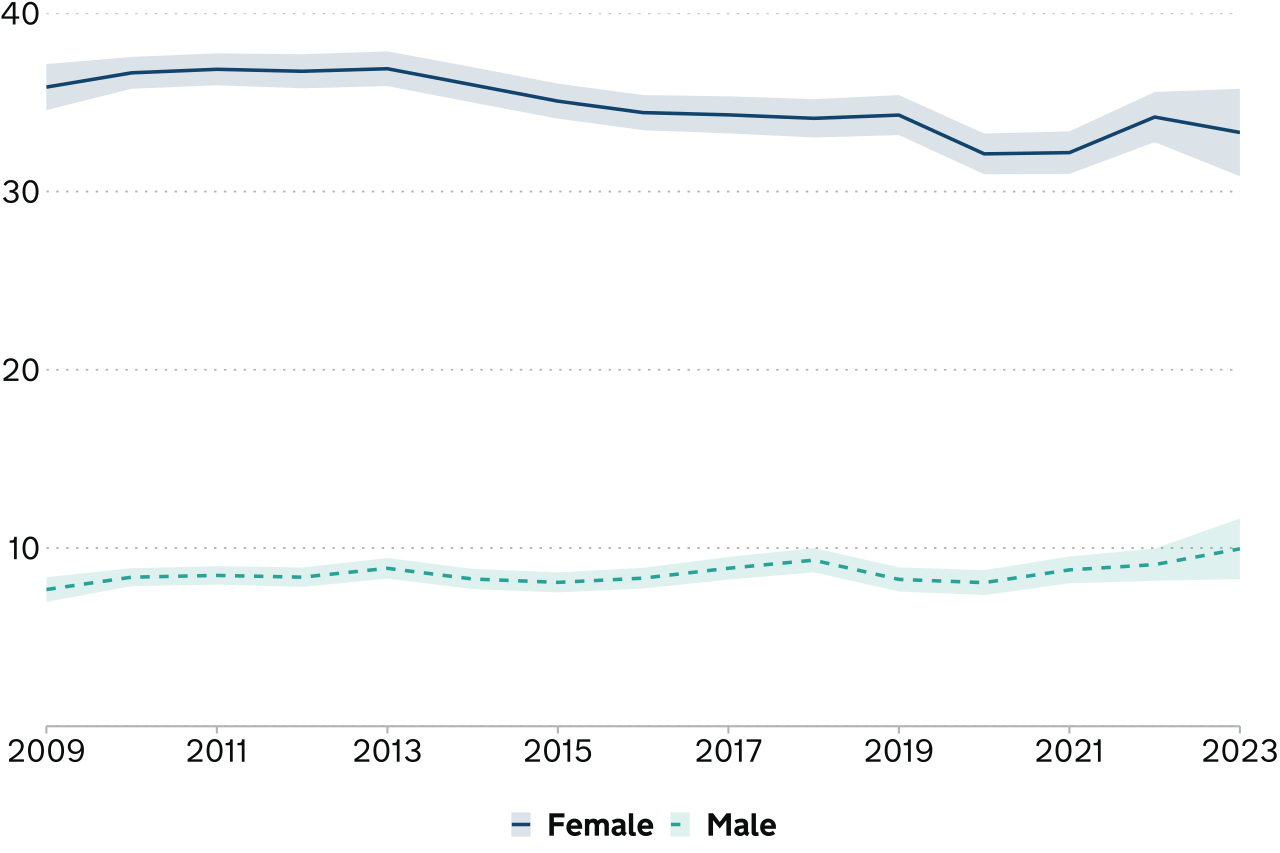
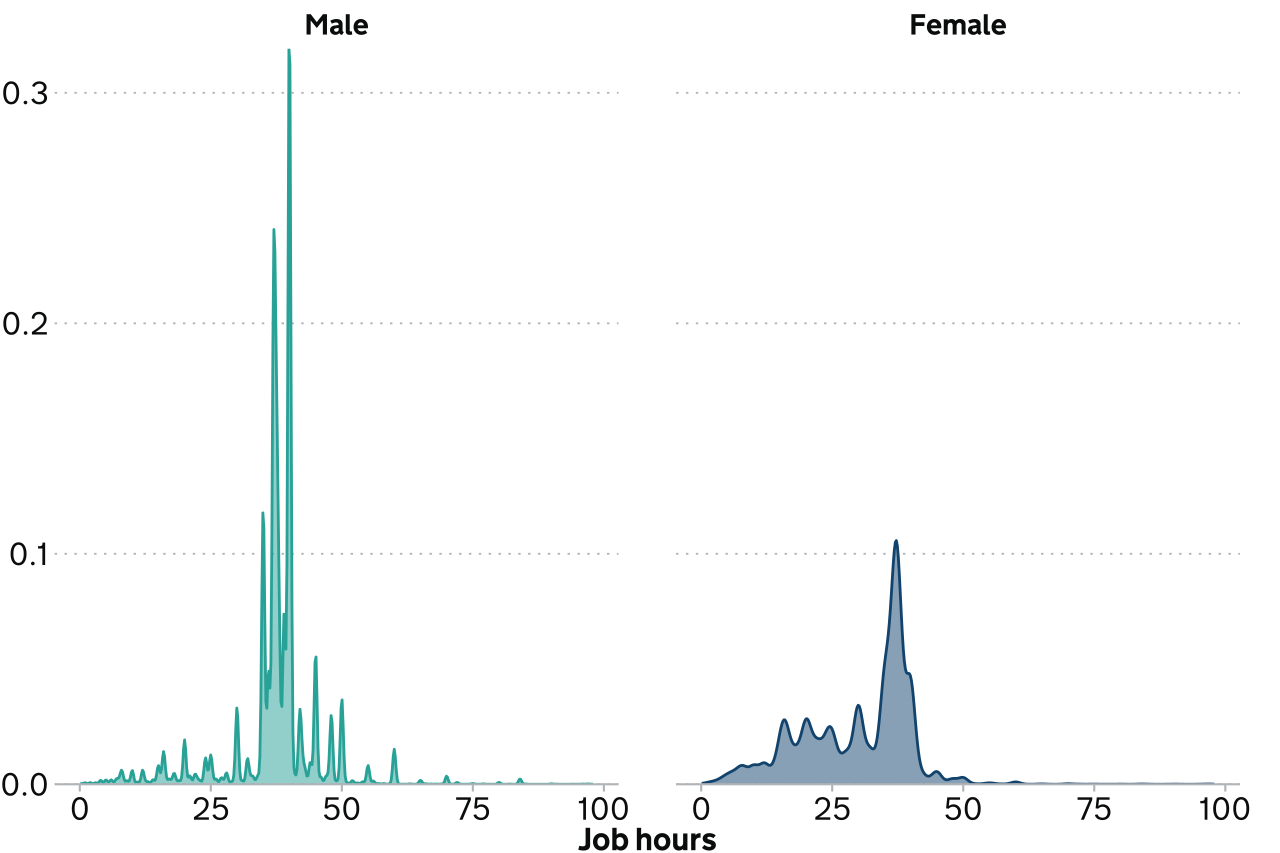
Figure 4 further emphasises the fact that women are more likely to work fewer hours and that men are more likely to hold jobs involving very long working hours. It presents the distribution of weekly hours worked by men and women. Male respondents reported an average of 40 hours per week, corresponding to standard full-time employment, with a sharp peak at 40. Female respondents display a more dispersed distribution, with a concentration around 20 to 30 hours per week, reflecting higher rates of part-time employment. The right-hand tail extends further for men, indicating a small proportion of men work long hours (over 50 hours per week), whereas this pattern is not as evident for women.
Figure 4: Distribution of weekly hours worked by men and women
These patterns result in women having over 4 years more than men in part-time work history (Figure 5).
Figure 5: Average years of part-time employment experience by sex, 2009 to 2023
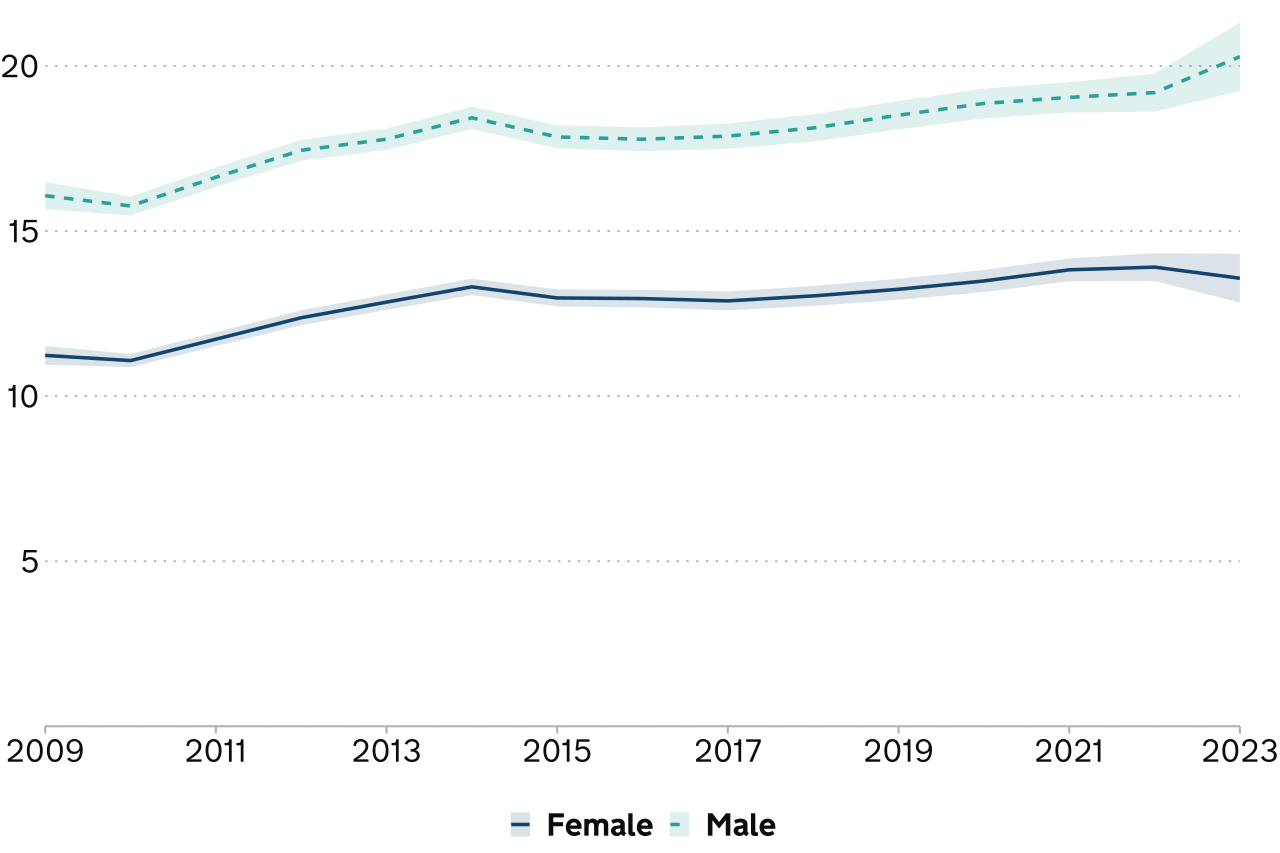
Conversely, men consistently report higher levels of full-time work experience than women (5 years on average) (Figure 6). As discussed earlier, caring responsibilities, career breaks and motherhood (the “motherhood penalty”) are largely responsible for this outcome. The overall time trend suggests a rise in employment experience over the period, although this could be driven by an increase in the average age of survey participants, which rises from under 40 to almost 44.
Figure 6: Average years of full-time employment experience by sex, 2009 to 2023
3.1.3 Occupation indicators
A lower percentage of women occupy highly paid jobs, with little change over time.
The data also show that a higher percentage of men than women tend to work in the highest paid occupations, professionals and managers (Figure 7). Overall, the gap is most pronounced in managerial positions. In professional occupations, the gender difference is smaller.
Figure 7: Distribution of managerial and professional occupations among men and women, 2009 to 2023
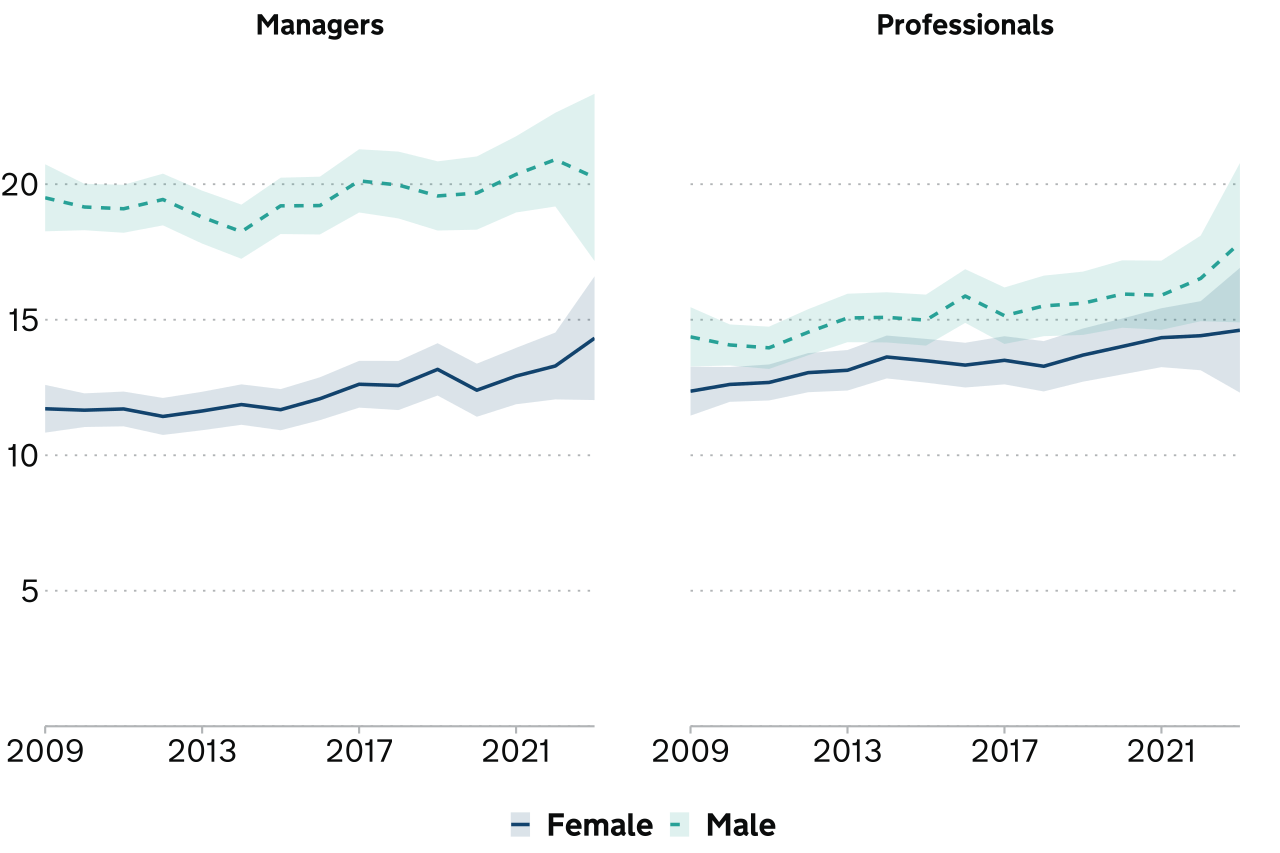
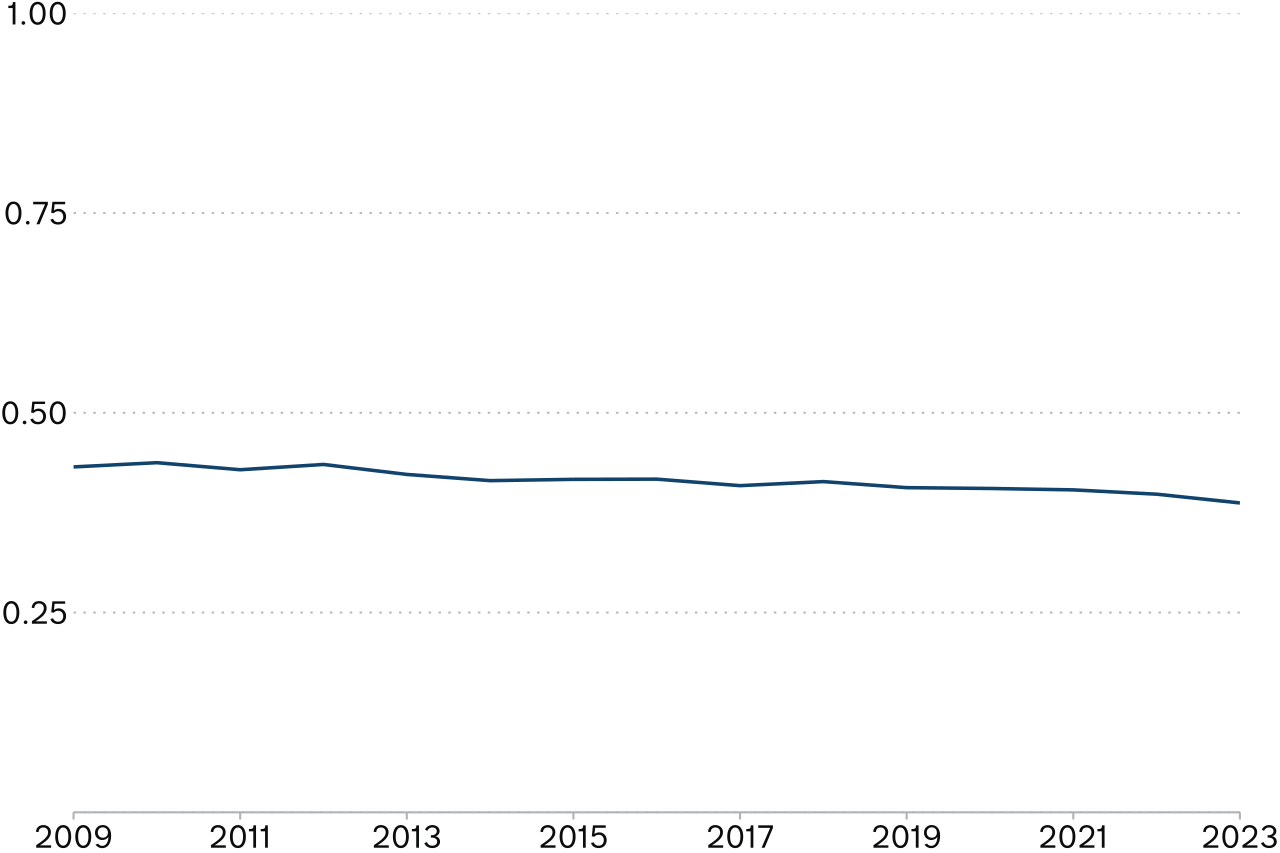
Figure 8 shows the Duncan index of dissimilarity applied to men’s and women’s occupations. Its value represents the proportion of women who would have to move occupations to equalise the gender distribution of occupations. A value of zero indicates that men and women are employed in the same occupations in equal proportions. Conversely, a value of 1 represents perfect inequality, whereby men and women are fully segregated in male and female occupations. In 2009 the index was equal to 0.43, meaning 43% of men or women would have to move occupations to reach total equality. The index declined only slightly over the period to 0.39 or 39%.
An unequal distribution of occupations among sexes can be partly attributed to personal choices. Some researchers have observed that women and men exhibit different psychological traits in surveys measuring risk attitudes and patience (Falk and Hermle, 2018; Stoet and Geary, 2018; Zuazu, 2018), and have argued that such differences are intrinsic and lead to different occupational choices (Amer-Mestre and Charpin, 2021; Stern and Madison, 2022). Under this interpretation, the relatively small change in the Duncan index over time is not unexpected: if occupational preferences are stable and rooted in persistent traits, the distribution of men and women across occupations would also be expected to be broadly stable.
However, the observed persistence in occupational segregation is equally consistent with alternative explanations. In particular, it may reflect enduring social norms and environmental influences, whereby women and men are encouraged from an early age to pursue different fields of study and career paths. Moreover, even if occupational allocations were entirely driven by individual preferences, it would still require explanation why occupations predominantly chosen by women tend to be less financially remunerated.
The stability of the index points to persisting occupational segregation that is, at least in part, the result of environmental factors. In this context, policies aimed at expanding equality of opportunity in education and career choices remain important for addressing occupational imbalances and, ultimately, the gender pay gap.
In addition, since occupations predominantly held by women tend to be systematically lower paid, this may reflect how pay is determined across sectors. For example, lower pay in female-dominated sectors may be associated with factors such as weaker collective bargaining or the absence of pay transparency rules. Addressing such systemic factors could help ensure that all occupations are rewarded more fairly.
Figure 8: Duncan index of dissimilarity between men’s and women’s occupations
3.1.4 Industry indicators
Women are less likely to work in the highest paid industries than men.
We now investigate the trends in men and women sorting across industries. We focus on the top 3 industries based on pay. Figure 9 shows that mining and quarrying, information and communication, and financial and insurance industries are the best well paid in terms of average and median wages. However, it also shows that the overall workforce share in mining and quarrying is very small. Therefore, we instead investigate male and female participation in information and communication, financial and insurance and professional, scientific and technical activities, which employ a more substantial share of the workforce.
Figure 9: Weighted mean and median hourly pay by industry (£)
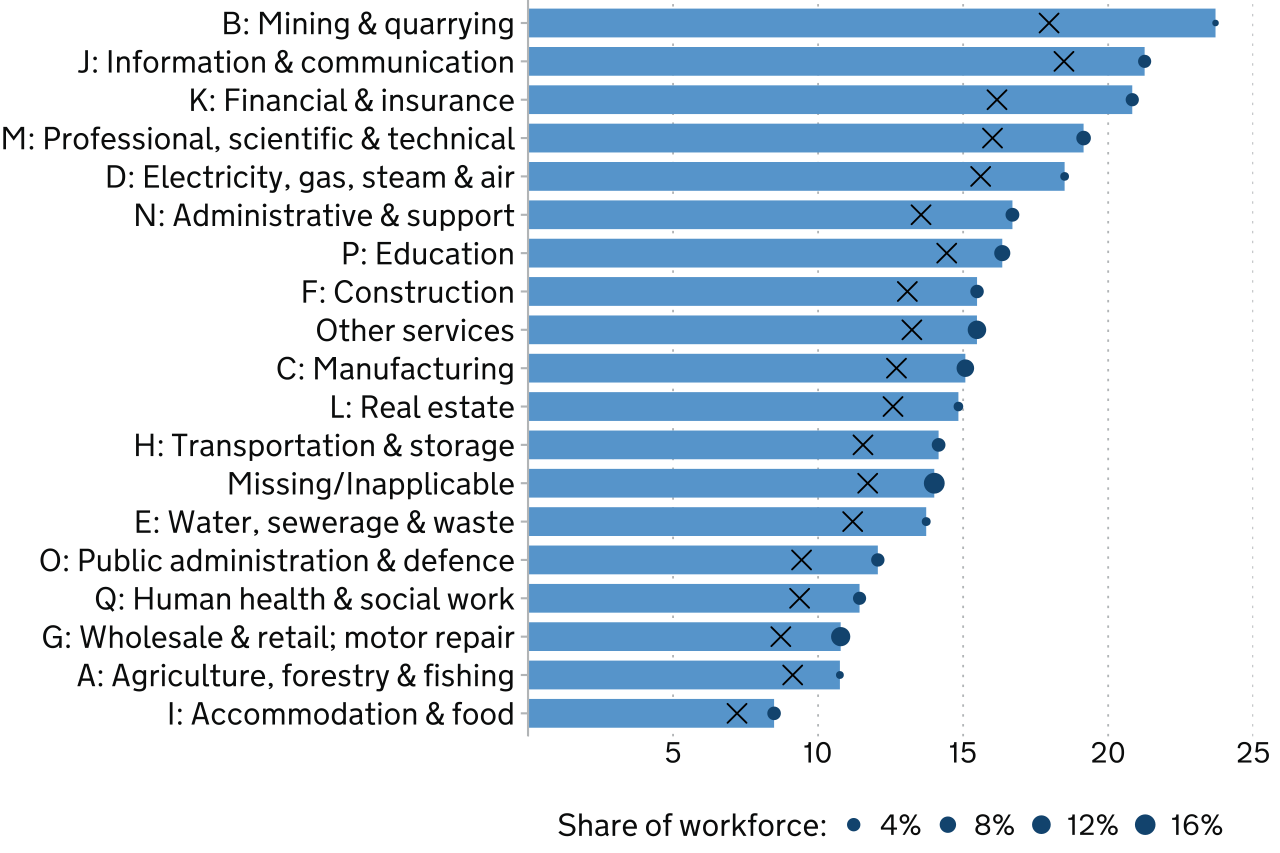
Chart notes: Bars show the weighted mean. Circles show the mean sized by workforce share. Crosses show the weighted median.
Information and communication industry presents the largest discrepancy among the 3 (Figure 10). Until 2021, men were approximately 4 percentage points more likely than women to work in this industry. Information and communication is also the industry with the highest average (excluding mining and quarrying) pay. Men are also more likely to work in the finance industry and in scientific industries, although the discrepancies are smaller and confidence intervals overlap at times, suggesting there is not always a statistically significant difference.
Data for 2021 contain a high level of missing responses and the observed decline in occupational shares across the 3 industries should be interpreted as a data artefact rather than a genuine change in the labour markets. Excluding 2021, we observe that the percentage of women in information and communication has been stable and it has been declining in financial and insurance industries, while men’s participation has been increasing. In professional, scientific and technical activities, the participation of both groups has been increasing.
Figure 10: The percentage of men and women working in highly paid industries
3.2 Evolution of the gender pay gap
The GPG slightly declined up to 2016 and was stable thereafter, but with some slight increase for the lowest and highest earners.
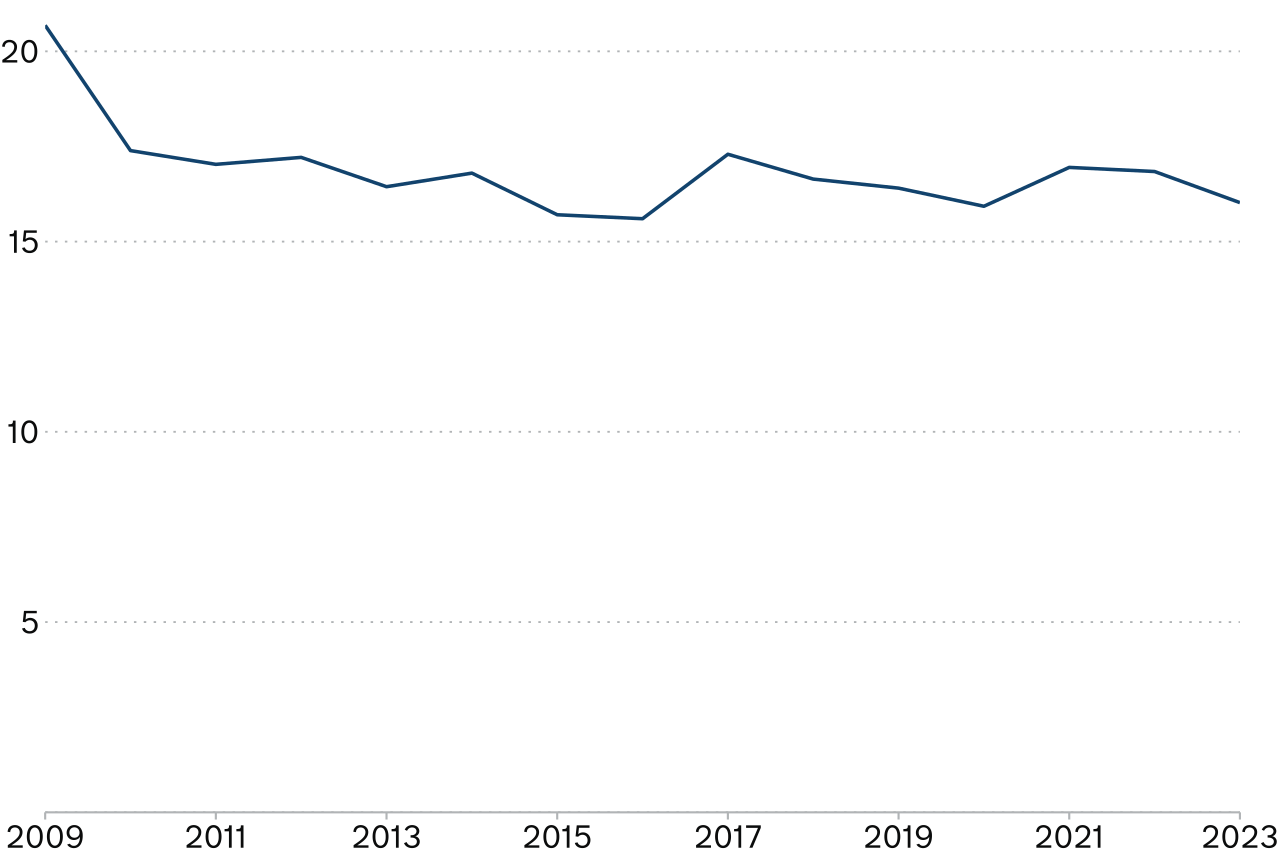
To analyse the GPG, we begin by looking at the general trend of the unconditional GPG, that is, not accounting for any differences between men’s and women’s characteristics and circumstances. Figure 11 presents the estimated GPG, expressed as the percentage difference in hourly wages between men and women for each year from 2009 to 2023. The average GPG appears to be relatively stable over the period, and only modestly decreasing. The results show that the pay gap began at over 20% in 2009 and gradually declined to around 16% by 2016. After which the gap temporarily widened, peaking around 2017 at 17.3% and then oscillating between 17% and 16% until 2023. Hence, the GPG has been approximately stable since 2017.
Figure 11: Estimated GPG, 2009 to 2023
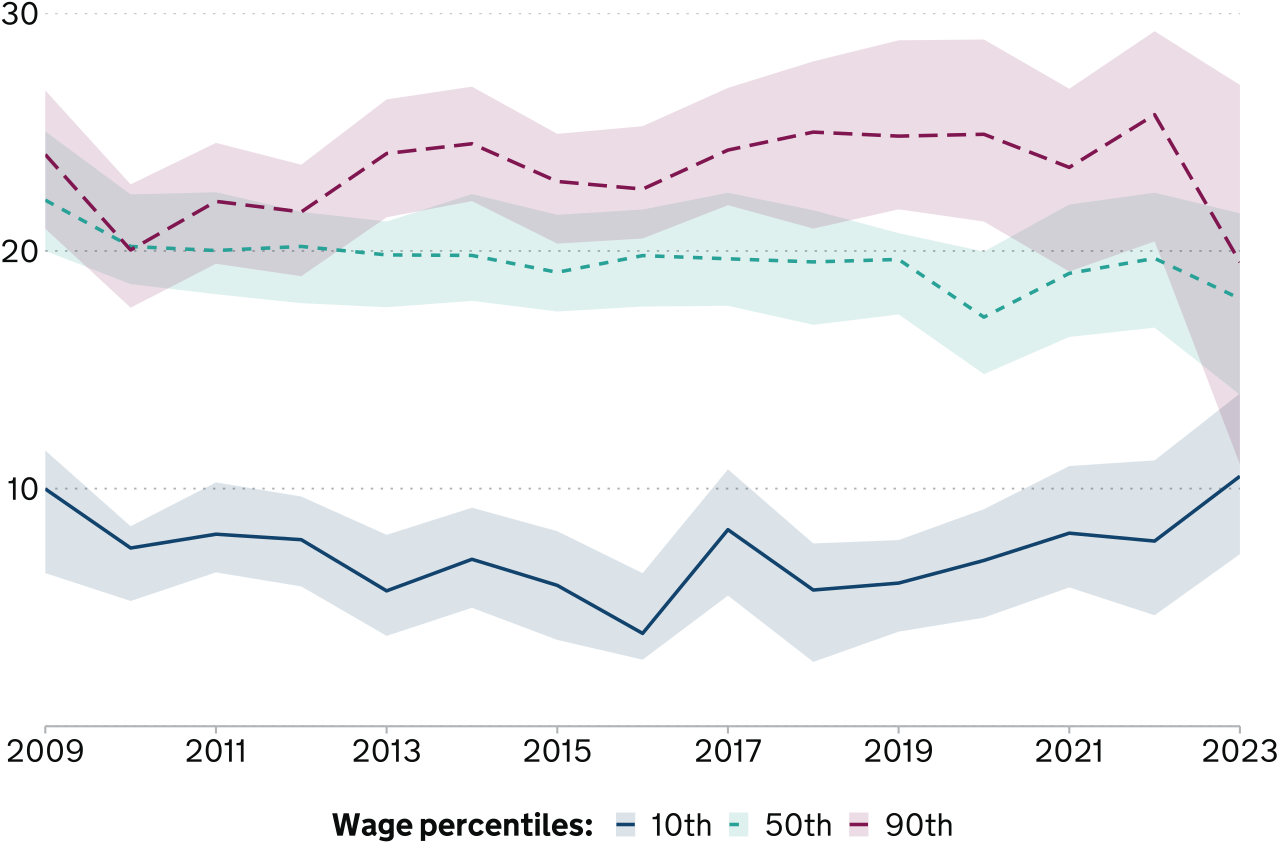
Looking at the 10th, 50th, and 90th percentiles of the wage distribution indicates that most of the decline in the GPG observed until 2016 in Figure 11 results from a decline in the gap for lower earners (Figure 12). We observe relative stability in the GPG for mid earners (50th percentile), a decline until 2016 and increase thereafter for low earners (10th percentile), and a gradual increase for higher earners from 2010 to 2022. Therefore, when excluding 2023 due to limited observations, the gap at the 90th percentile appears to have been widening since 2010, indicating that the highest earners are experiencing a growing gender pay disparity by sex. The same also seems to have been happening for low earners since 2016. Confidence intervals are large in Figure 12 because the data is restricted to smaller samples of workers (those at the 10th, 50th, and 90th percentiles).
Figure 12: Trends in hourly wage percentiles (10th, 50th and 90th), 2009 to 2023
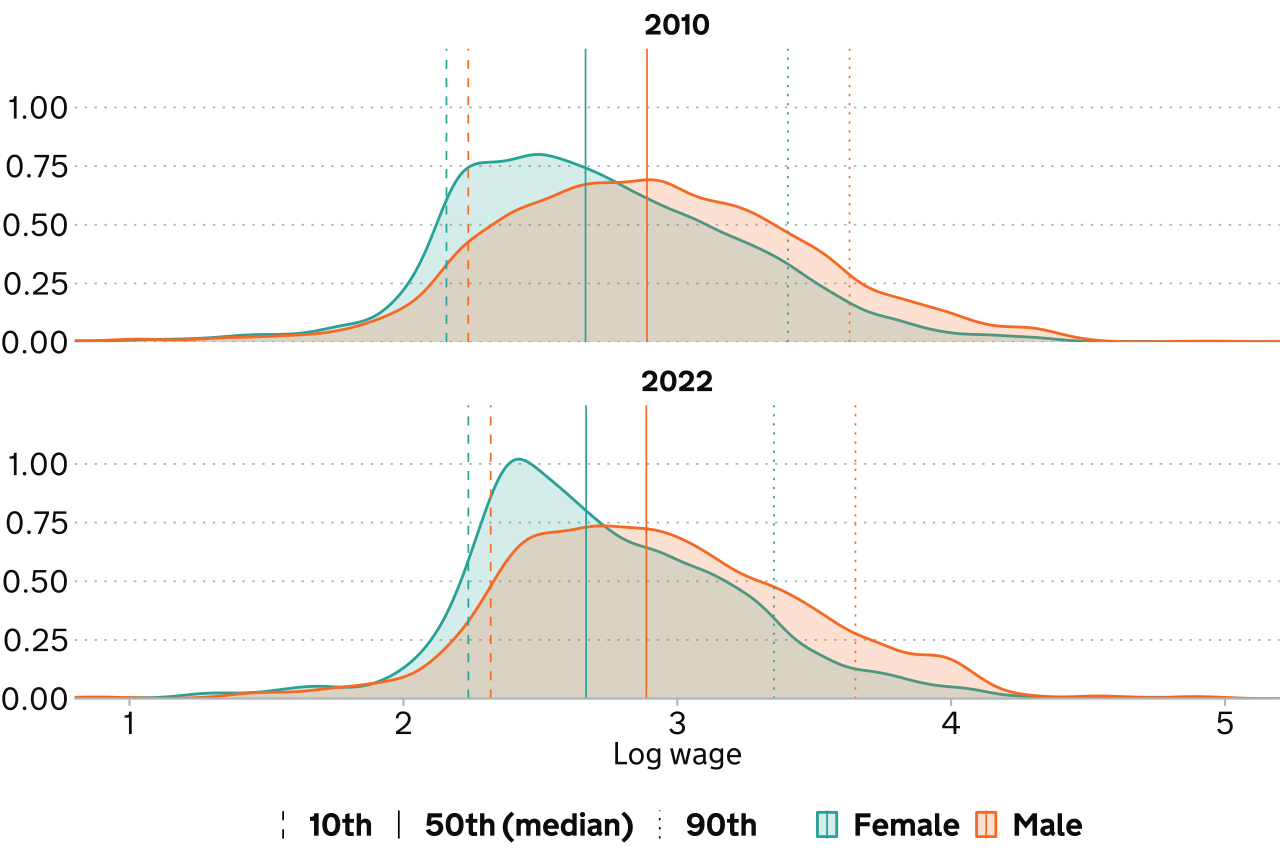
We further investigate the differences between male and female wages by comparing the entire distributions at 2 points in time: 2010 and 2022. Wages are expressed in real terms (excluding the effect of inflation), such that they reflect purchasing power in 2024 prices.
Figure 13 illustrates the distributions of real log hourly wages for men and women in 2010 and 2022, with vertical lines marking the 10th, 50th (median), and 90th percentiles within each group and year. The figure shows almost no increase in real pay over the period, except for those on lower pay. In 2022 female wages appear more concentrated towards the left of the distribution, while male wages present a small bump in the distribution at the top. In both years, men earned higher wages across the distribution. In 2022, the 90th percentile wage of females is lower than that in 2010, while the 90th percentile wage of males is slightly larger than in the past, reflecting a widening of the gap at the top of the distribution. The compression at the lower tail for both men and, especially, women suggest policy effects such as increases in the National Minimum and Living Wages.
Figure 13: Changes in the distribution of real log hourly wages by sex, 2010 to 2022
3.3 Decomposing the gender pay gap
The unexplained component, occupation and full-time experience are the main drivers of the GPG.
Here, we decompose the GPG into the variables which mostly increase or decrease the gap. Olsen and others (2010, 2018) analysed the UK GPG in 1995 to 1997, 2004 to 2007, and 2014 to 2015 using the BHPS, the predecessor of the UKLHS, and the UKLHS. As previously commissioned reports, we make references to these pieces of work to check for continuity of results as well as to highlight new patterns that have emerged, while also consulting the wider literature.
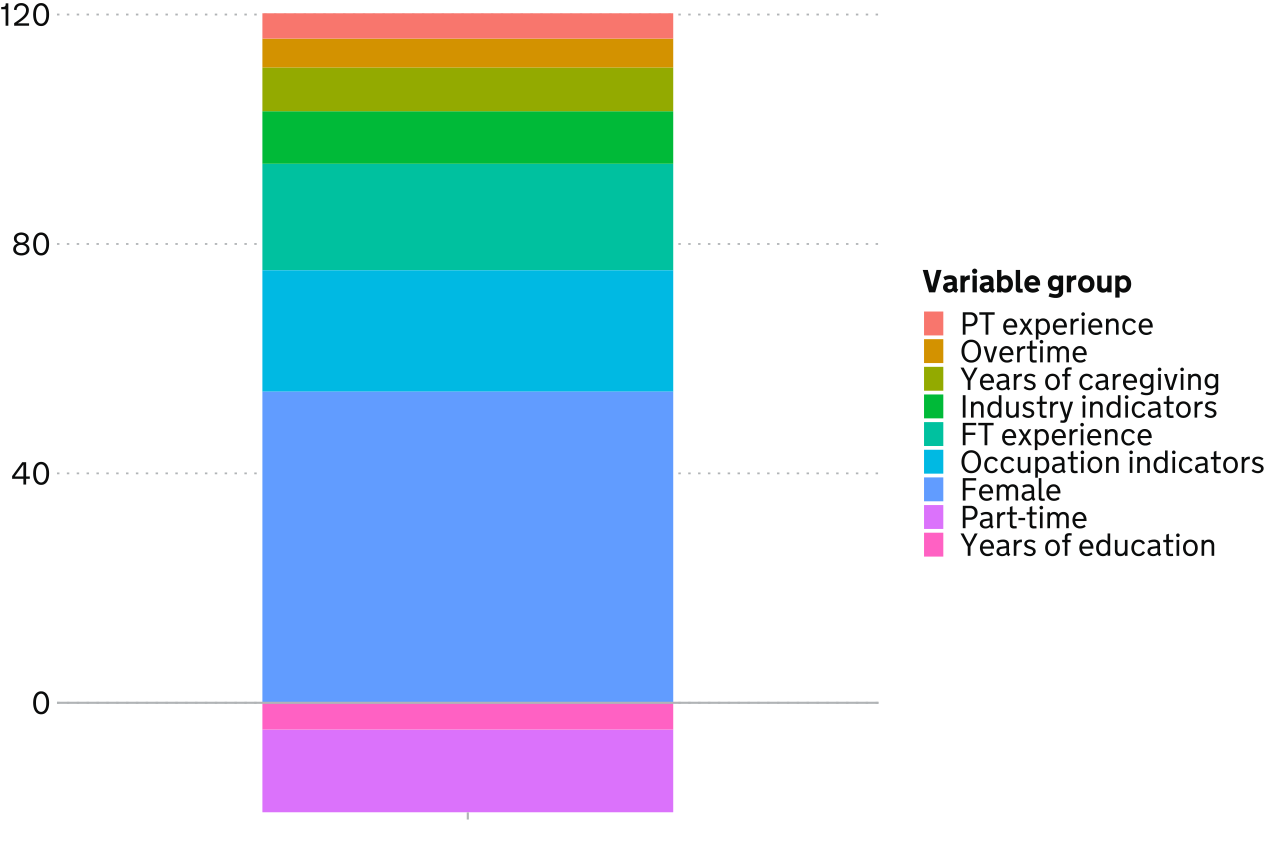
Figure 14 presents the main factors contributing positively and negatively to the GPG 2009 and 2023. The former are drivers of the GPG and appear as positive percentages. The latter are protective factors that reduce the gap, and appear as negative percentages. Figure 14 suggests that the largest single contributor to the gap is the female indicator, that is, unobserved characteristics associated with gender that remain unexplained by observable factors. These explain 54% of the gap. This is followed by full-time work experience (19%), occupation indicators (21%) and industry indicators (9%). Factors contributing to reducing the gap include part-time work (reduces the gap by 14%) and years of education (reduces the gap by almost 5%).
In our model, part-time work is associated with higher hourly pay and, given that women are much more likely to work part-time than men, we observe part-time work as reducing the GPG. Although this departs from Olsen and others (2010) results, it is in accordance with the more recent research by Olsen and others (2018). They observe a quality change in the part-time jobs of men and women. After the financial crisis, male part-time employment increased but the calibre of this employment was poor. Meanwhile, female part-time employment has not increased, and existing evidence suggests that part-time female workers might be ‘retention part-time workers’, who are well paid and able to negotiate their working hours (Olsen and others, 2018).
Figure 14: GPG decomposition, 2009 to 2023 pooled data
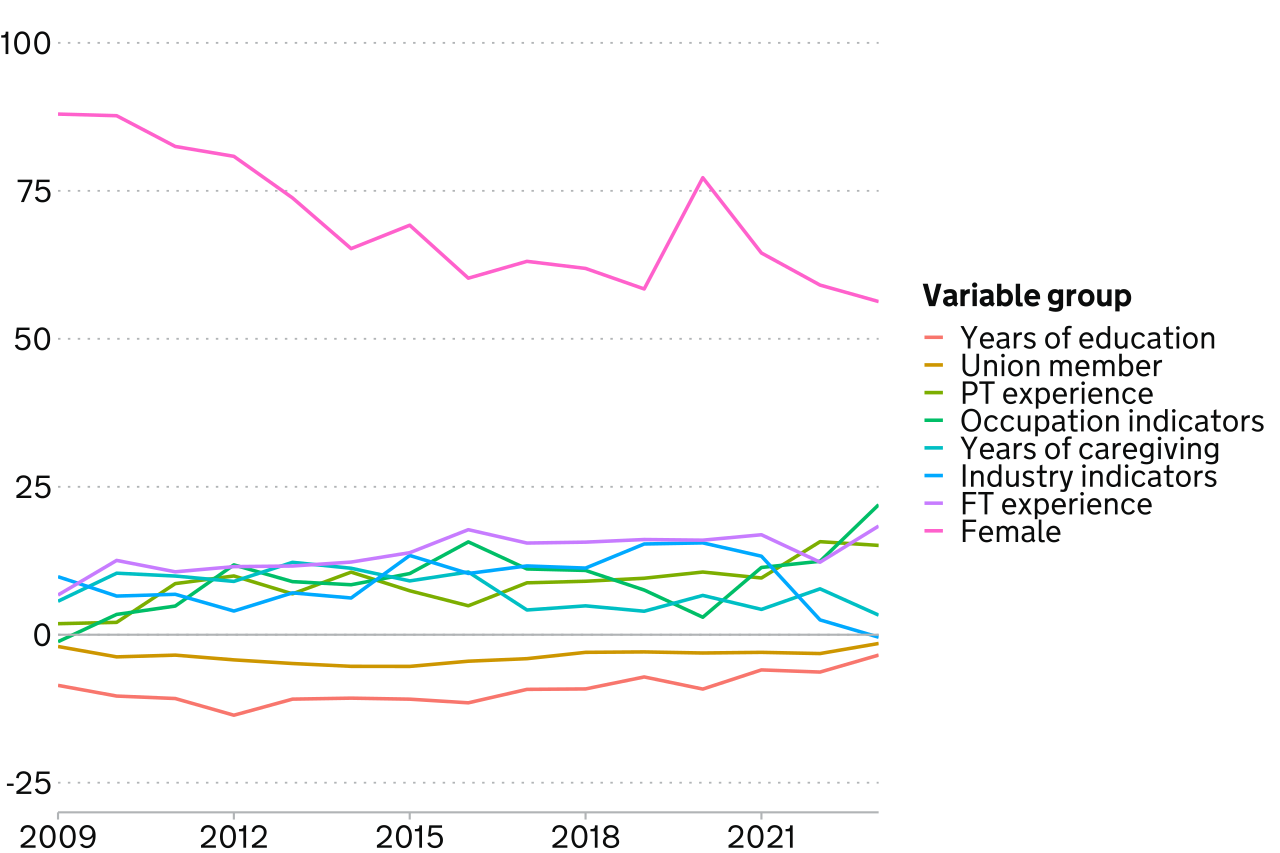
Looking at the percentage of the GPG which is attributed to each factor over time (Figure 15), we see, as in the previous figure, that unobservable factors associated with sex are a major contributor to the GPG for all years, with a contribution ranging from almost 67% in 2009 to 49% in 2023. Occupation indicators are another important factor. Their contribution mostly oscillates between 20 and 23%, but in 2023 they explain nearly 30% of the gap.
Full-time experience shows a contribution which increases from 12% to 21% of the gap, but this increase mostly happens over 2009 to 2010, and 2022 to 2023, potentially reflecting the financial crisis effects and small sample issues, respectively. Part-time experience initially appears as a protective factor, with negative contributions in 2009 and 2010 (-5% and -1%, respectively). From 2011 to 2016, its contribution mostly revolves around 5%, but it sharply increases in 2017 to almost 11% and then gradually rises to 22% in 2023. From 2016 onwards, the impact of part-time experience on wages became more negative, explaining the increase. We also observe an increase in the contribution of current part-time work to reducing the GPG between 2016 and 2019. This is due to the higher estimated impact of part-time work on wages rather than a change in the proportions of men and women working part-time.
The opposite impacts on the gap of current part-time work and part-time experience can be explained as follows. The former reflects selection effects where higher paid women can reduce their hours. The latter captures accumulated part-time experience which means less work experience overall, limiting career progression and leading to lower wages.
The contribution of Industry indicators to the GPG remains around 7% between 2009 and 2014, then increases to a new range, between 9% and 13%, but sharply falls in 2022 to 2023 to almost zero. This reflects the very large increase in missing or inapplicable survey responses to industry of employment past 2020 explained in the previous section. Hence, it should not be interpreted as a real change in the labour market.
Figure 15: GPG decomposition by year, 2009 to 2023
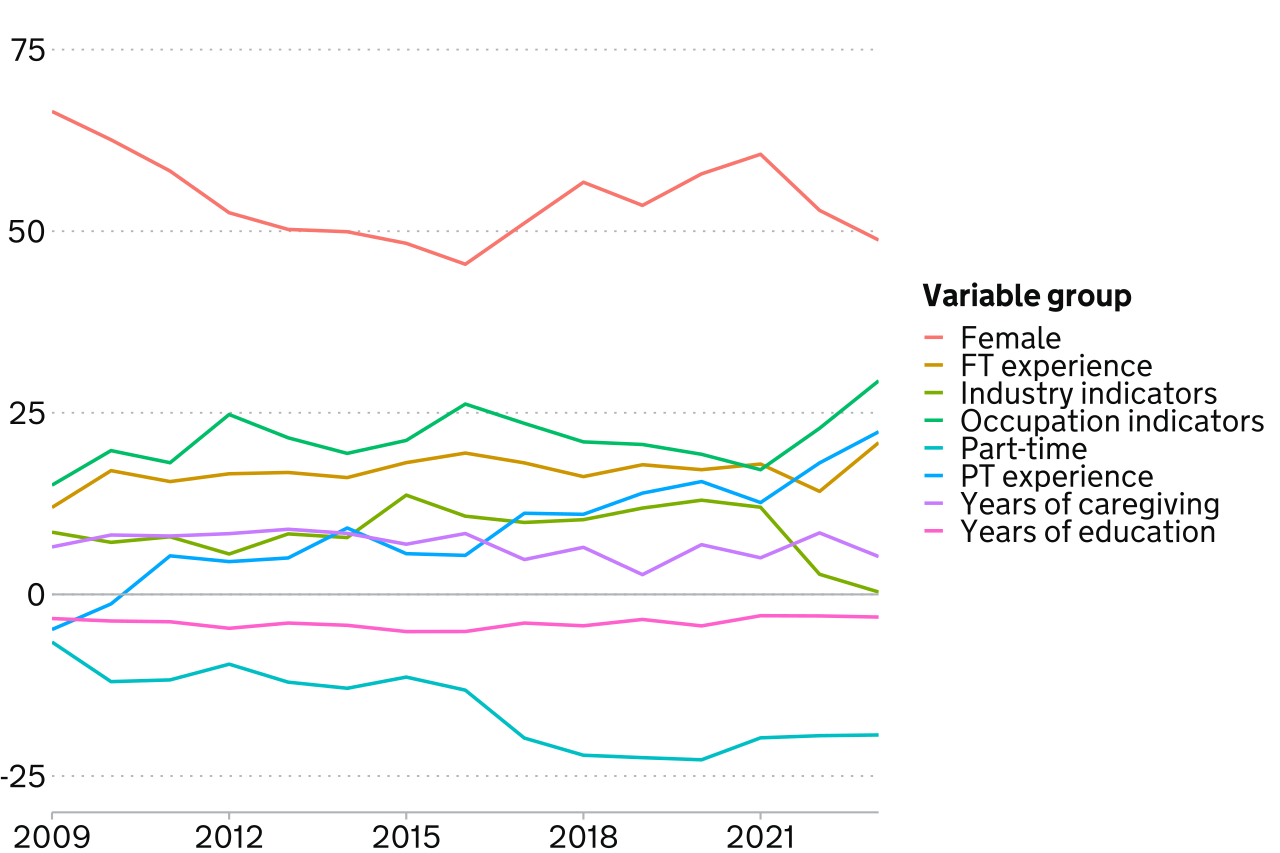
Table 2[footnote 4] outlines the main contributors to the GPG over the period 2009 to 2023 from largest onwards. We aggregate the period into 3 averages, 2009 to 2014, 2015 to 2019, and 2020 to 2023. Throughout the period the female coefficient contributes the most substantially ranging from 51% to approximately 57%. This table summarises our findings in Figure 5.[footnote 5] Most of our factors show little variation throughout the time period except for overtime, which is an important driver of the GPG at the beginning of the period, but then reduces the GPG by 2020 to 2023. This change in overtime occurs because of a lower percentage of men reporting overtime work post 2019, reducing overtime as a source of male pay advantage.
Table 2: Average contribution of main factors to the GPG 2009 to 2023
| Variable group | 2009 to 2014 | 2015 to 2019 | 2020 to 2023 |
|---|---|---|---|
| Female | 56.7 | 51.0 | 54.8 |
| Occupation indicators | 19.9 | 22.4 | 22.1 |
| Full-time experience | 15.6 | 18.0 | 17.6 |
| Care experience | 8.1 | 5.9 | 6.2 |
| Industry indicators | 7.6 | 11.3 | 7.2 |
| Overtime | 6.5 | 4.5 | −0.4 |
| Larger firm | 4.6 | 5.6 | 4.9 |
| Region indicators | 0.9 | 0.6 | 1.1 |
| Sickness | 0.0 | −0.1 | −0.2 |
| Urban | 0.0 | −0.1 | 0.0 |
| Years of maternity leave | −0.3 | −0.9 | −2.9 |
| Ethnicity indicators | −0.5 | −0.3 | 0.3 |
3.4 Full-time workers
Greater homogeneity of occupations among full-time workers results in lower contribution of occupation sorting and larger contribution of the unexplained component. Full-time experience remains important.
This analysis focuses on full-time workers only, meaning employees in our sample who work 30 hours or more. We do so for several reasons, primarily, part-time and full-time workers often have different pay structures, hourly rates, and working patterns. Restricting to full-time roles only ensures we are comparing like with like, with some studies of the GPG focusing on full-time workers (Blau and Kahn, 2017). Furthermore, full-time employment is more likely to reflect typical career progression which allows the analysis to capture pay gaps caused by career-long differences rather than temporary or flexible work arrangements. For instance, part-time work is strongly gendered in the UK, where on average more women work part-time than men. Indeed, investigation of the data reveals that the GPG for part-time workers is, on average, significantly smaller than for full-time workers.
Figure 16 reports the contribution of factors to the GPG for our pooled sample from 2009 to 2023, reporting results from individuals in full-time employment only. Our findings in Figure 16 are broadly consistent with our findings in Figure 14, with some small differences. Unobserved factors represented by the female indicator continue to explain most of the gap, but now they contribute to 72.8% of the gap, while in the whole sample they correspond to 54%. This might happen because other variables may be correlated with working part- or full-time, such that, once we focus on only one group, their importance declines. Analogously, we observe that occupation contributes substantially less to full-time work GPG (8.6%) than to the whole workforce GPG (21.2%), becoming less important than full-time experience, industry indicators and years of caregiving. This is likely caused by full-time workers being employed more frequently in some occupations than others.
Figure 16: Full-time sample GPG decomposition, 2009 to 2023
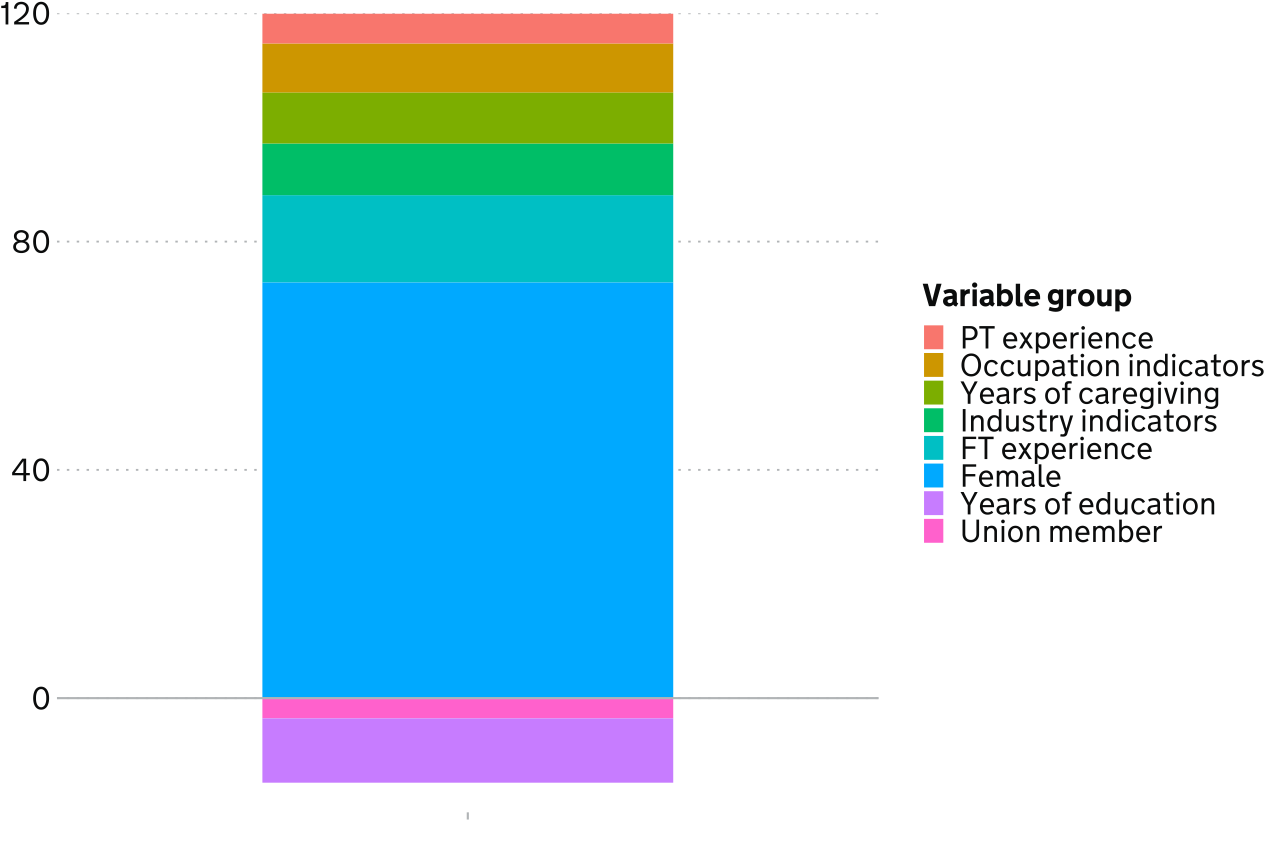
Figure 17 reports the GPG decomposition for our full-time sample only, across the years 2009 to 2023. While the impact of occupation indicators is lower than for the whole sample, their contribution does increase over time. In 2009, it was actually slightly negative, reducing the gap, and by 2012, it reached 11.8%. In 2023, its value rose to almost 22%. As in the whole sample, the contribution of unobservable factors, reflected in the female indicator, has diminished over time.
Figure 17: Full-time sample GPG decomposition by year, 2009 to 2023
4. Distributional decomposition
So far, the analysis has focused on the average GPG. While informative, it can mask important variation across the income distribution: the pay gap experienced by women earning at the bottom 20% of the pay distribution may be driven by very different factors than the gap experienced by women at the top 20%. To account for this, distributional decomposition can be used to gain a richer understanding of the heterogeneity in the gender pay gap. The distributional analysis on the UKHLS reveals that the gender pay gap widens as we move up the income distribution, which clearly indicates the presence of a glass-ceiling. At the lower end, the gap is largely explained by differences in characteristics, particularly women’s concentration in lower-paying industries and their lower full-time experience. In contrast, as we move up the income distribution these differences in characteristics fade and unexplained pay differences become more prominent. This means that highly qualified women are not rewarded for their qualifications at the same rate as men.
The technique separates the total pay gap at every quantile into 2 components: the composition effect and the pay structure effect. The composition effect captures the portion of the pay gap attributed to differences in observable characteristics between men and women (such as level of education, experience, occupation, and industry). The pay structure effect captures the portion of the pay gap which remains once the observable characteristics have been accounted for. As such, the pay structure effect captures potential discrimination and other unobserved factors.
By examining how these 2 components change as we move from the lowest to the highest earners, we can identify where in the pay distribution the pay gap is most likely to be driven by unequal treatment (Firpo and others, 2018; Fortin and others, 2011).
The 2 components of the pay gap behave very differently across the pay distribution. We can see from Figure 18, that for women whose wage is below the median, the pay structure (that is, the gap attributable to men receiving higher pay than women for the same set of qualifications) is relatively constant. The same is not the case for women whose wages are above the median: the pay structure component rises sharply between the 40th and 80th quantiles. This means that a highly qualified woman near the top of the wage distribution does not receive the same financial reward for her qualifications. This is clear evidence for the glass ceiling effect in the UK.
Figure 18: GPG decomposition, aggregate effects
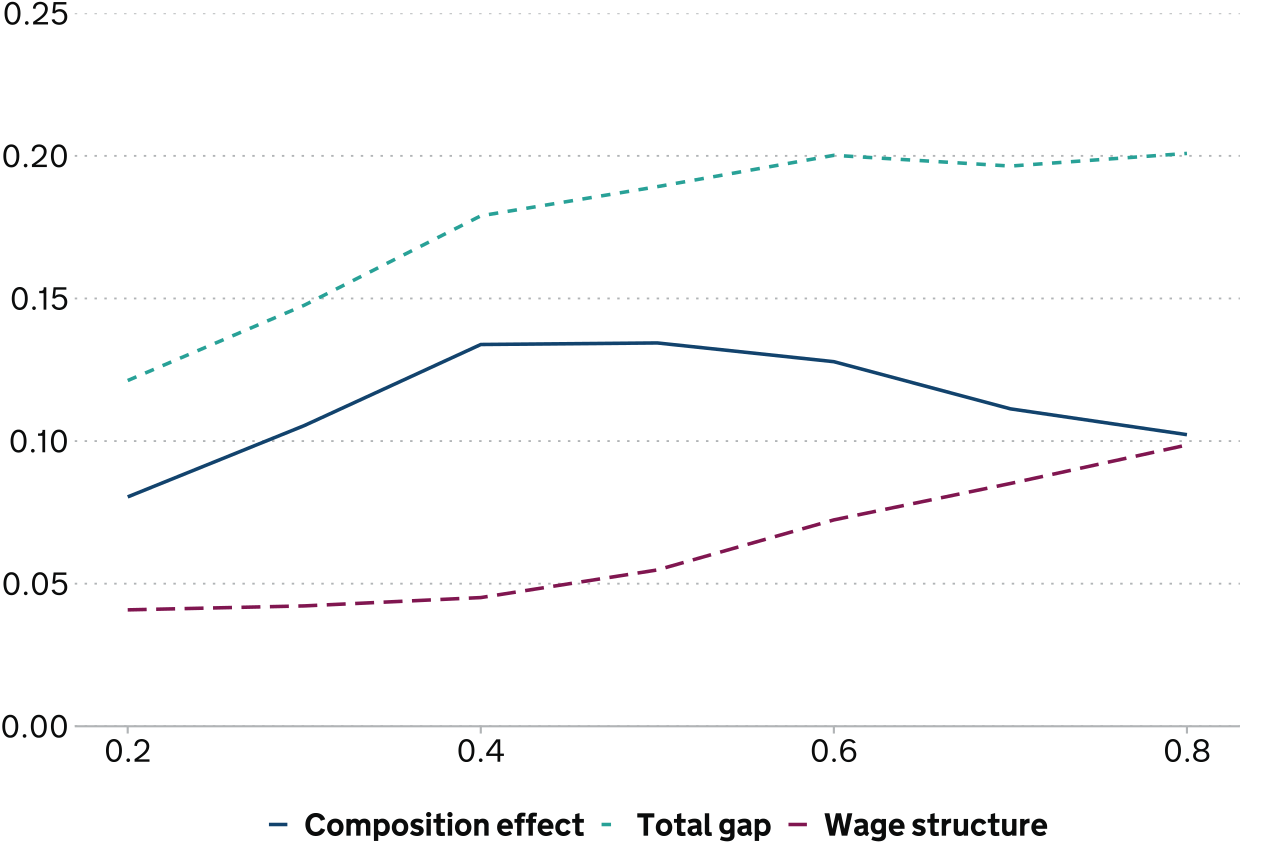
Figure 18 also reveals an inverted U-shaped pattern for the composition effect. To understand this, consider that the composition effect captures the portion of the pay gap attributed to men and women having different measurable characteristics. At the lower end of the wage distribution, differences in characteristics are the dominant explanation for the pay gap. For example, at the 20th quantile, composition effect accounts for roughly two-thirds of the total gap. This means that most of the pay disparity among low earners can be traced to the fact that women in this part of the distribution tend to have less full-time experience or to work in lower-paying industries than their male counterparts.
Moving toward the middle of the distribution, the composition effect initially widens the gap further, peaking around the 40th quantile. However, above this point the pattern reverses with differences in characteristics being less important in the gap decomposition. By the upper end of the distribution, composition and pay structure effects contribute roughly equally to the total gap with the pay structure effect becoming increasingly important as we move up the wage distribution. In other words, while the pay gap among lower earners is largely about what women bring to the table, the gap among higher earners is increasingly about how the labour market rewards what they bring. This shift from composition-driven to pay-structure-driven gaps is consistent with glass ceiling effects (Arulampalam, Booth, and Bryan, 2007).
We next look at which factors create these differences. Figure 19 shows the variable specific breakdown of the composition effect and pay structure effect. In this figure, we only include the total explanatory effect of main variables, namely industry, part-time experience, full-time experience, occupation indicators, and years of education.
Figure 19: Decomposition of GPG across the wage distribution
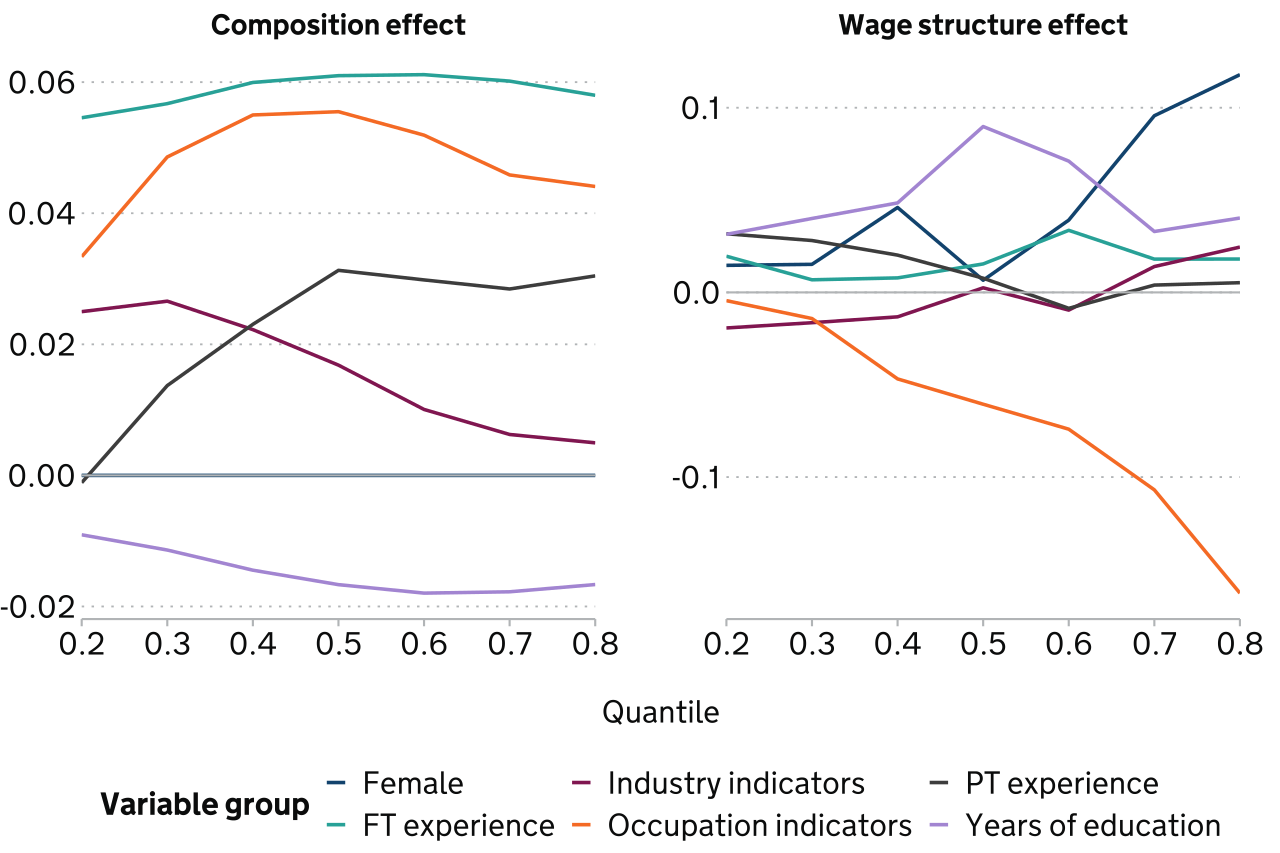
On the left side, we can see that the biggest contributor for the composition effect is Full-time experience: women having less full-time experience across the distribution leads to an explanation of the existence of the pay gap. This is relatively constant across the distribution. Interestingly, part-time experience does not counteract this penalty associated with less full-time experience. Instead, it widens the pay gap further, with the effect not being uniform across the wage distribution. Specifically, the part-time penalty becomes larger until the median, at which point it plateaus. One plausible explanation for the intensification of this effect toward the median is that women in the central quantiles of the distribution are most likely to temporarily step out of full-time employment to manage caregiving responsibilities, before returning to the workforce on a part-time basis. Because part-time roles in such segments of the labour market offer limited career progression, the accumulated effect is largest at the median. (Kee, 2006; Xiu and Gunderson, 2014; Bishu and Alkadry, 2017). In contrast, women at the very bottom of the distribution may already be in low-pay, low-progression roles regardless of their work-pattern history, while women at the top may have had the resources or occupational flexibility to minimise career interruptions.
Industry indicators also have non-constant impacts on the composition, with its impact largest at the bottom end of the wage distribution. At the bottom of the wage distribution, women are disproportionately employed in lower-paying industries (such as retail, hospitality, and social care) while men at the lower end of their wage distribution are more likely to take up employment in higher paying sectors (such as construction). A woman working in a low-paid retail role and a man working in a low-paid construction role may both be near the 20th quantile of their respective distributions, but the floor of wages in construction tends to be higher than in retail due to factors such as unionisation rates, physical working conditions premiums, and sector-specific minimum pay agreements (Grimshaw and Rubery, 2007).
At the upper end of the wage distribution, the industry effect on composition diminishes markedly. As such, among high earners, men and women are more similarly distributed across industries, or across industries with comparable pay. This means that there is some evidence for industry sorting at the lower end of the wage distribution, but it becomes a less convincing argument at the top end of the income distribution.
Finally, years of education reduce the pay gap, especially on the higher end of the income distribution. Education having a non-constant effect on the pay gap means that women with more years of formal education (who are more likely to have higher qualification levels) are more likely to be at the upper end of their respective income distribution, revealing differences among women themselves.
On the right side of the figure, we see the pay structure effect, meaning the difference in pay for men and women when observable characteristics are controlled for. Perhaps most concerning is that unexplained pay differences increase as we move up the earnings distribution. This suggests that barriers such as discrimination in promotions or career progression (rather than differences in qualifications) play a larger role in driving the pay gap at the top of the distribution. This pattern is a hallmark of the glass ceiling effect (Arulampalam and others, 2007; Kee, 2006) and suggests that while human capital differences explain much of the gap for lower-earning women, unmeasured factors related to career progression dominate for higher-earning women. These barriers may include the limited availability of flexible or part-time working arrangements in senior roles, implicit biases in how leadership potential is assessed (where traits associated with men are valued more), and lack of transparency in promotion processes (including unclear criteria for advancements to senior positions). Such barriers are difficult to capture in standard labour market variables, but are documented in organisational research as factors contributing to the persistence of the glass ceiling (Eagly and Karau, 2002; Heilman, 2012).
Interestingly we can see that the occupational indicator decreases the pay gap. This means that within a given occupation, women receive higher pay relative to men when all other characteristics, such as education and experience, are accounted for. This counterintuitive finding suggests that occupational segregation operates primarily through composition effects, meaning women are not promoted through the hierarchy as much as their male counterparts. However, this finding does not contradict the glass ceiling narrative – rather, it refines it. The glass ceiling operates here primarily through horizontal segregation, meaning women are systematically channelled into lower-paying occupations and under-represented in the highest-paying ones, rather than being paid less than men for doing identical work within the same occupation. The positive pay structure effect may reflect that women who succeed in entering better paid occupations are positively selected (that is, they may possess particularly strong credentials or abilities that enabled them to overcome any possible entry barriers), and may also benefit from employer-level anti-discrimination policies that have been partially effective at reducing within-occupation pay disparities (Blau and Kahn, 2017).
Crucially, the composition effect for occupation remains large and negative, whereby women’s concentration in lower-paying occupations continues to be a major driver of the overall gender pay gap. In summary, the challenge is less that women are paid unfairly once they reach the top of a given profession, and more that barriers prevent them from reaching high-paying occupations at the same rate as men. This distinction between where women end up (composition) and how they are rewarded once there (pay structure) is essential for understanding the nature of the glass ceiling (Blau and Kahn, 2017; Arulampalam and others, 2007).
5. Literature review: Drivers of the GPG
5.1 Overview of the evidence review
Although the GPG has narrowed in earlier periods, it has remained largely static in recent years, with significant differences in earnings between men and women persisting. In our analysis, the pay gap stood at approximately 21% in 2009 and gradually declined to around 16% by 2023. Our decomposition analysis indicates that this slow rate of decline is driven by 3 main factors:
-
Occupational segregation: Women continue to be concentrated in lower-paid, female-dominated sectors, while men are more likely to work in higher-paid, male-dominated occupations, limiting women’s earnings potential.
-
The Motherhood (child) penalty: Career breaks and reduced working hours associated with parenthood disproportionately affect women, leading to lower pay, slower career progression, and long-term earnings gaps.
-
Unobservable factors: A substantial portion of the pay gap remains even after accounting for measurable factors such as occupation and experience, indicating the presence of potential discrimination or other structural barriers.
These findings provide the starting point for the deductive evidence review that follows, which draws on the wider UK and international literature to examine both observed and unobserved drivers (for example, discrimination and cultural norms) of the GPG, the effectiveness of actions to address them and potential future areas of focus for interventions.
5.2 Research aims
The overall research aim was to summarise any corroborating evidence for the findings of this report and it is structured around the following questions:
- Why has the relative importance of the drivers and protective factors of the GPG identified by the decomposition analysis changed over time?
- What effective actions can be taken to reduce the identified drivers of the gender pay gap?
- What barriers and enablers might prevent or facilitate the actions identified above from being effective?
The research undertaken is not comprehensive. It was intended to highlight if the findings of this report were also found in the wider research and, as such, followed a deductive approach from the quantitative findings. Limitations are listed more fully below.
We focus on effective actions to reduce the largest drivers of the GPG identified in the decomposition analysis: occupational and industry segregation, and the motherhood penalty (labour market experience), as well as drawing on UK evidence about the causes of the GPG that cannot be directly measured in the decomposition analysis.
5.3 Approach
The evidence review was conducted using a rapid, structured evidence review approach, informed by principles of Rapid Evidence Assessment (REA).
Search terms were explored and grouped thematically to capture both drivers and interventions. Themes were set by the findings of the quantitative research and included gender, wage inequality and discrimination, unexplained pay gaps, occupational and sectoral segregation, the motherhood penalty and childcare, working patterns and flexible working, and pay transparency and equal pay legislation.
Searches were conducted using Google Scholar, Consensus, UK government and public bodies (including GOV.UK and ONS), drawing on academic literature, policy reports and grey literature. The review focused on English-language publications from 2005 onwards, reflecting the period over which contemporary empirical research and policy debate on the GPG has developed. Earlier seminal studies were included where they continue to inform current understanding. Both UK-focused and international studies were included – international evidence was included where relevant, but findings were interpreted with explicit reference to the UK labour market.
Studies were included where they examined pay or earnings outcomes directly or provided evidence on the drivers of the GPG or the effectiveness of actions to address it. Strictly quantitative research was prioritised when reviewing the evidence on the drivers of the GPG. However, to capture unquantified drivers and evidence on the effectiveness of actions to address the GPG, as well as quantitative research the review also included qualitative, and mixed-methods research, alongside policy evaluations and legislative analysis. Studies were excluded if they did not address pay outcomes or provide empirical analysis, except where they offered relevant policy context.
Relevant studies were identified through screening titles and abstracts, followed by full-text review of selected publications. Key information from included studies were recorded in an evidence spreadsheet, including data sources, methods, main findings, and relevance to the drivers identified in the decomposition analysis. The evidence was reviewed critically, with attention to the robustness of research design, sample size and methodology, as well as the applicability of findings to the UK context.
5.3.1 Exclusion criteria
During our search employed the following exclusion criteria:
- studies not published in English
- studies published prior to 2005, except where they constituted seminal contributions that continue to inform current understanding of the gender pay gap
- studies that did not examine pay or earnings outcomes or did not provide empirical evidence on the drivers of the gender pay gap or the effectiveness of actions to address it
- purely opinion-based papers without an empirical component
- studies where findings were not readily applicable to the UK labour market
- publications that did not meet the relevance criteria following title, abstract, or full-text screening
In total 78 sources were included, consisting of a mix of UK-based and international evidence. Of these, 46 were based on UK research, the remaining based on international research. 61 of the 78 sources included empirical analysis, the remaining 17 consisted of non-empirical reviews or case studies. We did not conduct a critical review of the selected studies to assess their risk of bias or the generalisability of their results.
5.3.2 Limitations
As a rapid, structured review, it was subject to some limitations. The review prioritised academic studies, which provided empirical evidence on the drivers of the GPG. As a result, there was less coverage of policy-focused literature, and findings on the implementation and impact of policies are therefore more limited. Policy papers and grey literature were considered primarily to provide context on recent UK policy initiatives.
Furthermore, no formal or standardised methodological quality assessment was undertaken. Instead, studies were assessed pragmatically based on their research design, data sources, sample size, and transparency of methods and findings. This approach reflects time and resource constraints and is consistent with rapid evidence review methods.
As a deductive approach was used for the review, evidence was sought to verify if the findings of the analysis undertaken were reflected in the wider literature. The research in this report is limited to corroborating findings.
A full systematic review with formal quality appraisal would be valuable in future to provide a more comprehensive assessment of the strength of the evidence base and is recommended for further work in this area.
5.3.3 Structure
The evidence review is structured as follows:
- section 6: Occupational segregation – examines how occupational and sectoral segregation contributes to the GPG, how these patterns have evolved over time, and the effectiveness of policy
- section 7: The motherhood penalty – analyses the role of childbirth, caregiving, and differences in accumulated work experience in shaping the GPG, considers how the penalty has changed over time, and reviews policies designed to support mothers’ labour market continuity and progression
- section 8: Unobservable factors – explores the role of unexplained pay differences within firms and occupations, assesses how its importance has shifted over time, and evaluates policy measures intended to address discriminatory pay-setting and progression practices
- section 9: Barriers and enablers – considers the contextual factors, challenges, and facilitators that may influence the successful implementation of strategies to close the GPG
- section 10: provides a concluding summary and some policy recommendations
6. Occupational segregation
Our findings
Occupational segregation is a significant structural driver of the UK GPG. Women and men continue to be concentrated in different occupations, sectors, and levels of seniority, with female-dominated roles typically offering lower pay and fewer progression opportunities. Women remain over-represented in lower-paid, female-dominated roles, but even after controlling for occupation, the residual gap persists, highlighting the need to address within-job disparities. This section reviews the evidence on how these patterns contribute to pay inequality, how their importance has shifted over time, and what policies have aimed to reduce their impact.
Corroborating findings
6.1 How occupational segregation drives the GPG
A large body of UK research has demonstrated that occupational segregation plays a central role in sustaining the GPG (Leoncini, Macaluso and Polselli, 2024; Olsen and others, 2018; Lindley, 2016; Olsen, 2010; Mumford and Smith, 2007). Occupational segregation refers to the concentration of women and men into different occupations and roles, often with female dominated jobs paying less. It includes horizontal segregation, where women and men tend to work in different types of occupations such as nursing compared with engineering, and vertical segregation, where men are more often found in higher-status or managerial roles within the same occupational field (Blackburn and others, 2001).
Studies find these patterns explain a substantial part of the GPG. For example, UK research by Olsen and others (2018) highlights that occupational segregation explains a significant portion of the pay gap, although differences in labour market history (including years of full-time work and employment interruptions related to unpaid care) account for an even larger share. Similarly, Olsen and others (2010), using BHPS data from 1995 to 2007, highlight that the gendered distribution of men and women across occupations and sectors has consistently contributed to pay disparities, even after adjusting for education, experience, and working hours. Earlier work by Olsen and others (2004) shows that women’s concentration in lower-valued occupations accounts for around 10% of the GPG, with a further 8% attributable to how different types of work are valued in society. They find for every 10-percentage-point increase in male representation within an occupation, hourly wages rise by approximately 1%, suggesting that pay differentials reflect the gendered ranking of jobs within the UK labour market. Mumford and Smith (2007) extend this evidence by demonstrating that workplace-level characteristics, including the gender composition and occupational mix within workplace-level characteristics, further reinforce pay disparities.
More recent UK evidence highlights the importance of sectoral segregation, which captures gendered concentration across industries rather than individual occupations. Leoncini, Macaluso and Polselli (2024) find that women are disproportionately represented in female dominated sectors such as health, education, and social care, which tend to offer lower pay, few opportunities for career progression, and higher prevalence of part-time or insecure contracts which also contributes to pay disparities, as female dominated sectors tend to offer lower pay, fewer progression opportunities and more part-time contracts. Vertical segregation within these sectors can further exacerbate disparities, as men are more likely to occupy senior or managerial roles, even in predominantly female sectors (Blackburn and others, 2001).
In addition to segregation at entry, evidence points to a glass ceiling, referring to barriers that limit women’s progression into higher-paid, higher-status occupations and senior roles, limiting women’s occupational progression. Canon and others (2021) show that university educated men are more likely to move into more advanced, higher-level jobs as their careers progress, while women are less likely to switch into roles that lead to higher pay, even when they have the same level of education. This restricted mobility into higher-paying, higher-status roles helps explain why occupational segregation persists across the wage distribution and contributes to widening pay gaps at the top. Consistent with this, Dias and others (2018) find that once cumulative experience is considered, differences in industry, occupation, and job characteristics explain substantially less of the pay gap. This suggests that occupational sorting is closely intertwined with women’s interrupted employment trajectories, rather than operating as an entirely independent source of pay inequality.
6.2 How occupational segregation has changed over time
UK research suggests that while occupational and sectoral segregation remain important drivers of the GPG, their relative contribution has changed over time. Olsen and others (2018), using data from 2014 to 2015, highlight that while occupational segregation still explains a meaningful portion of the pay gap, its contribution has declined slightly compared with earlier periods, reflecting gradual increases in women’s representation in higher-status and professional roles. Similarly, Mumford and Smith (2007) note that over time, the differences between men and women within the same workplaces and occupations have reduced slightly, although men remain more likely to occupy managerial and senior positions. Leoncini and others (2014) find that while women’s overall participation in professional roles has grown, their concentration in female-dominated sectors continues, maintaining structural pay disadvantages which suggest that although the contribution of occupational segregation to the GPG has weakened slightly over time, structural inequalities at both the occupational and sectoral levels remain significant barriers to achieving pay equity.
The trends we observe in UKLHS data from 2009 to 2023 align with these findings to a certain extent. Women’s participation in managerial and professional roles has increased gradually, suggesting a slow decline in vertical segregation (Figure 7). For example, the proportion of women in managerial positions rises from roughly 11% to 12% in 2009 to around 14% in 2023, while female representation in professional roles rises from about 12% to 14% to 15% over the same period. Despite these gains, men continue to dominate both managerial and professional roles, indicating that horizontal and vertical segregation persist and continue to sustain the pay gap.
Nonetheless, our results also indicate that the relative contribution of occupation to the GPG has remained approximately stable since 2009, suggesting that the decline of earlier years found by previous studies has halted.
6.2.1 Structural change in the UK labour market
Long-term changes in the structure of the UK economy have weakened the link between occupational segregation and pay inequality. Rising demand for high-level skills typically associated with female-dominated occupations, particularly in services, professional and caring roles, has somewhat reduced the penalty attached to many female-dominated jobs (Petrongolo and others, 2020; Brynin and others, 2016). At the same time, sectoral shifts, including the expansion of services and the contraction of some traditionally male-dominated industries such as manufacturing and skilled trades due to automation and technological change have altered both where men and women work and the returns associated with different sectors (Leoncini and others, 2023).
6.2.2 Education and partial rebalancing of gender ratios the top of the labour market
Women’s rapid educational gains (Figures 1 and 2) and increasing entry into high-skill, formerly male-dominated occupations (Figure 7) have further changed how segregation operates. For highly educated women, occupational clustering can now occur in high-demand, relatively well-paid professional and service roles, sometimes mitigating pay penalties historically associated with types of work traditionally done by women. In contrast, segregation remains strongly detrimental for less-educated women concentrated in low-skill, female-dominated jobs (Brynin and others, 2016).
As occupational gaps narrowed somewhat, other factors such as hours, contract type, and sectoral sorting such as part-time and atypical contracts in female-dominated sectors, become more central and gained relative importance in explaining UK pay differentials (Leoncini and others, 2023; Petrongolo and others, 2020).
Our review of UK studies suggests the effects of occupational segregation have become more complex and stratified. For lower-skilled women in female-dominated, low-pay sectors, segregation remains a core driver alongside hours, contracts and persistent discriminatory structures. UK evidence shows women’s concentration in female dominated sectors and jobs is a major driver of lower pay and insecure contracts among women (Lu, 2025 Scott and others, 2025; Block, 2023; Leoncini and others, 2023; Perales, 2013). Women are overrepresented in lower-paid female-dominated sectors and under-represented in higher-paid, male-dominated ones, a pattern reinforced by both horizontal and vertical segregation (Leoncini and others, 2025). Research shows that this segregation is not fully explained by differences in skills or education, but is instead shaped by persistent discriminatory constraints, undervaluation of women’s work, and limited access to progression (Leoncini, 2023; Perales, 2013).
6.3 Policy responses targeting occupational segregation
Based on our review, we summarise the UK labour market policies that have been proposed as contributing to a reduction of the GPG.
6.3.1 Pay gap reporting
Mandatory GPG reporting, introduced in 2017 for firms with 250 or more employees, promotes transparency and accountability. Evidence indicates the pay gap has been reduced by slowing men’s pay growth among high paid men, and increasing women’s pay in top positions (Blundell and others, 2025; Gamage and others, 2024).
6.3.2 Flexible working and family-friendly policies
Flexible working policies, including the statutory right to request flexible hours from 2014, aim to support women in senior roles. However, evidence is mixed, with concerns that part-time or lower-status roles may perpetuate gaps (Benny and others, 2021; Godfrey, 2017; House of Commons, 2016). While family-friendly measures such as enhanced parental leave policies and flexible schedules can prevent women from being confined to low-progression roles and support career advancement, access to high-quality flexibility is unevenly distributed across the labour market. Flexible and part-time arrangements are significantly less available in senior and high-paid positions, as a result, women who require flexibility may face a trade-off between progression and work-life balance, reinforcing vertical segregation and limiting entry into top-paying roles (Jones, 2019).
6.3.3. Education and training initiatives
Government and parliamentary sources highlight that targeted educational and training initiatives, including programmes such as STEM Ambassador outreach in schools and targeted scholarship and apprenticeship for women, are part of efforts to deal with horizontal occupational segregation and encourage women into male-dominated sectors such as STEM (UK Parliament, 2019; House of Commons, 2017). While outreach and mentoring schemes have shown some promise in challenging gender stereotypes at earlier educational stages, evidence on the Apprenticeship Levy is more mixed. In practice the Levy has been associated with a shift towards higher-level apprenticeships, which are more likely to be accessed by older and already higher-qualified workers. This has, over time, reinforced existing gender patterns, with women remaining concentrated in lower-paid service and care-related apprenticeships and men overrepresented in higher-paid technical pathways, potentially exacerbating occupational segregation within apprenticeships rather than reducing it.
6.3.4 Promoting female leadership
Policies promoting female leadership, including Women on Boards and public sector gender targets, deal with vertical segregation and help break male concentration in senior roles (Ashworth and Parken, 2019). Organisational reforms such as structured promotion and pay processes and mentoring or sponsorship programs further support women’s progression in high-skill sectors where they are underrepresented (Jones, 2019). Furthermore, there is some evidence that applying mainstreaming approaches within organisations, systematically integrating gender considerations into pay structures, promotion processes, and career development, reduces both within-occupation and overall pay gaps (Parken and Ashworth, 2019). Gender mainstreaming can be understood as an organisation-wide change process aimed at addressing the structural determinants of gender inequality. The focus is on institutional structures, and gender relations, that shape outcomes in terms of pay, career progression, and division of labour. Implementation is multi-level, whereby public policy provides framework and incentives, while organisations (particularly senior leadership, human resources, and stakeholders) are responsible for embedding changes in the organisation.
7. The motherhood penalty
Our findings
The motherhood penalty remains one of the most significant contributors to the UK GPG. Women’s earnings often decline following childbirth due to employment interruptions, transitions into part-time work, and slower career progression. In this analysis, we capture this penalty primarily through differences in accumulated full-time labour market experience, using work history data to measure how motherhood shapes long-term experience profiles relative to fathers and individuals without children. Our empirical analysis from 2009 to 2023 shows that reduced full-time experience accounts for up to 20% of the pay gap, with career interruptions and part-time history further slowing pay progression. These results align with the literature indicating that experience losses and constrained mobility are central to the motherhood penalty. This section examines how these patterns shape long-term pay inequality, how the penalty has evolved over time, and the extent to which policy interventions have addressed the experience-related disadvantages associated with motherhood.
Corroborating findings
7.1 How the motherhood penalty drives the GPG
In the UK, becoming a mother typically leads to women earning less and working fewer hours (Andrew and others, 2021). This ‘motherhood penalty’ (Budig and England, 2001) is a major contributor to the gender pay gap and offsets the impact of large educational gains made by women in the past 25 years (Andrew and others, 2021). One significant channel through which this penalty operates is reduced accumulation of full-time labour market experience, as mothers are more likely to take career breaks, shift to part-time work, or experience slower progression, limiting their long-term earnings relative to fathers and women without children.
In the UK, women on average accumulate fewer years of continuous full-time work experience than men because childbirth and caring responsibilities lead to temporary or long-term reductions in labour market attachment (Joshi and others, 1999; Manning and Petrongolo, 2008). Since pay tends to rise with accumulated experience, these employment interruptions have long-lasting effects on earnings trajectories even after returning to work.
A substantial body of UK and international evidence shows that the motherhood penalty is one of the largest contributors to the GPG. Using UK data, Olsen and others (2004) find that experience-related factors account for around 36% of the GPG, with full-time experience explaining 19%, employment interruptions a further 14%, and part-time experience 3%. They estimate about a 3% yearly gain from full-time experience, while part-time work is associated with losses, and show that 10 years of part-time employment leaves women earning over one-third less than those who worked full-time. Importantly, time spent out of the labour market for childcare or family reasons is associated with a pay penalty of around 1% per year, directly linking motherhood-related interruptions to long-term pay disadvantage.
Empirical evidence also shows that caregiving assumptions influence employer expectations and pay progression. Manning and Petrongolo (2008) find that employers statistically discriminate by adjusting pay downward for women due to anticipated career interruptions for family care, even among full-time workers. Mothers receive lower starting salaries and fewer promotion recommendations relative to otherwise equivalent women without children, indicating that gendered expectations about caregiving affect pay and advancement. Such anticipatory discrimination aligns with statistical discrimination models, where employers incorporate perceived future productivity differences into current pay offers.
Dias and others (2018) show that differences in accumulated full-time experience explain a substantial share of the GPG, particularly among higher-educated workers, for whom experience accounts for around two-thirds of the gap. Their analysis suggests that the motherhood penalty operates less through immediate pay cuts and more through slower accumulation of experience and reduced exposure to higher-paying roles over time. Women’s earnings fall sharply after childbirth, while women without children, and men’s earnings remain unaffected or increase (Costa Dias, Joyce and Parodi, 2020). Using 18 years of UK tax records, Costa Dias and others (2020) show that by 10 years after childbirth, women’s hourly wages are approximately 33% lower compared with similar women who have not had children, with most of this gap arising from reduced hours, part-time work, and slower pay progression. Earlier UK-related work by Lauer and others (2000) similarly finds that periods of part-time work, unemployment, and non-employment have persistent negative effects on pay, even where women initially experience similar or slightly higher marginal returns to experience. Taken together, UK studies indicate that the motherhood penalty is a significant mechanism sustaining the GPG, operating primarily through reduced full-time experience, prolonged interruptions, and the long-term scarring effects of part-time employment.
7.2 How the motherhood penalty has evolved over time
Evidence suggests that while the motherhood penalty remains large, its magnitude has changed over time. Early UK studies (for example, Joshi and others, 1999) found penalties emerging gradually through the first years of motherhood, largely driven by part-time work. More recent research using UK administrative data shows that the penalty is now front-loaded, with a sharp and immediate drop at the point of childbirth (Kleven and others, 2019). This reflects rising labour market specialisation within households, as mothers remain more likely to reduce hours or exit employment altogether.
Costa Dias and others (2020) find that the penalty has changed only modestly since the 1990s despite rising female employment and educational attainment. The rising cost of childcare and continued gender imbalances in unpaid care have limited progress. Research using UKLHS data from 2009 to 2023 aligns with this pattern: while women’s return-to-work rates have increased, mothers continue to be over-represented in part-time roles, concentrated in lower-paid occupations, and progress more slowly into senior positions (Figure 7). The persistence of these patterns indicates that the motherhood penalty remains a large and stable contributor to the gender pay gap.
Our analysis illustrates full-time experience has remained a substantial and relatively stable contributor to the GPG from 2009 to 2023. Its share increased slightly between 2009 and around 2015 before stabilising, indicating that differences in accumulated full-time work experience between men and women continue to be an important driver of the overall gap (Figure 14 and Figure 16). This has clear implications for the motherhood penalty, as women, particularly mothers, often experience interruptions or reductions in full-time work due to maternity leave and caring responsibilities. The persistent contribution of full-time experience to the pay gap suggests that women continue to be disadvantaged by breaks or reduced participation in full-time employment, even when part-time work is accounted for separately.
UK studies show the role of years of experience, particularly experience lost or reshaped around childbirth, has become more central and more nuanced as a driver of the GPG. The decomposition analysis and review of the literature have already demonstrated that slower accumulation of full-time experience during child-rearing years explained much of the GPG (Joshi, 2019). More recent evidence using data from BHPS and UKLHS indicates that, over the past 25 to 30 years, differences in accumulated work experience, especially full-time experience after first birth, have become one of the largest proximate drivers of the UK GPG (Gash and others, 2025; Dias and others, 2018).
At the same time, the nature of experience itself has changed. The expansion of part-time and fragmented employment among mothers means that experience now matters not only in terms of quantity but also in type. UK evidence consistently shows that full-time, continuous experience carries a strong pay premium, whereas part-time work and periods out of the labour market for unpaid care attract penalties comparable to those associated with unemployment or ill-health (Gash and others, 2025). Following childbirth, many mothers also transition into lower-quality jobs with reduced progression opportunities, meaning that experience losses increasingly interact with job quality disadvantages rather than operating solely through hourly pay (Jones and others, 2023).
7.3 Policy responses targeting the motherhood penalty
UK studies show that loss of full-time experience, part-time traps and family-related job moves after birth are central to the motherhood-driven gap (Avram and others, 2024; Dias and others, 2018; Davies and Pierre, 2005). Evidence-based policy implications from this literature suggest that interventions which support mothers’ continuous attachment to the labour market, such as affordable childcare, well-paid and structured parental leave, and flexible work can reduce long-term pay penalties and help mothers maintain years of experience and career progression. In addition, when designed to encourage fathers’ uptake, for example through non-transferable leave entitlement, such policies can promote a more equal sharing of caring responsibilities, helping to address the gendered division of unpaid labour that underpins the motherhood penalty. Dias and others (2018) provide empirical evidence reinforcing this point. Using BHPS and Understanding Society data, they examine how childbirth and differences in career patterns between men and women contribute to long-term pay differences. Counterfactual simulations suggest that if women worked continuously full-time, or if their part-time and full-time patterns matched men’s, much of the gap would be reduced. For university graduates, differences in accumulated experience account for up to two-thirds of the gender pay gap 20 years after the first childbirth, primarily due to differences in full-time experience. Among individuals without university education, experience still explains around one-third of the long-term pay gap (Dias and others, 2018). This points to policies that enable mothers to maintain uninterrupted full-time work, including early and affordable childcare, as an important lever to mitigate the experience-driven component of the motherhood penalty.
Avram and others (2024) highlight another mechanism through which the motherhood penalty arises: differences in job mobility. Parenthood is expected to affect women’s mobility because mothers face higher costs of external moves, are more likely to move for family-related reasons, and less likely to make career-related moves, which typically yield higher pay. Discrimination may further reduce returns to both external career moves and internal promotions. These differences in mobility and their returns contribute importantly to the expansion of the motherhood pay gap after childbirth. In addition, there is growing interest in job quality, which may intersect with parenthood to shape inequalities at work. Using UKLHS data Jones and others, (2023) use a 12-indicator, multi-dimensional measure of job quality that shows that women, and particularly mothers, are under-represented in high-quality roles and over-represented in lower-quality positions. While some mothers’ trade career progression for flexibility, motherhood does not automatically confer more flexible work, and job quality disadvantages are multi-faceted. Part-time work is a significant driver of these disparities, indicating that reduced hours following childbirth affect both pay and overall job quality. Job quality gaps are largest for mothers of school-aged children, reflecting the additional pressures of balancing work and childcare around the school day. Evidence-based policy responses include improving the quality of part-time roles, expanding access to formal flexible working arrangements, providing childcare that aligns with school schedules, as well as supporting fathers’ involvement in caregiving to relieve the family-related mobility burden on mothers. Such measures can help mothers maintain high-quality employment while managing family responsibilities, without significant pay penalties, reducing the contribution of restricted mobility to the motherhood penalty.
Broader European evidence supports UK findings. Analysis using the European Community Household Panel Survey (ECHP) reveals that significant motherhood pay penalties exist in Germany, Denmark, the United Kingdom, Ireland, Spain, and Portugal. Further country-specific analyses using the German Socio-Economic Panel and the BHPS indicate that career breaks contribute to slower earnings growth. In Germany, periods of family formation are associated with lower earnings growth, whereas in the UK, women’s earnings tend to recover once family formation spells are completed.
A range of UK policies have been introduced to support mothers’ labour market progression and mitigate the penalties associated with childbirth, but evidence suggests their overall impact has been modest, with persistent structural barriers continuing to cause pay disparities. SPL, introduced in 2015, has seen very low take-up, around 2% to 5% of eligible fathers, limiting its effectiveness in reducing the motherhood penalty (Clifton-Sprigg and others, 2025). Although maternity rights and protections strengthened under the Equality Act 2010 aim to prevent pregnancy- and caregiving-related discrimination, such discrimination remains widespread, with around 11% of UK mothers reporting dismissal or unfair treatment due to motherhood (EHRC, 2016). Childcare support policies, including funded early education, tax-free childcare, and the 30-hours entitlement introduced in 2017, have been shown to increase mothers’ labour market participation and reduce employment gaps (Brewer and others, 2016; Stewart and Waldfogel, 2017), but their impact is constrained by the UK’s persistently high childcare costs relative to other OECD countries. Flexible working legislation has helped some mothers stay in employment, yet flexible roles are often concentrated in lower-paid and lower-status occupations, potentially reinforcing rather than alleviating the motherhood penalty (Chung and Van der Horst, 2020).
7.3.1 Protect and build mothers’ work experience
Given the literature recognising the role of parenthood and the motherhood penalty in driving the gender pay gap (Dias and others, 2018; Jones and others, 2023; Kim, 2025), it is important to consider actions that can protect and build mothers’ labour market experience. Since 2015, parents in the UK have been able to transfer a portion of maternity leave to fathers, but uptake remains low due to limited affordability and restrictive eligibility criteria (Norman and Fagan, 2017). High childcare costs, among the highest in Europe (OECD, 2022), combined with free childcare and universal credit being targeted at lower income earners who need them most, further reduce the financial incentive for women to return to full-time work. These barriers contribute to mothers taking long career breaks, working part-time, and accessing lower-quality jobs, all of which create the motherhood penalty and the gender pay gap. Policies (see below) that address these barriers are therefore critical to support mothers’ career continuity, reduce long-term pay penalties, and narrow the gender pay gap.
Expanding affordable, high-quality childcare is a significant measure to support mothers’ continuous participation in the labour market. Reduced full-time experience is a major driver of the motherhood penalty, accounting for up to two-thirds of the pay gap in some cases (Dias and others, 2018; Kim, 2025). By increasing access to childcare from under-3s, mothers can remain in employment or return to full-time work more quickly, mitigating the impact of career interruptions on long-term pay and progression (Budig and others, 2016; Davies and Pierre, 2005).
Improving SPL is another important lever. While the UK offers SPL, uptake among fathers remains very low, limiting its potential to reduce the motherhood penalty. Longer, better-paid leave for fathers, with simpler eligibility rules and higher replacement rates, would encourage greater uptake and help challenge the one-and-a-half earner norm, where mothers bear the majority of caregiving responsibilities. Financial, cultural, and organisational barriers currently restrict fathers’ use of leave, and addressing these is crucial. Evidence from countries with more generous and flexible parental leave policies shows smaller motherhood penalties, suggesting that reforming leave policy in the UK could help narrow the gender pay gap (Budig and others, 2016; Cukrowska-Torzewska and Lovász, 2020). However, research also highlights the importance of policy design, particularly whether leave includes non-transferable “use it or lose it” components for fathers, which can promote more equal sharing of care and reduce gendered career interruptions (Patnaik, 2019).
Limiting long career breaks is also critical to reducing the motherhood penalty. Research demonstrates that extended absences from work significantly inflate the motherhood penalty, whereas moderate leave combined with early childcare provision helps reduce long-term pay gaps (Kim, 2025; Davies and Pierre, 2005). Policies that support gradual returns to work or flexible re-entry pathways can therefore reduce the adverse impact of career interruptions on pay and job progression.
7.3.2 Change how jobs are structured
Another driver of the motherhood penalty is the structure and quality of jobs. Mothers are over-represented in part-time, low-quality roles with limited progression opportunities, and under-represented in high-quality, career-advancing positions (Jones and others, 2023). These patterns contribute to slower pay growth and reinforce the gender pay gap, even when mothers remain continuously employed.
Expanding access to high-quality flexible roles is an important policy lever. UK evidence suggests that flexible working arrangements such as flexitime and remote or hybrid work, should be embedded by default in higher-paying, progression-rich roles rather than being confined to lower-pay sectors (Ciminelli and others, 2021; Jones and others, 2023). Making flexibility a standard feature of desirable jobs allows mothers to manage family responsibilities without sacrificing pay or career progression, reducing the structural barriers that contribute to the motherhood penalty.
Supporting internal promotions and career-related job moves is also critical. Career-motivated moves, whether within an employer or to a new employer, come with substantial pay gains, yet UK mothers are among the least likely to make these moves (Avram and others, 2024). Policies that provide targeted support for mothers to pursue promotions or mobility such as sponsorship, career development initiatives, and transparent promotion processes can help women access the same high-return opportunities as men, narrowing the gap in both pay and job quality.
Improving part-time job quality complements these measures. Since mothers are more likely than other workers to work part-time, raising the standard of part-time roles in terms of pay, training, progression, and benefits can help mitigate the job-quality dimension of the motherhood penalty (Jones and others, 2023). High-quality part-time options allow mothers to remain in the workforce, retain career momentum, and reduce long-term pay penalties associated with motherhood.
7.3.3 Target discrimination and “potential motherhood” penalties
Women may experience a pay penalty even before becoming mothers, sometimes referred to as a “potential motherhood” penalty (Zamberlan and Barbieri, 2023). This arises partly from job sorting, biased assumptions about productivity, and gendered expectations in the workplace (Ciminelli and others, 2021; Dias and others, 2018). Such penalties can limit career progression, reduce access to high-quality roles, and reinforce the motherhood pay gap once women do have children.
Bias-aware promotion and performance systems can further mitigate potential motherhood penalties, particularly in sectors where gendered norms can persist, including academia. Generous maternity and childcare provisions, combined with supportive organisational cultures, are associated with better outcomes for mothers (Troeger and others, 2020; Matysova, 2024). Implementing systems that recognise and account for parental responsibilities, while actively preventing bias in evaluation and promotion, supports women’s career progression and reduces the long-term pay penalty associated with parenthood.
8. Unobservable factors
Our findings
A substantial share of the UK gender pay gap persists even after accounting for differences in occupation, experience, and working hours. This remaining gap is often linked to discrimination and other gender-related disadvantages within firms and occupations. Our decomposition shows that 45% to 65% of the total GPG is unexplained by observable factors, particularly at higher percentiles, suggesting persistent discrimination or unobserved disadvantages, indicating that observable improvements in experience, hours, and occupation alone are insufficient to close the gap. This section reviews the evidence on the role of discrimination in shaping pay inequality, considers how its influence has changed over time, and assesses policies designed to reduce pay disparities that cannot be explained by observable characteristics.
Corroborating findings
8.1 Evidence of discrimination in the GPG
Standard pay decomposition analysis such as those we use in our analysis, following Olsen and others, (2018), provide an understanding of the role of discrimination in driving the GPG. These methods separate pay differences into an explained portion, attributable to observable characteristics such as experience and occupation, and an unexplained portion that cannot be fully explained by observable characteristics. The unexplained component is often interpreted as reflecting discrimination or other unobserved disadvantages affecting women’s pay (Olsen, 2010). Discrimination can be direct, through unequal pay for the same or similar work, or indirect, through gendered task allocation within organisations, where women are more likely to be assigned lower-paid or less career progressing duties (Black and Spitz-Oener, 2010).
Early UK decomposition analyses by Olsen and others (2004) estimate that around 38% of the pay gap reflects direct discrimination and preference related differences, embedded within occupational segregation and gendered patterns of human capital acquisition such as employment type, and educational choices. Similarly, Lauer and others (2000) find that about 60% of the pay gap is due to women’s skills and qualifications being valued less than men’s. This “penalty” is much larger in some occupations than others, showing that discrimination affects different job types in different ways. Using later UK data, Stokke and others (2016) show that more than half of the GPG remains unexplained, although this share declines with higher levels of education, suggesting that the adjusted gap is smaller among highly educated workers. Evidence also suggests that discrimination differs by employment context, Lissenburgh and others (2008) estimate women’s pay would increase by about 10% if their human capital attributes were remunerated in the same way as men’s for full-time workers and 15% for part-time workers, with larger penalties for part-time women, though these gaps have narrowed since the 1980s.
Discrimination continues to influence pay and career progression in the UK labour market, even after accounting for conventional human capital factors such as education, experience, and working hours. Evidence from both UK and international studies shows that women are often paid less than men for similar roles, even after controlling for experience, education, and working hours (Olsen and others, 2018).
UK administrative and survey data similarly reveal remaining pay disparities unexplained by observable factors. ONS data show persistent hourly pay gaps across full-time employees in 2025, with men earning higher median wages than women even after adjusting for employment status, indicating residual differences consistent with discrimination or unobserved disadvantage (ONS, 2025). Recent research also suggests that standard measures may underestimate the true gap because of sampling biases under-representing smaller firms where pay gaps tend to be larger (Forth and others, 2025), which could imply a more substantial role for discriminatory pay practices than official figures suggest.
Estimates of the contribution of discrimination to the GPG vary substantially, which reflect differences across labour markets, methodological applications, and the set of factors controlled for in empirical analyses. In the UK context, decomposition studies consistently find that a significant portion of the GPG remains unexplained across the wage distribution, suggesting that discriminatory practices continue to influence earnings outcomes (ONS, 2025; Forth and others, 2025). Moreover, evidence suggests that the unexplained component tends to be larger at higher percentiles of the wage distribution, consistent with a “glass ceiling” pattern in senior and high-paying roles (Arulampalam, Booth, and Bryan, 2007). ONS data show that gaps among high-earning employees (90th percentile) are substantially larger than at the median, consistent with discrimination having a stronger effect at higher levels of the wage distribution where subjective wage-setting and promotion decisions play a larger role (ONS, 2025). This pattern aligns with research finding that discrimination and differential access to career progression account for larger unexplained gaps in senior roles relative to lower-paid jobs.
8.2 How discrimination has changed over time
A substantial body of research suggests that the drivers of the GPG have evolved, yet the unexplained component has shown only modest reduction over time and remains a significant source of persistent inequality. Decomposition analyses using UK longitudinal datasets such as the BHPS and the UKLHS show that while some part of the raw pay gap is accounted for by differences in experience, hours worked, and occupation, a large portion remains unexplained by these observable factors and is attributed to unobserved gender-related influences. In Olsen and others (2018), a significant unexplained residual persisted in decomposition models, highlighting the continued role of unmeasured factors including discrimination and labour market barriers.
Evidence suggests that sex discrimination has declined modestly over time but remains an important contributor to the unexplained GPG. Longitudinal UK studies show that pay gaps unexplained by observable characteristics persist, particularly in senior roles and professional occupations (Olsen and others, 2018). Our analysis indicates that over the 15-year period, the female unexplained component consistently drives the pay gap, showing little improvement. This suggests that unobserved gender-related factors, such as discrimination or bias remain a major influence on pay differences (Figure 3.15).
Evidence from linked employer–employee data shows that the nature of gender pay inequality in the UK has shifted away from differences between jobs and towards disparities within firms and occupations. Analysis using UK data from 2002 to 2016 shows differences in firms or occupations explain little of the adjusted GPG. Most of the gap arises within firms and occupations, pointing toward within-firm discrimination, bargaining gaps or biased evaluation (Jewell, and others, 2018; Lindley, 2016). Sectoral analyses 2005 to 2020 attribute most pay differentials in female-dominated sectors to persistent discriminatory constraints with human capital playing a minor role (Leoncini and others, 2023).
Our decomposition simulation shows that the female component, representing the unexplained portion of the GPG often attributed to discrimination, has remained consistently large over time (Figure 15). Between 2009 and 2023, it accounts for roughly 45% to 65% of the total gap, despite changes in other factors such as full-time and part-time experience or occupational composition. This persistence suggests that unobserved disadvantages continue to constrain women’s earnings, indicating that improvements in observable human capital and work patterns alone are insufficient to eliminate the residual pay gap.
8.3 Policy responses targeting discrimination
Several concrete policy tools can reduce discrimination-driven components of the GPG, particularly when they directly affect pay-setting processes and organisational behaviour.
8.3.1 Pay transparency and mandatory GPG reporting
Among these, pay transparency measures have the strongest and most consistently evidenced effect. Evaluation of the UK’s mandatory GPG reporting duty, introduced in 2017 to 2018 for employers with 250 or more employees, shows that affected firms reduced their GPG by around 2 percentage points. These reductions were achieved through a combination of increased pay for women and slower pay growth for men, with effects strongest in organisations subject to greater public scrutiny (Blundell, 2020). A large UK study estimates that mandatory reporting closed around 19% of the firm-level gender pay gap, primarily by constraining discretionary pay growth for men (Duchini, 2020). Earlier transparency initiatives in UK Russell Group universities similarly reduced gender pay gaps by between 4% and 12%, largely through improved pay outcomes for senior women and increased mobility to more equitable employers (Gamage and others, 2023). Survey evidence across countries, including the UK, suggests that pay transparency reforms are relatively low-cost and reliably associated with reductions in gender pay gaps (Bennedsen, 2023).
8.3.2 Collective bargaining and union action
Evidence also points to an important role for collective bargaining and union action in reducing gender pay inequality, particularly in high-pay, male-dominated sectors. In British financial services, where gender pay gaps are large and culturally entrenched, union membership and collective bargaining arrangements have been shown to reduce pay disparities, including among mothers (Healy and others, 2019). By contrast, voluntary corporate initiatives and non-binding pledges have had limited measurable impact on pay gaps in this sector, highlighting the importance of formal mechanisms that constrain discretion in pay-setting (Healy and others, 2019).
8.3.3 Family‑friendly and anti‑discrimination policy mix
UK policy syntheses further emphasise that discrimination-related pay gaps are closely intertwined with family-related labour market penalties. Caring responsibilities for young children, part-time work penalties and occupational segregation remain central drivers of the gender pay gap. As a result, effective policy responses require a combination of family-friendly measures, such as expanded childcare provision, improved paternity leave and flexible working for both women and men, alongside robust equal pay enforcement and pay transparency. Addressing these factors in isolation is unlikely to substantially reduce discrimination-driven pay disparities (Jones, 2019).
9. Barriers and enablers to action
This section considers the barriers and enablers that influence the successful implementation of strategies to close the GPG. The effectiveness of policies targeting occupational segregation, the motherhood penalty, and discrimination in pay and progression depends on a combination of factors. Evidence from the UK and comparable contexts highlights several important barriers that can limit impact, alongside enablers for success.
9.1 Barriers
Structural and financial constraints remain a major obstacle. High childcare costs, among the highest in Europe, and limited access to affordable early education reduce mothers’ ability to maintain full-time employment, undermining policies aimed at mitigating experience-driven components of the gender pay gap (OECD, 2022; Dias and others, 2018). Budgetary pressures in both public and private sectors can also restrict the provision of high-quality flexible roles or family-friendly policies, particularly in smaller organisations that are not subject to mandatory gender pay gap reporting.
Policy uptake is another significant challenge. SPL has seen extremely low uptake, with only 2% to 5% of eligible fathers participating, limiting its potential to redistribute caregiving responsibilities and reduce the motherhood penalty (Clifton-Sprigg and others, 2025). However, low uptake reflects not only individual choices but also structural and organisational constraints, including limited financial incentives, workplace cultures that discourage leave-taking, and job designs that make extended absence costly for career progression. Similarly, although employees have the right to request flexible working, such arrangements are often less available in senior or progression-rich roles, and organisational norms may discourage their use. Furthermore, women may avoid requesting flexibility due to fear of stigma or adverse career consequences (Benny and others, 2021; Godfrey, 2017). As a result, the limited impact of these policies stems not simply from individual reluctance, but from the way jobs are structured and flexibility is embedded within organisations.
Organisational culture and implicit bias further constrain policy effectiveness. Persistent gender norms, stereotypes, and undervaluation of women’s work can limit the impact of formal equal pay and promotion policies (Leoncini and others, 2023; Dias and others, 2018). Bias in performance evaluation and promotion decisions can negate gains from initiatives such as pay transparency, mentoring programs, or structured promotion processes if the underlying organisational culture does not actively support gender equality (Ciminelli and others, 2021; Troeger and others, 2020). Additionally, policies targeting occupational segregation may be limited if they rely solely on voluntary compliance or awareness-raising, rather than enforceable measures (Healy and others, 2019). In some cases, part-time and flexible roles remain concentrated in lower-paid positions, potentially reinforcing pay disparities rather than reducing them (Jones and others, 2023).
9.2 Enablers
Strong legislative and regulatory frameworks can substantially enhance the effectiveness of interventions. Robust enforcement of equal pay legislation, combined with mandatory pay audits and gender pay gap reporting, creates accountability and provides a clear mechanism for identifying and addressing pay disparities within organisations and across sectors (Morin, 2025; Blundell and others, 2025). Embedding gender considerations into statutory obligations, for example through gender mainstreaming requirements, can further ensure policies are systematically applied and monitored (Parken and Ashworth, 2019).
The alignment of family-friendly and labour market policies strengthens impact. Co-ordinated interventions, such as affordable childcare, parental leave reform, flexible working arrangements, and pay transparency, are more effective than isolated measures (Budig and others, 2016; Cukrowska-Torzewska and Lovász, 2020). Encouraging fathers’ involvement in caregiving responsibilities helps redistribute the family burden, enabling mothers to maintain full-time employment and access high-quality, career-advancing roles.
Finally, evidence-informed implementation is a significant facilitator. Policies that are data-driven, monitored, and adapted based on workforce analytics or linked employer–employee data are more likely to lead to measurable reductions in pay gaps (Jewell and others, 2018; Lindley, 2016). Tailoring interventions to sectoral and occupational contexts increases their relevance and uptake, particularly in male-dominated or high-pay sectors where structural and cultural barriers are more entrenched.
10. Potential areas for intervention
Based on our literature review, we provide here some potential interventions for reducing the GPG in the UK.
Reviewing potential barriers to affordable childcare and parental leave uptake
Such initiatives could enable continuous maternal labour market participation by increasing access to affordable, high-quality childcare for children under 3 years old. SPL could be reformed to include higher pay rates, simpler eligibility, and longer, flexible leave for fathers, encouraging greater uptake and more equitable distribution of caregiving. By supporting mothers to maintain full-time work and involving fathers in childcare, these measures could reduce experience-driven pay gaps and mitigate the motherhood penalty.
Encouraging women’s access to senior roles through mentoring, structured promotion, and bias-aware evaluations
These policies could help address vertical segregation and biased promotion through structured career pathways, mentoring and sponsorship programs, and bias-aware performance evaluations. An expansion of public sector gender targets and initiatives to increase women’s representation on boards could increase female representation in decision-making roles. Embedding these practices in organisational culture could help women progress at the same rate as men and access high-pay.
Exploring ways to encourage high-quality part-time and flexible roles in career-advancing positions
To reduce the impact of motherhood penalty and to support continuous career progression, employers could embed high-quality, part-time and flexible options across senior and high-responsibility roles. Flexible arrangements, such as hybrid work, adjustable hours, or job-sharing, could be mainstreamed, thus ensuring employees retain access to promotions, training, and high-impact projects. Performance evaluation could focus more on output and results, rather than hours of work, and part-time employees could be enabled to accrue experience and progression opportunities equivalent to full-time colleagues. Public sector and large private sector organisations could pilot such initiatives, providing mentoring, sponsorship, and structured career support to ensure flexible work does not compromise pay, status, or long-term career trajectories.
11. Conclusions
This report provides an updated and comprehensive assessment of the main contributors to the UK GPG in the UK between 2009 and 2023, using the longitudinal data from UKLHS. By examining work history, occupation, industry, education and other important factors, the analysis sheds light on how and why pay differences between men and women persist, and how their underlying causes have evolved over time.
The findings show that unobserved gender-related factors remain the largest single contributor to the gap, as in Olsen (2010). Alongside this, occupation and work experience continue to play a central role. Men remain more likely to work in higher-paid occupations and to accumulate longer periods of continuous full-time employment, both of which are strongly associated with higher pay. While years of education and part-time work reduce the gap, the effect of part-time work is not always in the expected direction, suggesting complex relationships between working patterns and pay.
Over the period analysed, the importance of different drivers has fluctuated, but the relative importance of the main drivers identified – occupation and work experience – has not changed. Occupation and industry differences continue to explain a significant share of the GPG, highlighting the enduring role of labour market segregation of men and women into different types of jobs. Full-time work experience consistently contributes to the GPG, indicating that differences in accumulated employment histories between men and women remain an important explanatory factor.
Analysis across the wage distribution reveals that both the sources and the mechanisms of the GPG vary between lower-paid and higher-paid workers. Among lower earners, differences in characteristics, particularly full-time and part-time experience, account for a substantial share of the gap. This indicates that gendered patterns of employment remain central to women’s pay disadvantage at the bottom of the pay scale. The analysis suggests that women face growing unexplained pay penalties as they progress up the earnings distribution.
Occupational sorting emerges as a significant mechanism through which pay inequality is generated. Women’s concentration in lower-paid occupations reduces their average pay, while differences in pay within the same occupations play a smaller role in comparison. This points to barriers in access to higher-paid roles, rather than unequal pay for the same job, as a major source of inequality. In addition, the analysis shows that education and experience are not rewarded uniformly for men and women, and that these differences vary across the pay distribution.
Overall, the findings confirm that the GPG is shaped by a combination of factors, including work history, occupational segregation, and unequal progression. While progress has been made, structural inequalities in the labour market continue to limit women’s pay and career development. Addressing the GPG therefore requires sustained policy action to support continuous employment, reduce occupational segregation, and improve access to progression and senior roles.
The findings of this report highlight several priorities for future research. Differences in occupation are the single most important factor explaining the GPG. The occupational distribution by sex has changed very little over the last 15 years, despite women now achieving higher levels of education than men. This raises important questions about why women are more likely to enter jobs in low pay occupations and industries, and why higher educational attainments do not translate into higher paid jobs. Further research is needed to understand the mechanisms driving occupational choice.
A related issue is whether women’s educational careers lead to less well-paid occupations. The data used in this report do not include information on the field of study and do not allow addressing this question. Future research that links education subjects and labour market outcomes could help clarify this relationship.
Differences in work experience are the second largest factor associated with the GPG. These differences are closely related to the women’s greater likelihood of taking career breaks and working part time. This in turn reflects the division of caring responsibilities within households and the availability of child support services. Further research is needed to improve our understanding of how family roles and institutional support affect gender differences in work experience.
A substantial share of the estimated pay gap remains unexplained in our analysis (around 50%). While our econometric model included all the variables that are typically used in decomposition analyses, there may still be scope to incorporate additional factors. The UKHLS is a rich dataset with detailed information on individual and household characteristics, and it is possible that further variables could be constructed from it to better account for the gap.
At the same time, the UKHLS has important limitations, some of which are inherent to surveys. For instance, it does not include information on the type of undergraduate education or on the division of labour within occupation, both of which could help explain pay differences. Some of these gaps could be addressed through relatively modest extensions to the survey, for example collecting more detailed data on type of undergraduate degree, whereas others, such as information on task allocation within jobs, would require more specialised data collection. Finally, certain determinants of the pay gap are inherently difficult to capture using standard survey data. Factors such as employers’ discriminatory attitudes or employees’ preferences are typically unobserved and are better studied through experimental or more specialised research designs.
The review of the drivers has highlighted that the GPG is a complex phenomenon. The size of the gap varies across the wage distribution and the factors associated with the gap differ between lower-paid and highly-paid workers. This suggests that there is no single policy or intervention that can be expected to substantially reduce the GPG once enacted. In this regard, we notice the scarcity of evidence on the impact of specific policies and interventions. While there is substantial literature on measuring the GPG and identifying its potential drivers, there is much less evidence on the effectiveness of both large-scale policies and small-scale interventions. In particular, we found no systematic review that synthesises the evidence on the effectiveness of interventions to reduce the GPG. Conducting such a review would be useful not only to understand what works under what circumstances, but would also support the development of a clearer framework of policy options available to policy makers.
Another potential source of complexity is intersectionality. The gender pay gap, and the factors behind it, may differ across groups of people that face barriers to accessing the labour market for other reasons, such as ethnicity or disability. Analysing this would require estimating gender pay gap models which include interactions with these social characteristics. This was beyond the scope of our work, but it is an important area for future research.
Our own analysis, together with our review of the evidence also highlighted significant differences in published estimates of the gender pay gap. Studies often report different levels, trends, and explanations for the gap. These differences mainly arise from the use of different datasets, different econometric models, and other modelling choices, and estimates appear to be highly sensitive to these choices. An important area of future research is therefore to assess how sensitive estimates are to modelling decisions, and to better understand the uncertainties around published figures once these factors are taken into account.
Glossary
Collective bargaining
A process where workers, often through unions, negotiate pay with employers.
Confidence interval
A range of values that is likely to include the true estimate of a statistical model. It reflects the uncertainty surrounding the estimate.
Composition effect
In Oaxaca decomposition analysis it refers to the component of the gap explained by differences in characteristics (such as education and occupation) between men and women, and therefore “explained”.
Decomposition analysis
A statistical method used to break down the gender pay gap into parts explained by differences in individual characteristics (such as for example education, occupation, and union membership) and parts that remain unexplained.
Distribution analysis
An approach that examines pay differences across the whole pay distribution, for example among low-paid and high-paid workers, rather than focusing only on averages.
Glass ceiling
Invisible barriers that prevent women from accessing highly paid jobs or senior positions even when they have similar characteristics to men.
Human capital factors
Individual characteristics such as education, skills, and years of work experience that affect productivity and pay.
Institutional factors
Characteristics of the job or workplace that influence pay, such as union membership, firm size and industry.
Motherhood penalty
The reduction in women’s pay associated with having children, often resulting from career breaks and reduced working hours.
Oaxaca decomposition
An econometric technique that separates the gender pay gap into an “explained” component due to differences in characteristics (such as for example education, occupation, and union membership) and an “unexplained” component due to difference in rewards for the same characteristics.
Occupation sorting
The process by which individuals self-select or are guided into different occupations.
Occupational segregation
The unequal distribution of women and men across different occupations and industries.
Pay structure effect
In Oaxaca decomposition analysis it refers to the component of the gap due to differences in remuneration for the same characteristics, and therefore “unexplained”.
Unexplained component
The part of the gender pay gap that cannot be explained by differences in observed characteristics, such as education and occupation, and that reflects discrimination and other unobserved factors.
Unobserved factors
Relevant characteristics that affect wages (such as cultural attitudes, innate preferences, or psychological traits), that are not captured in the data.
Work experience
The amount of time an individual has spent in paid work, often linked to pay and career progression.
References
Amer-Mestre, J., and Charpin, A. (2021). Gender Differences in Early Occupational Choices: Evidence from Medical Specialty Selection. SSRN Electronic Journal.
Armin Falk, Johannes Hermle, Relationship of gender differences in preferences to economic development and gender equality. Science 362, eaas9899(2018).
Andrew, A., Bandiera, O., Costa Dias, M. and C. Landais (2024). Women and men at work, Oxford Open Economics, Vol. 3, 1294-i322.
Arulampalam, W., Booth, A. L., and Bryan, M. L. (2007). Is there a glass ceiling over Europe? Exploring the Gender Pay Gap across the wage distribution. Industrial and Labor Relations Review, 60(2), 163-186.
Avram, S., Harkness, S., and Popova, D. (2024). Gender and Parenthood Differences in Job Mobility and Pay Progression in the UK. Social Forces, 103, 429 - 448.
Bennedsen, M., Larsen, B., and Wei, J. (2023). Gender wage transparency and the gender pay gap: A survey. Journal of Economic Surveys.
Benny, L., Bhalotra, S. R., and Fernández, M. (2021). Occupation flexibility and the graduate gender wage gap in the UK (No. 2021-05). ISER Working Paper Series.
Bertrand, M., and Mullainathan, S. (2004). Are Emily and Greg more employable than Lakisha and Jamal? A field experiment on labor market discrimination. American economic review, 94(4), 991-1013.
Bishu, S. G., and Alkadry, M. G. (2017). A systematic review of the Gender Pay Gap and factors that predict it. Administration & Society, 49(1), 65-104.
Black, S. E., and Spitz-Oener, A. (2010). Explaining women’s success: Technological change and the skill content of women’s work. Review of Economics and Statistics, 92(1), 187–194.
Blackburn, R. M., Brooks, B., and Jarman, J. (2001). The vertical dimension of occupational segregation. Work, Employment and Society, 15(3), 511-538.
Blau, F. D., and Kahn, L. M. (2017). The gender wage gap: Extent, trends, and explanations. Journal of economic literature, 55(3), 789-865.
Block, P. (2023). Understanding the self-organization of occupational sex segregation with mobility networks. Soc. Networks, 73, 42-50.
Blundell, J. (2020). Wage Responses to Gender Pay Gap Reporting Requirements. WGSRN: Gender Disparity (Topic).
Blundell, J., Duchini, E., Simion, Ş., and Turrell, A. (2025). Pay transparency and gender equality. American Economic Journal: Economic Policy, 17(2), 418-445.
Blundell, R., Costa Dias, M., Meghir, C., and Shaw, J. (2016). Female labor supply, human capital, and welfare reform. Econometrica, 84(5), 1705-1753.
Brewer, M., and Wren-Lewis, L. (2012). Accounting for changes in income inequality: Decomposition analyses for Great Britain, 1968-2009 (No. 2012-17). ISER Working Paper Series.
Brewer, M., Cattan, S., Crawford, C., and Rabe, B. (2016). Free Childcare and Parents’ Labour Supply: Is More Better? (No. 10415). IZA Discussion Papers.
Brynin, M. (2017). The Gender Pay Gap. Equality and Human Rights Commission (EHRC)
Brynin, M., and Perales, F. (2016). Gender Wage Inequality: The De-gendering of the Occupational Structure. European Sociological Review, 32, 162-174.
Bryson, A., Forth, J., Phan, V., Singleton, C., Ritchie, F., Whittard, D., and Stokes, L. (2025). The Representativeness of the Annual Survey of Hours and Earnings and its Implications for UK Wage Policy. British Journal of Industrial Relations.
Budig, M., Misra, J., and Boeckmann, I. (2016). Work–Family Policy Trade-Offs for Mothers? Unpacking the Cross-National Variation in Motherhood Earnings Penalties. Work and Occupations, 43, 119 - 177.
Burton, J., Nandi, A., and Platt, L. (2010). Measuring ethnicity: challenges and opportunities for survey research. Ethnic and racial studies, 33(8), 1332-1349.
Canon, M. E., Golan, L., and Smith, C. A. (2021). Understanding the Gender Earnings Gap: Hours Worked, Occupational Sorting, and Labor Market Experience. FRB of St. Louis Review.
Chernozhukov, V., Fernández-Val, I., and Luo, S. (2018). Distribution regression with sample selection, with an application to wage decompositions in the UK. arXiv preprint arXiv:1811.11603.
Chung, H., and Van der Horst, M. (2020). Flexible working and unpaid overtime in the UK: The role of gender, parental and occupational status. Social Indicators Research, 151(2), 495-520.
Cinelli, C., Forney, A., and J. Pearl (2024). A Crash Course in Good and Bad Controls, Sociological Methods and Research, Vol. 53(3), 1071-1104.
Ciminelli, G., Schwellnus, C., and Stadler, B. (2021). Sticky floors or glass ceilings? The role of human capital, working time flexibility and discrimination in the gender wage gap.
Clifton‐Sprigg, J., Fichera, E., Kaya, E., and Jones, M. (2025). Fathers taking leave: evaluating the impact of shared parental leave in the United Kingdom. Fiscal Studies.
Correll, S. J., Benard, S., and Paik, I. (2007). Getting a job: Is there a motherhood penalty?. American journal of sociology, 112(5), 1297-1338.
Costa Dias, M., Joyce, R., and Parodi, F. (2020). The Gender Pay Gap in the UK: children and experience in work. Oxford Review of Economic Policy, 36(4), 855-881.
Cukrowska-Torzewska, E., and Lovász, A. (2020). The role of parenthood in shaping the gender wage gap - A comparative analysis of 26 European countries.. Social science research, 85, 102355 .
Dai, M. (2025). Gender Discrimination in the Workplace and Ways to Reduce Wage Gap. Advances in Economics, Management and Political Sciences.
Davies, R., and Pierre, G. (2005). The family gap in pay in Europe: a cross-country study. Labour Economics, 12, 469-486.
Dias, M., Joyce, R., and Parodi, F. (2018). The gender pay gap in the UK: children and experience in work. Oxford Review of Economic Policy.
Duchini, E., Simion, S., Turrell, A., and Blundell, J. (2020). Pay Transparency and Gender Equality. American Economic Journal: Economic Policy.
Eagly, A. H., and Karau, S. J. (2002). Role congruity theory of prejudice toward female leaders. Psychological review, 109(3), 573.
Fagan, C., and Norman, H. (2016). Which fathers are involved in caring for preschool-age children in the United Kingdom? A longitudinal analysis of the influence of work hours in employment on shared childcare arrangements in couple households. In Balancing work and family in a changing society: The fathers’ perspective (pp. 83-98). New York: Palgrave Macmillan US.
Falk, A., and Hermle, J. (2018). Relationship of gender differences in preferences to economic development and gender equality. Science, 362(6412), eaas9899.
Firpo, S. P., Fortin, N. M., and Lemieux, T. (2018). Decomposing wage distributions using recentred influence function regressions. Econometrics, 6(2), 28.
Firpo, S., and Pinto, C. (2016). Identification and estimation of distributional impacts of interventions using changes in inequality measures. Journal of Applied Econometrics, 31(3), 457-486.
Firpo, S., Fortin, N. M., and Lemieux, T. (2009). Unconditional quantile regressions. Econometrica, 77(3), 953-973.
Forth, J., Bryson, A., Phan, V., Ritchie, F., Singleton, C., Stokes, L., and Whittard, D. (2025). The representativeness of the Annual Survey of Hours and Earnings and its implications for UK wage policy. British Journal of Industrial Relations.
Francis-Devine, B., Zaidi, K., ad A. Murray (2026). Women and the UK economy. Research Briefing, House of Commons Library.
Gamage, D. K., Kavetsos, G., Mallick, S., and Sevilla, A. (2020). Pay transparency initiative and Gender Pay Gap: Evidence from research-intensive universities in the UK (No. 13635). IZA Discussion Papers.
Gash, V., Olsen, W., Kim, S., and Zwiener-Collins, N. (2025). Decomposing the barriers to equal pay: examining differential predictors of the Gender Pay Gap by socio-economic group. Cambridge Journal of Economics, beaf025.
Ge, S. (2025). Examining the Gender Pay Gap in the UK. Advances in Economics, Management and Political Sciences.
Godfrey, N. S. (2017). Who benefits from flexible working? Gender and socioeconomic inequalities in ‘flexible’work.
Grassi, E., and Savioli, M. (2025). Breaking the glass ceiling? The gender wage gap in research-oriented careers for PhD graduates. Higher Education.
Grimshaw, D., and Rubery, J. (2007). Undervaluing women’s work. Equal Opportunities Commission Working Paper Series, No. 53. Manchester: European Work and Employment Research Centre.
Grönlund, A., and Magnusson, C. (2016). Family-friendly policies and women’s wages – is there a trade-off? Skill investments, occupational segregation and the gender pay gap in Germany, Sweden and the UK. European Societies, 18, 91-113.
Healy, G., Pfefer, E., and Sevilla, A. (2024). Women’s representation and the Gender Pay Gap: rank, institutional research intensity and ethnicity in UK business schools. In Research Handbook on Inequalities and Work (pp. 157-179). Edward Elgar Publishing.
Heilman, M. E. (2012). Gender stereotypes and workplace bias. Research in organizational Behavior, 32, 113-135.
Hegewisch, A., and Hartmann, H. (2014). Occupational Segregation and the Gender Wage Gap: A Job Half Done.
House of Commons Education, Skills and the Economy Committee. (2019). The apprenticeships ladder of opportunity: quality not quantity: Government Response to the Committee’s Sixth Report of Session 2017–19. UK Parliament.
House of Commons Science and Technology Committee. (2023). Diversity and inclusion in STEM (Fifth Report of Session 2022–23, HC 95). UK Parliament.
Jewell, S., Razzu, G., and Singleton, C. (2018). Who Works for Whom and the UK Gender Pay Gap. ERN: Other Organizations & Markets: Decision-Making in Organizations (Topic).
Jones, L. (2019). Women’s progression in the workplace, a rapid evidence review for the government equalities office.
Jones, L., Cook, R., and Connolly, S. (2023). Parenthood and Job Quality: Is There a Motherhood Penalty in the UK?. Social Indicators Research, 170, 765 - 792.
Jones, M., and Kaya, E. (2024). The Gender Pay Gap in medicine: evidence from Britain. Oxford Economic Papers, 76(4), 1033-1051.
Joshi, H., Bryson, A., Wilkinson, D., and Ward, K. (2019). The Gender Gap in Wages over the Life Course: Evidence from a British Cohort Born in 1958. Macroeconomics: Employment.
Kee, H. J. (2006). Glass ceiling or sticky floor? Exploring the Australian Gender Pay Gap. Economic Record, 82(259), 408-427.
Kim, S. (2025). Cohort Differences in the Lifetime Parenthood Gender Pay Gap in the UK: An Accelerated Cohort-Sequential Growth Curve Approach. Social Indicators Research, 179, 201 - 234.
King, J., Mendoza, M., Penner, A., Rainey, A., and Tomaskovic-Devey, D. (2023). Estimating Firm-, Occupation-, and Job-Level Gender Pay Gaps with U.S. Linked Employer-Employee Population Data, 2005 to 2015. Socius, 9.
Kleven, H., Landais, C., and Søgaard, J. E. (2019). Children and gender inequality: Evidence from Denmark. American Economic Journal: Applied Economics, 11(4), 181-209.
Lauer, C. (2000). Gender wage gap in West Germany: how far do gender differences in human capital matter? (No. 00-07). ZEW Discussion Papers.
Leaker (2008), The Gender Pay Gap in the UK. Economic and Labour Market Review, Vol. 2, No 4
Leoncini, R., Macaluso, M., and Polselli, A. (2023). Gender segregation: analysis across sectoral dominance in the UK labour market. Empirical Economics, 67, 2289 - 2343.
Leoncini, R., Macaluso, M., and Polselli, A. (2023). Gender segregation: analysis across sectoral dominance in the UK labour market. Empirical Economics, 67, 2289 - 2343.
Leoncini, R., Macaluso, M., and Polselli, A. (2024). Gender segregation: analysis across sectoral dominance in the UK labour market. Empirical Economics, 67(5), 2289-2343.
Lindley, J. (2016). Lousy Pay with Lousy Conditions: The Role of Occupational Desegregation in Explaining the UK Gender Pay and Work Intensity Gaps.. Oxford Economic Papers-new Series, 68, 152-173.
Lindley, J. (2016). Lousy Pay with Lousy Conditions: The Role of Occupational Desegregation in Explaining the UK Gender Pay and Work Intensity Gaps.. Oxford Economic Papers-new Series, 68, 152-173.
Longhi, S., and Brynin, M. (2017). The ethnicity pay gap. Equality and Human Rights Commission.
Lu, Y. (2025). The Dynamic Evolution of the Gender Pay Gap: The Dual Mechanism of Occupational Segregation and Family Division of Labor. American Journal of Business, Commerce and Economics.
Manning, A., and Petrongolo, B. (2008). The part‐time pay penalty for women in Britain. The economic journal, 118(526), F28-F51.
Matysova, C. (2024). Exploring (in)congruence between academic employers and academic parents’ aspirations for, and enactment of, gender justice in relation to family leave. SOCIOLOGIA DEL LAVORO.
Morin, S. (2025). The Gender Pay Gap: A Persistent Socioeconomic Challenge. SocioEconomic Challenges.
Mumford, K., and Smith, P. (2007). The Gender Earnings Gap in Britain: Including the Workplace. The Manchester School, 75, 653-672.
Mumford, K., and Smith, P. N. (2007). The gender earnings gap in Britain: including the workplace. The Manchester School, 75(6), 653-672.
Office for National Statistics. (2023). Gender Pay Gap in the UK: 2023. https://www.ons.gov.uk/employmentandlabourmarket/peopleinwork/earningsandworkinghours/bulletins/genderpaygapintheuk/2023
Office for National Statistics. (2025). Gender Pay Gap in the UK: 2025 (ASHE estimates). Retrieved from Office for National Statistics website:
Olsen, W. K., and Walby, S. (2004). Modelling Gender Pay Gaps.
Olsen, W., Gash, V., Sook, K., and Zhang, M. (2018). The Gender Pay Gap in the UK: evidence from the UKHLS.
Olsen, W., Gash, V., Vandecasteele, L., Walthery, P., and Heuvelman, H. (2010). The Gender Pay Gap in the UK 1995-2007: research report number 1.
Parken, A., and Ashworth, R. (2019). From evidence to action: Applying gender mainstreaming to pay gaps in the Welsh public sector. Gender, Work and Organization, 26, 599-618.
Patnaik, A. (2019). Reserving time for daddy: The consequences of fathers’ quotas. Journal of Labor Economics, 37(4), 1009–1059.
Perales, F. (2013). Occupational sex-segregation, specialized human capital and wages: evidence from Britain. Work, Employment & Society, 27, 600 - 620.
Petrongolo, B., and Ronchi, M. (2020). Gender Gaps and the Structure of Local Labor Markets. CEPR Discussion Paper Series.
Race Disparity Unit. (n.d.). List of ethnic groups. Ethnicity Facts and Figures. from https://www.ethnicity-facts-figures.service.gov.uk/style-guide/ethnic-groups/
S. Lissenburgh. “Gender Discrimination in the Labour Market: Evidence from the BHPS and EiB Surveys, Research Discussion Paper 3,” 2008.
Scott, A., Frankort, H., and Bacon, N. (2025). Occupations, Job Levels, and the Gender Pay Gap: Evidence From Private-Sector Firms in the UK. Academy of Management Proceedings.
Stern, C., and Madison, G. (2022). Sex differences and occupational choice Theorizing for policy informed by behavioral science✰. Journal of Economic Behavior & Organization.
Stewart, K., and Waldfogel, J. (2017). Closing gaps early. Childcare Resource and Research Unit.
Stoet, G., and Geary, D. C. (2018). The gender-equality paradox in science, technology, engineering, and mathematics education. Psychological Science, 29(4), 581–593.
Stokke, H. E. (2016). The gender wage gap and the early-career effect. Department of Economics, Norwegian University of Science and Technology.
Thomson, V. (2006). How Much of the Remaining Gender Pay Gap is the Result of Discrimination, and How Much is Due to Individual Choices?. .
Troeger, V., Di Leo, R., Scotto, T., and Epifanio, M. (2020). The Motherhood Penalties : Insights from Women in UK Academia. .
Woodhams, C., Trojanowski, G., and Wilkinson, K. (2022). Merit sticks to men: Gender Pay Gaps and (In) equality at UK Russell Group Universities. Sex Roles, 86(9), 544-558.
Xiu, L., and Gunderson, M. (2014). Glass ceiling or sticky floor? Quantile regression decomposition of the Gender Pay Gap in China. International Journal of Manpower, 35(3), 306-326.
Zamberlan, A., and Barbieri, P. (2023). A ‘potential motherhood’ penalty? A longitudinal analysis of the wage gap based on potential fertility in Germany and the United Kingdom. European Sociological Review.
Zuazu, I. (2018). Cultural values, family decisions and gender segregation in higher education: Evidence from 26 OECD economies (Working Paper Series IL. 107/18). University of the Basque Country, Departamento de Fundamentos del Análisis Económico I.
Appendix 1: Data and methodology
A.1 Data and variables used
A.1.1 The sample
We use 15 waves of the UKHLS data (2009 to 2023). UKHLS waves collect data over 3 years, for example the wave one of 2009 includes data collected in 2009, 2010, and 2011. We reorganise the data by year rather than by survey to analyse trends in the gender pay gap over years. To assign an observation to a specific year we used the data of interview which is contained in the variable intdaty_dv.
The table below shows the number of observations available per year and the observations available for the analysis after removing a) individuals younger than 16 and 65 and older, b) individuals who are not in paid employment (thus excluding self-employed, unemployed, full-time students, retired, people in care, on apprenticeships, or other including refusals to answer).
| Year | Individuals | Analytical sample |
|---|---|---|
| 2009 | 25402 | 11599 |
| 2010 | 55000 | 24988 |
| 2011 | 52898 | 24206 |
| 2012 | 47636 | 21766 |
| 2013 | 45017 | 20786 |
| 2014 | 43223 | 19966 |
| 2015 | 43233 | 20033 |
| 2016 | 41627 | 19380 |
| 2017 | 37418 | 17375 |
| 2018 | 35485 | 16372 |
| 2019 | 33934 | 15630 |
| 2020 | 31628 | 14418 |
| 2021 | 28873 | 13164 |
| 2022 | 29949 | 14140 |
| 2023 | 16629 | 7730 |
A.1.2 Sampling weights
The data includes sampling weights, which should be used in all the analysis. The weights are the combination of base weights (the inverse probability of selection in the sample) and non-response adjustments. The non-response adjustments are obtained through inverse probability weighting (IPW): responses are regressed against explanatory characteristics, and base weights are adjusted by the inverse of the probability of responding. In this way, individuals that are less likely to respond are given more weight.
Sampling weights are base weights adjusted by the wave-specific IPW for non-response. However, when using calendar year data, the base weight should be better adjusted using the IPW calculated separately for each of the waves contributing to a calendar year. Starting in 2020 calendar year data are provided that include weights calculated in this way. For example, the calendar year data of 2020 includes data of the 2018, 2019, and 2020 waves, and the IPW are separately calculated for the 3 waves.
Calendar year weights adjusted in this way are only available from 2020 onward. We therefore use the sampling weights adjusted by the wave-specific IPW for non-response provided in the wave datasets. Simple mean calculations for a number of variables show that the estimates obtained using the 2 set of weights are very similar, and that they differ greatly from the unweighted estimates. We therefore employ the alternative weights because using unweighted data would be a larger source of error.
A.1.3 Variables
This section identifies the main variables used in the analysis. We use all 14 waves of the UKLHS dataset which covers the period 2009 to 2023. It is important to note that one wave of Understanding Society data does not correspond exactly to a single calendar year, rather each wave spans approximately 2 calendar years, with overlap between waves. Despite this, each individual is interviewed once per year. For example, if an individual is interviewed in January 2009 for wave one, the same individual will be interviewed in January 2010, for wave 2. For this analysis, we use calendar years rather than waves, as it is more intuitive. We merge the 14 waves of UKLHS data, so we can track individuals over time.
A.1.4 Dependent variable
To model the GPG, we construct wage measures using respondents’ reported usual gross monthly pay in their current main job (w_paygu_dv). We exclude self-employment income from this measure. Although the survey records gross self-employment earnings, these data often produce implausible values, including extremely low reported wages of £1 reflecting volatility and measurement error. Consistent with previous research (Brewer and Wren-Lewis, 2012; Blundell and others, 2016; Olsen and others, 2018), we therefore omit self-employment income from our wage construction. The literature highlights multiple sources of inaccuracy in self-employment reporting, including under-reporting, irregular or volatile income flows, the deduction of business expenses, and instances where earnings are reported at the household rather than individual level. For these reasons, self-employed workers are typically treated separately in pay gap analyses.
Hourly wages are derived as follows. We divide monthly earnings at the main job by usual weekly hours of work at the main job multiplied by 4.33, the average number of weeks per month. Cases where respondents report zero or missing values for pay or hours are treated as missing. Given the presence of reporting error and extreme values, we normalise the distribution by taking the natural logarithm of hourly wages and exclude observations more than 4 standard deviations from the mean. We then inspect the resulting distribution by plotting the density of log wages.
A.1.5 Independent variables
A.1.5.1 Human capital
We proxy years of schooling using the variable hiqual_dv. The variable reports highest qualification ever reported. Highest level of qualification includes, degree, other degree, A-level, GCSE, other qualification and no qualification. In our analysis, we changed the categorical variable representing respondents’ highest educational qualification into a numerical measure of years of education. We created a new variable “years of education” and recoded each category of the original variable “hiqual_dv” into the typical number of years associated with that qualification, for example, 16 years of education for a degree, 19 years for a higher degree, 13 years for A-levels, 11 years for GCSEs, 10 years for other qualifications, and 9 years for no qualification.
We calculate years of work experience based on cumulative spells of paid employment reported at the interview date. This includes self-employment, paid employment, and apprenticeships. The variable is only constructed for individuals with at least some paid employment experience. By aggregating the duration of these spells, we obtain an estimate of total work experience.
A.1.5.2 Occupation and industry
For our analysis, we excluded individuals who are self-employed, consistent with previous labour market and pay gap studies (Brewer and Wren-Lewis, 2012; Manning and Petrongolo, 2008). Self-employed workers often have distinct employment characteristics and more variable or inconsistently reported earnings, which reduce comparability with employees.
The variables jbsect and jbsectpub in Understanding Society capture the type of organisation in which respondents are employed. In its original form, jbsect distinguishes between “private firm or business, a limited company” and “other type of organisation”. Jbsectpub includes various categories in the second and third sectors as well as public limited companies. For the purposes of this analysis, these variables were combined into one, in which their detailed categories were consolidated into 2 broader employment sectors to support interpretation and comparability:
- public sector, comprising central and local government, the NHS, universities, and other publicly funded organisations
- private sector, encompassing private and public limited companies, and Other or Charity sector, which includes charities, voluntary organisations, and other non-profit institutions
We include this variable because sector of employment is an important determinant of wages and GPGs, with public sector generally showing lower pay dispersion and smaller gender differentials than the private sector (Manning and Petrongolo, 2008; Brynin, 2017; ONS, 2023).
The variable jbft_dv in Understanding Society identifies whether a respondent is employed on a full-time or part-time basis. According to the survey definition, full-time employment is defined as working more than 30 hours per week, based on total hours including both normal and overtime work. This measure is derived from respondents’ self-reported weekly working hours, as recorded during the interview. Respondents were classified into 2 mutually exclusive categories: full-time and part-time employees. Distinguishing between these groups is analytically important, as working hours represent a significant determinant of earnings and career outcomes. Part-time workers typically face lower hourly wages and more limited opportunities for advancement compared with their full-time counterparts. Controlling for full-time versus part-time status is therefore standard practice in research on the GPG (Brynin, 2017; ONS, 2023), enabling a more accurate assessment of the relationship between working hours and pay disparities.
Firm size was derived from the survey variable jbsize, which records categorical information on the number of employees in the respondent’s workplace. To construct a consistent measure, the categories were recoded into 4 groups: firms with fewer than 25 employees (labelled as micro firms), firms with 25 to 49 employees (labelled as small), firms with 50 to 499 employees (labelled as medium), and firms with 500 or more employees (labelled as large firms). Specifically, responses coded as 1, 2, 3, and 10 were classified as firms with fewer than 25 employees. Category 4 was assigned to the 25 to 49 group. Categories 5, 6, and 7 were combined to represent firms with 50 to 499 employees. Categories 8, 9, and 11 were grouped as firms with 500 or more employees. Responses indicating missing, refusal, or “don’t know” (coded as –9, –8, –7, –2, –1) were treated as missing values. The final variable was specified as an ordered factor, with the smallest firms (“fewer than 25 employees”) as the reference category.
Union membership was constructed from the survey variable tuin1, which identifies whether the respondent is currently a member of a trade union or staff association. Respondents who answered “yes” (tuin1 = 1) were coded as union members, while those who answered “no” (tuin1 = 2) were coded as non-members. Individuals coded as “inapplicable” (tuin1 = –8) were also coded as non-members, recognising that this response may reflect situations in which the question was not relevant (for example, where union membership could not apply to the respondent’s job). Cases where responses were missing, refused, or recorded as “don’t know” (tujbpl = –9, –7, –2, –1) were treated as missing values. The final variable was defined as a categorical factor with 3 levels: “Yes,” “No,” and “Inapplicable.”
Occupational segregation was derived using the Standard Occupational Classification (SOC 2000) codes reported in the survey. The raw 4-digit SOC codes (jbsoc00_cc) were converted into one-digit and 2-digit codes to capture major and sub-major occupational groupings, respectively. At the one-digit level, 9 major occupational groups were identified (for example, “Managers and senior officials,” “Professional occupations,” “Skilled trades,” “Elementary occupations”). At the 2-digit level, 26 sub-major groups were distinguished (for example, “Health professionals,” “Skilled construction and building trades,” “Administrative occupations”).
To measure the degree of gender segregation across occupations, the sample was stratified by 2-digit SOC codes and the proportion of male and female workers in each group was calculated. A binary indicator for sex (male = 1, female = 0) was constructed, and group-wise averages were used to compute the share of men (pct_male_2d) and women (pct_female_2d) in each 2-digit occupational category. Missing or invalid SOC codes (for example, “–1”) were excluded from the calculations. The resulting measures provide the gender composition of each occupation at the 2-digit level, allowing the analysis of occupational segregation patterns within the workforce.
A.1.5.3 Demographic factors
We restrict our sample to individuals aged 16 to 64, consistent with standard definitions of the working age population (ONS, 2023) and comparative studies of the UK labour market (Brewer and Wren-Lewis, 2012; Brynin, 2017). In line with the literature, we also include an age squared term to capture potential non-linear effects of age on earnings (Olsen, 2010).
Sex in understanding society is self-reported, and the survey does not provide non-binary sex options. Some respondents did not answer the question, refused to answer or did not know what to answer (we found 8 such cases in the dataset).
Understanding society supports analysis of small populations and minority groups. Alongside the main sample of approximately 28,000 households, the ethnic minority boost includes an additional 4,000 households, oversampling 5 groups: Indians, Pakistanis, Bangladeshis, Caribbeans, and Africans. This design enables comparison between the ethnic minority population and the white majority. However, we note that attrition reduces the size of minority samples in later waves, and we take this into account when incorporating ethnicity as a demographic indicator. The inclusion of ethnicity remains important, particularly given the Office for Equal Opportunities’ interest in exploring ethnic pay gaps in future projects. Originally, the ethnicity variable in the UKHLS data is categorised into 18 ethnic groups. For the purposes of this study, we focus on significant minority groups boosted by the sample, combining ethnic groups with smallest samples together. Although additional samples are included for Caribbean and African ethnic groups in the ethnic minority boost sample, we combine both ethnic groups into one group. We do so based on the literature on pay gaps, which suggests that differences across Caribbean and African groups are relatively small compared to the differences between Indian, Pakistani and Bangladeshi ethnic groups (Longhi and Brynin, 2017). This results in the creation of 10 ethnic groups: White, White Irish, Black, Indian, Pakistani, Bangladeshi, Chinese, Any other Asian background, Mixed, Other. Similar groupings are made in the literature and government classifications (Burton, Nandi and Platt, 2010; GOV.UK, 2021).
The gor_dv variable in Understanding Society indicates the respondent’s Government Office Region (GOR) within the UK. For our analysis, we excluded any invalid or missing responses (codes less than 1) to ensure accurate regional classification. The variable originally includes 12 categories representing all UK regions: North East, North West, Yorkshire and the Humber, East Midlands, West Midlands, East of England, London, South East, South West, Wales, Scotland, and Northern Ireland. This allowed us to account for regional differences in our analysis while maintaining full geographic coverage of the UK.
The variable urban_dv in Understanding Society identifies whether a respondent resides in an urban or rural area. For our analysis, we excluded any invalid or missing responses to ensure accuracy. The variable is derived from geographic data and classifies respondents into 2 categories: urban areas and rural areas. This classification allows us to examine differences in outcomes with respect to area type.
A.1.6 Comparison between our estimates and ONS estimates
Our estimates of the gender pay gap differ slightly from those published by ONS. This partly reflects the use of mean hourly wages in our analysis, compared with median hourly wages in ONS estimates, but it is primarily driven by differences in data sources. The ONS estimates are based on ASHE, which are derived from the HM Revenue and Customs Pay As You Earn (PAYE) register, whereas our estimates are based on the UKHLS data.
Table A1 compares the percentage GPG reported in our analysis (based on UKHLS) with those published by ONS (based on ASHE) for the same years (ONS, 2025). The UKHLS-based estimates are generally lower than the AHSE-based estimates between 2009 and 2019, and higher thereafter. While the precise causes of these differences in magnitudes and trends cannot be fully identified without further analysis, several factors are likely to contribute.
Table A1: Gender pay gap using ASHE and UKHLS data
| Year | ASHE | UKHLS |
|---|---|---|
| 2009 | 18.0 | 20.7 |
| 2010 | 19.2 | 17.4 |
| 2012 | 19.0 | 17.0 |
| 2012 | 18.6 | 17.2 |
| 2013 | 18.1 | 16.4 |
| 2014 | 17.7 | 16.8 |
| 2015 | 17.5 | 15.7 |
| 2016 | 17.3 | 15.6 |
| 2017 | 17.1 | 17.3 |
| 2018 | 16.9 | 16.6 |
| 2019 | 17.3 | 16.4 |
| 2020 | 15.5 | 15.9 |
| 2021 | 15.4 | 16.9 |
| 2022 | 15.1 | 16.8 |
| 2023 | 14.3 | 16.0 |
First, ASHE and UKHLS are collected using different methodologies. ASHE relies on employer-reported payroll data, whereas UKHLS data are collected directly from respondents via interviews. Earnings reported in surveys may not perfectly match employer-reported figures.
Second, ASHE does not include workers not on formal payrolls, such as those engaged in informal or cash-in-hand employment, which are instead captured in the UKHLS and may have different pay structures.
Third, existing evidence suggests that ASHE under-represents jobs in small, young, private sector organisations. For example, Forth and others (2025) apply an alternative weighting scheme to ASHE data to correct for this bias and conclude that the ASHE has underestimated the gender pay gap by around one percentage point over the past 2 decades.
Finally, UKHLS is a longitudinal panel survey whose demographic composition changes over time. Although the data are provided with sample weights, they may not fully correct for all sources of bias associated with panel attrition and demographic change.
Appendix 2: Methodology
A.2.1 Decomposition methodology
The simplest way to calculate the gender pay gap is as the difference between the median hourly earnings of men and women, expressed as a proportion of men’s median earnings. This measure is the unconditional gender pay gap, in the sense that it captures the observed difference in pay between men and women without accounting for differences in characteristics such as occupation, age group, or residence.
The gender pay gap at the mean can be estimated using the following simple regression model:
lnwi = β0 + β1Fi + εi
Where lnwi denotes the logarithm of the hourly wage for individual i, and Fi is an indicator variable equal to 1 if the individual is female and 0 otherwise.
We use the logarithm of wages rather than wages in levels because the wage distribution is highly skewed to the right, with a long upper tail and several high-wage outliers. The logs normalise the distribution of wages. Taking the logs makes the distribution more symmetric around the mean, reduces the influence of outliers, and mitigates heteroskedasticity.
The coefficient β1 is the unconditional gender pay gap at the mean of the wage distribution. This can be seen by considering the difference between average log wages for men and women:
lnwm – lnwf = β0 + εi – β0 – β1 – εi = –β1
Because the model is estimated in logs, the coefficient β1 is only an approximation of the percentage gender pay gap. The exact percentage gap can be obtained from the estimated coefficient using: 100 * (eβ1 – 1).
A substantial share of the observed wage difference between men and women reflects differences in characteristics. For example, women are more likely work part-time, and to be employed in occupations such as education and care, which tend to be lower paid. For this reason, it is important to estimate the conditional gender pay gap, which measures the wage difference between men and women after controlling for observable characteristics.
A simple regression model for estimating the conditional gender pay gap is, for example:
lnwi = β0 + β1F + β2edui + εi
Where edui is the education level of the respondent. In practice, the regression may have a richer set of control variables, such as occupation, hours of work, residence, that explain the variability in wages. When the included regressors are correlated with sex (for example are on average more highly educated than men), the inclusion of the control regressor will alter the estimated coefficient of the sex indicator. Part of the difference that was previously attributed to sex in the unconditional model is now explained by differences in observable characteristics between men and women.
The conditional difference between male and female wages is now:
lnwm – lnwf = β0 + β2edum + εi – β0 – β1 – β2eduf – εi = – β1 + β2(edu/m – edu/f)
The coefficient β2 measures the association between education and wages in the full sample, the increase in hourly wages associated with one additional level (or year) of education. The coefficient β1 now captures the conditional gender pay gap. This measures the wage difference between men and women with similar observed characteristics. The coefficient captures residual differences in wages not explained by observable factors that may include, for example, differences in returns to characteristics, unobserved productivity, or discrimination.
The difference in wages between men and women can now be decomposed in the different components:
Sex: – β1/(lnwm – lnwf)
Education: β2(edu/m – edu/f)/(lnwm – lnwf)
The relative contribution of each factor to the observed gap can be easily calculated to identify the most important factors and to assess the relevance of all unobserved factors that are captured by the sex indicators and that are ‘unexplained’ by the statistical model.
The conditional regression model estimated above assumes that the returns to observable characteristics are the same for men and women. However, returns to characteristics may differ. For example, women could be paid different salaries for the same level of education. To allow for this possibility the model can be extended to include interaction terms between sex and the control variables in the classical Oaxaca-Blinder decomposition model.
Following our previous example:
lnwi = β0 + β1F + β2edui + β3Fedui + εi
In this specification, β2 captures the returns to education for men and β3 captures the difference in returns to education for men and women. Including more covariates and their interactions with sex, allows the wage structure to differ by sex.
The interaction model can be solved to represent the Oaxaca-Blinder decomposition. The expected wages of men and women are:
β0 + β2edui
β0 + β1 + β2edui + β3edui
If we subtract the female mean from the male mean we have the standard Oaxaca decomposition:
lnwm – lnwf = β0 + β2edum – β0 – β1 – β2eduf – β3eduf
= β2(edum – eduf) – β1 – β3eduf
where β3 is the difference in returns to education between men and women and β1 is any residual difference. The first part β2(edum – eduf) is the composition effect and comes from differences in mean characteristics. The second part – β1 – β3eduf is the wage structure effect and reflects different returns to characteristics for men and women. This approach can be useful when there is an interest in understanding how the market values women and men’s characteristics in different ways. It can show that the gender pay gap is systematically related to specific variables but not others.
This additional information comes at the cost of a diminished interpretability of the results. The coefficient of the sex variable in the simpler model has a clean interpretation. It answers the question: how much less do women earn than men with similar observed characteristics? This is often the relevant policy question of interest.
Conversely, the interaction model leading to the Oaxaca decomposition has no single coefficient for the gender gap, and the results are more difficult to report and communicate. From a statistical perspective, the inclusion of interaction terms for all observed characteristics in the model increases the risk of model overfitting, whereby interaction coefficients are estimated using few observations and the model ends up capturing noise. In other words, the interaction model can produce coefficients that are less precise and more sensitive to outliers. These fluctuations may lead to unstable decompositions with large swings between “explained” versus “unexplained” components. In the absence of a specific interest in differences in returns to characteristics between men and women, the simple model is statistically preferable.
A.2.2. Distributional decomposition
In this report we also go beyond the mean and look at whether there are distributional drivers of the GPG. A significant criticism of focusing on the mean only is that it overlooks within-group inequality (Fortin and others, 2011). Looking at the respective distributions, allows us to capture the heterogeneity in the pay gap, whether it is more pronounced at the top or bottom of the distribution, and to identify whether different drivers or protective factors are at play across wage levels (Firpo and others, 2009; Firpo and others, 2018).
To look at the decomposition at the various quantiles, we will follow Firpo and others (2018) who propose a 2-stage procedure. In stage 1 the overall wage gap is separated into 2 components: the price effect, and the quantity effect. The price effect is the differences in returns of the different variables between the groups, while the quantity effect is the differences in the distribution of the explanatory variables themselves This is done with an inverse probability reweighting setup following Firpo and Pinto (2016):
Fg(y) = E(ωg ⋅ I{Y <= y})Fc(y) = E(ωc(g,X) ⋅ I(Y <= y))
Where
ωF(g) = (I{g=F}/p); ωM(g) = (1–I{g=F}/1–p); ωC(g, X) = p(X)/1–p(x) ⋅ 1–I{g=F}/p
Where p = Pr(g = F) is the unconditional probability of being in Female, and p(X) = Pr(g = F|X) is the propensity score, meaning the conditional probability of being Female given the characteristics. FC is the counterfactual distribution constructed by taking the returns of g=M on the characteristics of g=F. In this way the decomposition creates distributions that account for the differences in covariate distribution across the groups.
This first stage creates a counterfactual distribution which puts more weight on males that have similar characteristics (years of education, caring responsibilities), as females. Importantly, these observations are paid according to the returns of the male group creating the counterfactual distribution with female characteristics but male returns.
This counterfactual distribution is then used as an intermediate step between the male and female wage distribution. Importantly, since the counterfactual distribution is valid, we can take any characteristic of its cumulative distribution function, such as quantiles v̂C = v(F̂C). We can then take the usual decomposition, focusing on the different parts of the distribution:
vF – vM⏟Total Gap = vF – vC⏟Wage Structure + vC – vM⏟Composition
The composition effect compares 2 objects that use Male incomes: the only difference is the weighting of characteristics. Hence, it captures how much different the characteristics are between the 2 groups. The wage structure effect compares 2 objects that use female characteristics: the only difference is the way the characteristics are rewarded.
For our sample we ran a probit model on the same specification as the mean Oaxaca-Binder decomposition. The only difference is that instead of log wages being the left-hand side variable, it was the gender variation. We restrict our comparison to every 10th quantile from the 20th to the 80th quantile. We focus on this range, because the more extreme quantiles are more sensitive to the specification being run. In the language of Firpo and others (2018), the reweighting error became too large at the 10th and 90th quantile, meaning that it was difficult to decompose the total gap into composition and wage effects.
To obtain characteristic specific decomposition of the gap we cannot simply apply the OB methodology on the vg. This is because while the mean is a linear function, quantiles are non-linear: the relationship between covariates and quantiles is complex and depends on the distribution. The solution to this conundrum is the recentred influence function (RIF). Firpo and others (2009) showed that we can linearise any distributional statistic using its influence function. Specifically, one can use the RIF as a quantile specific left hand side variable.[footnote 6] The key to detailed distributional decomposition is running the following regression for each distribution (female, male, counterfactual):
RIFi = Xiγ + εi
This will yield 3 sets of coefficients. The interpretation of these coefficients is the following: a one unit increase in the covariate, holding other covariates fixed, shifts the πth quantile of distribution i by γ. Using the coefficients we can obtain the variables contribution to the composition and wage structure of the pay gap:
Compositionk = (X/C,k) – X/M,k) ⋅ γM,kWage Structurek = X/F,k ⋅(γF,k – γC,k)
The distributional equivalent of the GPG is the wage structure of the intercept.
For our case we will run a simpler version of the specification when running the RIF regressions to preserve statistical power. Specifically, we exclude the firm size variables, the ethnicity variables, the urban dummy variable, the regional variables, and the years of sickness variable. Many of these variables are categorical, which leads to 26 fewer parameters to be estimated. This is important at the tails of the distribution, where fewer observations get much of the weight, and the estimation procedure would have difficulties with an overparametrised model.
Appendix 3: Additional tables
Table A3.1. Contribution of factors to the gender pay gap 2009 to 2023
| Variable group | 2009 to 2014 | 2015 to 2019 | 2020 to 2023 |
|---|---|---|---|
| Female | 54.4 | 50.4 | 56.8 |
| Occupation indicators | 22.0 | 22.9 | 21.9 |
| Full-time experience | 17.1 | 19.3 | 19.8 |
| Care experience | 8.6 | 6.3 | 5.9 |
| Industry indicators | 7.7 | 11.6 | 8.6 |
| Overtime | 6.7 | 4.7 | −0.3 |
| Larger firm | 5.0 | 5.9 | 5.1 |
| Maternity leave experience | 0.1 | −0.7 | −3.0 |
| Region indicators | 0.8 | 0.5 | 0.6 |
| Sickness | 0.0 | −0.1 | −0.2 |
| Urban | 0.0 | −0.1 | 0.0 |
| Years of unemployment | −0.7 | −1.3 | −2.2 |
| Ethnicity indicators | −0.6 | −0.3 | 0.3 |
| Smaller firm | −1.3 | −1.3 | −0.7 |
| Part-time experience | 0.7 | 7.0 | 14.8 |
| Years of education | −3.9 | −4.6 | −3.6 |
| Private sector | −6.2 | −2.2 | −1.1 |
| Part-time work status | −10.4 | −18.0 | −22.6 |
Table A3.2 Pooled regression for GPG decomposition
| Variable | Model 1 | Model 2 | Model 3 |
|---|---|---|---|
| Intercept | 2.473*** | 2.479*** | 2.490*** |
| (0.021) | (0.021) | (0.021) | |
| Education | |||
| Years of education | 0.025*** | 0.024*** | 0.024*** |
| (0.000) | (0.000) | (0.000) | |
| Occupation (ref.: Managers) | |||
| Professionals | 0.027*** | 0.023*** | 0.023*** |
| (0.004) | (0.004) | (0.004) | |
| Associate Professionals and Technicians | −0.169*** | −0.172*** | −0.172*** |
| (0.003) | (0.003) | (0.003) | |
| Administrative and Secretarial | −0.374*** | −0.377*** | −0.375*** |
| (0.004) | (0.004) | (0.004) | |
| Skilled Trades | −0.353*** | −0.352*** | −0.351*** |
| (0.005) | (0.005) | (0.005) | |
| Caring, Leisure and Other Services | −0.491*** | −0.491*** | −0.489*** |
| (0.004) | (0.004) | (0.004) | |
| Sales and Customer Service | −0.519*** | −0.516*** | −0.512*** |
| (0.005) | (0.005) | (0.005) | |
| Process, Plant and Machine Operatives | −0.425*** | −0.425*** | −0.422*** |
| (0.005) | (0.005) | (0.005) | |
| Elementary Occupations | −0.540*** | −0.539*** | −0.532*** |
| (0.004) | (0.004) | (0.004) | |
| Ethnicity (ref.: White) | |||
| White Irish | 0.012 | 0.009 | 0.011 |
| (0.009) | (0.009) | (0.009) | |
| Indian | −0.039*** | −0.041*** | −0.042*** |
| (0.007) | (0.007) | (0.007) | |
| Pakistani | −0.093*** | −0.096*** | −0.097*** |
| (0.011) | (0.011) | (0.011) | |
| Bangladeshi | −0.047** | −0.052*** | −0.054*** |
| (0.015) | (0.015) | (0.015) | |
| Chinese | 0.082*** | 0.077*** | 0.074*** |
| (0.016) | (0.016) | (0.016) | |
| Any other Asian background | −0.047*** | −0.051*** | −0.052*** |
| (0.011) | (0.011) | (0.011) | |
| Black | −0.013+ | −0.014* | |
| (0.007) | (0.007) | (0.007) | |
| Mixed | −0.009 | −0.010 | −0.010 |
| (0.009) | (0.009) | (0.009) | |
| Other | −0.001 | −0.004 | −0.005 |
| (0.005) | (0.005) | (0.005) | |
| Industry (SIC, ref.: Missing/Inapplicable) | |||
| Primary industries | −0.070*** | −0.071*** | −0.076*** |
| (0.012) | (0.012) | (0.012) | |
| Energy and water | −0.055*** | −0.055*** | −0.057*** |
| (0.009) | (0.009) | (0.009) | |
| Primary manufacturing | −0.166*** | −0.166*** | −0.167*** |
| (0.009) | (0.009) | (0.009) | |
| Manufacturing | −0.092*** | −0.091*** | −0.093*** |
| (0.006) | (0.006) | (0.006) | |
| Construction | −0.068*** | −0.068*** | −0.070*** |
| (0.007) | (0.007) | (0.007) | |
| Hotels and catering | −0.305*** | −0.307*** | −0.309*** |
| (0.007) | (0.007) | (0.007) | |
| Transport and communication | −0.160*** | −0.158*** | −0.160*** |
| (0.005) | (0.005) | (0.005) | |
| Banking and financial services | 0.050*** | 0.049*** | 0.047*** |
| (0.007) | (0.007) | (0.007) | |
| Other services | −0.155*** | −0.154*** | −0.154*** |
| (0.005) | (0.005) | (0.005) | |
| Other Controls | |||
| Union member | 0.069*** | 0.068*** | 0.067*** |
| (0.002) | (0.002) | (0.002) | |
| Part-time | 0.099*** | 0.101*** | 0.102*** |
| (0.003) | (0.003) | (0.003) | |
| Private sector | −0.011*** | −0.012*** | −0.012*** |
| (0.003) | (0.003) | (0.003) | |
| Urban | 0.020*** | 0.021*** | 0.020*** |
| (0.002) | (0.002) | (0.002) | |
| Female | −0.101*** | −0.091*** | −0.094*** |
| (0.002) | (0.002) | (0.002) | |
| Overtime | 0.151*** | 0.150*** | 0.150*** |
| (0.002) | (0.002) | (0.002) | |
| Firm size (ref.: Missing/Inapplicable) | |||
| Micro | −0.095*** | −0.098*** | −0.101*** |
| (0.019) | (0.019) | (0.019) | |
| Small | −0.024 | −0.026 | −0.030 |
| (0.019) | (0.019) | (0.019) | |
| Medium | 0.039* | 0.036+ | 0.032+ |
| (0.019) | (0.019) | (0.019) | |
| Large | 0.150*** | 0.148*** | 0.144*** |
| (0.019) | (0.019) | (0.019) | |
| Experience | |||
| Full-time experience | 0.023*** | 0.024*** | 0.024*** |
| (0.000) | (0.000) | (0.000) | |
| Full-time experience² | −0.000*** | −0.000*** | −0.000*** |
| (0.000) | (0.000) | (0.000) | |
| Part-time experience | −0.010*** | −0.008*** | −0.008*** |
| (0.001) | (0.001) | (0.001) | |
| Part-time experience² | 0.000*** | 0.000*** | 0.000*** |
| (0.000) | (0.000) | (0.000) | |
| Additional Controls | |||
| Years of caregiving | −0.010*** | −0.010*** | |
| (0.001) | (0.001) | ||
| Years of maternity | 0.008** | 0.007** | |
| (0.003) | (0.003) | ||
| Years unemployed | −0.009*** | ||
| (0.001) | |||
| Years sick | −0.011*** | ||
| (0.001) | |||
| Observations | 172,773 | 168,014 | 168,014 |
| R² | 0.477 | 0.477 | 0.478 |
| Adjusted R² | 0.477 | 0.476 | 0.477 |
Table A3.3 Year specific regressions
| Variable | 2009 | 2016 | 2022 |
|---|---|---|---|
| Intercept | 2.668*** | 2.319*** | 2.510*** |
| (0.140) | (0.081) | (0.092) | |
| Education | |||
| Years of education | 0.020*** | 0.022*** | 0.021*** |
| (0.002) | (0.001) | (0.002) | |
| Occupation (ref.: Managers) | |||
| Professionals | 0.083*** | 0.022* | −0.025 |
| (0.018) | (0.013) | (0.018) | |
| Associate Professionals and Technicians | −0.133*** | −0.167*** | −0.164*** |
| (0.017) | (0.012) | (0.017) | |
| Administrative and Secretarial | −0.322*** | −0.375*** | −0.344*** |
| (0.019) | (0.014) | (0.020) | |
| Skilled Trades | −0.345*** | −0.337*** | −0.329*** |
| (0.022) | (0.017) | (0.026) | |
| Caring, Leisure and Other Services | −0.447*** | −0.477*** | −0.469*** |
| (0.022) | (0.015) | (0.023) | |
| Sales and Customer Service | −0.556*** | −0.502*** | −0.495*** |
| (0.024) | (0.017) | (0.025) | |
| Process, Plant and Machine Operatives | −0.412*** | −0.423*** | −0.364*** |
| (0.024) | (0.017) | (0.026) | |
| Elementary Occupations | −0.546*** | −0.512*** | −0.494*** |
| (0.021) | (0.015) | (0.023) | |
| Ethnicity (ref.: White) | |||
| White Irish | 0.043 | 0.113*** | 0.070 |
| (0.038) | (0.034) | (0.051) | |
| Indian | −0.083** | −0.023 | 0.023 |
| (0.037) | (0.027) | (0.038) | |
| Pakistani | −0.135** | −0.107** | 0.008 |
| (0.066) | (0.043) | (0.054) | |
| Bangladeshi | −0.143 | −0.008 | 0.008 |
| (0.092) | (0.057) | (0.077) | |
| Chinese | −0.043 | 0.060 | 0.336*** |
| (0.091) | (0.057) | (0.070) | |
| Any other Asian background | −0.029 | 0.071* | 0.002 |
| (0.053) | (0.041) | (0.071) | |
| Black | −0.057 | −0.031 | 0.045 |
| (0.039) | (0.028) | (0.035) | |
| Mixed | −0.025 | −0.006 | −0.024 |
| (0.052) | (0.032) | (0.040) | |
| Other | 0.010 | 0.025 | −0.029 |
| (0.025) | (0.020) | (0.030) | |
| Industry (SIC, ref.: Missing/Inapplicable) | |||
| Primary industries | 0.037 | 0.129** | −0.107 |
| (0.059) | (0.051) | (0.096) | |
| Energy and water | 0.026 | 0.093** | −0.051 |
| (0.051) | (0.039) | (0.056) | |
| Primary manufacturing | −0.098* | −0.000 | 0.028 |
| (0.053) | (0.041) | (0.050) | |
| Manufacturing | −0.036 | 0.036 | 0.045* |
| (0.039) | (0.030) | (0.024) | |
| Construction | 0.038 | 0.036 | −0.029 |
| (0.042) | (0.033) | (0.035) | |
| Hotels and catering | −0.255*** | −0.166*** | −0.023 |
| (0.044) | (0.033) | (0.037) | |
| Transport and communication | −0.100*** | −0.023 | 0.006 |
| (0.037) | (0.029) | (0.017) | |
| Banking and financial services | 0.094** | 0.180*** | 0.154*** |
| (0.043) | (0.033) | (0.032) | |
| Other services | −0.086** | −0.033 | −0.012 |
| (0.037) | (0.029) | (0.013) | |
| Other Controls | |||
| Private sector | −0.024* | −0.009 | 0.028** |
| (0.013) | (0.010) | (0.013) | |
| Urban | −0.001 | 0.023*** | 0.017 |
| (0.012) | (0.009) | (0.013) | |
| Part-time | 0.057*** | 0.089*** | 0.140*** |
| (0.017) | (0.011) | (0.016) | |
| Union member | 0.081*** | 0.074*** | 0.043*** |
| (0.012) | (0.009) | (0.013) | |
| Female | −0.154*** | −0.074*** | −0.087*** |
| (0.012) | (0.009) | (0.013) | |
| Years of caregiving | −0.011*** | −0.010*** | −0.012*** |
| (0.003) | (0.002) | (0.003) | |
| Years of maternity | −0.003 | 0.003 | 0.021 |
| (0.014) | (0.010) | (0.014) | |
| Years unemployed | −0.008** | −0.010*** | −0.022*** |
| (0.004) | (0.002) | (0.003) | |
| Years sick | −0.013 | −0.013*** | −0.012** |
| (0.011) | (0.004) | (0.005) | |
| Overtime | 0.154*** | 0.147*** | 0.148*** |
| (0.010) | (0.007) | (0.011) | |
| Experience | |||
| Full-time experience | 0.017*** | 0.025*** | 0.030*** |
| (0.001) | (0.001) | (0.002) | |
| Full-time experience² | −0.000*** | −0.000*** | −0.001*** |
| (0.000) | (0.000) | (0.000) | |
| Part-time experience | 0.003 | −0.008*** | −0.019*** |
| (0.004) | (0.002) | (0.003) | |
| Part-time experience² | 0.000 | 0.000*** | 0.001*** |
| (0.000) | (0.000) | (0.000) | |
| Observations | 6,407 | 12,941 | 5,746 |
| R² | 0.482 | 0.482 | 0.447 |
| Adjusted R² | 0.477 | 0.480 | 0.441 |
Appendix A3.4 Probit regression (distributional analysis)
Table D1. Probit Regression to Create counterfactual
| Variable | Probit Coefficient |
|---|---|
| Intercept | −0.528*** |
| (0.121) | |
| Education | |
| Years of education | 0.018*** |
| (0.002) | |
| Occupation (ref.: Managers) | |
| Professionals | −0.041* |
| (0.020) | |
| Associate Professionals and Technicians | 0.251*** |
| (0.019) | |
| Administrative and Secretarial | 0.986*** |
| (0.022) | |
| Skilled Trades | −1.727*** |
| (0.039) | |
| Caring, Leisure and Other Services | 1.082*** |
| (0.026) | |
| Sales and Customer Service | 0.736*** |
| (0.027) | |
| Process, Plant and Machine Operatives | −1.516*** |
| (0.039) | |
| Elementary Occupations | −0.490*** |
| (0.025) | |
| Ethnicity (ref.: White) | |
| White Irish | 0.171** |
| (0.055) | |
| Indian | −0.349*** |
| (0.037) | |
| Pakistani | −0.701*** |
| (0.058) | |
| Bangladeshi | −0.982*** |
| (0.080) | |
| Chinese | −0.279*** |
| (0.084) | |
| Any other Asian background | 0.044 |
| (0.061) | |
| Black | 0.119** |
| (0.038) | |
| Mixed | 0.080+ |
| (0.048) | |
| Other | 0.330*** |
| (0.029) | |
| Industry (SIC, ref.: Missing/Inapplicable) | |
| Primary industries | −0.573*** |
| (0.083) | |
| Energy and water supplies | −0.573*** |
| (0.062) | |
| Primary manufacturing | 0.058 |
| (0.057) | |
| Manufacturing | −0.386*** |
| (0.036) | |
| Construction | −0.917*** |
| (0.047) | |
| Hotels and catering | 0.641*** |
| (0.039) | |
| Transport, storage and communication | −0.335*** |
| (0.030) | |
| Banking and financial services | −0.016 |
| (0.038) | |
| Other services | 0.351*** |
| (0.028) | |
| Sector | |
| Private sector | −0.347*** |
| (0.015) | |
| Region (GOR, ref.: London) | |
| North East | 0.096** |
| North West | 0.068** |
| Yorkshire and the Humber | 0.102*** |
| East Midlands | 0.016 |
| West Midlands | 0.124*** |
| East of England | −0.072** |
| South East | −0.063** |
| South West | −0.088** |
| Wales | 0.017 |
| Scotland | −0.006 |
| Northern Ireland | 0.183*** |
| Other Controls | |
| Urban | 0.004 |
| (0.015) | |
| Part-time | 0.551*** |
| (0.020) | |
| Years of caregiving | 0.770*** |
| (0.014) | |
| Years of maternity | 15.702*** |
| (0.513) | |
| Years unemployed | −0.142*** |
| (0.005) | |
| Years sick | −0.082*** |
| (0.009) | |
| Overtime | 0.086*** |
| (0.012) | |
| Firm size (ref.: Missing/Inapplicable) | |
| Micro | 0.041 |
| Small | 0.076 |
| Medium | −0.086 |
| Large | −0.022 |
| Experience | |
| Years full-time experience | −0.033*** |
| (0.002) | |
| Years full-time experience² | 0.000*** |
| (0.000) | |
| Years part-time experience | 0.218*** |
| (0.005) | |
| Years part-time experience² | −0.006*** |
| (0.000) | |
| Observations | 206,191 |
-
Here, “unexplained” refers to the portion of the gap associated with differences between men and women that are not accounted for by observed explanatory variables such as occupation, industry, and caring responsibility. ↩
-
Under the Equality Act 2010, men and women performing “equal work” must receive equal terms and conditions of employment, including equal pay. ↩
-
Olsen’s and others analysis (2010 and 2018) of the main causes of gender gap conducted over the years 1995, 1996, 1997, 2004, 2005, 2006, and 2007 finds values of the unexplained component that vary by year in the range between 60% and 35% (Olsen and others 2010, Figure 2.1). The analysis of the main causes of the gap finds values of the unexplained component of 73% for 1997 and of 62% for 2007 (Olsen and others 2010, Figure 4.1). An additional analysis using a different model specification adjusting for selectivity bias finds values of 62% for 1997 and 48% for 2007 (Olsen and others 2010, Figure 4.1). ↩
-
Full table including all factors can be found in Appendix 3. ↩
-
Associated Regressions can be found in Appendix 3. ↩
-
The significant property is that the mean of the RIF is the th quantile of Y. This means if we regress RIF on X, we get coefficients that tell us how changes in X affect the unconditional quantile of Y. Intuitively, if an observation is above the th quantile, then the RIF associated with that observation is high, which “pushes up” the quantile. Conversely if an observation is below the th quantile it will have a RIF that is low, which “pulls down” the quantile. ↩