Understanding decision making around changing the State Pension age: A review of international evidence
Published 30 March 2023

© Crown copyright 2023
This publication is licensed under the terms of the Open Government Licence v3.0 except where otherwise stated. To view this licence, visit nationalarchives.gov.uk/doc/open-government-licence/version/3 or write to the Information Policy Team, The National Archives, Kew, London TW9 4DU, or email: psi@nationalarchives.gov.uk.
Where we have identified any third party copyright information you will need to obtain permission from the copyright holders concerned.
This publication is available at https://www.gov.uk/government/publications/understanding-decision-making-around-changing-the-state-pension-age-a-review-of-international-evidence/understanding-decision-making-around-changing-the-state-pension-age-a-review-of-international-evidence
Acknowledgements
We want to thank the project team at the Department for Work and Pensions for their support throughout this study. In particular, we are grateful to Christopher Steer and Joshua Meakings for their guidance during the study.
We thank our two quality assurance reviewers at RAND Europe, Lucy Hocking and Silvia Galimberti, for their helpful suggestions, and Giovanni Maria Amodeo (RAND Europe), Professor Anne Balter (Tilburg University), Lucy Gilder (RAND Europe), Dr Lydia Lymperis (RAND Europe), Emmanuel Nielsen (RAND Europe), Dr Mafalda Pardal (RAND Europe), and Professor Anja De Waegenaere (Tilburg University) for their assistance and/or advice. This report represents the views of the authors.
The authors
Natalie Picken, RAND Europe
Merrilyn Groom, RAND Europe
Frederico Cardoso, RAND Europe
Dr Madeline Nightingale, RAND Europe
Joanna Hofman, RAND Europe
Professor David Blake, Pensions Institute, Bayes Business School, City University of London
Executive summary
This report presents findings from a review commissioned by the Department for Work and Pensions (DWP) to investigate how high-income Organisation for Economic Co-operation and Development (OECD) countries change State Pension age (SPa) and the variables considered when they changed the SPa. The objective of the study was to present available evidence on how other high-income OECD countries have approached the issue of determining the SPa, to generate knowledge and understanding that might be transferable to the UK. The SPa is an important element of a pension system’s viability and sustainability in each country, but financing pension expenditure in the longer term may require wider reforms, which are beyond the scope of this review.
This study was guided by the following research questions: (i) What factors affect the decision to change the SPa? (ii) How are changes made to the SPa internationally? (iii) What criteria are used (and how are they used) to change and determine the SPa? These research questions are addressed in sections 2.1, 2.2 and 2.3, respectively.
To answer these questions, we used a targeted literature review. The search identified 242 sources for screening. After screening and snowballing, we included 50 sources in a more detailed review. Appendix A details the methodology and inclusion and exclusion criteria applied in the search.
The key findings are:
- Throughout the OECD, SPa increases have been caused by gains in life expectancy and increases in the old-age dependency ratio, which risk increasing pension expenditure, bringing about intergenerational inequity and challenging fiscal sustainability.
- Increases in the SPa are frequently accompanied by other pension and wider policy reforms to increase the effective retirement age, but the ability to do this depends on political will.
- How effective changes to the SPa are depends greatly on the pension system and other reforms. Changes may be influenced by population heterogeneity – for example, the socio-economic differences in life expectancies.
- Changes to the SPa may come about through various decision-making processes, including government commissions, legislated measures and automatic adjustment mechanisms. However, in practice, these processes are not always sequential, and changes that do take place are often the outcome of various social, economic and political forces.
- Increasing the SPa is the most common legislative measure adopted to address pension viability and sustainability challenges. The SPa may be changed by setting a given SPa in legislation (for example, France); detailing a fixed schedule of review to the SPa in legislation (for example, Malta); setting up an automatic adjustment mechanism (AAM; for example, Italy, Portugal, Denmark); or using some combination of these (for example, Slovakia, the Netherlands). Legislation may be used to equalise the SPa for men and women.
- The way in which the SPa is changed may be informed by different policy targets – most frequently setting a particular ratio of adult life or a set number of years in retirement while receiving State Pension. However, legislation is sometimes used to alter or reverse previous increases and changes in the SPa.
- Changes in the SPa are often accompanied, or affected, by other pension reforms, including changes to early retirement policies, policies encouraging later retirement and the provision of an earlier SPa for those who started their careers earlier.
- A number of countries have recent experience of automatic or semi-automatic adjustment mechanisms (semi-AAMs), which are mechanisms whereby the SPa changes depending on changes in life expectancy. When deciding how an AAM will operate, there are 10 main areas where decisions can be made (including the age at which the link to life expectancy is set, the rate at which the SPa is changed compared with life expectancy changes, how often and when the mechanism is triggered, and when changes come into effect).
- These adjustment mechanisms are established and amended through legislation and can either be applied directly (AAM) or need prior approval for the changes to come into force (semi-AAM). There are several examples of recent reversals or changes to an AAM.[footnote 1]
- Life expectancy is the main variable used to determine changes in the SPa, with two main methods of calculating life expectancy: Period-based life expectancy (PLE) estimates life expectancy using recent mortality data (assuming mortality remains static). Cohort-based life expectancy (CLE) uses projected mortality rates to estimate life expectancy. All OECD countries that have adopted an AAM for changes to the SPa to date use PLE as the basis for their life expectancy calculations.
- Research demonstrates that PLE consistently underestimates life expectancy, and that, when used as the basis for a (semi-)AAM, using PLE leads to longer time spent in receipt of State Pension than expected and higher total pension expenditure.
- Other factors that may be relevant to consider when linking the SPa to life expectancy include healthy life expectancy, socio-economic disparities and the age at which adult life is considered to start.
1. Introduction
1.1. Policy context and background information: what is the State Pension age?
In this report, we use the term State Pension age (SPa) to mean the age at which people can draw upon a State Pension in different countries.[footnote 2]
Different OECD countries stipulate various ages at which people can receive their State Pension. Across OECD countries, the age at which an individual was eligible for retirement benefits without penalty in 2020 tended to sit between 62 years old (Costa Rica, Greece, Italy, Korea, Luxembourg, Slovenia) and 67 years old (Iceland, Norway), as shown in Figure 1. However, in many countries, people may also retire at an earlier age and (in a subset of these countries) be able to receive some or all of their State Pension then.
Figure 1: Current normal retirement age by gender across OECD countries, for an individual retiring in 2020
| Country | Women | Additional years for men (if different) | Total |
|---|---|---|---|
| Iceland | 67 | 0 | 67 |
| Norway | 67 | 0 | 67 |
| Israel | 62 | 5 | 67 |
| Netherlands | 66.33 | 0 | 66.33 |
| Australia | 66 | 0 | 66 |
| Ireland | 66 | 0 | 66 |
| United Kingdom | 66 | 0 | 66 |
| United States | 66 | 0 | 66 |
| Germany | 65.67 | 0 | 65.67 |
| Denmark | 65.5 | 0 | 65.5 |
| Portugal | 65.33 | 0 | 65.33 |
| Belgium | 65 | 0 | 65 |
| Canada | 65 | 0 | 65 |
| Chile | 65 | 0 | 65 |
| Finland | 65 | 0 | 65 |
| Japan | 65 | 0 | 65 |
| Mexico | 65 | 0 | 65 |
| New Zealand | 65 | 0 | 65 |
| Spain | 65 | 0 | 65 |
| Sweden | 65 | 0 | 65 |
| Switzerland | 64 | 1 | 65 |
| Austria | 60 | 5 | 65 |
| Poland | 60 | 5 | 65 |
| France | 64.5 | 0 | 64.5 |
| Hungary | 62 | 2.5 | 64.5 |
| OECD | 63.45 | 0.78 | 64.23 |
| Lithuania | 63 | 1 | 64 |
| Estonia | 63.75 | 0 | 63.75 |
| Latvia | 63.75 | 0 | 63.75 |
| Czech Republic | 63.67 | 0 | 63.67 |
| Slovak Republic | 62.67 | 0.17 | 62.83 |
| Italy | 62 | 0 | 62 |
| Greece | 62 | 0 | 62 |
| Korea | 62 | 0 | 62 |
| Luxembourg | 62 | 0 | 62 |
| Slovenia | 62 | 0 | 62 |
| Colombia | 57 | 5 | 62 |
| Costa Rica | 59.92 | 2 | 61.92 |
| Turkey | 49 | 3 | 52 |
| Argentina | 60 | 5 | 65 |
| Brazil | 57 | 5 | 62 |
| Russian Federation | 56.5 | 5 | 61.5 |
| South Africa | 60 | 0 | 60 |
| China | 55 | 5 | 60 |
| India | 58 | 0 | 58 |
| Indonesia | 57 | 0 | 57 |
| Saudi Arabia | 47 | 0 | 47 |
| EU27 | 63.46 | 0.84 | 64.30 |
| Bulgaria | 61.5 | 2.75 | 64.25 |
| Croatia | 62.5 | 2.5 | 65 |
| Cyprus | 65 | 0 | 65 |
| Malta | 63 | 0 | 63 |
| Romania | 61.25 | 3.75 | 65 |
Source: OECD (2021a). Permanent location of this file: https://stat.link/3vszen. For an individual retiring after an uninterrupted career from age 22.
Looking ahead – and based on current legislation – the OECD projects that the age at which State Pensions can be received will rise. Those joining the labour market at the age of 22 in 2020, the OECD estimates, would not be eligible for a State Pension until 2064, when the normal retirement age for men is estimated to be 66.1 years, and for women, 65.5 years, across the OECD.[footnote 3]
As in other OECD countries, in the UK, the SPa has shifted over time (see Table 1 for recent and planned changes). This has most recently been caused by efforts to equalise the SPa for men and women and to increase the SPa gradually for both genders.
Table 1: Recent changes in State Pension age in the United Kingdom
| Gender | Date of birth | State Pension age |
|---|---|---|
| Women | Before 6 April 1950 | 60 |
| Women | Between 6 April 1950 and 5 December 1953 | Between 60 and 65 (incremental increase depending on month of birth) |
| Men | Before 6 December 1953 | 65 |
| Men and women | Between 6 December 1953 and 5 October 1954 | Between 65 and 66 (incremental increase depending on month of birth) |
| Men and women | Between 6 October 1954 and 5 April 1960 | 66 |
| Men and women | Between 6 April 1960 and 5 March 1961 | Between 66 and 67 (incremental increase depending on month of birth) |
| Men and women | Between 6 March 1961 and 5 April 1977 | 67 |
| Men and women | Between 6 April 1977 and 5 April 1978 | Between 67 and 68 (incremental increase depending on month of birth) |
| Men and women | After 6 April 1978 | 68 |
Sources: DWP (2014a, 2014b).
The Pensions Act 2014 stipulates that the UK government must periodically review whether the SPa is appropriate, taking into consideration life expectancy and other specified factors, and that it must produce a report on this at six-year intervals. The aim of this policy is to ensure intergenerational fairness in sharing the costs of increased longevity, while also providing greater clarity around future changes in the SPa.[footnote 4] The first statutory review took place in 2017, and the second statutory review must be published by 7th May 2023.[footnote 5]
1.2. Research objectives and questions
The Department for Work and Pensions commissioned this report to inform the second statutory SPa review and to better understand the mechanisms and variables used to change the SPa internationally.
While overviews of national pension systems are available from OECD,[footnote 6] European Commission[footnote 7] or Mercer[footnote 8] publications or government websites, the mechanisms used to increase the SPa, as well as the specific variables and formulae or targets used, are rarely presented in a systematic fashion.
Therefore, this report responds to the following research questions:
- What factors affect changing the SPa?
- How are changes made to SPa internationally?
- What variables are used (and how are they used) to change and determine the SPa?
1.3. Method
To address the research questions above, the study uses a quick scoping review of the literature. This type of review was chosen because the scope is broad and open-ended, and the quality or robustness of the evidence was not an important consideration in the initial scoping. The search was limited to sources published between 2001 and 2021. The geographical scope of the review was limited to the OECD countries. The keyword search yielded 242 sources, of which we screened titles and abstracts, and from which we reviewed 47 sources. In addition, we identified 3 articles through snowballing (identifying articles of interest through those already reviewed). The total number of articles reviewed was 50.
We identified four countries of interest, in collaboration with the DWP: Denmark, France, Italy and Portugal. These were selected purposefully, given that they represented different approaches to determining the SPa – from direct legislation to AAM and semi-AAM. Where there were questions or gaps remaining in the literature for these countries, researchers with Danish, French, Italian and Portuguese language skills reviewed national government policy documents and legislation to add further information. This information is included throughout the report, with references to relevant documentation available in national languages.
We found that a small number of sources were particularly valuable for the topic at hand and frequently cited. These include academic articles by Ayuso and others[footnote 9] and Bravo and others,[footnote 10] as well as literature from the Economic Policy Committee and Social Protection Committee of the European Union[footnote 11] and the OECD ‘Pensions at a Glance 2021’.[footnote 12]
Further details about the methodology and inclusion and exclusion criteria are detailed in Appendix A.
1.4. Structure of report
The remainder of this report is structured as follows: Section 2 presents the main findings of the review, organised around the research questions. Section 2.1 introduces factors that lead to changes in the SPa. Section 2.2 investigates the mechanisms through which changes are made to the SPa internationally, illustrating these with examples from multiple countries. Section 2.3 discusses variables that are used to determine the SPa and the ways in which they are used.
Section 3 follows with important conclusions of the review and takeaway points for decision makers. Appendix A provides a methodological overview. Appendix B provides a list of sources identified through the quick scoping review.
2. Key findings
In this section, we outline findings to each of the three research questions. We draw out findings from the literature reviewed, illustrating points with examples from OECD countries where useful. We added to the information available from the literature review by including further detail (where available) from the legislation and national policy documents of four countries (Denmark, Portugal, France, Italy).
2.1. What factors affect changing State Pension age?
This section explores factors that affect decision making and changes to the SPa in the international context.
2.1.1. Rising life expectancy challenges the sustainability and intergenerational fairness of pension systems
Life expectancy is rising, meaning that there are more people in retirement than ever before, creating challenges for the sustainability of pension systems. Across the OECD, average life expectancy at age 65 is projected to increase by around 4 years for men and women (Table 2). Similarly, across the EU, the improvements in life expectancy (coupled with the ‘baby boomer’ generation reaching the SPa) resulted in a higher number of people in retirement than ever before (estimated at a quarter of the EU population in 2019).[footnote 13]
Table 2: The remaining average life expectancy of people aged 65 in 2015 to 2020 and in 2060 to 2065 across the OECD
| Gender | Remaining life expectancy for those aged 65 in 2015 to 2020 | Remaining life expectancy for those aged 65 in 2060 to 2065 |
|---|---|---|
| Men | 18.1 years | 22.5 years |
| Women | 21.3 years | 25.2 years |
Source: OECD (2021a). Note: This table shows the average number of additional years that a person aged 65 is expected to live.
The rising numbers of retired individuals, combined with lower fertility rates, means that the old-age dependency ratio (OADR) is increasing. The OADR looks at the pensionable population (aged above the SPa) divided by the working-age population.[footnote 14] When the OADR is high, a relatively large group of retired people must be supported by a relatively small group of people of working age. In 2021, the OADR across OECD countries was projected to increase by 23 percentage points between 2020 and 2050.[footnote 15] In the UK, the OADR is projected to increase from 280 persons of pensionable age per 1,000 persons of working age[footnote 16] in 2020 to 298 in mid-2030 and to 341 by mid-2045. This is despite legislated increases in the SPa to age 67 in 2028, and to age 68 between 2044 and 2046.[footnote 17]
While life expectancy continues to increase, the rate at which it is increasing has slowed.[footnote 18] The OECD estimates that this decline began in 2010: between the mid-1990s and 2010, average OECD life expectancy increased at a rate of 1.6 years per decade for men and 1.4 years per decade for women. Between 2010 and 2020, the increase was slower (1.3 years per decade for men and 1.1 years per decade for women).[footnote 19] Mortality data from 20 countries analysed in 2018 show that life expectancy at age 65 increased less in the previous six years than it had in the six years prior to that.[footnote 20] This slowdown has been attributed in part to high mortality rates from heart diseases and stroke, linked to such risk factors as smoking, high blood pressure and obesity.[footnote 21] Projections made by ONS in 2020 note declines for remaining CLE at age 65 for men and women, compared with estimates from previous years.[footnote 22]
It is not yet clear whether this is a temporary or permanent change in trends: some consider that life expectancy will be increasingly limited by health factors,[footnote 23] and others consider that there may be no natural barrier to life expectancy improvements.[footnote 24] The outbreak of COVID-19 has led to some observed changes in life expectancy in some countries. Between 2019 and 2020, life expectancy at the age of 65 declined in 18 of the 25 OECD countries for which there are data, by an average of 7.4 months (7.1 months for women and 7.7 months for men).[footnote 25]
Increases in life expectancy (and the OADR) can bring financial pressure to pension systems, which increases in the SPa could (partially) counteract. Demographic ageing increases the number of pension recipients and the OADR, directly increasing pension expenditure and reducing the tax base. In 2021, the OECD estimated that, without any further increases in the SPa, the increase in the OADR would increase OECD country State Pension expenditure by around 3.5 percentage points of GDP on average between 2019 and 2035.[footnote 26]
Increasing the SPa can have further indirect positive benefits on pension sustainability and net budget balance. Increasing the SPa is one means by which retirement can be delayed. From the literature, we can see that a delay in retirement produces positive effects on labour supply and employment, with older workers delaying their labour market exit.[footnote 27] This in turn can increase potential GDP, further improving the budget balance and debt-to-GDP ratio. Increasing the SPa can also prolong the period in which individuals remain net contributors to pension expenditure, by increasing the period over which they pay their contributions and cannot claim a State Pension.[footnote 28]
2.1.2. Increased life expectancy without corresponding changes in the SPa can adversely affect intergenerational fairness
Increasing the SPa, and linking this to life expectancy, is one way to support intergenerational fairness. Changes in the SPa can act both to maintain a consistent time spent in retirement and in receipt of State Pension across generations, and to reduce the fiscal burden of the State Pension system on future generations, by extending working lives. Linking the SPa to life expectancy may also ensure intergenerational equity in the time spent in receipt of a State Pension by fixing, in expectation, either a constant length or ratio of time spent above the SPa.[footnote 29]
However, SPa increases alone are unlikely to be sufficient to counteract wider inequities in the division of risks and resources between the generations.[footnote 30] This is particularly the case when population ageing is combined with economic downturns.[footnote 31] Increasing the effective retirement age (the average age of labour market exit, or the age at which people actually retire) by, for example, increasing the SPa, has been described as the only solution that maintains intergenerational equity regarding the time spent receiving State Pension.[footnote 32]
2.1.3. Various factors affect both how the SPa is raised and what effect the increase has on the SPa
Increases in the SPa do not always lead to proportional increases in the effective retirement age.[footnote 33] In many OECD countries, the effective retirement age remains lower than the SPa, despite several pension reforms tightening early retirement eligibility or establishing early retirement penalties (see section 2.2).[footnote 34]
The effective retirement age is governed by individual level factors, which are likely to be slower to change than the SPa.[footnote 35] These include:
- Health. Deteriorating health is considered a more important determinant of early retirement than economic or financial factors.[footnote 36]
- Social factors. Education, social class and gender can have a substantial effect on length of time spent in work and on motivations regarding early retirement or extending working lives.[footnote 37]
- Workplace factors. Levels of job satisfaction are important in determining effective retirement age.[footnote 38] There are factors that help facilitate longer working lives (e.g. flexible working conditions, support from management) and recognised barriers (e.g. workplace conflict, poor working conditions) to extending working lives.[footnote 39]
- Perceived health of the economy. Periods of low unemployment encourage the postponement of retirement.[footnote 40]
- Individual financial security and pension arrangements.[footnote 41]
Increasing the SPa in conjunction with other pension and policy reforms may be more effective in increasing effective retirement age.[footnote 42] Broader policy changes adopted by countries across the OECD are discussed in section 2.2. The gradual increases in early retirement age evident in recent years across the EU are in part attributable to pensions policy reform and in part to general societal changes and structural reforms, such as the rising economic activity of women, increases in educational attainment levels, and improvements in health.[footnote 43]
Heterogeneity among the population can mean that SPa changes affect groups differently – including men vs women. At the SPa, remaining life expectancy is not evenly distributed across the retiring population.[footnote 44] Life expectancy and pension wealth differ by socio-economic class, gender, type of work, income levels, labour market entry points, health and geography.[footnote 45] Having a universal SPa may therefore subsidise wealthier individuals over those from lower socio-economic groups.[footnote 46] The same holds true by region: both the remaining life expectancy and the rate of gains to life expectancy differ significantly by region.[footnote 47] While women tend to have longer life expectancy at the SPa (therefore standing to receive more in State Pension funding over their lifetime),[footnote 48] women also tend to reach the SPa with lower pension wealth due to gaps in pay, shorter career length and work intensity.[footnote 49] This gender pension gap was 29.4% across the EU in 2019, resulting in a 3.9 percentage point gender gap in the poverty rate risk for retired individuals.[footnote 50] As a result, women are more likely to take on employment while receiving their pension than men.[footnote 51]
Changes to the SPa do not occur in isolation; their effect depends on the current pension system and other reforms that might be concurrently implemented. Pension systems can vary in terms of their funding (combining public and private), their nature (whether they are mandatory or voluntary),[footnote 52] and their intended purpose (whether they are intended to provide all income in retirement, referred to as the Bismarckian model, or are intended to be supplemented by additional contributions, referred to as the Beveridgean model).[footnote 53] However, within these parameters, all pension systems reflect and compound differences across countries that adopt them, with a wide variety of design features.[footnote 54]
External factors (such as an increase in immigration) may reduce the pressure on pensions by broadening the tax base and reducing the OADR.[footnote 55] This is particularly the case because immigrants tend to be, on average, younger than the domestic adult population.[footnote 56] However, the effect depends on the country: those with higher levels of immigration, permanent and consistent movement of immigration, and higher-skilled immigrants stand to benefit most.[footnote 57] For example, the estimated gains to projected immigration flows from 2015 onwards range from 14.3 percentage points of labour income taxes in Austria, to 1.7 percentage points in Poland.[footnote 58]
2.2. How are changes made to State Pension age internationally?
This section describes the ways by which changes to the SPa come into place. We explore various mechanisms and processes, which have been identified primarily by drawing on reviewed literature:[footnote 59]
- changes suggested by government commissions on pensions or welfare reforms
- changes stipulated in legislated measures
- changes calculated by AAMs and semi-AAMs
Each mechanism is described in more detail below and examples of changes in individual countries are provided where available. While these three processes can sometimes be sequential components of changing the SPa (starting with a government commission, followed by legislation that introduces an automatic, semi-automatic or discretionary adjustment mechanism) in practice, this does not necessarily follow this sequential logic.
2.2.1. Government commissions on pensions or welfare reforms may make recommendations for SPa and other pension reform
Pensions or welfare commissions can be influential in bringing about policy reforms, including those in the SPa. This was the case in Denmark, France, Germany, Ireland and Norway, as explored in Table 3.
These commissions often recommended increasing SPa, giving a notice period of around 7 to 8 years, and recommended increases were typically incremental, amounting to around 1 to 3 months per year. However, the issue of raising SPa was never considered in isolation by the commissions. Table 3 details other, but related, measures that were recommended by commissions on pensions or welfare reforms, including:
- restricting early retirement schemes (Germany, Denmark)
- introducing an automatic stabiliser[footnote 60] to reduce the amount of pension if the dependency ratio deteriorates (Germany, Norway)
- making the amount of pension received dependent on the timing of retirement, calculating pension benefits based on all working years, and indexing pensions to mean price and wage increases, not just wages (Norway)[footnote 61]
Attributing change to commissions is difficult, given the absence of counterfactual and compounding factors over the length of time before any changes materialise. Whether, or to what extent, the recommendations of these commissions on pensions and welfare reforms are adopted depends on a number of factors, and has been a subject of comparative research not repeated here.[footnote 62]
Table 3: Government commissions on pensions or welfare reforms: recommendations on State Pension age and other aspects of pension system
| Country | Scope of commission | Date of commission | Recommendations relating to the SPa | Recommendations made by commissions relating to other aspects of pension system |
|---|---|---|---|---|
| Denmark | Welfare | 2003 to 2005 | Raise the age of eligibility for pensions from 65 to 68 (by one month each year from 2013 onwards) | - Abolish the early retirement scheme (increasing the pre-retirement age by 4 months each year from 2009 until 2028, when it will be abolished) - Introduce compulsory private pension savings paid by employers and employees - Increase pensions payments from 2010 until the compulsory private pension savings has an effect |
| Denmark | Pension | 2020 to 2022 | Reduce the rate at which the State Pension age will increase from 2040 onwards (see Box 7) | - Require people with no or limited pension contributions to contribute 3.3% of business income |
| Ireland [footnote 63] | Pensions | 2021 | Raise the State Pension age by 3 months each year (starting in 2028) reaching the age of 67 in 2031 and 68 in 2039 | - Continue to finance the pension on a pay-as-you-go basis - Ensure an annual exchequer contribution to the State Pension account of the Self-Invested Fund - Introduce an automatic enrolment retirement savings system to improve retirement income adequacy - Continue to benchmark and index State Pension payments - Establish an independent body to advise government on pension payments - Align retirement ages in employment contracts with SPa, by introducing legislation that allows but does not compel an employee to stay in employment until SPa |
| France [footnote 64] | Pensions | 2019-ongoing | Raise the SPa from 62, with various suggestions put forward in 2019 which would result in a SPa of between 63.1 and 64.3 years. See Box 1 for more information | Some of the possible scenarios for a 2025 reform include: - an increase in contributions - an under-indexation of pensions in payment - several ‘age-related’ measures aimed at shifting the average effective retirement age of insured persons - a postponement of the age of entitlement - an increase in the length of insurance period |
| Germany | Social security systems | 2002 to 2003 | Raise the age of eligibility for pensions from 65 to 67 in the period 2011 to 2035 (with 1 month increase each year) | - Increase the age limit for early retirement benefits by 2 years - Introduce an automatic stabilisation factor to reduce pensions if the OADR increases |
| Norway | Pensions (except the early retirement scheme) | 2001 to 2004 | - Encourage people to work until SPa - Have flexible retirement age between 62 and 70 years (the longer one works, the higher the pension) - Allow pensioners to combine work and pensions, i.e. work income should not result in a corresponding reduction in pensions payment |
- Introduce an automatic stabilisation factor to reduce amount of pension received if the OADR deteriorates - Make amount of pension dependent on the timing of the retirement - Calculate amount of pension on all working years (not 20 years of highest income) - Index pensions based on price and wage increases (not just wage increases) - Change the public sector occupational pension scheme, so it does not guarantee two thirds of final salary - Discuss the increasing trend of early retirement with the social partners |
Sources: Beskæftigelsesministeriet (2022); Conseil d’Orientation des Retraites (2019); An Coimisiún Pinsean (2021); Lindén (2012); OECD (2021a)
2.2.2. Legislated measures can bring about changes in the SPa – either directly or indirectly
National legislation covers a wide range of linked aspects of a pension system in each country, with SPa being one of them.[footnote 65] This section first examines how legislation is used to directly change and establish a SPa. It then provides a brief overview of other legislative changes linked to the SPa.
Increasing SPa was the most common legislative measure adopted to address pension sustainability challenges.[footnote 66] Sixteen OECD countries have passed legislation to increase the SPa,[footnote 67] with examples including Bulgaria, Finland, Slovakia and France (see Box 1).[footnote 68] How SPa was changed and increased could take a number of forms in legislation. An SPa may be directly stated in legislation. This could take the form of establishing a new minimum[footnote 69] or target[footnote 70] retirement age that is designed to be in place for the foreseeable future or is revisited each year. SPa changes may also be legislated by setting out fixed schedules of the SPa for a certain number of years, which may be informed by the requirement for a review or report to be published. Countries may also set out automatic or semi-AAMs, which are then used to determine SPa (see section 2.3).
There are various factors that may lead to the legislated increase of SPa (as explored in section 2.1). In addition, what the SPa is set as may be informed by various policy targets adopted by governments. These include:
- ensuring a single SPa between men and women (see below)
- establishing a constant expected period above SPa (e.g. the Netherlands, Denmark)[footnote 71]
- establishing a constant ratio of adult life (or total lifespan) spent above SPa (e.g. Portugal, Czechia[footnote 72]
- targeting a constant balance (ratio) between time spent in work (contributing) and above SPa (e.g. France, Italy, Czechia, Malta)[footnote 73]
- linking the eligibility age for pensions to the eligibility age for other benefits, such as public healthcare (e.g. the United States)[footnote 74]
- using a combination of targets that are prioritised in different ways. For example, in Czechia, the current policy directive is to ensure an SPa of 65 years for both genders by 2030. From 2030, however, policy will aim to ensure that 25% of life is spent in retirement while receiving State Pension (with monitoring of life expectancy every five years to ensure that this is the case)[footnote 75]
We did not find comprehensive information about how frequently SPa was changed in national legislation, except when countries used automated adjustment mechanisms (section 2.2.3). As discussed in section 1.1, changes in the SPa legislation are made following major shifts in socio-economic circumstances. For example, there was an increase in the number of pension reforms since 2010, following the global financial crisis.[footnote 76] However, according to preliminary work carried out by the OECD in their ‘Pensions at a Glance 2021’ report, the COVID-19 pandemic has not yet had a major effect on the pension system or brought about significant changes to the SPa.[footnote 77]
Box 1: Reforms to State Pension age in France
France is one of the countries that sets out the SPa directly in legislation. In 2019, the pension system in the private sector in France had two public mandatory tiers: a defined benefit public pension and occupational schemes based on a points system.
Qualifying conditions for a full pension:
- a minimum contributory period of 41.5 years and meeting the minimum legal pension age (e.g. 62 years in 2019 for people born in 1957) or
- a minimum age of 67 (e.g. for people born in 1957)
Based on the 2014 reform, the minimum contributory period will increase from 41.25 years (165 quarters) for people born in 1954 to 43 years (172 quarters) for people born in 1973 or later.
There is limited public information about how the SPa is calculated and its relationship to life expectancy. While the factual information about the SPa (and plans for reforms) is in the public domain, the reasons for setting specific qualifying conditions for different SPa are not transparent, and we understand that these vary among the 42 pension schemes in play (11 of which do not connect the SPa to life expectancy).
Unlike in automatic mechanisms (see section 2.2.3), the basic parameters of changing SPa (e.g. the link to life expectancy, the rate or frequency of changes) are not clear from public information and, in any event, are subject to future legislation.
France allows early retirement (before SPa).
- Main public pension scheme: allowed for people at age 60 with a full contributory record and who started to work before age 20
- Occupational pension: allowed but subject to reductions related to either age of retirement or years of contributions or both
France also encourages later retirement (after SPa).
- Main public pension scheme: for each additional quarter after reaching State Pension age that is spent in employment, the individual’s contribution is increased by 1.25% (5% per year)
- The occupational scheme covering private and agricultural sector employees: workers continue to accumulate points during the period of delayed retirement; work income and pension benefit can be received together without restrictions if people have full-rate pensions (otherwise there are some restrictions)
There are ongoing changes to the French pension system and the SPa.
- France planned to adopt a universal points system covering workers from both the public and private sectors, including the self-employed. The proposal aimed to combine the 42 mandatory pension schemes. The reform was suspended in 2020 with the outbreak of the COVID‑19 pandemic.
- There have been various proposals to increase the SPa from 62. As explored in Table 3, various scenarios have been put forward by the Conseil d’Orientation des Retraites. A 2019 recommendation included increasing the SPa, considering different scenarios depending on different types of accounting regimes possible. This resulted in suggestions with a 1 to 1.8% variation in contribution and with an overall SPa between 63.1 years and 64.3 years.[footnote 78]
Sources: OECD (2019b); OECD (2021a); Conseil d’Orientation des Retraites (2019)
Legislation is also frequently used to reverse or alter previous increases or changes in the SPa. There are multiple examples of legislative measures that set to change or reverse previous changes. Examples are set out in Table 4 and include:
- Croatia accelerated the convergence of SPa and early retirement ages for women to the standard regime by 2027, after which SPa was expected to rise to 67 by 2038. However, the increase to the SPa (and in the early retirement age) is expected to be cancelled.[footnote 79]
- In Czechia, the 2011 policy decision was that, once SPa reached 65 years, in 2030, the SPa would increase by 2 months per year indefinitely (resulting in a faster rate of SPa growth than elsewhere). However, in 2016, the SPa was capped at 65.[footnote 80]
- In Denmark, the commission examining pensions established by the government has recommended that changes be made to the AAM governing the SPa (see Box 7).
- In Ireland, there have been several changes in the direction of policy around SPa increases. While legislation from 2011 stated that the SPa would rise from 66 to 67 (in 2021) and then 68 (in 2028), this was deferred by the government in 2020.[footnote 81] However, in 2021, the Commission on Pensions recommended an increase in the SPa to 67 in 2031 and to 68 in 2039.[footnote 82] It is as yet uncertain whether and how this increase will be brought about in legislation, given that there is some opposition in parliament.[footnote 83]
- The previous decision to raise the SPa in Poland was cancelled in 2017.[footnote 84]
- As part of a pension reform agreement reached by the Dutch government and social partners (employer groups and labour unions), the Netherlands postponed the planned increase in the SPa for two years and then changed the way in which SPa was linked to life expectancy (see Box 8 for further information).[footnote 85]
- Slovakia adopted constitutional amendments to cap the SPa at 64 (for men and women without children) and to undo the automatic adjustments to the SPa to gains in life expectancy (see Box 11).[footnote 86] A year later, in 2021, the government planned to re‑establish a link between SPa and life expectancy.[footnote 87] The OECD attributes this shift to a lack of widespread political agreement on the initial policy.
Table 4: Reversal of changes to State Pension age legislation
| Reversal of changes to the SPa legislation | Countries |
|---|---|
| Reversing or delaying increases in the SPa | Croatia, Ireland, the Netherlands, Poland |
| Removing or loosening the link between SPa and life expectancy | The Netherlands, Slovakia*, Denmark** |
Sources: Economic Policy Committee and Social Protection Committee (2020); Finnish Centre for Pensions (n.d.); OECD (2021a). Notes: *The link is expected to be re-established. **Proposed only.
There have been several legislative efforts throughout OECD and EU countries to equalise SPa between men and women.[footnote 88] Historically, women often had a lower State Pension age than men. Most recently, gender differences in the SPa have been phased out by Bulgaria, Czechia, Estonia, Greece, Italy, Japan, Malta, Slovenia, Slovakia and the UK.[footnote 89] Other OECD countries have legislative plans or policies to phase out gender differences in the coming years, including Austria, Costa Rica, Croatia, Lithuania, Switzerland and Turkey.[footnote 90] Only a few countries in the OECD (Colombia, Romania, Hungary, Israel, Poland) plan to retain a gender difference in the SPa in the future.[footnote 91]
There remain some specific arrangements included in legislation relating to parents in a few countries. In Slovakia, Czechia, and Slovenia, SPa may be lowered if those retiring have children:
- In Slovakia, changes made in 2019 enabled the SPa of mothers to be reduced by 6 months for each child (up to three children). This right may be transferred to fathers if the mother is unable to benefit.[footnote 92]
- In Slovenia, women with 5+ children can have their SPa lowered by up to 4 years. Men with 5+ children can also retire up to 2 years earlier.[footnote 93]
- In Czechia, women who raised children have a lower SPa.[footnote 94]
- In Italy, reforms made in 2017 allowed women to retire at the age of 58 (or 59 if self-employed), after a 35-year career. While initially intended to expire in 2020, this policy was extended to the end of 2021.[footnote 95]
Legislation bringing about other pension reforms. Other legislative reforms may indirectly affect decisions made about the SPa and the extent and nature of changes made. In particular, legislative reforms around early retirement and encouraging longer working lives affect whether and how the SPa is changed.
Countries may restrict or widen access to early retirement. Some countries have phased out special pensions that grant preferential treatment to certain groups of the population (Austria, France, the Netherlands, Romania, Finland, Spain, Sweden).[footnote 96] In Spain, for example, the more generous conditions for partial retirement in the industrial sector are expected to end in 2022.[footnote 97] However, alongside these policies, other countries took measures to extend early retirement options in recent years. These include Denmark (see Box 2), Ireland, Italy, Latvia, the Netherlands and Lithuania.[footnote 98] Other countries allow an earlier SPa for workers with long careers (as explored in Table 5 and Box 3).
Box 2: Expanding early retirement in Denmark and the Netherlands
In Denmark, from January 2022, people who have been employed for at least 42 years before the age of 61 are able to retire and receive a pension up to 3 years before the State Pension age, of 67, with a benefit reduction of 4.2% per year.
In the Netherlands, a new early retirement option was created for those working in ‘arduous occupations’. From 2021 to 2025, employers could allow employees in such positions to retire up to 3 years before the SPa with an early retirement benefit and without a tax penalty for the employer. Criteria to establish these occupations will depend on the individual sectors, and the scheme is employer financed.
Sources: OECD (2021a); Social Security Administration (2019)
Table 5: EU and OECD countries where people with long contributory periods are offered an earlier SPa
| Country | Years of contribution/work needed to ensure an earlier SPa than rest of population | Years difference in the SPa with a longer working life |
|---|---|---|
| Spain | 37 years and 3 months (38.5 years in 2027) | 1 year less (65 vs 66) |
| Italy[footnote 99] | 38 years | 5 years less (62 vs 67) |
| Greece | 40 years | 5 years less (62 vs 67) |
| Croatia | 41 years | 5 years less (60 vs 65) |
| Malta | 35 years | 2 years less (61 vs 63) |
| France | 41.5 years | 5 years and 7 months less (62 vs 66 and 7months) |
| Denmark (from January 2022) | 42 years before age 61 | 3 years less (64 vs 67) |
Note: In Belgium, Austria, Germany and Russia, it is possible to retire earlier than the SPa if one’s working life has been longer. Further information is not given. Sources: Ayuso and others (2021a); OECD (2021a); Finnish Centre for Pensions (n.d.).
Box 3: Lower pension ages for workers with long careers in Portugal
In Portugal, workers aged 60 or older and with at least 40 years of contributory periods can retire early, with the early retirement pension reduced by 0.5% for each month before the SPa (penalty) and multiplied by the sustainability factor (the ratio of life expectancy at 65 in 2000 over life expectancy at 54 the year before the old-age pension is accessible). If the contributory period is longer than 40 years, the SPa is reduced by 4 months for each additional year.
Source: OECD (2021a).
Policies may be enacted that aim to encourage later retirement at an age beyond the SPa. This includes introducing bonuses and penalties for retiring after and before the normal pension age, respectively (see Table 6 – and as in 18 EU countries, as mapped in 2018).[footnote 100] Other policies include:
- introducing flexible retirement pathways and generalising the right to work beyond the SPa and flexible retirement (as recommended by the 2021 pensions commission in Ireland – see Table 1)
- facilitating longer working lives and smoothing transition into retirement, through easing rules to combine work and pensions (e.g. Canada,[footnote 101] Czechia,[footnote 102]Greece,[footnote 103] Japan,[footnote 104] Romania,[footnote 105] Slovenia,[footnote 106] Spain,[footnote 107] UK[footnote 108])
- exempting workers claiming old-age pension from paying pension contributions (e.g. Hungary)[footnote 109]
- introducing a ‘target retirement age’ to nudge people to work longer to offset the effect of the life expectancy coefficient on replacement rates (e.g. Finland, Sweden; see Box 5).
Table 6: Penalties for early retirement and incentives for later retirement in EU countries
| Bonus for later retirement and penalty for early retirement | Bonus for later retirement only | Penalty for early retirement only |
|---|---|---|
| Austria, Bulgaria, Czechia, Croatia, Cyprus, Estonia, Finland, France, Germany, Lithuania, Portugal, Slovakia, Slovenia, Spain | Hungary, Malta | Greece, Latvia |
Source: Economic Policy Committee and Social Protection Committee (2020).
Box 4: How Hungary and Spain encourage later retirement
In Hungary, since 2020, there is an exemption for people over the SPa who combine work and claiming a pension from paying pension contributions: neither the worker nor the employer is required to pay pension contributions. The OECD considers that this provides a strong incentive for people to work later.
Ongoing legislative efforts in Spain seek to increase incentives for working later and to discourage early retirement. A legislative proposal would increase contribution rates for those working past the SPa to 4% (regardless of the length of the contribution period) and provide people working past the SPa without claiming a pension to receive 1 year’s bonus for deferring retirement, as a lump-sum payment (expected to be around 30% to 50% of yearly benefits). The proposal also changes the current penalties for early retirement. The proposal has been accepted by the government and social partners and is expected to be implemented by the end of 2023.
Source: OECD (2021a).
Box 5: Flexible and ‘target’ retirement age in Sweden
In Sweden, individuals are able to draw an earnings-related national pension from the age of 62 and a guaranteed pension benefit from the age of 54 but are entitled to stay in employment until they are 68 years old (the current mandatory retirement age, which is intended to increase to 69 from 2024).
In 2019, Sweden introduced the ‘target retirement age’ to nudge workers to delay their retirement, by indicating what the age to retire should be to compensate for the effect of the life expectancy coefficient on replacement rates. This has been set at the age of 67 and is effective from 2026.
Other changes to the SPa in Sweden include:
- Increasing the minimum SPa for public earnings-related pensions from 61 to 62 years and planning further increases to 64 in 2026
- Linking the SPa to life expectancy from 2026 (transferring two thirds of gains in life expectancy into time spent in retirement)
- Increasing the eligibility age to the basic pension from 65 to 67 years in 2027
Source: OECD (2021a).
Finally, there have been some developments to improve access to pension systems for people in types of work other than permanent, full-time employment. This has included granting legal access to previously excluded categories or making statutory access compulsory for the self-employed (e.g. Lithuania, Romania)[footnote 110] and harmonising and improving the ability to transfer entitlements between old-age schemes related to different categories of workers (e.g. France, Greece, Italy, Poland).[footnote 111]
2.2.3. Automatic adjustment mechanisms link the SPa to life expectancy
AAMs are predefined rules that automatically change set parameters, based on demographic, economic or financial indicators. One way in which an AAM can be used is to link the SPa to life expectancy.
The OECD recommends the use of AAMs because they are transparent. In the case of indexation to life expectancy, using AAMs can make it clearer how changes to the SPa are made. The OECD considers that AAMs are the best way to solve challenges of demographic changes caused by higher life expectancy because of their transparency, ability to react quickly to changes in life expectancy and generate smoother change, and because they allow more frequent reform of pensions without the need for political intervention.[footnote 112]
The OECD also notes, however, that for AAMs to achieve their objectives, it is important that AAMs be designed to endure over time and throughout shifts in political systems and to avoid the suspension or bypass of existing AAMs.[footnote 113] Suggestions on how to do so include:
- concentrating on small adjustments over large adjustments
- using separate measures to bring about bold discretionary changes
- building and ensuring broad political and popular support for the particular AAM[footnote 114]
- ensuring that AAMs are designed appropriately, using accurate and relevant projections[footnote 115]
- designing sufficient administrative capacity to manage updates[footnote 116]
Use of adjustment mechanisms to link the SPa to life expectancy
AAMs have been recently used to link the SPa to life expectancy in various ways in eight countries (Estonia, Finland, Greece, Italy, the Netherlands, Denmark, Portugal, Slovakia) and are planned for use in Sweden from 2026.[footnote 117] There is considerable variation between different AAMs. From the literature, we identify 10 important variables in which AAMs can differ (see Table 7):
- Age at which the link to life expectancy is set: The age at which the link to life expectancy is calculated can vary. In most countries, this is set at 65 (which may be because 65 is either the current SPa or the target retirement age in most OECD countries).[footnote 118]
- Rate: The rate at which life expectancy increases translate to SPa increases can vary. If the rate is set as one-to-one (Denmark, Estonia, Greece, Italy), then all additional years of life expectancy will be added to the working life. If the rate is set at two thirds (Finland, the Netherlands, Portugal), then only 8 months of each additional year of life expectancy will be added to the working life. See Box 6 for more detail.
- Frequency of revisions: How frequently the AAM is set up to trigger changes in the SPa can vary. Changes may take place annually (Estonia, Finland, the Netherlands, Portugal); every few years (Italy, Greece); or every 5 years (Denmark).
- Notice period: The time between the AAM establishing a new SPa and the new SPa coming into practice may vary between countries. The shorter the period, the more ‘aligned’ the AAM is with changes in life expectancy. In Greece, the notice period is 1 year while Estonia, Italy and Portugal use 2 years for their notice period. Longer notice periods are found in the Netherlands (5 years) and Denmark (15 years).
- Minimum SPa increase: The AAM may stipulate the shortest amount of increase in the SPa that the AAM can trigger. In most countries, an increase in the SPa period is set at 1 month (Estonia, Finland, Italy, Portugal), although the Netherlands sets 3 months and Denmark sets 6 months. A few countries do not set out a minimum increase (Greece, Slovakia). AAMs that have no minimum or only a small minimum may be considered the most sensitive to life expectancy increases, while those that set larger minimums may do more to smooth the increases in SPa for those experiencing them.
- Maximum SPa increase: The AAM may stipulate the largest amount of increase in the SPa that can be triggered at each point. The maximum increase is set as 2 months in Finland; 3 months in Estonia, Italy and the Netherlands; and 1 year in Denmark. There is no maximum increase set in Greece, Portugal, and Slovakia.[footnote 119] AAMs that have no maximums may be considered the most sensitive to life expectancy increases, while those that do set maximums may do more to smooth the increases in SPa for those experiencing them.
- Direction of change: In some countries, policy stipulates that the AAM can only change the SPa when there is an increase in life expectancy (Denmark, Italy, the Netherlands). In other countries, the AAM may be used to decrease the SPa, should life expectancy decline (Estonia, Finland, Greece, Portugal).
- Time period of data used to consider life expectancy: Different countries use data from different ranges. For example, Italy uses an average of preceding 4 years (Denmark uses an average of preceding 2 years).
- Life expectancy type: Legislation may stipulate the type of life expectancy estimates that it is based upon, that is, whether PLE or CLE. See section 2.3 for more information.
- Level of automation: The AAM may be established in legislation to come into place automatically (‘fully automatic’) or may require parliamentary or other approval before entering into force (‘semi-automatic’). See below for more information.
Box 6: Rate of linking State Pension age with life expectancy
There are two main ways in which AAMs have linked the SPa to life expectancy:
-
Two thirds link: Under this linkage, two thirds of longevity gains are passed into the SPa increases (Finland, the Netherlands, Portugal, Sweden). This keeps the proportion of adult life that people can expect to spend over the SPa roughly the same across cohorts. According to the OECD, this helps to ensure a stable pension rate across generations if fertility rates are equal to a population replacement rate of around 2.1. Lower fertility rates may require a faster link.
-
One-to-one link: Under this linkage, all longevity gains are passed into SPa increases (Denmark, Estonia, Greece, Italy). This leads to a steady decline in the length of the period spent above the SPa relative to the period spent working.
These different ways of linking the SPa to life expectancy have different effects on the rate of SPa change. As seen in Figure 2, when a one-to-one link is used, the SPa rises more sharply and to a greater extent than when a two thirds link is used. The OECD ‘Pensions at a Glance 2021’ report flags that one-to-one links may not be politically sustainable, given the steady reduction of the share of life spent in retirement compared with the share of life spent in work, and the report cites recent changes in policy from the Netherlands and Slovakia.
Figure 2: Change in normal retirement age for those retiring between 2005 and 2050 in countries now linking the State Pension age to life expectancy
One-to-one link:
| Country | 2005 | 2021 | 2035 | 2050 |
|---|---|---|---|---|
| Denmark (2030) | 65 | 66.5 | 69 | 71 |
| Estonia (2027) | 63 | 64.25 | 66.6 | 68.8 |
| Greece (2021) | 58 | 62 | 63.5 | 64.83 |
| Italy (2013) | 57 | 67 | 68.25 | 69.5 |
Two-thirds link:
| Country | 2005 | 2021 | 2035 | 2050 |
|---|---|---|---|---|
| Finland (2030) | 65 | 65 | 65.58 | 66.92 |
| Netherlands (2026) | 65 | 66.33 | 67.5 | 68.33 |
| Portugal (2015) | 65 | 66.42 | 67.5 | 68.37 |
The year in parentheses is the year from which the link started or will start to apply. The numbers shown also include discretionary increases before the link kicks in. For Denmark, the SPa projected for 2050 is slightly lower than in the most recent projections from the national statistics institute, according to which it would be 71.5 years. The data for Estonia in 2005 show the normal retirement age for men; the SPa for women was at 59 years during the first half of 2005 and at 59 years and 6 months in the second half of that year. The data for Finland show the age from which a person has access both to the earnings-related and the targeted pension scheme. In the earnings-related scheme, the normal retirement age was 63 years in 2005 and is 63 years and 9 months in 2021.
Source: OECD (2021a).
Table 7: Characteristics of AAMs that index State Pension age in eight OECD countries
| Country | Estonia | Finland | Greece | Italy | The Netherlands (from 2019) | Portugal | Slovakia (2012 to 2019) | Denmark |
|---|---|---|---|---|---|---|---|---|
| Year legislated | Not available | 2015 | 2010 | 2010 | 2012 (1 to 1 link), 2026 (2/3 link) | 2013 | 2012 to 2019 | 2006 |
| Age at which link to life expectancy is set | 65 | 65 | 65 | 65 | 65 | 65 | 63 | 60 |
| Rate at which life expectancy increases translate | 1 to 1 | 2/3 | 1 to 1 | 1 to 1 | 2/3* | 2/3** | 1 to 1 | 1 to 1 |
| Frequency of revision | 1 year | 1 year | 3 years | 2 years | 1 year | 1 year | Not given | 5 years |
| Notice period | 2 years | 3 years | Max. 1 year | 2 years | 5 years | 2 years | Not given | 15 years |
| Minimum SPa increase possible | 1 month | 1 month | No | 1 month | 3 months | 1 month | No | 6 months |
| Maximum SPa increase possible | 3 months | 2 months | No | 3 to 5 months | 3 months | No | No | 1 year |
| Direction of change | Two-way | Two-way | Two-way | One-way | One-way | Two-way | Not given | One-way |
| Time period of data used | Not given | Not given | Not given | Average of preceding 4 years | 5 years in advance | Average of preceding 3 years | From 4 to 8 years previously | Average of preceding 2 years |
| Type of life expectancy calculation | PLE | PLE | PLE | PLE | PLE | PLE | PLE | PLE |
| Level of automation | Automatic | Automatic | Automatic | Automatic | Automatic | Automatic | Automatic | Semi-automatic |
Sources: Ayuso and others (2021a); Economic Policy Committee and Social Protection Committee (2020); OECD (2019a, 2021a); Ministero dell’Economia e delle Finanze (2017); Camera dei Deputati, Servizio Studi, XVIII Legislatura (2022); Retsinformation (2011). Notes: * The Netherlands had a previous AAM in place that had a 1 to 1 rate. ** For someone with more than 40 years of contributions, the State Pension age increases by only half of life expectancy gains.
An AAM may be overseen and amended through legislation or through being set up as semi-automatic adjustment mechanism. As explored in Table 7, Denmark has a semi-automatic mechanism in place, meaning that the AAM requires external approval to be put into action. In Denmark, parliamentary approval is required to apply the link and change the SPa in line with the AAM. This allows the Danish parliament to exercise additional control and make any changes subject to political approval. Perhaps as a result of these conditions, we found that the Danish AAM has several characteristics that mean the link with life expectancy is moderated: it is less frequently updated (every 5 years); slower to take effect (with a 15-year notice period); and has a higher minimum and maximum increase that is possible (6 months to 1 year). These features are, however, to some extent offset by the earlier age for which the link to life expectancy is based (60 years, as opposed to 65 years in other countries) and the fact that the rate of matching is one-to-one (all extra years of life expectancy translate to extra years in work). However (as explored in Box 7), there are current proposals that would change both features. In Denmark, the period that people can expect to live in retirement while receiving State Pension, on average, is fixed at 14.5 years.[footnote 120]
While other AAMs are, in practice, fully automatic and do not require political intervention to operate, we note that there have been several recent examples of changes made to AAMs (including in the Netherlands and Slovakia, as explored in section 2.2).
Box 7: Proposed changes to the automatic adjustment mechanism used in Denmark
In 2020, an independent commission was set up to examine the State Pension system in Denmark and whether any changes were needed. Findings from the commission released in May 2022 recommended a few changes to the way in which the SPa is calculated, including:
- Age at which link to life expectancy will be set: the commission recommended that remaining life expectancy at the SPa is used (instead of the life expectancy at age 60)
- Rate: the commission recommended that 80% of the increase in life expectancy is spent in work and 20% is spent in retirement (instead of 100% of increase being spent in work, or one-to-one matching)
- Direction of change: the commission recommended that the AAM allows the SPa to decrease as well as increase, by at least six months and by no more than 1 year
The commission proposed no changes to the semi-automatic processes, the maximum and minimum increases, the frequency of regulation, and the notice period.
The rationale for the changes, cited by the commission, is that life expectancy has increased more than it had been expected to do at the time the initial AAM was put into place, and the corresponding increase in the SPa means that future generations will spend a greater proportion of their life in work than previous generations.
The commission’s recommendations will now be considered by the government and parliament, who will decide whether and how to adopt the recommendations. If adopted as proposed, changes will come into force in 2040 and into effect in 2045.
Source: Beskæftigelsesministeriet (2022).
Other automatic indexation mechanisms are used to determine other aspects of the pension system, and these interact with indexation to the SPa.
Many countries use AAMs to determine other aspects of pension policy, including the amount of pension benefit received. In various countries within the OECD, this may be determined through an AAM that links life expectancy, the size of the working population, or various financial factors to the amount of benefit that is paid.
Almost two thirds of OECD countries have at least one AAM, while 10 countries have multiple AAMs in place (Denmark, Estonia, Finland, Greece, Italy, Latvia, the Netherlands, Norway, Portugal, Sweden). For example, Sweden has multiple AAMs governing their pensions system, including benefits that are adjusted to life expectancy, and a balancing mechanism that considers both the contribution assets and the value of the reserve fund.[footnote 121] Further information on other AAMs may be found in OECD (2021a).
2.3. What variables are used (and how are they used) to change and determine the State Pension age?
This section sets out how variables are used to change and determine the SPa. As explored in section 2.2, the main variable used to determine the SPa is life expectancy, with AAM linking the two.
Therefore, this section concentrates on the way in which life expectancy is used when determining the SPa (including considerations around how it is calculated and how it interacts with other variables). In this section, we draw particularly upon a few sources that concentrated on variations in life expectancy calculation (including Ayuso and others 2021a, 2021b; Bravo and others 2021a, 2021b).
2.3.1. Formulae can represent how the SPa is calculated in countries with AAM
Eight OECD countries have recent experience of using automatic or semi-automatic indexation mechanisms that link the SPa to life expectancy.[footnote 122] Table 7 outlines the basic characteristics of these mechanisms and how they feature in the eight countries. This section looks in more detail at the formulae used to calculate the SPa in four countries.[footnote 123]
Across all countries explored here, life expectancy at age 65 (as calculated by the Human Mortality Database) is increasing, albeit from different starting points (as shown in Figure 3).
Figure 3: Projected increases in life expectancy in Denmark, France, Italy, Japan, Portugal and United Kingdom
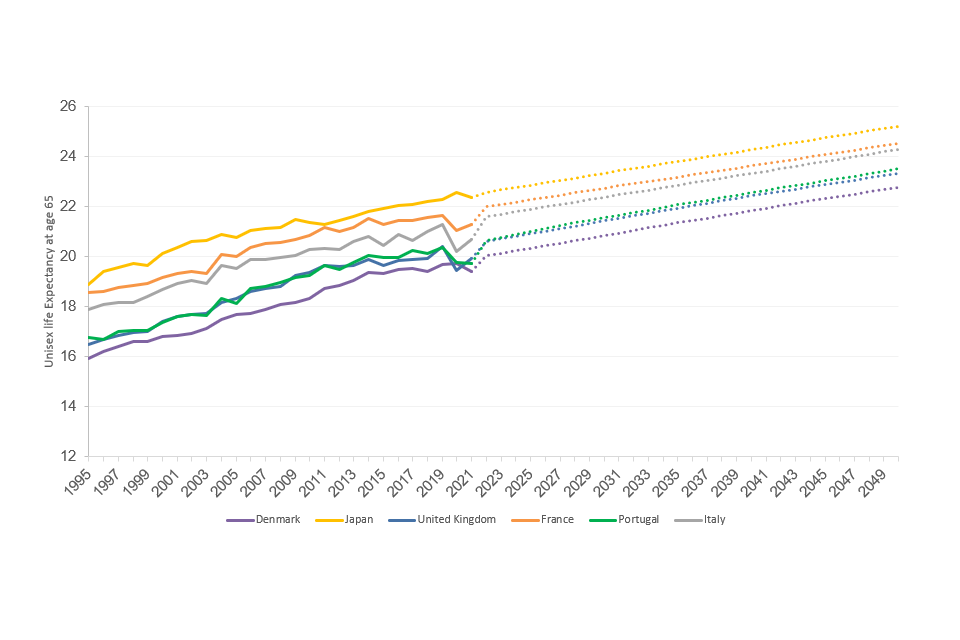
Line chart showing the projected increases in life expectancy in Denmark, France, Italy, Japan, Portugal and the United Kingdom until 2050.
Source: United Nations, Department of Economic and Social Affairs, Population Division (2022). World Population Prospects 2022, Online Edition.[footnote 124]
Box 8: How State Pension age was calculated in the Netherlands until June 2019
Until June 2019, the SPa was automatically indexed to life expectancy in the Netherlands in a way that can be represented by the following formula:
V = (L – 18.26) – (P – 65)
Within this formula:
- V = increase of eligibility age in years
- L = the remaining unisex PLE at the age of 65 as projected by the national statistics institute (Statistics Netherlands)
- P = the eligibility age in the year before the year in which the rise is considered
- 18.26 = the average time (in years) that Dutch policy aims for all people to spend in retirement while receiving State Pension; this represents the average PLE at 65 for the years 2000 to 2009
- 65 = the age at which life expectancy is calculated
This formula was designed to allow each person to spend an average of 18.26 years in retirement. As a result, all additional years of life are meant to be spent in employment (see Box 6 for more detail).[footnote 125]
If the increase in the eligibility age (V) as determined by the above formula is negative or less than 0.25 years, then the value of V is set at 0 (as the legislation does not allow for a decrease in the State Pension age on the basis of life expectancy – see Table 7. If the increase of eligibility age (V) is 0.25 years or higher, then increases can be no more than 3 months per year. If it is more, the excess is moved to the next year’s revision. The pensions law also requires the national statistics institute to publish life expectancy projections, with explanations of their uncertainty, and it requires that projections of the pension age be published with probability distributions and uncertainty intervals.
- However, in June 2019, the Dutch government agreed to slow down scheduled increases in the State Pension age due to the deceleration of increases in life expectancy as calculated by Statistics Netherlands. From June 2019, the SPa at that time (66 years, 4 months) was frozen for 2 years.[footnote 126]
- The Dutch government plans to revert to an AAM from 2025, with a change in the rate of indexation to life expectancy. Rather than a one-to-one matching (where every year of life translates into an additional year of work), the SPa will be increased by two thirds for every additional year of life expectancy from 2025.[footnote 127]
Sources: Formula from Ayuso and others (2021a); Royal Dutch Actuarial Association (2020). Additional information from Anderson (2019); OECD (2021a); Van Duin (2013).
Box 9: How State Pension age is calculated in Denmark
In Denmark, the indexation formula for the SPa has been represented as:

xrDNK(t) = 60 + [(e.P60 (t-15) + 0.6) – 14.5]
Within this formula:
- xrDNK(t) = SPa in year t in Denmark
- e.P60 = remaining life expectancy observed for people aged 60 over the past 2 years (using unisex PLE that takes life expectancy in 2004 to 2005 as a model)
- (t-15) = indexing variable that takes into consideration the notice period before the change in the SPa takes effect (i.e. the expected remaining life expectancy at 60 of those who are currently 45)
- 0.6 = the assumed increase in life expectancy (in years)
- 14.5 = the time (in years) that Danish policy aims for all people to spend in retirement while receiving State Pension
Danish policy is that people spend an average of 14.5 years in retirement: as a result, all additional years of life are meant to be spent in employment (see Box 6 for more detail). According to Ayuso and others (2021a), the overall aim of the current Danish indexation of State Pension age to life expectancy (as established in 2007) was to restore financial equilibrium.[footnote 128]
Life expectancy at 60 is calculated every 2 years using base and unisex data from Statistics Denmark.[footnote 129] The maximum increase in the State Pension age that can be approved is 1 year every 5 years (see Table 7). All increases are rounded to the nearest half year.[footnote 130] Any excess is moved to the next planned revision.
As a semi-automatic indexation, all pension age adjustments must be approved by the Danish parliament and take effect only 15 years later. The time lag is factored into the indexation mechanism used.[footnote 131]
Changes to the AAM used by Denmark have been proposed by an independent commission. Please see Box 7 for more information.
Sources: The formula is used in Ayuso and others (2021a), which cites no original sources. The formula incorporates additions from Nordic Social-Statistical Committee (2008). The original source for the 2007 introduction of the automatic mechanism is Beskæftigelsesministeriet (2007). The original source for the 2011 reform of the pension age is Retsinformation (2011).
Box 10: How State Pension age is calculated in Portugal
In Portugal, additions to the SPa after 2014 are most recently represented in national legislation by the formula:

Mn = ∑n t=2015 (EMVt-2 – EMVt-3) x 12 x 2/3
In this formula:
- M = the number of months to be added to the pension age as it was in 2014
- N = the year in which someone would be entitled to start to receive their pension
- EMV = life expectancy at age 65. Life expectancy is published annually by the Instituto Nacional de Estatistica, using an average from the preceding 3 years
- (EMVt-2 – EMVt-3) = the difference between life expectancy published 2 years previously (t-2) and that published the year before that, (t-3)
- 12 x 2/3 = this represents two thirds of any increase in observed life expectancy being added to the months of additional work life
The Portuguese system calculates additional SPa in months, which are then added to the existing SPa. There is no maximum or minimum increase possible that is included in the legislation.
Source: Formula from Presidência do Conselho de Ministros (2021). While not cited here, an earlier formulation of this indexation is also represented in Ayuso and others (2021b), which drew on Ministério da Solidariedade, Emprego e Segurança Social (2013).
Box 11: How State Pension age was calculated in Slovakia
The formula that represents the indexation of the SPa to life expectancy in Slovakia between 2012 and 2019 can be represented as:

xrSVK(t) = xrSVK(t-1) + [e.PX(t-7:t-3) – e.PX(t-8:t-4)]
Within this formula:
- xrSVK(t) = SPa in year t in Slovakia
- xrSVK(t-1) = SPa in the year before year t in Slovakia
- e.PX(t-7:t-3) = the five-year moving average in PLE observed between t - 7 and t -3
- e.PX(t-8:t-4) = the five-year moving average in PLE observed between t - 8 and t - 4
The State Pension age therefore builds on the previous year’s State Pension age: the difference between the newer life expectancy average (e.PX(t-7:t-3)) and the older life expectancy average (e.PX(t-8:t-4)) is added to the previous year’s SPa. Calculating the SPa based on moving averages in this way is recommended by the OECD.
The formula above calculates the difference between life expectancy in days. Under this formula, the State Pension age changes each year, and this could result in small incremental changes (a matter of days). This formula also incorporates one-to-one indexation: all additions to life expectancy are expected to be spent in work – with no corresponding increase to the proportion of time spent receiving State Pension.
- As discussed in section 2.2, a reform in 2019 changed how Slovakia calculated its SPa. From 2019, rather than being indexed to life expectancy, the SPa increased by 2 months per year until the SPa reaches 64 years.[footnote 132]
Source: Ayuso and others (2021a), which cites no primary sources.
2.3.2. Life expectancy is also considered when determining the SPa through mechanisms other than AAM
While only a few countries may formally have an AAM (as categorised by the OECD in 2021), other countries follow processes that involve consideration of the life expectancy changes in the country. These typically include having a statutory requirement to publish updates on life expectancy in relation to State Pension age, which governments and decision makers can then consider in terms of reform. Examples include:
- Czechia. According to the OECD, Czechia has a long-term planning policy that resembles a semi‑AAM of the SPa to life expectancy. The policy aims for 25% of life to be spent in retirement while receiving State Pension. This is put into practice by a report published annually that includes life expectancy calculations for every cohort between ages 25 and 54.[footnote 133] If life expectancy for at least one of these cohorts is calculated in a way that would mean more than 26% or less than 24% of life would be spent in receipt of State Pension, then the report signals this and considers what SPa would achieve 25% of life in retirement. However, there is no (legal or other) mechanism to translate these targets to changes in the statutory State Pension age.[footnote 134]
- Malta. In Malta, legislation requires that a report be provided by the Ministry for Social Security to parliament every five years. This report reviews the state of the pensions system and considers the changes in life expectancy, with the aim of ensuring that there is a stable ratio achieved between time spent contributing and time spent in retirement while receiving a State Pension. The report then prepares recommendations for any changes deemed appropriate.[footnote 135] This information is used by the Maltese government to decide any changes to the SPa.
- Current policy in the UK. As discussed in section 1.1, the Pensions Act 2014 requires consideration of the State Pension age in reference to life expectancy and other relevant factors via a statutory review every six years.
2.3.3. There are two main methods of calculating life expectancy
These two main ways are:[footnote 136]
- Period-based life expectancy: This is estimated using mortality data from across the population for a recent period (for example, a three-year average). In predicting life expectancy, these mortality rates are assumed to remain unchanged.[footnote 137] These calculations may be made by national statistics institutes (most common in developed countries).
- Cohort-based life expectancy: In this method, projected changes in mortality are used to estimate the life expectancy of each cohort (i.e. those born in the same year) depending on their gender.
In practice, there are different ways of estimating both PLE and CLE. Through national statistics institutes, countries frequently estimate population-wide life expectancy using observed and projected data. International bodies also produce life expectancy estimates for a number of countries which may be then used for international calculations.[footnote 138] For example, the United Nations produce country-specific projections of mortality rates based on projected changes in mortality rates after the SPa (i.e. cohort-based mortality projections); these are used to estimate life expectancy in Figure 3.[footnote 139]
Countries with AAMs linking life expectancy and the SPa tend to use PLE calculations when considering and determining pension benefits and systems. While a few countries also calculate and release CLE alongside PLE (including Australia, the UK, and the US), very few use CLE data in determining the SPa or pensions benefits.[footnote 140] However, in the UK, the 2017 State Pension age Review drew upon CLE projections when assessing the SPa.[footnote 141] International bodies, such as the OECD and the EU, also rely on PLE calculations and recommend these (based on a moving average of mortality) for use.[footnote 142] In the seven countries where the SPa is or has been calculated according to life expectancy, the life expectancy measures used are all PLE, as calculated by national statistics institutes.[footnote 143]
Using CLE in calculations of the SPa requires high-quality data and plausible assumptions. Because CLE is based on projected changes in mortality using a mortality projection model, many more assumptions are used than in PLE (which is based only on historical mortality rates). The accuracy of the estimates is dependent on good data quality.[footnote 144]
There are different models, parameters and decisions that can be used to calculate CLE. Different models may be used, with different parameters for the entire population and for important sub-populations (for example, accounting for regional and gender differences). Different models and parameters may be most appropriate for different countries.[footnote 145]Various models have been developed by academics to calculate CLE, including by Ayuso and others (2021a); Bravo and others (2021a); and Cairns and others (2009).[footnote 146]
PLE tends to underestimate true life expectancy, meaning that increases in the SPa may not achieve the desired outcomes. Calculations of CLE using academic models demonstrated that there is a persistent gap between PLE and CLE estimates made at age 65 (see Box 12),[footnote 147] resulting in a systematic underestimation of the remaining lifetime at the SPa.[footnote 148] [footnote 149] The OECD also considers that estimates of life expectancy which used CLE would increase life expectancy estimates for people aged 65 in 2060 to 2065 by 1.5 years (for women) and 1 year (for men) compared with the PLE measure.[footnote 150] Analysis suggests that this difference is particularly pronounced where there is a faster decline in mortality at older ages. This means that pension policies may not achieve their desired outcomes, because those receiving a State Pension live longer than anticipated, meaning time spent in retirement is longer than planned (Denmark, the Netherlands) or the proportion of time receiving State Pension is longer (Portugal); as a result, the funds spent on pensions are higher than anticipated.[footnote 151] [footnote 152]
The resulting issues at a policy level include financial viability and sustainability, the OADR changing, the distortion of labour supply decisions, and the ultimately bigger-than-equitable subsidising of the retired by the working generations.[footnote 153]
Box 12: More information on modelling of the PLE and CLE gap and estimations around the financial effect on pensions
Analysis by Ayuso and others (2021b) in Portugal and Spain found significant differences between CLE and PLE in what is increasingly known as the ‘life expectancy gap’.[footnote 154]These differences are particularly prominent at younger ages (with cohort lifetables estimating around 8 to 15 years longer life expectancy than PLE at birth). While the gaps reduce over time (with around 2 to 4 years difference at age 65), the gap remains at the age of the SPa.
Bravo and others (2021b) built on this work by setting out to estimate the life expectancy gap in 42 countries between 1960 and 2050[footnote 155] and the financial effect of this gap. They developed models to estimate both PLE and CLE for the 42 countries, and their findings included the following:
- In 37/42 countries, period and cohort life expectancy continued to increase, with sex differences in CLE expected to decrease.
- In almost all countries, for almost all years, there was a gap between relevant PLE and CLE estimates, with CLE suggesting a longer life expectancy than PLE.
- When they quantified the size of unfunded pension liabilities (i.e. the effect of a longer life expectancy than planned in pension policy), expressing this in terms of the subsidies (received by those in retirement and receiving State Pension) and taxes (on the working) for 21/42 countries investigated, this resulted in more than 10% of the cohort’s accumulated pension wealth.
- Based on analysis in this article, PLE systematically underestimates remaining lifetime; this confirms that the gap at the SPa is persistent and set to grow.
In both analyses, the gap between PLE and CLE is less when countries are experiencing a slower decline in mortality at an older age. Examples included Bulgaria and Slovakia,[footnote 156] as well as some post-Communist countries (Belarus, Russia, Ukraine), and the gap was attributed to issues around public health and incomplete transition process.[footnote 157]
Sources: Ayuso and others (2021a); Bravo and others (2021b).
Some features of AAMs (long notice periods, caps on the increase per period) may compound these policy issues further. When examining the mechanisms in Denmark, the Netherlands, Portugal and Slovakia, Ayuso and others, and Bravo and others conclude that in three of these countries legislated pension ages deviate from target policy outcomes due to the way policy has been designed and implemented:[footnote 158]
- In Denmark and the Netherlands, the use of provisions limiting the maximum increase per period and/or indexation with long notice periods (see sections 2.2 and 2.3), combined with the use of PLE, meant that the average time spent in receipt of State Pension is likely to be longer than the anticipated 14.5 and 18.26 years, respectively.
- In Portugal and Slovakia, however, the pension age path is less sensitive to the use of PLE instead of CLE and will only generate significant bias if trends in period and cohort life expectancy substantially deviate over time. This is because, unlike in Denmark and the Netherlands, the SPa policies do not aim for a certain number of years spent in receipt of State Pension.[footnote 159]
As such, provisions that aim to smooth pension changes for individuals may compound some challenges around using PLE.
2.3.4. Other considerations when expressing life expectancy for use in the SPa calculation
While not always considered in a policy setting, there are additional considerations that have been noted as important to keep in mind when considering life expectancy. These include consideration of heterogeneity among the population and of healthy life expectancy.
Differences between socio-economic groups
There are differences between socio-economic groups in terms of life expectancy, which may not be reflected in calculations of the SPa that draw upon national average life expectancy.[footnote 160]
Within the OECD, there is considerable inequality in life expectancy between socio-economic groups, with those from higher socio-economic groups living longer than those from lower socio-economic groups.[footnote 161] PLE in the UK between 2007 and 2011 was nearly 4 years greater for men in the highest group (class 1 – ‘higher managerial or professional’), according to Standard Occupational Classification[footnote 162] than for men in class 7 (‘routine occupations’), and it was around 3 years greater for women.[footnote 163] Within Europe, the difference in remaining life expectancy at age 50 between individuals with lower[footnote 164] and higher[footnote 165] educational attainment ranges from 1.6 years in Finland for women to 11.3 years in Estonia for men.[footnote 166] An implication of wealthier individuals living longer is that they will receive the State Pension for a longer period: over the course of retirement, they may receive relatively more State Pension than those in lower socio-economic classes who may live for less long.[footnote 167]
As such, there are equity issues when the SPa is based on national average life expectancy, particularly in countries where there continue to be differences in life expectancy based on socio-economic group.[footnote 168] The OECD considers that such considerations may be best addressed through means-tested benefits (outside of the pension system), with some concerns around the feasibility of taking group-specific mortality rates and life expectancies into account.[footnote 169] At present, it is not clear that these equity issues are fully addressed in the different countries we have reviewed.[footnote 170] Suggestions that have been made include individual targeting and assessments of working capacity as alternative mechanisms to address health and associated mortality inequalities.[footnote 171]
Healthy life expectancy
It is not yet clear how concepts of healthy and disability-free life expectancy have affected policy making around the SPa.
It is well established that longer life expectancy does not always translate into longer healthy or disability-free life expectancy (i.e. the period of life where people are sufficiently healthy).[footnote 172] Across the OECD countries participating in the EU Statistics on Income and Living Conditions (EU-SILC) survey, the number of healthy life years remaining at age 65 was 9.6 for women and 9.4 for men – considerably less than the remaining life expectancy at that age for both genders.[footnote 173] However, formally projecting future healthy life expectancy involves considerable uncertainties, even when standardised assumptions and models are used.[footnote 174]
In a few countries, individuals can receive their State Pension early if they have worked in a physically demanding job (for example, in Slovakia, if someone carries out ‘physically strenuous work’ and has had a long working life, the SPa may be reduced to an age between 55 and 59). In Denmark and Italy, policies have been recently introduced that allow an earlier SPa for those who have lost the ability to work after a long career. In Denmark, individuals who have at least 20 to 25 years of full-time employment may receive a pension up to 6 years before the normal retirement age. In Italy, a policy in place until the end of 2021 allowed people considered unemployed or disabled to receive a pension from the age of 63 if they had had at least 30 years of contributions.[footnote 175]
Beyond this, it is not yet clear whether increases to the SPa policy internationally have formally considered the role of healthy life expectancy when determining or calculating the SPa.
Adult life starting age
Measures that link the SPa to life expectancy may not always consider variation in adult work starting ages, which may occur when some individuals begin their working life earlier than others. In their calculations of life expectancy and pension rates, the OECD uses 22 as the age at which an individual enters the labour market and works until the normal pension age.[footnote 176]
The 2019 Joint Paper on Pensions [footnote 177] has suggested that measures to discourage early retirement (see section 2.2.2) may be restrictive to those starting work at an earlier age. These workers are less likely to have high educational attainment, meaning their life expectancy upon the SPa is likely to be lower, introducing a question of equity.[footnote 178] These inequalities due to early labour market entry were behind Italy’s pension reforms in 2019, known as the ‘quota 100’, which allowed individuals to draw a pension from age 62 if they had contributed for 38 years.[footnote 179]
In some countries, the number of years of contribution is used to determine the SPa (see Table 5). This may mean that those beginning employment before the usual entry to labour market are also able to apply. However, these are considered early retirement routes, and there is no indication in any calculations of the SPa in Denmark, the Netherlands, Portugal or Slovakia that calculations include a set age for when an individual is likely to start employment.
3. Conclusions
This report explored the following three questions: (i) What factors affect changing the SPa? (ii) How are changes made to the SPa internationally? (iii) What variables are used (and how are they used) to change and determine the SPa? Summary answers to these questions are outlined below, followed by cross-cutting themes emerging from this review and overall implications from this research.
Factors that affect changes to the SPa
Most high-income countries are facing a similar dilemma: how to ensure sustainability of public pension schemes in the face of significant increases in the OADR due to gains in life expectancy and ageing of their society. The SPa increases have been used as one of the main tools to respond to these challenges. Changes in the SPa are generally not arbitrary, isolated reforms, but are dependent on the current pension system and other pension reforms, outside pressures on the pension system and political expediency.
Changes made to the SPa internationally
Changes in the SPa take place through a range of processes, including recommendations from government commissions, legislated increases, and AAMs indexing the SPa to life expectancy. While these elements can be considered sequential components of one process (a government commission followed by legislated measures which may include AAMs), the changes reviewed did not always follow the sequential logic. Given that these changes occur against varying social, economic and political backdrops, there is no one formula for changing the SPa that holds true for all countries, and, in many cases, countries do not use all three elements in instigating changes to the SPa.
Increasing the SPa is a common legislative measure for addressing pension viability and sustainability challenges. Common legislated changes to the SPa include scheduled increases of the SPa, establishing a minimum SPa, setting up an AAM and equalising the SPa between men and women. Legislative changes to the SPa are often accompanied by reforms of early retirement, incentives for later retirement, and changes in pension eligibility based on length of career or contribution period.
Legislation is used in seven countries to introduce AAMs, which tie the SPa to changes in life expectancy and aim to smooth the process of changing the SPa in response to changes in life expectancy. AAMs may differ from each other in 10 main ways, including:
- age at which link to life expectancy is set
- rate at which SPa is linked to life expectancy
- frequency of revisions
- notice period considered
- minimum SPa increase allowed
- maximum SPa increase allowed
- whether the SPa can decrease as well as increase
- the time period of data used
- the way in which life expectancy is calculated
- the level of automation
Inherent in these considerations is the tension between ensuring fiscal sustainability of the pension system through sufficient sensitivity in the SPa to changes in life expectancy, on the one hand, and ensuring fairness by providing adequate notice of changes and maintaining equity in time spent in receipt of State Pension across generations, on the other hand.
Changes in the SPa do not follow a linear trend: countries frequently revisit, amend or overturn previously legislated and AAM-caused changes to the SPa. While the general trend over the past two decades has been to increase the SPa, there are several counterexamples of plans that have been frozen or reversed. In particular, a number of countries that set out to increase the SPa in line with life expectancy have now loosened or abolished the link (including the Netherlands and Slovakia) or are proposing to do so (Denmark).
Finally, while an AAM explicitly and automatically links the SPa to life expectancy, other countries may use similar estimates to update their SPa manually.
Variables used (and ways in which they are used) to change and determine the SPa
Life expectancy is the main variable used in determining the SPa, as many AAM in place linking the SPa to life expectancy. We present some formulae explaining how changes in life expectancy translate to changes in the SPa. These are as varied as the countries implementing them and are frequently adapted or updated depending on the changing context in each country.
Of the two main methods for calculating life expectancy, PLE is more frequently used to calculate AAM, because the alternative CLE projections are more challenging to establish due to modelling uncertainties and because they require consistent quality longitudinal data.[footnote 180] However, PLE has been shown to underestimate remaining life expectancy. Using PLE as the basis for AAMs can therefore lead to people spending longer in receipt of State Pension than expected. Longer periods in receipt of State Pension would put at risk the fiscal sustainability of the pension scheme. Some features of AAMs, such as long notice periods or maximum caps on SPa increases, make the SPa less sensitive to estimated changes in life expectancy and increase this risk. Choices over life expectancy calculations therefore have implications for the pace of increases in the SPa and the fiscal sustainability of the pension scheme.
There is increasing awareness that using a single universal estimate of life expectancy to calculate the SPa may raise equity concerns, given the significant heterogeneity in life expectancy across each cohort. There are substantial differences in life expectancy between genders and socio-economic groups, with women and highly educated individuals living longer. Linking the SPa to a population-wide estimate of life expectancy may disadvantage people with lower-than-average life expectancy.
Finally, there is an expectation that healthy life expectancy will become increasingly important when considering changes in the SPa. Longer life expectancy does not necessarily translate into longer healthy or disability-free life expectancy. Recent evidence has suggested that healthy life expectancy increases more slowly than total life expectancy. Therefore, linking the SPa to total life expectancy instead of healthy life expectancy will, over time, reduce the length of time that individuals have both in receipt of State Pension and in good health, in proportional and absolute terms. However, a lack of standardised assumptions or models makes projecting future healthy life expectancy difficult. Furthermore, substantial heterogeneity in healthy life expectancy by occupation, socio-economic group, region and ethnicity generates additional equity concerns that should be considered.
Cross-cutting themes
The dominance of life expectancy as a factor in determining changes in the SPa results from concerns over public finances and the shortage of viable alternative variables. Ensuring that the SPa keeps pace with changes in life expectancy is vital to ensuring the fiscal sustainability of pension schemes. The indexation of the SPa to life expectancy implemented by AAMs provides a regular and transparent mechanism by which to achieve this. However, an AAM alone is not necessarily sufficient to bring pension schemes into balance, especially if it uses PLE. Changes to the SPa should only form one part of the solution. Restoring fiscal sustainability to a financially unbalanced pension scheme often requires wider reforms; for this reason, the introduction of an AAM scheme and other changes to the SPa are rarely implemented on their own – and are often accompanied by other measures or mechanisms.
Changes in the SPa, and linking these to life expectancy, generate additional equity concerns. Linking the SPa to universal estimates of life expectancy does little to redress intragenerational equity concerns. There is substantial heterogeneity in life expectancy and working history within each cohort, by socio-economic group and by gender. In recognition of disparities, many OECD countries adjust the SPa and pension entitlement for working history, such as length of working lives or contributory periods. However, there has been a general trend towards adopting a higher universal SPa, as is the case under AAMs, which does not account for intragenerational disparities. When pension inequities are taken into account, changes in the SPa alone may not be the best mechanism to redress them.
Finally, the adoption of a fully automated AAM or other policy links between life expectancy and the SPa should take into account the possibility of changes in life expectancy trends in the future. There have been significant gains to life expectancy over the past half-century, but there are some signs that the pace of improvements in life expectancy may be slowing ‒ although it is not yet clear whether this is temporary or permanent. AAMs have been designed to keep pace with changes in life expectancy, but they do not have to be unidirectional. If policymakers are to maintain an intergenerationally equitable target length or proportion of time spent in receipt of a State Pension, allowances should be made for the SPa to decrease if life expectancy reverses.
Implications for policymaking and further research
This review provides a comprehensive overview of processes, mechanisms and formulae used to change the SPa internationally. There is increased interest in and take-up of AAMs and semi-AAMs. Even if these are relatively novel and their experience is limited to a handful of counties, they provide a useful framework for considering future changes to the SPa.
While policymakers in any country need to determine solutions that are both appropriate to the country’s needs and acceptable in their societies, our study points to a range of possible models that could be adopted. This range is defined by two extremes:
- Fast and ready: In this extreme, even small changes in life expectancy trigger the mechanism and shift full longevity gains to the SPa (with Estonia, Greece and Italy leaning in this direction).
- Slow but steady: In this extreme, changes happen rarely, take a long time to come into force (if approved) and pass only a proportion of longevity gains to the SPa to soften the effect on the retiring cohorts (with Denmark as the closest example).
Further research is needed to examine which of these models (or any sitting in between these extremes) performs well, where and why. Similarly, further investigation is needed to answer which method of estimating life expectancy is more appropriate (and under what conditions).
4. References
An Coimisiún Pinsean (2021) ‘Report of the Commission on Pensions’, Chapter 11, Dublin: An Coimisiún Pinsean (viewed on 22 June 2022) https://www.gov.ie/en/publication/6cb6d-report-of-the-commission-on-pensions/
Anderson, K (2019) ‘New Dutch agreement in principle on a major reform of the pension system’, European Social Policy Network Flash Report 2019/41, Brussels: European Commission (viewed on 22 June 2022) https://www.ipe.com/rise-of-dutch-state-pension-age-to-pause-at-67-in-2024/10034326.article
Ayuso, M, Bravo, J and Holzmann, R (2017) ‘Addressing longevity heterogeneity in pension scheme design’, Journal of Finance and Economics, 6, 1-21.
Ayuso, M, Bravo, J and Holzmann, R (2021a) ‘Getting life expectancy estimates right for pension policy: period versus cohort approach’, Journal of Pension Economics and Finance, 20, 2, 212-231
Ayuso, M, Bravo, JM, Holzmann, R and Palmer, E (2021b) ‘Automatic indexation of the pension age to life expectancy: when policy design matters’, Risks, 9, 5, 96
Barslund, M (2020) ‘Pension systems in the EU – some policy issues’, Intereconomics, 55, 2, 69-72
Berger, J, Davoine, T, Schuster, P and Strohner, L (2016) ‘Cross-country differences in the contribution of future migration to old-age financing’, International Tax and Public Finance, 23, 6, 1160-1184
Beskæftigelsesministeriet (2007) ‘Vejledning om folkepension efter lov om social pension VEJ nr 53 af 31/08/2007’ (viewed on 16 March 2022) https://www.retsinformation.dk/eli/mt/2007/53
Beskæftigelsesministeriet (2022) ‘Om kommissionen’ (viewed on 22 June 2022 ) https://bm.dk/arbejdsomraader/kommissioner-ekspertudvalg/kommissionen-om-tilbagetraekning-og-nedslidning/
Börsch-Supan, A. (2007), ‘Rational pension reform’, The Geneva Papers on Risk and Insurance – Issues and Practice, 32, 4, 430-446, DOI: http://dx.doi.org/10.1057/palgrave.gpp.2510149
Bravo, JM, Ayuso, M, Holzmann, R and Palmer, E (2021a) ‘Intergenerational actuarial fairness when longevity increases: amending the retirement age’, Working Paper 9408, Munich: Center for Economic Studies and IFO Institute
Bravo, JM, Ayuso, M, Holzmann, R and Palmer, E (2021b) ‘Addressing the life expectancy gap in pension policy’, Insurance: Mathematics and Economics, 99, 200-221
Cairns, AJG, Blake, D, Dowd, K, Coughlan, GD, Epstein, D, Ong, A and Balevich, I (2009) ‘A quantitative comparison of stochastic mortality models using data from England & Wales and the United States’, North American Actuarial Journal, 13, 1, 1-35, DOI: 10.1080/10920277.2009.10597538
Camera dei Deputati, Servizio Studi (2022) ‘XVIII Legislatura, Decreto 5 Novembre 2019, Riforma Previdenziale ed Eta Pensionabile’ (viewed on 22 June 2022) www.camera.it/temiap/documentazione/temi/pdf/1105445.pdf
Carone, G, Eckefeldt, P, Giamboni, L, Laine, V and Pamies, S (2016) ‘Pension reforms in the EU since the early 2000’s: achievements and challenges ahead’, European Economy Discussion Paper 42
Christensen, K, Doblhammer, G, Rau, R and Vaupel, JW (2009) ‘Aging populations: the challenges ahead’, Lancet, 374, 9696, 1196-208
Chybalski, F (2016) ‘Does the relation between state and market affect the retirement age? A cross-section study for OECD countries’, Economic and Social Development: 13th International Scientific Conference on Economic and Social Development: Book of Proceedings, 183
Chybalski, F and Gumola, M (2021) ‘Do demographics change the intergenerational borderline between working and retiring generations? A cross-national study for OECD countries’, Journal of Intergenerational Relationships, 19, 2, 209-227, DOI: 10.1080/15350770.2020.1738304
Conseil d’Orientation des Retraites (2019) ‘Rapport du COR Novembre 2019 – Perspectives des retraites en France à l’horizon 2030’ (viewed on 22 June 2022) https://www.cor-retraites.fr/node/519
Contandriopoulos, D, Lemire, M, Denis, JL and Tremblay, É (2010) ‘Knowledge exchange processes in organizations and policy arenas: a narrative systematic review of the literature’, Milbank Q, 88, 4, 444-483
Coyle, D (2022) ‘State pension age should remain at 66, Oireachtas committee recommends’, Irish Times, February 2 (viewed on 22 June 2022) https://www.irishtimes.com/business/personal-finance/state-pension-age-should-remain-at-66-oireachtas-committee-recommends-1.4791328
Crawford, R and Emmerson, C (2019) ‘A decade of cross-party increases in the state pension age: briefing note for the Institute for Fiscal Studies’, Briefing Note: Institute for Fiscal Studies
Cribb, J, Emmerson, C and O’Brien, L (2022) ‘Low earners much more likely to respond to increase in state pension age to 66 by working longer’, press release (viewed on 22 June 2022) https://ifs.org.uk/publications/15918
Disney, R (2003) ‘Public pension reform in Europe: policies, prospects and evaluation’, World Economy, 26, 1425-1445
DWP (2014a) ‘Pensions act’ (viewed on 22 June 2022) https://www.legislation.gov.uk/ukpga/2014/19/contents
DWP (2014b) ‘State pension age timetable (updated 15 May 2014)’ (viewed on 22 June 2022) https://www.gov.uk/government/publications/state-pension-age-timetable/state-pension-age-timetable
DWP (2021) ‘Second State Pension Age Review launches’, press release (viewed on 12 April 2022) https://www.gov.uk/government/news/second-state-pension-age-review-launches
DWP (2022) ‘Second State Pension Age Review: independent report call for evidence’ (viewed on 22 June 2022) https://www.gov.uk/government/consultations/second-state-pension-age-review-independent-report-call-for-evidence/second-state-pension-age-review-independent-report-call-for-evidence
Economic Policy Committee (EPC) (2002) ‘Reform challenges facing public pension systems: the impact of certain parametric reforms on pension expenditure’, Brussels: European Commission
Economic Policy Committee (EPC) and Social Protection Committee (SPC) (2020) ‘Joint Paper on Pensions 2019’, Brussels: European Commission
Economic Policy Department (2017) ‘Malta: country fiche on pension projections (2016-2070)’ Brussels: European Commission (viewed on 22 June 2022) https://ec.europa.eu/info/sites/default/files/economy-finance/final_country_fiche_mt.pdf
Edge, CE, Cooper, AM and Coffey, M (2017) ‘Barriers and facilitators to extended working lives in Europe: a gender focus’, Public Health Reviews, 38, 1, 1-27
European Commission (n.d.) ‘International Standard Classification of Education (ISCED)’ (viewed on 22 June 2022) https://ec.europa.eu/eurostat/statistics-explained/index.php?title=International_Standard_Classification_of_Education_(ISCED)
European Commission (n.d.) ‘Pensions’ (viewed on 4 August 2022) https://ec.europa.eu/social/main.jsp?catId=860&langId=en
European Commission (2018) ‘The 2018 Ageing Report: Economic & Budgetary Projections for the 28 EU Member States (2016-2070)
Eurostat (2021a) ‘Gender pension gap by age group – EU-SILC survey’ (viewed on 22 June 2022) https://ec.europa.eu/eurostat/databrowser/view/ILC_PNP13__custom_470372 /bookmark/table?lang=en&bookmarkId=ca6425d8-bd3e-4a09-b6d8-c181ea76bc6a
Eurostat (2021b) ‘At-risk-of-poverty rate by poverty threshold and most frequent activity in the previous year– EU-SILC and ECHP surveys’ (viewed on 22 June 2022) https://ec.europa.eu/eurostat/databrowser/view/ILC_LI04__custom_470517 /bookmark/table?lang=en&bookmarkId=f30fed7d-2db8-4382-a8a9-66cec101d907
Finnish Centre for Pensions (n.d.) ‘Retirement ages’ (viewed on 22 June 2022) https://www.etk.fi/en/work-and-pensions-abroad/international-comparisons/retirement-ages/
Giuliani, G (2021) ‘The distributive implications of welfare reform packages: the Italian case during and after the great crisis’, European Politics and Society, 22, 5, 589-603, DOI: 10.1080/23745118.2020.1804243
Government Actuary’s Department (2017) ‘Periodic review of rules about state pension age’, London: Government Actuary’s Department (viewed on 22 June 2022) https://assets.publishing.service.gov.uk/government/uploads/system/uploads /attachment_data/file/603136/periodic-review-of-rules-about-state-pension-age-gad-report.pdf
Government of Malta (1987) ‘Social Security Act 1987 (Act X of 1987) (Cap.318)’, (viewed on 4 August 2022) https://legislation.mt/eli/cap/318/eng
Guardiancich, I, Weaver, RK, Demarco, G, Dorfman, MC (2019) ‘The politics of NDC pension scheme diffusion: constraints and drivers’, Social Protection & Jobs Discussion Papers 1927, Washington, DC: World Bank
Hammond, R, Baxter, S, Bramley, R, Kakkad, A, Mehta, S and Sadler, M (2016) ‘Considerations on state pension age in the United Kingdom’, British Actuarial Journal, 21, 1, 165-203
Harker, R (2022) ‘Pensions – international comparisons’, London: House of Commons Library (viewed on 22 June 2022) https://researchbriefings.files.parliament.uk/documents/SN00290/SN00290.pdf
HM Treasury (2013) ‘Autumn Statement 2013’, London: HM Treasury (viewed on 22 June 2022) https://assets.publishing.service.gov.uk/government/uploads/system/uploads /attachment_data/file/263942/35062_Autumn_Statement_2013.pdf
Jivraj, S, Goodman, A, Pongiglione, B and Ploubidis, GB (2020) ‘Living longer but not necessarily healthier: the joint progress of health and mortality in the working-age population of England’, Population Studies, 74, 3, 399-414
Kovács, E and Vaskövi, A (2019) ‘Living longer. Working longer? Life Expectancy and retirement age trends in OECD countries’, 33rd International ECMS Conference on Modelling and Simulation
Lindén, TS (2012) ‘Pension policy recommendations of governmental commissions in Norway, Denmark, Germany and the UK’, Workshop on Ideas and Practices of Ageing Policies – European and National Perspectives, Stein Rokkan Centre for Social Studies, University of Rokkan
Marier, P (2009) ‘The power of institutionalized learning: the uses and practices of commissions to generate policy change’, Journal of European Public Policy, 16, 8, 1204-1223
Mercer (2021a) ‘Global Pension Index’, https://www.mercer.com/our-thinking/global-pension-index-2021.html
Mosquera, I, González-Rábago, Y, Martín, U and Bacigalupe, A (2019) ‘Socio-economic inequalities in life expectancy and health expectancy at age 50 and over in European countries: insights for the debate on pension policies’, Sozialer Fortschritt, 68, 4, 255-288
Ministério da Solidariedade, Emprego e Segurança Social (2013), ‘Decreto-Lei n.º 167-D/2013’, Diário da República n.º 253/2013, 3º Suplemento, Série I de 2013-12-31 (viewed on 4 August 2022) https://dre.tretas.org/dre/314137/decreto-lei-167-E-2013-de-31-de-dezembro.
Ministero dell’Economia e delle Finanze (2017) ‘Decreto 23 novembre 2017, n.207’, Gazzetta Ufficiale della Repubblica Italiana (viewed on 22 June 2022), https://www.gazzettaufficiale.it/eli/id/2017/12/29/17G00220/sg
Norges offentlige utredninger (2004) ‘Modernisert folketrygd: barekraftig pensjon for framtida, 1’, Oslo: Finansdepartementet, Sosialdepartementet (viewed on 22 June 2022) https://www.regjeringen.no/no/dokumenter/nou-2004-1/id383364/
Nordic Social-Statistical Committee (2008) ‘Old-age pension systems in the Nordic countries’, Oslo: Nordic Social-Statistical Committee (viewed on 22 June 2022) https://norden.diva-portal.org/smash/get/diva2:968720/FULLTEXT01.pdf
Nutley, S, Davies, H and Walter I (2002) ‘What is a conceptual synthesis? Briefing Note 1’, St Andrews: University of St Andrews Research Unit for Research Utilisation
OECD (2017) ‘Preventing Ageing Unequally’, Paris: OECD Publishing, https://dx.doi.org/ 10.1787/9789264279087-en.
OECD (2018) ‘Working better with age: Japan, ageing and employment policies’, Paris: OECD Publishing
OECD (2019a) ‘Health at a Glance 2019’, Paris: OECD Publishing (viewed on 22 June 2022) https://www.oecd-ilibrary.org/social-issues-migration-health/health-at-a-glance-2019_4dd50c09-en
OECD (2019b) ‘Country profiles – France’, in Pensions at a Glance 2019 (viewed on 17 March 2022) https://www.oecd.org/els/public-pensions/PAG2019-country-profile-France.pdf
OECD (2020) ‘OECD reviews of pension systems: Czech Republic’, Paris: OECD Publishing (viewed on 22 June 2022) https://dx.doi.org/10.1787/e6387738-en
OECD (2021a) ‘Pensions at a Glance 2021’, Paris: OECD Publishing (viewed on 22 June 2022) https://www.oecd.org/publications/oecd-pensions-at-a-glance-19991363.htm
OECD (2021b) ‘Life expectancy and healthy life expectancy at age 65’, in Health at a Glance 2021 (viewed on 22 June 2022) https://www.oecd-ilibrary.org/social-issues-migration-health/health-at-a-glance-2021_82ca511d-en;jsessionid=CIQSMv9wq88RLvZVKXb9hXry.ip-10-240-5-90
OECD (2021c) ‘Ireland’, in Pensions at a Glance 2021 (viewed on 22 June 2022) https://www.oecd.org/els/public-pensions/PAG2021-country-profile-Ireland.pdf
OECD (2021d) ‘Country profiles – Slovak Republic’, in Pensions at a Glance 2021 (viewed on 22 June 2022) https://www.oecd.org/els/public-pensions/PAG2021-country-profile-Slovak-Republic.pdf
OECD (2021e) ‘Country profiles – Czech Republic’, in Pensions at a Glance 2021 (viewed on 22 June 2022) https://www.oecd.org/els/public-pensions/PAG2021-country-profile-Czech-Republic.pdf
OECD (2021f) ‘Country profiles – Italy’, in Pensions at a Glance 2021 (viewed on 22 June 2022) https://www.oecd.org/els/public-pensions/PAG2021-country-profile-Italy.pdf
OECD (2021g) ‘Methodology and assumptions’, in Pensions at a Glance 2021 (viewed on 22 June 2022) https://www.oecd-ilibrary.org/sites/bc570538-en/index.html?itemId=/content/component/bc570538-en
Olshansky, SJ, Carnes, BA and Désesquelles, A (2001) ‘Prospects for human longevity’, Science, 291, 1491-1492
Olshansky, SJ, Passaro, DJ, Hershow, RC, Layden, J, Carnes, BA, Brody, J, Hayflick, L, Butler, RN, Allison, DB, Ludwig, DS (2005) ‘A potential decline in life expectancy in the United States in the 21st century’, New England Journal of Medicine, 352, 1138-1114ONS (n.d.) ‘Standard Occupational Classification (SOC)’ (viewed on 22 June 2022) https://www.ons.gov.uk/methodology/classificationsandstandards /standardoccupationalclassificationsoc
ONS (2016) ‘Disability-free life expectancy (DFLE) and life expectancy (LE): at age 65 by region, England’ (viewed 22 June 2022) https://www.ons.gov.uk/peoplepopulationandcommunity/healthandsocialcare /healthandlifeexpectancies/datasets/disabilityfreelifeexpectancydfleandlifeexpectancyleatage65byregionengland
ONS (2018) ‘Changing trends in mortality: an international comparison: 2000 to 2016’ (viewed on 27 July 2022) https://www.ons.gov.uk/peoplepopulationandcommunity/birthsdeathsandmarriages /lifeexpectancies/articles/changingtrendsinmortalityaninternationalcomparison/2000to2016#life-expectancy-improvements-have-slowed-in-recent-years
ONS (2021a) ‘National life tables – life expectancy in the UK: 2018-2020’ (viewed on 22 June 2022) https://www.ons.gov.uk/peoplepopulationandcommunity/birthsdeathsandmarriages /lifeexpectancies/bulletins/nationallifetablesunitedkingdom/2018to2020#life-expectancy-at-older-ages
ONS (2022a) ‘National population projections: 2020-based interim’ (viewed on 22 June 2022) https://www.ons.gov.uk/peoplepopulationandcommunity/populationandmigration /populationprojections/bulletins/nationalpopulationprojections/2020basedinterim
ONS (2022b) ‘Past and projected period and cohort life tables: 2020-based, UK, 1981 to 2070’ (viewed on 22 June 2022 https://www.ons.gov.uk/peoplepopulationandcommunity/birthsdeathsandmarriages /lifeexpectancies/bulletins/pastandprojecteddatafromtheperiodandcohortlifetables/2020baseduk1981to2070
Pedersen, AW (2011) ‘Pensions, health and long-term care: Annual National Report 2010’, Norway: Analytical Support on the Social Economic Impact of Social Protection Reforms.
Presidência do Conselho de Ministros (2021), ‘Decreto-Lei n.º 16-A/2021, de 25 de fevereiro’, Diário da República n.º 39/2021, 1º Suplemento, Série I de 2021-02-25, 2-37 (viewed on 4 August 2022) https://dre.pt/dre/detalhe/decreto-lei/16-a-2021-158316443
Public Health England (2018) ‘A review of recent trends in mortality in England’, London: Public Health England (viewed on 22 June 2022) https://assets.publishing.service.gov.uk/government/uploads/system/uploads /attachment_data/file/827518/Recent_trends_in_mortality_in_England.pdf
Rashid, T, Bennet, J, Paciorek, C, Doyle, Y, Pearson-Stuttard, J, Flaxman, S, Fecht, D, Toledano, M, Li, G, Daby, H, Johnson, E, Davies, B and Ezzati, M (2021) ‘Life expectancy and risk of death in 6791 communities in England from 2002 to 2019: high-resolution spatiotemporal analysis of civil registration data’, The Lancet 6, 11, E805-E816
Retsinformation (2011) ‘Forslag til Lov om ændring af lov om social pension, 2011/1 LSV 22, December 2011’ (viewed on 16 March 2022) https://www.retsinformation.dk/eli/ft/201113L00022
Retsinformation (2017) ‘Bekendtgørelse af lov om social pension’ (viewed on 22 June 2022) https://www.retsinformation.dk/eli/lta/2017/1208#id239d1c50-3f8d-4505-a373-1dbf95b54ab0
Riekhoff, AJ (2021) ‘Pension reforms, the generational welfare contract and preferences for pro-old welfare policies in Europe’, Social Policy Administration, 55, 3, 1-18
Ridsdale, B and Gallop, A (2010) ‘Mortality by cause of death and by socio-economic and demographic stratification 2010’, paper presented at ICA2010, London: Institute and Faculty of Actuaries (viewed on 22 June 2022), https://www.actuaries.org.uk/system/files/documents/pdf/183finalpaperridsdalegallop.pdf
Royal Dutch Actuarial Association (2020) ‘Projections Life Table AG2020’, Utrecht: Royal Dutch Actuarial Association (viewed on 22 June 2022) https://www.ag-ai.nl/view.php?action=view&Pagina_Id=1007
Rürup-Kommission (2003) ‘Nachhaltigkeit in der Finanzierung der Sozialen Sicherungssysteme’, Berlin: Bundesministerium für Gesundheit und Soziale Sicherheit’.
Rutledge, M, Christopher, S, Gillis, M and Webb, A (2016) ‘Will the average retirement age continue to increase?’ Boston, Center for Retirement Research, Boston College
Social Security Administration (2019) ‘Netherlands slows scheduled retirement age increases’, International Update Recent Developments in Foreign Public and Private Pensions, Washington: Social Security Administration (viewed on 22 June 2022) https://www.ssa.gov/policy/docs/progdesc/intl_update/2019-07/2019-07.pdf
Turner, J (2009) ‘Social security financing: automatic adjustments to restore solvency’, Research Report 2009-01, Washington, DC: AARP Public Policy Institute
United Nations, Department of Economic and Social Affairs, Population Division (2022). World Population Prospects 2022, Online Edition (viewed on 06 October 2022) https://population.un.org/wpp/Download/Standard/MostUsed/
Van Duin, C (2013) ‘Indexation of the pension age to projected remaining life expectancy in the Netherlands’, Geneva: United Nations Statistical Commission and Economic Commission for Europe (viewed on 22 June 2022) https://unece.org/fileadmin/DAM/stats/documents/ece/ces/ge.11/2013/WP_6.1.pdf
Vaupel, JW and Oeppen, J (2002) ‘Broken limits to life expectancy’, Science, 296, 1029-1031
Zaninotto, P, Batty, GD, Stenholm, S, Kawachi, I, Hyde, M, Goldberg, M, Westerlund, H, Vahtera, J and Head, J (2020) ‘Socioeconomic inequalities in disability-free life expectancy in older people from England and the United States: a cross-national population-based study’, The Journals of Gerontology: Series A, 75, 5, 906-913
Appendix A – Methodological overview
The aim of the project was to understand decision making in relation to State Pension age policies. The objective of the study was to gather data from grey and academic literature to answer the following research questions:
- What factors affect changing the SPa?
- How are changes made to the SPa internationally?
- What variables are used (and how are they used) to change and determine the SPa?[footnote 181]
The study used a quick scoping review of the literature. This type of review was chosen because the scope is broad and open-ended, and the quality or robustness of the evidence is not an important consideration. In this context, two databases were identified – Google Scholar and Web of Science. The search terms were defined, and the inclusion and exclusion criteria were established. All results obtained from the search in Web of Science and the first 30 results obtained from Google Scholar were screened to identify relevant literature. Boolean search strings were used to ensure the relevance of the results. These were drawn from the search strings suggested in the proposal, refined in consultation with the DWP and our expert team, and they were tested for relevance.
In addition to the search of the academic literature database, three further targeted searches were conducted within identified policymaking, pension research and trade press sources. These were concentrated on the research questions supporting the study. The targeted searches included (i) relevant policymaking organisations, such as the OECD, the European Commission, the World Economic Forum, the World Bank and Mercer; (ii) relevant pension research centres, such as Netspar (the Netherlands), the Pensions Research Council (the Warton School of the University of Pennsylvania), the Retirement Research Centre (Boston College), the Pension Policy Institute and Institute for Fiscal Studies (UK), the University of Turin (Elsa Fornero), the Centre of Excellence in Population Ageing Research (University of New South Wales, Sydney); and (iii) trade press, such as the Financial Times, the Wall Street Journal, the Economist, Investment and Pensions Europe, the Financial Times and the New York Times.
These searches yielded 242 sources. Of these, 216 resulted from searches in the selected academic databases (Google Scholar and Web of Science), and the remaining 26 were obtained from targeted searches across policymaking organisations and pension research centres. Titles and abstracts were screened, and 72 articles were selected for further review. The included article selection was limited to sources published between 2001 and 2021; published in English, Portuguese, French or Spanish; and related to the UK or other OECD countries. Out of these 72, 47 articles were analysed, and their information was extracted and combined. The extracted information helped inform the report. Simultaneously, 3 other papers were identified through snowballing, and their information was also extracted, bringing the overall count to 50 articles analysed.
Figure 4: Sources of the articles included in the review
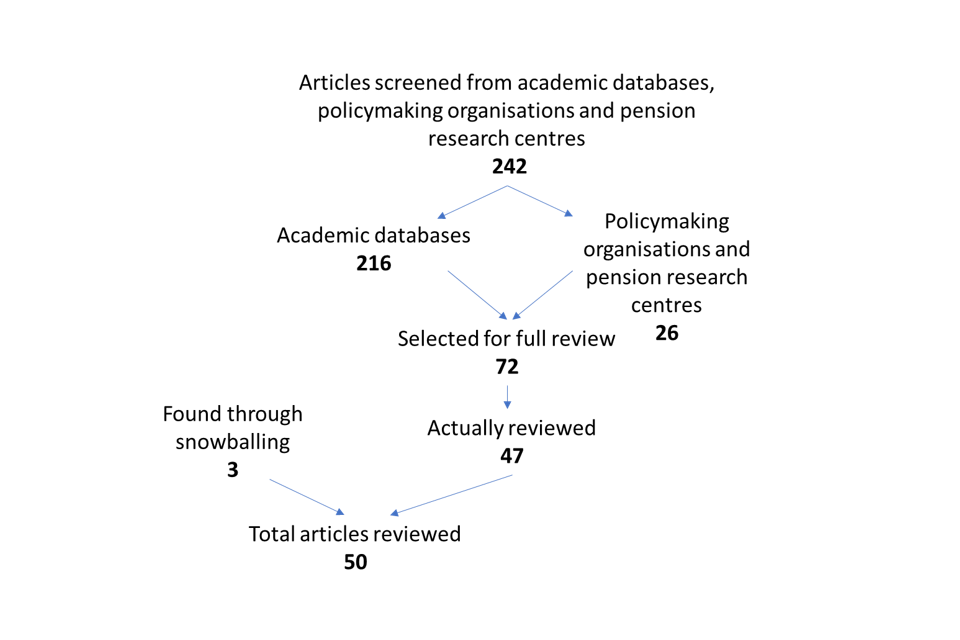
A figure showing the sources of the articles used in the review, along with the flowchart of the selection process
The full text of the identified sources was reviewed. These sources were reassessed against the established inclusion/exclusion criteria beforehand to ensure their relevance, and information relevant to the research questions was extracted afterward. To structure each review, a data extraction tool was developed to record information from the reviewed sources, including capturing the details of the source and the data needed to respond to research questions.
Subsequently, the review used a form of the ‘systematic snowball process’ that builds on a non-keyword-based reviewing process[footnote 182] and allows for newly found concepts and emerging ideas to be incorporated into the review.[footnote 183] Important pieces of literature (including those cited in the tender specifications, suggested by DWP and sourced independently by the research team) were reviewed. These included sources identified through the bibliographies of some of the studies included in the review. A list of these studies was compiled, and the steps outlined above were followed for the additional sources, to establish the relevance of the full text review and data extraction.
We identified four countries of interest, in collaboration with the DWP. Where there were questions or gaps remaining in the literature for these countries (Denmark, France, Italy and Portugal), country researchers reviewed national government policy documents and legislation to add further information. This review allowed the research team to answer questions posed and/or address situations where the answers were unclear from the literature. These four countries were chosen on the basis that they represent the range of SPa mechanisms that were of interest (comprising an AAM based on one-to-one matching, an AAM based on two thirds matching, a semi-automatic mechanism and a non-automatic mechanism).
The evidence gathered from the review was summarised in an earlier version of this report. A workshop with the DWP then took place, allowing the research team at RAND Europe to present some of its conclusions, receive questions and comments from the team at DWP, and integrate their feedback into this final report.
Appendix B: Sources identified through quick scoping review
Armstrong, A and Van de Ven, J (2016) ‘The impact of possible migration scenarios after ‘Brexit’ on the state pension system’s economies’, MDPI, 4, 4, 1-13
Ayuso, M, Bravo, J and Holzmann, R (2021a) ‘Getting life expectancy estimates right for pension policy: period versus cohort approach’, Journal of Pension Economics and Finance, 20, 2, 212-231
Ayuso, M, Bravo, JM, Holzmann, R and Palmer, E (2021b) ‘Automatic indexation of the pension age to life expectancy: when policy design matters’, Risks, 9, 5, 96
Banks, J and Emmerson, C (2018) ‘A lifetime of changes: state pensions and work incentives at older ages in the UK, 1948-2018’, London, IFS Working Paper National Bureau of Economic Research Working Paper No. 14201
Barslund, M (2020) ‘Pension systems in the EU – some policy issues’, Intereconomics, 55, 2, 69-72
Bebbington, D (2019) ‘You know something is wrong when your grandmother starts protesting’, Women’s Studies International Forum, 75, 2, DOI: 10.1016/j.wsif.2019.05.004
Berger, J, Davoine, T, Schuster, P and Strohner, L (2016) ‘Cross-country differences in the contribution of future migration to old-age financing’, International Tax and Public Finance, 23, 6, 1160-1184
Berry, C (2016) ‘Austerity, ageing and the financialisation of pensions policy in the UK’, British Politics, 11, 1, 2-25
Boeri, T, Garibaldi, P and Moen, ER (2021) ‘In medio stat victus: labor demand effects of an increase in the retirement age’, Journal of Population Economics, 35, 519-556
Boersch-Supan, A and Wilke, CB (2004) ‘The German public pension system: how it was, how it will be’, Working Papers 10525, Cambridge MA: National Bureau of Economic Research
Bravo, JM, Ayuso, M, Holzmann, R and Palmer, E (2021a) ‘Intergenerational actuarial fairness when longevity increases: amending the retirement age’, Working Paper 9408, Munich: Center for Economic Studies and IFO Institute
Bravo, JM, Ayuso, M, Holzmann, R and Palmer, E (2021b) ‘Addressing the life expectancy gap in pension policy’, Insurance: Mathematics and Economics, 99, 200-221
Chybalski, F (2016) ‘Does the relation between state and market affect the retirement age? A cross-section study for OECD countries’, Economic and Social Development: 13th International Scientific Conference on Economic and Social Development: Book of Proceedings, 183
Chybalski, MG (2021) ‘Do demographics change the intergenerational borderline between working and retiring generations? A cross-national study for OECD countries’, Journal of Intergenerational Relationships, 19, 2, 209-227
Crawford, JO (2005) ‘Working until 70, government policy, economic need and the role of ergonomics and occupational health’, International Congress Series, 1280, 29-34
Crawford, R and Emmerson, C (2019) ‘A decade of cross-party increases in the state pension age: briefing note for the Institute for Fiscal Studies’, Briefing Note: Institute for Fiscal Studies
Disney, R (2003) ‘Public pension reform in Europe: policies, prospects and evaluation’, World Economy, 26, 1425-1445
Economic Policy Committee (EPC) (2002) ‘Reform challenges facing public pension systems: the impact of certain parametric reforms on pension expenditure’, Brussels: European Commission
Economic Policy Committee (EPC) and Social Protection Committee (SPC) (2020) ‘Joint Paper on Pensions 2019’, Brussels: European Commission
Edge, CE, Cooper, AM and Coffey, M (2017) ‘Barriers and facilitators to extended working lives in Europe: a gender focus’, Public Health Reviews, 38, 1, 1-27
Fernández, JJ (2012) ‘Economic crises, population aging and the electoral cycle: explaining pension policy retrenchments in 19 OECD countries, 1981-2004’, International Journal of Comparative Sociology, 53, 2, 77-96
Galasso, V (2008) ‘Postponing retirement: the political effect of aging’, Journal of Public Economics, 92, 10-11, 2157-2169
Gonzalez-Eiras, M and Niepelt, D (2012) ‘Ageing, government budgets, retirement, and growth’, European Economic Review, 56, 1, 97-115
Hagemann, S and Scherger, S (2016) ‘Increasing pension age – inevitable or unfeasible? Analysing the ideas underlying experts’ arguments in the UK and Germany’, Journal of Aging Studies, 39, 54-65
Hammond, R, Baxter, S, Bramley, R, Kakkad, A, Mehta, S and Sadler, M (2016) ‘Considerations on state pension age in the United Kingdom’, British Actuarial Journal, 21, 1, 165-203
Hernaes, E, Jia, Z, Piggott, J and Vigtel, TC (2021) ‘Work less but stay longer’, Working Paper 2021/30, Sydney: ARC Centre of Excellence in Population Ageing Research
Hohnerlein, EM (2019) ‘Pension indexation for retirees revisited – normative patterns and legal standards’, Global Social Policy, 19, 3, 246-265
Jedynak, T (2019) ‘The determinants of effective retirement age? A cross-country analysis,’ in ‘Proceedings of Economics and Finance Conferences (No. 8911262)’, International Institute of Social and Economic Sciences.
Jijiie, A, Alonso-García, J and Arnold, S (2021) ‘Mortality by socio-economic class and its impact on the retirement schemes: how to render the systems fairer? European Actuarial Journal, 1-43
Jung, CL and Walker, A (2009) ‘The impact of Neo-liberalism on South Korea’s public pension: a political economy of pension reform’, Social Policy & Administration, 43, 425-444
Kovács, E and Vaskövi, A (2019) ‘Living longer. Working longer? Life Expectancy and retirement age trends in OECD countries’, 33rd International ECMS Conference on Modelling and Simulation
Latulippe, D and Fontaine, F (2019) ‘Effective retirement age from employment and full-time employment, and the impact of the 2008 crisis’, International Social Security Review, 72, 23-47
Leeson, GW and Khan, HT (2015) ‘The move to abolish mandatory retirement age: the case of the United Kingdom’, in Higo, M and Klassen, TR, Retirement in Japan and Korea: the past, present and future of mandatory retirement, London: Routledge, 148-163
Lindén, TS (2012) ‘Pension policy recommendations of governmental commissions in Norway, Denmark, Germany and the UK’, Workshop on Ideas and Practices of Ageing Policies – European and National Perspectives, Stein Rokkan Centre for Social Studies, University of Rokkan
Mayhew, LD (2021) ‘On the postponement of increases in state pension age through health improvement and active ageing’, Applied Spatial Analysis and Policy, 14, 2, 315-336
Mercer (2021a) ‘Global Pension Index’, https://www.mercer.com/our-thinking/global-pension-index-2021.html
Mercer (2021b) ‘Netherlands: Pension reform consultation published’, Law and Policy Group GRIST, Mercer
OECD (2018) ‘Working better with age: Japan, ageing and employment policies’, Paris: OECD Publishing
OECD (2021a) ‘Pensions at a Glance 2021’, Paris: OECD Publishing (viewed on 22 June 2022), https://www.oecd.org/publications/oecd-pensions-at-a-glance-19991363.htm
Powell, J and Taylor, P (2016) ‘Rethinking risk and ageing: extending working lives’, Social Policy and Society, 15, 4, 637-645
Riekhoff, AJ (2021) ‘Pension reforms, the generational welfare contract and preferences for pro-old welfare policies in Europe’, Social Policy Administration, 55, 3, 1-18
Ring, P (2005) ‘The fourth pillar and the UK: flexibility, risk and the deinstitutionalization of the life course’, Geneva Papers on Risk and Insurance: Issues and Practice, 30, 4, 638-655
Ring, P, Ervik, R and Lindén, TS (2020) ‘Justifying pension reforms: comparing policy discourses in Norway and the UK’, European Journal of Social Security, 22, 3, 306-326
Rutledge, M, Christopher, S, Gillis, M and Webb, A (2016) ‘Will the average retirement age continue to increase?’ Boston, Center for Retirement Research, Boston College
Sanzenbacher, GT, Webb, A, Orlova, NS and Cosgrove, CM (2016) ‘Does a uniform retirement age make sense?’ Boston, Issues in Brief: Center for Retirement Research, Boston College
Stevens, R (2017) ‘Managing longevity risk by implementing sustainable full retirement age policies’, Journal of Risk and Insurance, 84, 4, 1203-1230
Van Sonsbeek, JM (2010) ‘Micro simulations on the effects of ageing-related policy measures’, Economic Modelling, 27, 5, 968-979
Whiteford, P and Whitehouse, E (2006) ‘Pension challenges and pension reforms in OECD countries’, Oxford Review of Economic Policy, 22, 1, 78-94
World Economic Forum (WEF) (2017) ‘Case studies in retirement system reform’, White Papers, World Economic Forum
Zaninotto, P, Batty, GD, Stenholm, S, Kawachi, I, Hyde, M, Goldberg, M, Westerlund, H, Vahtera, J and Head, J (2020) ‘Socioeconomic inequalities in disability-free life expectancy in older people from England and the United States: a cross-national population-based study’, The Journals of Gerontology: Series A, 75, 5, 906-913
-
Recent examples can be seen in Croatia, Czechia, Ireland, Poland, the Netherlands and Slovakia. ↩
-
Various terms are used to describe retirement age in different OECD countries and by different bodies. The OECD Organisation for Economic Co-operation and Development) defines ‘normal retirement age’ as ‘the age at which someone who entered the labour market at 22 can retire after a full career without any reduction to the pension’. ↩
-
OECD (2021a). ↩
-
DWP (2022) ↩
-
DWP (2021) ↩
-
The OECD produces regular editions of Pensions at a Glance: see OECD (2021a) ↩
-
European Commission (n.d.) ↩
-
Mercer (2021a) ↩
-
Ayuso and others (2021a, 2021b) ↩
-
Bravo and others (2021a, 2021b) ↩
-
EPC and SPC (2020) ↩
-
OECD (2021a) ↩
-
Economic Policy Committee & Social Protection Committee (2020) ↩
-
The working-age population is defined by the OECD as those aged between 20 and 64. See OECD (2021a). Other sources include Hammond and others (2016) and Economic Policy Committee and Social Protection Committee (2020). ↩
-
OECD (2021a) ↩
-
In the United Kingdom, the working age population is defined as those between 16 and SPa. ↩
-
ONS (2022a) ↩
-
Kovács and Vaskövi (2019); OECD (2021b); ONS (2021a) ↩
-
OECD (2019a, 2021b) ↩
-
See Figures 7 and 8 in ONS (2018). ↩
-
Public Health England (2018) ↩
-
Please see life expectancy at aged 65, contained within 2020-based edition of this dataset, cited in ONS (2022b). ↩
-
Kovács and Vaskövi (2019), citing Olshansky and others (2001), Olshansky and others (2005), Ridsdale and Gallop (2010) ↩
-
Kovács and Vaskövi (2019), citing Christensen and others (2009), Vaupel and Oeppen (2002) ↩
-
OECD (2021b) ↩
-
OECD (2021a) ↩
-
Bravo and others (2021a) ↩
-
Cribb and others (2022). This research did not include information on the effect on GDP or budget balance. ↩
-
Ayuso and others (2021b) ↩
-
Economic Policy Committee and Social Protection Committee (2020) ↩
-
Riekhoff (2021) ↩
-
Ayuso and others (2021b) ↩
-
Economic Policy Committee (2002) ↩
-
Ayuso and others (2021a) ↩
-
Riekhoff (2021) ↩
-
Chybalski and Gumola (2021); Disney (2003) ↩
-
Edge and others (2017) ↩
-
Rutledge and others (2016) ↩
-
Edge and others (2017) ↩
-
Chybalski and Gumola (2021) ↩
-
Edge and others (2017) ↩
-
Economic Policy Committee (2002); Economic Policy Committee and Social Protection Committee (2020); Chybalski and Gumola (2021) ↩
-
Economic Policy Committee and Social Protection Committee (2020) ↩
-
Bravo and others (2021a) ↩
-
Economic Policy Committee and Social Protection Committee (2020); see Rashid and others (2021) for an in-depth analysis of variations in life expectancy by MSOA in England. ↩
-
Ayuso and others (2021b) ↩
-
Rashid and others (2021); ONS (2016) ↩
-
Bravo and others (2021b) ↩
-
Economic Policy Committee and Social Protection Committee (2020) ↩
-
Data available at Eurostat (2021a, 2021b) ↩
-
Edge and others (2017). ↩
-
Chybalski (2016) ↩
-
Chybalski (2016) ↩
-
Disney (2003) ↩
-
Berger and others (2016) ↩
-
Berger and others (2016) ↩
-
Berger and others (2016) ↩
-
Berger and others (2016) ↩
-
In particular OECD (2021a); Lindén (2012); Economic Policy Committee and Social Protection Committee (2020). ↩
-
The automatic stabiliser introduced an automatic reduction in pensions if the dependency ratio deteriorated, reflecting the expected number of years for which people receive pension benefits (Lindén 2012). For more information on Norway, see Norges offentlige utredninger (2004); Pedersen (2011). For more information on Germany, see Rürup-Kommission (2003). ↩
-
Lindén (2012) ↩
-
Lindén (2012); Marier (2009) ↩
-
An Coimisiún Pinsean (2021) ↩
-
Conseil d’Orientation des Retraites (2019) ↩
-
Carone and others (2016) ↩
-
Economic Policy Committee and Social Protection Committee (2020) ↩
-
Ayuso and others (2021a) ↩
-
OECD (2021a) ↩
-
Such as Brazil; OECD (2021a) ↩
-
Such as Sweden; Ayuso and others (2021a) ↩
-
OECD (2021a) ↩
-
Finnish Centre for Pensions (n.d.); Ayuso and others (2021a) ↩
-
Bravo and others (2021a) ↩
-
Ayuso and others (2021a) ↩
-
Finnish Centre for Pensions (n.d.) ↩
-
Carone and others (2016) ↩
-
OECD (2021a) ↩
-
Conseil d’Orientation des Retraites (2019) ↩
-
Economic Policy Committee and Social Protection Committee (2020) ↩
-
OECD (2020) ↩
-
An Coimisiún Pinsean (2021); OECD (2021c) ↩
-
An Coimisiún Pinsean (2021); OECD (2021a) ↩
-
Coyle (2022) ↩
-
Finnish Centre for Pensions (n.d.) ↩
-
OECD (2021a); Social Security Administration (2019) ↩
-
Economic Policy Committee and Social Protection Committee (2020); OECD (2021d) ↩
-
OECD (2021a) ↩
-
Harker (2022) ↩
-
Harker (2022) ↩
-
OECD (2021a) ↩
-
OECD (2021a); Finnish Centre for Pensions (n.d.) ↩
-
Finnish Centre for Pensions (n.d.); OECD (2021d) ↩
-
Finnish Centre for Pensions (n.d.) ↩
-
OECD (2021e) ↩
-
OECD (2021a) ↩
-
Economic Policy Committee and Social Protection Committee (2020) ↩
-
Economic Policy Committee and Social Protection Committee (2020) ↩
-
OECD (2021a) ↩
-
As part of the ‘quota 100’; Finnish Centre for Pensions (n.d.). ↩
-
European Commission (2018) ↩
-
OECD (2021a) ↩
-
Economic Policy Committee and Social Protection Committee (2020) ↩
-
OECD (2021a) ↩
-
OECD (2021a) ↩
-
Economic Policy Committee and Social Protection Committee (2020) ↩
-
OECD (2021a) ↩
-
Economic Policy Committee and Social Protection Committee (2020) ↩
-
Economic Policy Committee and Social Protection Committee (2020) ↩
-
OECD (2021a) ↩
-
Economic Policy Committee and Social Protection Committee (2020) ↩
-
Economic Policy Committee and Social Protection Committee (2020) ↩
-
OECD (2021a) ↩
-
OECD (2021a) ↩
-
OECD (2021a), citing Börsch-Supan (2007) ↩
-
OECD (2021a), citing Turner (2009), Guardiancich and others (2019) ↩
-
OECD (2021a), citing Guardiancich and others (2019) ↩
-
OECD (2021a). According to Ayuso and others (2021a), Slovakia also introduced automatic indexation of pension ages to life expectancy, but reversed the reform in 2019. ↩
-
Kovács and Vaskövi (2019) ↩
-
If the increase in life expectancy would result in an increase in the SPa exceeding the maximum, the excess increase in the SPa is implemented with the next revision (OECD 2021a). ↩
-
OECD (2021a) ↩
-
OECD (2021a) ↩
-
Denmark, Estonia, Finland, Greece, Italy, the Netherlands, Portugal, Slovakia. See Ayuso and others (2021a); OECD (2021a). ↩
-
We draw largely upon Ayuso and others (2021a) to consider the Netherlands, Portugal, Slovakia, and Denmark, supplemented where possible with updates from the OECD’s (2021a) ‘Pensions at a Glance 2021’ and information sought from national legislation and policy. ↩
-
For more information on calculation of LE, see United Nations (2019) ↩
-
Ayuso and others (2021a) ↩
-
Anderson (2019) ↩
-
OECD (2021a) Pensions at a Glance 2021 Annex 1A ↩
-
Ayuso and others (2021a) ↩
-
Retsinformation (2017) ↩
-
Ayuso and others (2021a) ↩
-
Ayuso and others (2021a) ↩
-
Ayuso and others (2021a); OECD (2021a) ↩
-
OECD (2021a) ↩
-
OECD (2021a) ↩
-
According to the country’s Government of Malta (1987); Economic Policy Committee and Social Protection Committee (2020); Economic Policy Department (2017). ↩
-
Ayuso and others (2021a) ↩
-
Ayuso and others (2021b) ↩
-
Including UN, World Bank, Eurostat, OECD; Ayuso and others (2021b). ↩
-
OECD (2021a, Methodology and assumptions) ↩
-
According to Ayuso and others (2021a), the exception is Italy, where male and female annuity factors are used to calculate the ‘transformation coefficients’ when calculating NDC pension benefits. CLE is not used to determine SPa In Italy. There is no further information included in this source. Ayuso and others (2021a, 2021b); Bravo and others (2021a). ↩
-
Hammond and others (2016) ↩
-
Ayuso and others (2021b) ↩
-
Ayuso and others (2021b) ↩
-
Ayuso and others (2021b) ↩
-
Bravo and others (2021b) ↩
-
Examples include Ayuso and others (2021a); Bravo and others (2021a); Cairns and others (2009). ↩
-
Ayuso and others (2021b) ↩
-
Bravo and others (2021a) ↩
-
Government Actuary’s Department (2017) ↩
-
OECD (2021a, Figures 6.3 and 6.5) ↩
-
Bravo and others (2021a) ↩
-
Government Actuary’s Department (2017) ↩
-
Ayuso and others (2021b), citing Ayuso and others (2017), Bravo and others (2021b). ↩
-
Ayuso and others (2021b) ↩
-
Data was used from 1960 to 2018 using the Human Mortality Database, with projects generated through to 2050 for the 42 countries, disaggregated by sex. Countries included medium- and high-income countries in North America, central and western Europe, Asia and the Pacific, as well as Chile in Latin America. ↩
-
Ayuso and others (2021a) ↩
-
Bravo and others (2021b) ↩
-
Ayuso and others (2021a); Bravo and others (2021a) ↩
-
Ayuso and others (2021a) ↩
-
OECD (2021a) ↩
-
OECD (2021a), citing OECD (2017) ↩
-
For more information about Standard Occupational Classification, see ONS (n.d.) ↩
-
Crawford and Emmerson (2019) ↩
-
Individuals who have accessed education only up to lower secondary educational levels, that is, International Standard Classification of Education (ISCED)-2; European Commission (n.d.). ↩
-
Individuals who have accessed at least some form of tertiary education (ISCED-5-8); European Commission (n.d.). ↩
-
Mosquera and others (2019) as cited in Barslund (2020) ↩
-
Ayuso and others (2021b) ↩
-
OECD (2021a); Ayuso and others (2021b) ↩
-
Barslund (2020) ↩
-
Ayuso and others (2021a); evidence from OECD (2021a) ↩
-
Barslund (2020) ↩
-
Jivraj and others (2020), cited by Ayuso and others (2021a) ↩
-
OECD (2019a) ↩
-
Crawford and Emmerson (2019); Government Actuary’s Department (2017) ↩
-
OECD (2021f) ↩
-
OECD (2021g) ↩
-
Economic Policy Committee & Social Protection Committee (2020) ↩
-
Economic Policy Committee & Social Protection Committee (2020) ↩
-
Implying that the sum of pension age and years of contributions equals 100; Giuliani (2021). ↩
-
Ayuso and others (2021b) ↩
-
These research questions were updated after screening and review, following discussion between the research team at RAND Europe and the Department for Work and Pensions. ↩
-
Contandriopoulos and others (2010) ↩
-
Nutley and others (2002) ↩