Second State Pension age review: independent report call for evidence
Published 9 February 2022

© Crown copyright 2022
This publication is licensed under the terms of the Open Government Licence v3.0 except where otherwise stated. To view this licence, visit nationalarchives.gov.uk/doc/open-government-licence/version/3 or write to the Information Policy Team, The National Archives, Kew, London TW9 4DU, or email: psi@nationalarchives.gov.uk.
Where we have identified any third party copyright information you will need to obtain permission from the copyright holders concerned.
This publication is available at https://www.gov.uk/government/calls-for-evidence/second-state-pension-age-review-independent-report-call-for-evidence/second-state-pension-age-review-independent-report-call-for-evidence
1. Introduction by Baroness Neville-Rolfe DBE CMG
1.1. The age of entitlement to State Pension has varied over time and is currently set at age 66 for both men and women. The Pensions Act 2014 set a statutory requirement to review the rules about pensionable age every 6 years, to help to ensure the costs of increasing longevity are shared fairly between the generations, and to provide greater clarity around how State Pension age will change in the future.
1.2. I have been asked to prepare an Independent Report making recommendations to the government on what metrics should be considered when setting the age of entitlement to State Pension age in future. The Terms of Reference for my report are set out at section 4.
1.3. This Call for Evidence is an important part of the evidence gathering stage of my report. State Pension age will impact most citizens at some point in their lives and I want as wide a range of people as possible to have the opportunity to contribute. I would encourage anyone with an interest to let me have their views on this important subject by responding to the questions set out below.
1.4. I welcome evidence from members of the public of all ages and all interested parties. I realise there will be experts in the fields of longevity and ageing, older people and the labour market, intergenerational fairness and the fiscal challenges associated with an ageing population who will be particularly interested.
2. Context
2.1. We have set out background information you may find helpful to read before answering the questions in the next section:
- the history of State Pension is at paragraphs 5.1 to 5.7
- trends in Demographics are at paragraphs 6.1 to 6.11
- labour market trends are at paragraphs 7.1 to 7.5
- trends in State Pension expenditure are at paragraphs 8.1 to 8.10
3. Questions
3.1. Intergenerational fairness:
- As people are living longer, how do we ensure the costs of State Pension are shared fairly across generations?
- What factors relating to intergenerational fairness should be considered when determining the State Pension age?
- Is it reasonable to give people a fixed period of notice for State Pension age changes, and if so what period?
3.2. Changes in the nature of work:
- How have changes to the types of jobs people do affected working lives?
- What are the anticipated future changes to the workplace? How could this impact on people’s working lives?
- What factors do people consider when making decisions about when to retire?
3.3. Sustainability and affordability:
- What is the most sustainable and affordable way of managing the cost of State Pension in the longer term? What are the advantages and disadvantages of potential options?
3.4. Metrics for setting State Pension age
- Is it reasonable for people to expect to spend a fixed proportion of their adult life in receipt of State Pension?
- Are there options for taking account of differences in circumstances when setting State Pension age in future? What are the advantages and disadvantages of these options, and how could they operate within the current pensions framework?
- How can we best take into account the sensitivity of the life expectancy projections when considering an appropriate State Pension age for the future?
- Are there other metrics which are relevant or more suitable to help determine State Pension age in future, and if so, what metrics?
- What factors do other countries consider when determining State Pension age?
3.5. Additional information
- Do you have any other comments which relate to the Terms of Reference of this review, that you wish to share?
4. Terms of Reference:
Second review of the State Pension age: independent report terms of reference
1. Purpose
1.1. The government is required by the Pensions Act 2014 to conduct a periodic review of State Pension age. The independent report on other specified factors (independent report) will provide evidence to inform that Review.
2. Context
2.1. As part of the evidence-base that informs the government review of State Pension age, the Secretary of State must commission 2 reports. These are:
- a report from the Government Actuary that provides an analysis of the latest life expectancy projections using specified proportions of adult life over State Pension age.
- a report on other factors she considers relevant – the terms of reference (TOR) for the latter are set out below.
3. Scope
3.1.The independent report should explore what metrics government should take into account when considering how to set State Pension age. It should include the following factors:
- a consideration of recent trends in life expectancy in every part of the United Kingdom
- whether it remains right for there to be a fixed proportion of adult life people should, on average, expect to spend over State Pension age?
- what metrics would enable State Pension costs, and the importance of sharing these fairly between generations, to be taken into account when making State Pension age decisions?
- what additional or alternative metrics would be appropriate to take into account when making State Pension age decisions?
3.2. In conducting analysis and reaching conclusions, the independent report should have regard to both the sustainability and long-term affordability of the State Pension and the views of organisations, individuals, and other interested parties.
3.3. The government review is expected to take account of a range of evidence including: life expectancy, socio-economic issues and the future affordability and sustainability of the State Pension. The independent report is not expected to cover questions related to the structure of State Pension including, for example, how State Pension is uprated.
4. Deliverables
4.1. The government will consider the findings as part of its review of State Pension age, therefore, emerging findings and recommendations must be submitted to the Secretary of State for Work and Pensions at a date to be determined by the Minister for Pensions and Financial Inclusion and the Secretary of State. The content of the independent report is the sole responsibility of the person appointed to conduct the work who will have the final say on all key outputs and recommendations. The timing and manner of the publication of the independent report will be determined by the Secretary of State.
5. History, financing and equalisation of the State Pension
History of the State Pension
5.1. Old-age pensions paid by the state were first introduced in the UK in 1909 under the Old Age Pensions Act 1908, which provided for means-tested pensions for men and women over the age of 70. Contributory pensions were first introduced by the Widows’, Orphans’ and Old Age Contributory Pensions Act 1925. This legislation made provision for the payment of a flat-rate pension to all pensioners over the age of 65, funded from contributions from the employer, the employee and the state.
5.2. The State Pension age for women was lowered to 60 by the Old Age and Widows’ Pensions Act 1940, whilst men’s pension age remained at 65. As explained in the Green Paper published before the introduction of the Pensions Act 1995, this “new inequality was a response to a campaign by unmarried women in the 1930s, many of whom cared for dependent relatives for much of their lives. It also recognised the fact that, on average, married women were several years younger than their husbands”.
Financing the State Pension
5.3. The State Pension, in the form in which it exists today, was introduced as part of the package of measures establishing the modern welfare state which followed the Second World War. The modern NI scheme was established by the National Insurance Act 1946 to provide unemployment benefits, sickness benefit, retirement pensions and other benefits in cases where certain conditions were met. Workers and their employers paid National Insurance Contributions (“NICs”) into the National Insurance Fund (“the NI Fund”) and benefits would be paid out of the fund on a “pay-as-you-go” basis (i.e. this year’s contributions fund this year’s benefits).
5.4. The NI scheme continues to exist in substantially this form today. NICs are paid into the NI Fund (except for around 20% of receipts which are used to fund the NHS). The contributions paid into the NI Fund are used to fund contributory benefits, including State Pension, contribution-based Employment and Support Allowance, Bereavement Benefits and contribution-based Jobseeker’s Allowance. Though the names of individual benefits have changed over time, the basic principle that the NI system will cover people for periods of sickness and unemployment and provide a basic pension has been a feature of the social security system for more than 70 years.
5.5. For those reaching State Pension age from 6 April 2016, the New State Pension applies in place of the old State Pension. This new system is greatly simplified and pays a flat rate benefit based on an individual’s NI record. The full amount of the benefit can be received after 35 NI qualifying years (with transitional arrangements in place to recognise pre-2016 NI records).
State Pension age changes
5.6. As set out above, the Old Age and Widows’ Pensions Act 1940 lowered State Pension age for women to 60 and kept it at 65 for men. No change was made to the age people became entitled to State Pension for many decades. Changes to State Pension age have been legislated in the Pensions Act 1995, Pensions Act 2007, Pensions Act 2011 and Pensions Act 2014. The Pensions Act 1995 equalised the State Pension age for men and women at age 65. The Independent Pensions Commission was established in 2002 with the mandate of reviewing the operation of the UK Pensions system and making recommendations for reform. The 2007 Act provided a forward look for State Pension age for the next 30 years. The Pensions Act 2014 set a statutory requirement to review the rules about pensionable age every 6 years and the first Independent Report, undertaken by John Cridland CBE, was published on 23 March 2017.
5.7. The position regarding historic State Pension age changes and future increases set out in legislation by dates of access can be summarised in the table below:
| Date of birth | State Pension age |
|---|---|
| Man born before 6 December 1953 | 65 |
| Woman born before 6 April 1950 | 60 |
| Woman born between 6 April 1950 and 5 December 1953 | Between the ages of 60 and 65, increasing incrementally by month of birth |
| Born between 6 December 1953 and 5 October 1954 (both sexes) | Between the ages of 65 and 66, increasing incrementally by month of birth |
| Born between 6 October 1954 and 5 April 1960 | 66 |
| Born between 6 April 1960 and 5 March 1961 | Between the ages of 66 and 67, increasing incrementally by month of birth |
| Born between 6 March 1961 and 5 April 1977 | 67 |
| Born between 6 April 1977 and 5 April 1978 | Between the ages of 67 and 68, increasing incrementally by month of birth |
| Born 6 April 1978 and later | 68 |
6. Trends in life expectancy
6.1. This section sets out, on average, how long people in the UK may be expected to live using 2 measures of life expectancy:
- Cohort-based life expectancy is the average number of additional years a person would live considering assumed future changes in mortality for their cohort over the remainder of their life[footnote 1]. These statistics are updated every 2 years and the 2020-based projections are the most recent available data[footnote 2]. However, a 2021-based update is expected to be released during 2023 to account for the 2021 Census[footnote 3].
- Period-based life expectancy is the average number of additional years a person would live if he or she experienced the age-specific mortality rates of the given area and time period for the rest of their life.
6.2. The Office for National Statistics (ONS) produce these statistics. The ONS regard cohort-based life expectancy as a more appropriate measure of how long a person of a given age would be expected to live on average than the period-based measure[footnote 4].
6.3. These measures are averages and there is substantial variation by geography, deprivation and other factors. Assessment of life expectancies against these characteristics is only possible using the more granular period-based measure. Separately, the ONS produce estimates of healthy life expectancy - an estimate of lifetime spent in “very good” or “good” health, based on how individuals perceive their general health.
6.4. The ONS also produce projections of the UK population which are used to assess the number of people above State Pension age and different dependency ratios, such as the old-age dependency ratio, in future years. These statistics are updated every 2 years and the 2020-based projections are the most recent available data. [footnote 5]
Life expectancy at age 65
6.5. Life expectancy at age 65 is increasing. The latest 2020-based cohort life expectancy projections show:
- Male life expectancy is projected to have increased to 84.9 years in 2022 – up 5.9 years from 1981. By 2047 this is projected to increase a further 2.2 years to 87.1.
- Female life expectancy is projected to have increased to 87.2 years in 2022 – up 4.2 years from 1981. By 2047 this is projected to increase a further 2.1 years to 89.3.
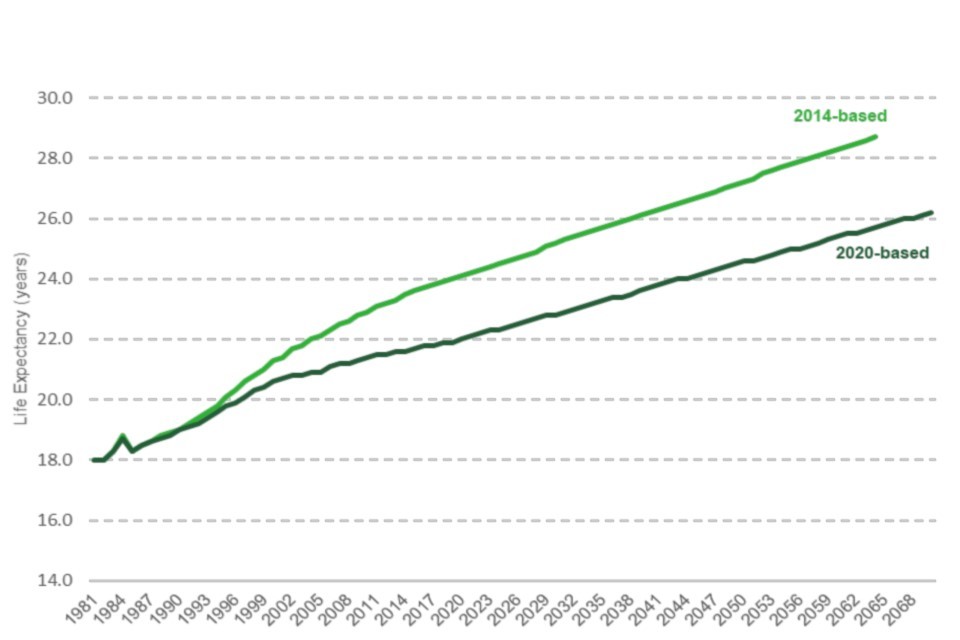
6.6. Although cohort life expectancy is increasing, these improvements are lower than the projected increases from previous data releases. Figure 1 shows the trend in male cohort life expectancy at age 65 and Figure 2 shows the trend in female cohort life expectancy at age 65, both using the 2014-based and 2020-based projections. These graphs show:
- Using the 2014-based cohort life expectancy projections, a man aged 65 in 2047 was projected to live until 89.9 years, compared to 87.1 years in the 2020-based projections.
- For women, the projected cohort life expectancy of a 65-year-old in 2047 was 91.9 years using the 2014-based projections, and 89.3 years in the recent 2020-based projections.
Figure 1: Male cohort life expectancy at age 65, UK (2014-based projections, 2020-based projections)
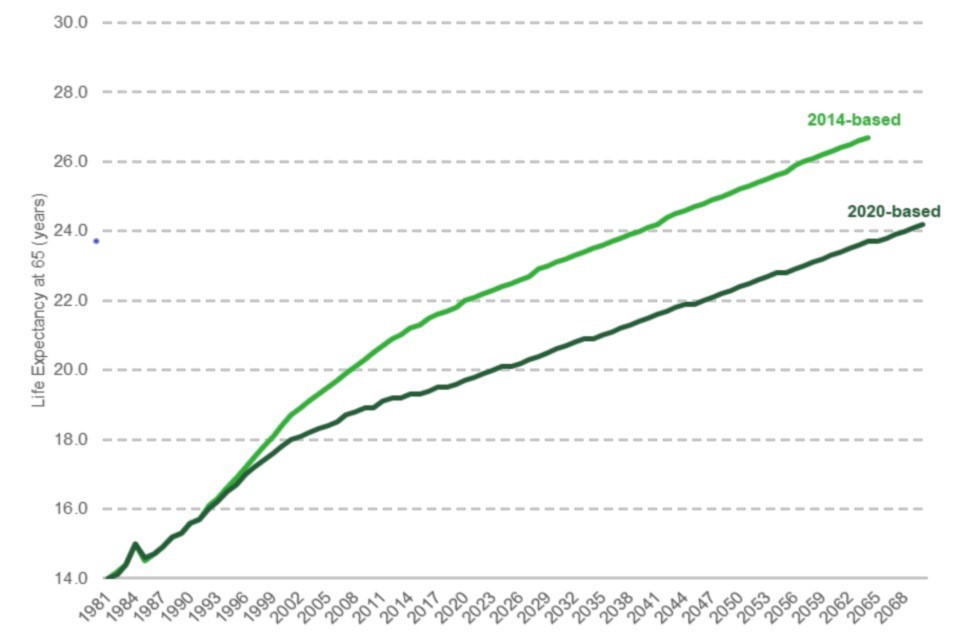
Figure 2: Female cohort life expectancy at age 65, UK (2014-based projections, 2020-based projections)
6.7. Those aged 65 in the north of the UK generally have lower life expectancies than those living in the south of the UK. Life Expectancies of 65-year olds are highest in England and lowest in Scotland.
- Using the period-based life expectancy measure, the largest life expectancies at age 65 in 2018-20 were found in the South East, South West, London and the East.
- Period-based life expectancy at age 65 in 2018-20 was lowest in Scotland and the North East and North West for both sexes.
- Using the 2020-based cohort life expectancy data, males aged 65 in England are projected to live to 85.1 years in 2022. This is longer than Northern Ireland (84.6 years), Wales (84.4 years) and Scotland (83.8 years).
- Females aged 65 in England are projected to live to 87.4 years. This is longer than Northern Ireland (86.9 years), Wales (86.8 years) and Scotland (85.9 years).
Life expectancy at birth
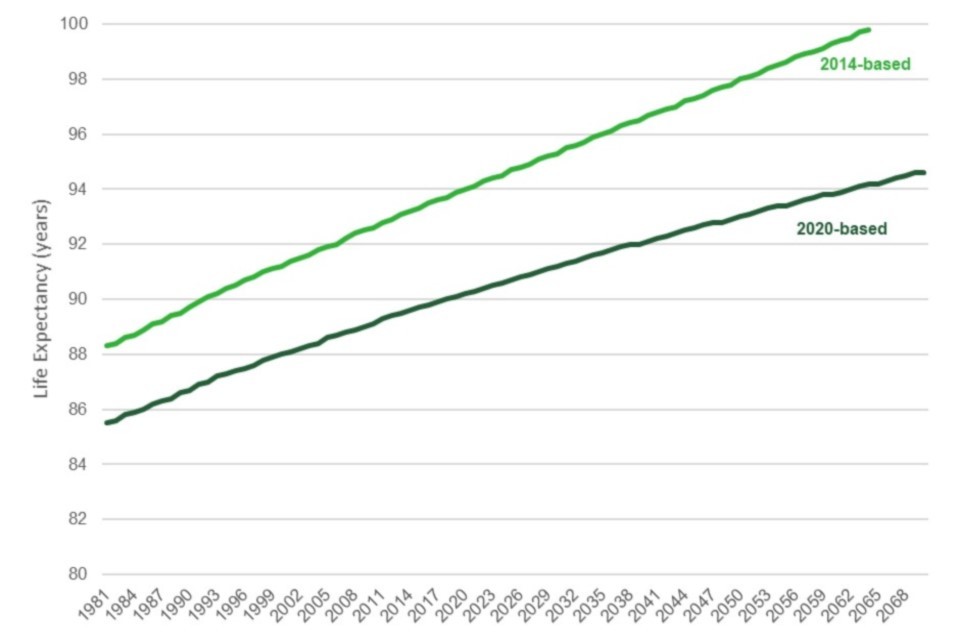
6.8. Life expectancy at birth is also growing, though follows a similar pattern of lower improvements than those projected at the time of the 2017 Review of State Pensions. Figures 3 and 4 show the trends in the 2014-based and 2020-based cohort life expectancy projections for males and females respectively. These charts show:
- New-born boys in 2022 are projected to live for 87.6 years – up by 6.1 years from 1981. By 2047 this is projected to increase a further 2.8 years to 90.3. This is lower than the 2014-based projected life expectancy of a new-born boy in 2047 of 95.0.
- New-born girls in 2022 are projected to live for 90.4 years – up by 4.9 years from 1981. By 2047 this is projected to increase a further 2.4 years to 92.8. This is lower than the 2014-based projected life expectancy of a new-born girl in 2047 of 97.6.
Figure 3: Male cohort life expectancy at birth, UK (2014-based projections, 2020-based projections)
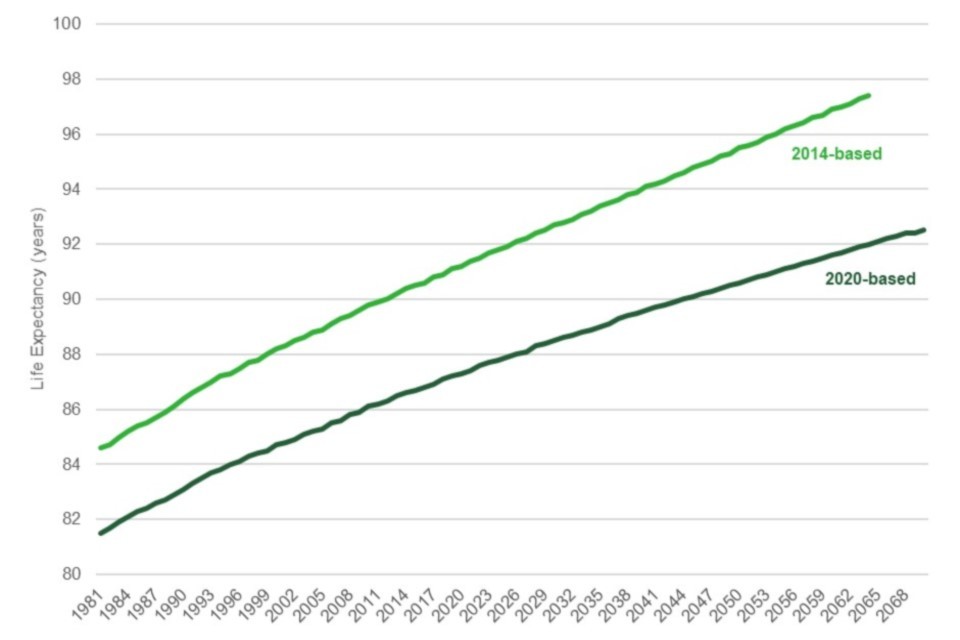
Figure 4: Female cohort life expectancy at birth, UK (2014-based projections, 2020-based projections)
6.9. New-borns in the south of the UK on average, can expect longer life expectancies than those in the north of the UK. Life Expectancies of new-borns are highest in England and lowest in Scotland.
- Using the period-based life expectancy measure, the highest life expectancies at birth in 2018-20 were in the South East, South West, London, and the East and the lowest were found in Scotland and the North.
- Using the 2020 based cohort life expectancy data new-born boys in England in 2022 are projected to live to 87.8 years. This is longer than Northern Ireland (87 years), Wales (86.9 years) and Scotland (85.7 years).
- In 2022, new-born girls in England are projected to live to 90.6 years. This is longer than Northern Ireland (90 years), Wales (89.9 years) and Scotland (88.7 years).
Number of older people
6.10. People are living longer lives. Figure 5 shows:
- The number of people of State Pension age or over is expected to grow by 24% over the next 25 years, from 12.1 million people in 2022 to 15.1 million in 2047.
- The number of people aged 85 years and over is expected to almost double over the next 25 years, rising from 1.7 million people in 2022 to 3.3 million by 2047.
Figure 5: Projected number of people aged 85 or above, UK (2020-based projections)

6.11. The increase in numbers of people above State Pension age, and increasingly longer lives, means that the number of pensioners per 1,000 working age people is projected to rise from 284 in 2022 to 337 in 2047.
7. Labour market trends
7.1. Changes to employment, work patterns, the types of jobs people undertake and the average of age of retirement are important considerations when determining State Pension age. This section outlines trends in these factors.
7.2. Trends in employment
- Over decades, there has been increasing participation in the labour market with marked increases amongst those closest to the State Pension age.
- The latest available statistics[footnote 6] show that in the 3 months to November 2021, the rate of employment for 16-64 year olds in the UK was 75.5% (31.2 million people). In the 3 months to March 1971, the employment rate was 72.2%, with 24.2 million people employed.
- The employment rate for people aged 50 to 64 was 70.8% in the 3 months to November 2021 (9.2 million people) increasingly steadily during the 1990s from a low of 55.5% (4.9 million people) in the 3 months to January 1993[footnote 7].
- The upward trend of employment rates for people aged 50 to 64 years over the past 25 years has been driven by increases in both full-time and part-time employment.
- However, since the COVID pandemic, rates and levels of unemployment and inactivity for 50-64 year olds have increased, with inactivity rates in the 3 months to November 2021 now at their highest since early 2017.
- The proportion of 16-24 year olds in full-time education has increased from 26% in the 3 months to May 1992 to 47% in the 3 months to November 2021.
7.3. Female participation in the labour market
- The proportion of women in work has increased steadily over time, from 52.8% in the 3 months to March 1971 to 72.2% in the 3 months to November 2021. Although male participation remained higher, it fell from a high of 92.1% to 78.8% in the same months.
- Women aged 50 to 64 years are considerably more likely than men of the same age to be in part-time employment.
7.4. Changes in the type of employment
- The types of industry that workers are employed in has been changing over time, with workers predominantly working in the services sector.
- Since 1978, the share of people employed in the manufacturing sector has fallen from around 25% to about 7% today. Over the same period, employment in the services sector grew from 63% to 84%.
7.5. Average age of exit from the labour market[footnote 8]
- The average age that women exited the labour market in 1950 was 63.9 years. It fell and reached its lowest point in 1986 at aged 60.3 years before increasing by 3.7 years to aged 64.0 years in 2021.
- For men, the average age of exit in 1950 was 67.2 years. It fell and reached 63 years in 1996 before increasing by 2.1 years to 65.1 in 2021.
8. Trends in State Pension expenditure
8.1. This section outlines the historic, current[footnote 9] and future[footnote 10] anticipated expenditure on State Pensions.
Historic spend on State Pensions[footnote 11]
8.2. State Pension expenditure has been increasing in cash terms for several decades.
8.3. The proportion of GDP spent on State Pensions was broadly flat during the 1990s until 2007-08 – between 3.3 and 3.7 per cent of GDP. The costs from increasing numbers of pensioners were broadly offset by slower growth in the average State Pension award than GDP per adult.
8.4. Since then, relatively slow growth of GDP, coupled with a continued rise in the number of pensioners and more generous uprating of pensions through the Triple Lock has further increased the costs of State Pensions as a proportion of GDP.
Current spending on State Pensions, and pensioner benefits
8.5. The Department for Work and Pensions is forecast to spend over £129 billion on benefits for pensioners in Great Britain in 2021/22. This includes the State Pension which is forecast to be nearly £105 billion that year.
Forecast changes to State Pension expenditure
8.6. The Office for Budget Responsibility (OBR) provide forecasts of State Pension expenditure, as a proportion of GDP as part of their Fiscal Sustainability Report, published every 2 years.
8.7. These forecasts show that State Pension expenditure is forecast to rise substantially over the coming 50 years. The most recent forecast available from the OBR, published in Summer 2020 shows that in spend on State Pensions is forecast to rise from 4.8% of GDP in 2021/22 to 6.2% in 2049/50. This increase comes despite currently legislated increases to the State Pension age.
9. Freedom of information
9.1. The information you send us may need to be passed to officials within the Department for Work and Pensions, published in a summary of responses received and referred to in the published report. All information contained in your response, including personal information, may be subject to publication or disclosure if requested under the Freedom of Information Act 2000. By providing personal information for the purposes of the Call for Evidence, it is understood that you consent to its disclosure and publication. If this is not the case, you should limit any personal information provided, or remove it completely. If you want the information in your response to the Call for Evidence to be kept confidential, you should explain why as part of your response, although we cannot guarantee to do this.
9.2. To find out more about the general principles of Freedom of Information and how it is applied within DWP, please contact the Central Freedom of Information Team: Email: freedom-of-information-request@dwp.gov.uk
9.3. The Central FoI team cannot advise on specific consultation exercises, only on Freedom of Information issues. Read more information about the Freedom of Information Act.
10. How to respond
Respondents should feel free to answer as many or as few questions as they wish. They should not feel they have to comment on every area but to focus on where they have a strong evidence base for their response. When responding to a question, please:
- give specifics
- reference any sources of data and provide evidence where possible
- keep responses as concise as possible
Please send written responses to this email address: ind.statepensionagereview@dwp.gov.uk
In the event you are unable to use digital communication methods, please post written responses to this address:
State Pension age review – Independent report
1st Floor, Caxton House
Tothill Street
London
SW1H 9NA
11. Deadline for responses
The closing date for written submissions is 25 April 2022.
-
Guide to interpreting past and projected period and cohort life tables - Office for National Statistics (ons.gov.uk) ↩
-
Past and projected period and cohort life tables - Office for National Statistics (ons.gov.uk) ↩
-
National population projections, subnational population projections and household projections for England – future plans - Office for National Statistics ↩
-
Period and cohort life expectancy explained: December 2019 - Office for National Statistics (ons.gov.uk) ↩
-
National population projections - Office for National Statistics ↩
-
A01: Summary of labour market statistics - Office for National Statistics (ons.gov.uk) ↩
-
A05 SA: Employment, unemployment and economic inactivity by age group (seasonally adjusted) - Office for National Statistics (ons.gov.uk) ↩
-
Economic labour market status of individuals aged 50 and over, trends over time: September 2021 - GOV.UK (www.gov.uk) ↩
-
Benefit expenditure and caseload tables 2021 - GOV.UK (www.gov.uk) ↩
-
Fiscal sustainability report – July 2020 - Office for Budget Responsibility (obr.uk) ↩
-
Welfare spending: state pension - Office for Budget Responsibility (obr.uk) ↩