Nature-based solutions for climate change mitigation: challenges and opportunities for the ASEAN region
Published 20 October 2021

© Crown copyright 2021
This publication is licensed under the terms of the Open Government Licence v3.0 except where otherwise stated. To view this licence, visit nationalarchives.gov.uk/doc/open-government-licence/version/3 or write to the Information Policy Team, The National Archives, Kew, London TW9 4DU, or email: psi@nationalarchives.gov.uk.
Where we have identified any third party copyright information you will need to obtain permission from the copyright holders concerned.
This publication is available at https://www.gov.uk/government/publications/uk-singapore-cop26-universities-network-policy-reports/nature-based-solutions-for-climate-change-mitigation-challenges-and-opportunities-for-the-asean-region
Foreword
This report is part of an overarching project developed in collaboration with the COP26 Universities Network and the British High Commission. The COP26 Universities Network is a growing group of over 80 UK-based universities working together to help deliver an ambitious outcome at COP26 and beyond. In this first ever collaboration of its kind, the network has brought together top researchers and academic figures from the UK and Singapore to publish a series of four reports aimed at supporting policy development and the UK’s international COP26 objectives in Singapore and across Southeast Asia. The reports focus on the following areas:
1) energy transition
2) nature-based solutions
3) green finance
4) adaptation and resilience
These bite-size and highly condensed papers will provide a high-level understanding of the challenges and opportunities arising from climate science and policymaking in the ASEAN region, as we seek to transition to a greener economy. Readers are encouraged to review all four reports to gain a more comprehensive picture of climate change issues in the ASEAN region.
Southeast Asia is highly susceptible to both current and future climate change impacts. The most recent United Nations Intergovernmental Panel on Climate Change (IPCC) report released in August 2021 presents a dire forecast for the region. This includes risks and hazards such as rising sea levels, increased droughts, longer and more intense storms, as well as higher heat and humidity indices. Yet with these ominous predictions, the region holds enormous potential for local, regional, and global-scale climate change mitigation and adaptation solutions. This report on Nature-based climate solutions (NbS) displays a thread of opportunity that weaves many aspects of the other three reports together. ASEAN holds the highest amount of global carbon stocks for climate mitigation, while at the same time, they provide added risk and hazard adaptations as discussed in the Resilience and Adaptation report. Further, given the enormous NbS assets the region holds, the Carbon Finance report touches on the ability to bolster the region’s economic prospects through nature-based carbon credits. And finally, as we transition into a low-carbon economy, the Energy Transition report will discuss the vital role that nature-based climate solutions play in future economic and social justice scenarios.
I. Contributors
**Kelly Siman is a Research Fellow at the National University of Singapore’s Centre for Nature-based Climate Solutions where she researches governance and regulatory aspects of nature-based climate solutions, with a focus in the ASEAN region.
Green Carbon
*Julia Drewer is a Senior Research Scientist at the UK Centre for Ecology & Hydrology in Edinburgh, Scotland. She is a biogeochemist who focuses on measurements of greenhouse gas emissions from different land-uses, including natural and agricultural systems, especially in South East Asia.
Alex M. Lechner is a landscape ecologist and Senior Lecturer at the University of Lincoln and an Associate Professor at Monash University Indonesia. His research focuses on the application of GIS and remote sensing to urban ecology, spatial planning and environmental impact assessment in Southeast Asia.
Lian Pin Koh is Professor and Director of the Centre for Nature-based Climate Solutions at the National University of Singapore, which seeks to produce cutting-edge science that informs climate policies, strategies and actions in Singapore and the Asia-Pacific region.
Yiwen Zeng is a Senior Research Fellow at the Centre for Nature-based Climate Solutions at the National University of Singapore. He is an applied ecologist and geospatial modeller who focuses on tropical conservation and sustainability, with the goal of informing environmental policies in Singapore and the Southeast Asian region.
Peatland Carbon
Gusti Anshari is a Professor at the Universitas Tanjungpura (Untan). He is a peatland ecologist with expertise in carbon changes in tropical peats and sustainable peatland resource management. He has obtained a PhD in geography and environmental science from Monash University.
Kwek Yan Chong is an ecologist with research interests in vegetation ecology, urban ecology, and invasion ecology, with a particular focus on tropical Asia.
Chris Evans is a professor at the UK Centre for Ecology and Hydrology, Bangor, UK. His research seeks to improve fundamental understanding of the terrestrial and aquatic carbon cycles, and to develop effective mitigation measures to reduce carbon loss and greenhouse gas emissions from managed peatlands from the high latitudes to the tropics.
Stephanie Evers is a Reader in Wetland Ecology and Biogeochemistry at Liverpool John Moores University, UK and has worked on wetland systems for 18 years - with 10 of these based in the tropical peatlands of SE Asia. Her research focuses on the impact of alteration to ecosystem function with land use change, and seeks to identify changes to greenhouse gas emissions, ecological processes and vulnerability to climate change.
Adi Jaya has worked for the Faculty of Agriculture, University of Palangka Raya, Indonesia since 1988 with > 20 years of research experience on tropical peatland ecosystems. His research area is interdisciplinary, broadly covering the ecology of wetlands, specialising in peatland farming communities and peatland restoration.
Jonay Jovani is a Research Fellow in Environmental Sciences at the University of Nottingham and a GHG flux Field and Data Scientist at the UK Centre for Ecology & Hydrology. His research focuses on the environmental impacts of farming and forestry on peatlands ecosystems.
Janice S H Lee is a land system scientist and studies the socio-ecological drivers, mechanisms and effects of land-use and land-cover change in the tropics. She leads the Coupled Human and Natural Systems Lab where geospatial data is combined with ground social and ecological field surveys. Her research interests include sustainability of the palm oil sector, tropical peatland management and restoration, agricultural impacts from natural hazards, and biodiversity and livelihood outcomes from deforestation for agriculture commodities.
Shailendra Mishra is a belowground ecology scientist, who combines above- and belowground ecological principles to better understand the impacts of land-use change on climate change and ecosystem processes in the tropics. His research interests include Responsible Agribusiness, Nature-based Climate Solutions, sustainability of the palm oil sector, tropical peatland management and restoration, Ecosystem Services and Voluntary Carbon Marketplace.
Susan Page is Professor of Physical Geography at the University of Leicester, UK. Research interests in biodiversity and carbon dynamics of tropical peatlands including impacts of land use change and fire and opportunities for mitigation of greenhouse gas emissions, with a particular focus on Southeast Asia.
** *Sofie Sjögersten is Professor in Environmental Science at the University of Nottingham. Her research over the last 23 years focuses on the impacts of land use and climate change on ecosystems and ways in which we can mitigate climate change by protecting and managing natural ecosystems.
**Helena Varkkey is a Senior Lecturer at the Department of International and Strategic Studies, University of Malaya. Her research focuses on the governance of transboundary haze pollution and the political economy of palm oil in Southeast Asia. More broadly, she seeks to understand how economic development can be reconciled with environmental sustainability in this resource-rich region. Her monograph on “The Haze Problem in Southeast Asia: Palm Oil and Patronage” was published in 2016.
Blue Carbon
*Daniel A. Friess is an Associate Professor at the National University of Singapore, and Deputy Director of the NUS Centre for Nature-based Climate Solutions. His research concerns blue carbon dynamics, deforestation, sea-level rise and conservation of mangrove forests in the ASEAN region.
Mark M. Huxham is a Professor of teaching and research in Environmental Biology at Edinburgh Napier University. He has worked on the protection and restoration of coastal ecosystems, particularly mangroves, for 25 years. He supports community-based projects that use ecosystem services, such as carbon sequestration, to raise funds for conservation and development.
Suzanne McGowan is Professor of Freshwater Sciences at the University of Nottingham. She investigates environmental change in freshwater ecosystems, including tropical systems in South and Southeast Asia.
**Report Lead Author
*Carbon Section Lead Coordinator
Suggested citation:
Siman, K., Friess, D. A., Huxham, M., McGowan, S., Drewer, J., Koh, L. P., Zeng, Y., Lechner, A. M., Lee, J. S. H., Evans, C. D., Evers, S., Sancho, J. J., Varkkey, H., Anshari, G., Jaya, A., Chong, K. Y., Page, S., Mishra, S., & Sjögersten, S. (2021). Nature-based Solutions for Climate Mitigation: Challenges and Opportunities for the ASEAN Region. (p. 36). British High Commission and the COP26 Universities Network.
II. Key policy recommendations
1. Prioritise investment in research, governance, and technology aimed at nature-based climate solutions science to capitalise on the region’s climate mitigation potential.
2. Southeast Asia has the highest global density of carbon stocks. Nature-based climate solutions are readily available, cost-effective, and should be swiftly implemented in the region for climate mitigation and adaptation.
3. Co-benefits such as biodiversity and livelihoods are a critical criterion of nature-based climate solutions projects. The highest quality NbS projects are those that deliver both effective climate mitigation and important co-benefits such as reduced haze and improved biodiversity.
4. Green carbon can provide approximately 20% of all tropical NbS in a cost-effective manner, yet these projects only represent about 2% of the total verified carbon credits in the region (~0.03 Gt CO2 yr-1). Increasing the amount of green carbon NbS in the ASEAN region can reduce carbon emissions by 1.35 Gt CO2 yr-1.
5. Restoration of degraded peatlands and improved water table and fertiliser management in peatlands under agriculture has the potential to make a nationally and regionally important contribution climate change mitigation of 170 and 412 Tg CO2 eq yr-1 for restoration and improved management, respectively.
6. Blue carbon in mangrove, seagrass and saltmarsh ecosystems can sequester and store carbon dioxide at substantially higher rates per hectare and for much longer timescales than most terrestrial ecosystems. The protection of mangroves alone could save as much as 887 Tg CO2 by the end of the century, and the restoration of blue carbon ecosystems will sequester additional CO2, while also providing climate change adaptation benefits for local communities.
7. The global market for nature-based climate solutions is growing, with significant potential in the ASEAN region. NbS projects in SEA have a potential of US $27.5 billion per year ROI, yet only 3% of green finance is spent on NbS. Additionally, there are impending significant governance constraints to restrict NbS project investment. ASEAN member states should prioritise a regional approach to capitalising on NbS investments to achieve individual member states NDCs.
III. Introduction
To reach net-zero by 2050 in accordance with the 2015 Paris Climate Agreement’s goal of limiting global warming to below 2°C, greenhouse gas (GHG) emissions must be cut by nearly 50% by 2030[footnote 1]. Despite the growing urgency to mitigate climate change, GHGs continue to rise by 1.4% per year [footnote 2], [footnote 3], adversely impacting the developing Southeast Asian (SEA) region.
The Association of Southeast Asian Nations (ASEAN) has four of the top ten countries most affected by climate change (Vietnam, Myanmar, Philippines, and Thailand)[footnote 4]. Despite the high risks of adverse impacts and vulnerabilities, the region poses enormous opportunity for NbS. This potential is, however, currently undervalued as a regional and global climate change mitigation strategy.
NbS are climate mitigation tools that, through natural processes, reduce atmospheric concentrations of GHGs and facilitate carbon sequestration and storage. The International Union for Conservation of Nature (IUCN) defines NbS as “actions to protect, sustainably manage, and restore natural or modified ecosystems that address societal challenges effectively and adaptively, simultaneously providing human well-being and biodiversity benefits”[footnote 5]. Recent studies show that investing in NbS increases the likelihood of achieving the Paris Climate Agreement by 66% [footnote 6], [footnote 7]. As a result, there is increasing discourse in global climate and policy settings to both recognise and increase the use of NbS. These solutions are widely available in Southeast Asia. We focus on three particular types of ecosystems that have a preeminent role in climate mitigation:
- Green Carbon: Terrestrial-based carbon sequestration (e.g. forests and agriculture)
- Peatland Carbon: Terrestrial wetland-based carbon sequestration (e.g. peat swamp forests)
- Blue Carbon: Coastal ecosystem-based carbon sequestration (e.g. mangroves and seagrasses)
Globally, Southeast Asia has the highest density of NbS, providing excellent prospects for not only climate mitigation and co-benefits, but also creating widespread opportunities for both public and private investment (see Temasek Ecosperity Report on the Business case for Nature-based climate solutions [footnote 8]. Adoption of the IUCN [footnote 9] core principles would mean that NbS are “an integral part of the overall design of policies, and measures or actions, to address a specific challenge”.
IV. Part One: Green Carbon
IV.I. Identification and description of mitigation options
Known GHG emissions from different land-uses
Existing long-term studies of GHG emissions[footnote 1] from different land-uses on mineral soil in the ASEAN region show that fertilised agricultural land (e.g. oil palm or rubber plantations) has higher nitrous oxide (N2O) emissions than natural forests (even if disturbed or logged)[footnote 2], [footnote 3], [footnote 4], [footnote 5], [footnote 6].
Methane (CH4) fluxes from mineral soil in the ASEAN region are generally small and fluctuate between small uptake and small emissions. The exception are flooded rice paddies which have high CH4 emissions. The best estimates of mitigation potential to date are summarised in Table 1.
Table 1. Mitigation potential of 7 green natural climate solutions pathways at “cost-effective” levels (<100 USD Mg CO2e-1).
Units are mean annual million metric tonnes of CO2 equivalents during the period 2030-2050 (Tg CO2e yr-1). Values taken from Griscom et al. 2020[footnote 7], note that Griscom et al. 2020[footnote 7] did not include Singapore and Brunei.
| Protect - Forest | Manage - Forest | Manage - Forest | Manage - Agriculture | Manage - Agriculture | Manage - Agriculture | Restore - Forest | |
|---|---|---|---|---|---|---|---|
| Country/Territory | Avoided forest conversion | Improved natural forest management | Reduced woodfuel harvest | Tress in agricultural lands | Nutrient management | Optimal grazing intensity | Reforestation |
| Cambodia | 42.50 | 1.23 | 0.48 | 8.99 | 0.00 | 0.03 | 11.23 |
| Indonesia | 458.27 | 187.49 | 8.23 | 4.83 | 4.44 | 0.14 | 66.68 |
| Laos | 44.64 | 14.95 | 0.31 | 0.58 | 0.00 | 0.03 | 10.02 |
| Malaysia | 137.18 | 14.76 | 0.27 | 0.65 | 1.82 | 0.00 | 10.05 |
| Myanmar | 52.37 | 19.49 | 1.87 | 6.63 | 0.00 | 0.12 | 29.19 |
| Philippines | 17.63 | 0.25 | 0.99 | 2.77 | 0.57 | 0.05 | 17.67 |
| Thailand | 36.11 | 0.00 | 1.70 | 12.29 | 3.27 | 0.00 | 29.35 |
| Vietnam | 43.67 | 11.83 | 2.03 | 3.64 | 2.65 | 0.13 | 18.41 |
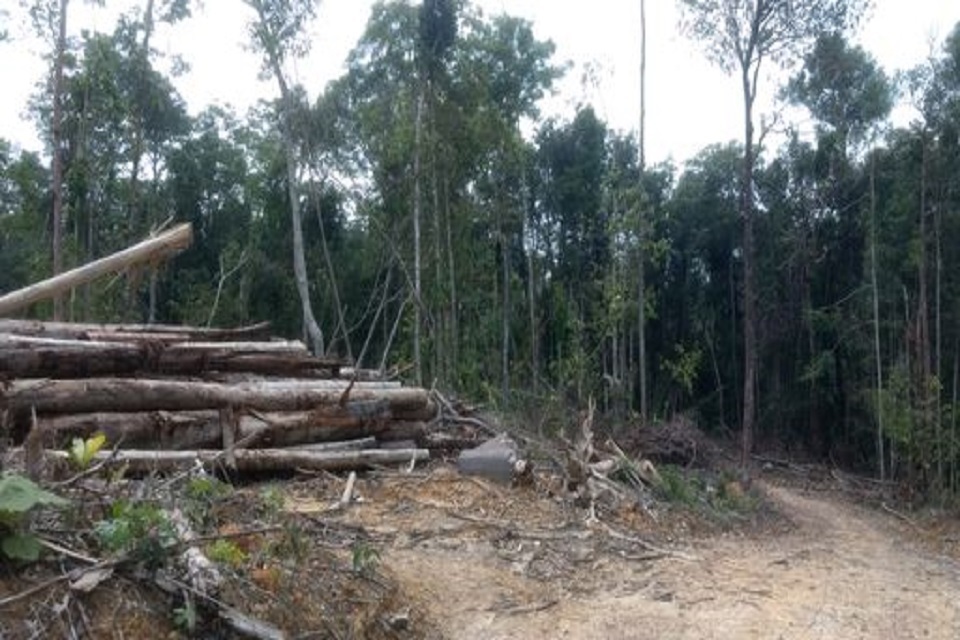
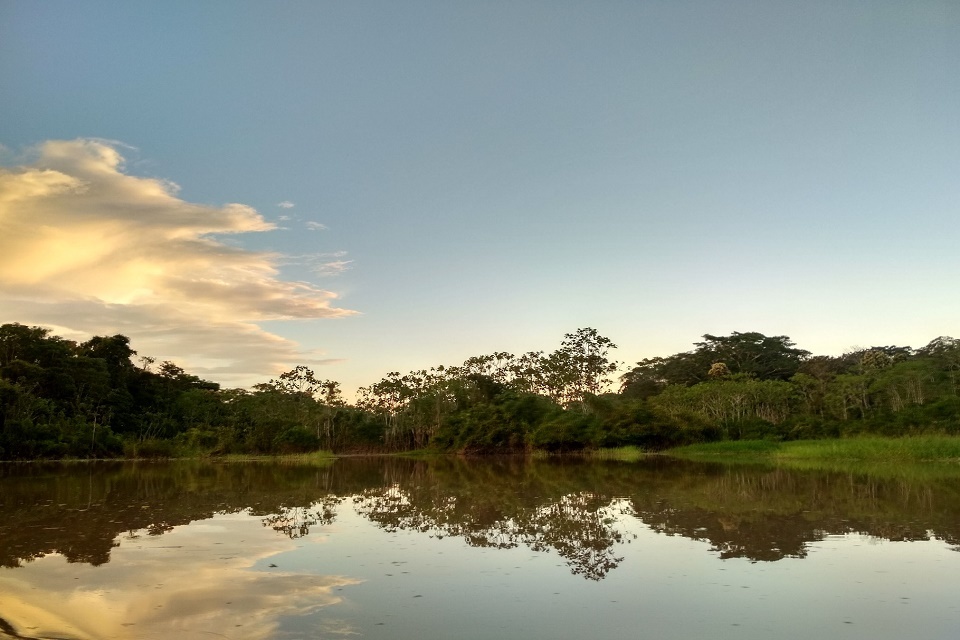
Photo by: Alex M. Lechner
Reforestation
It has been recognised that forest cover programs are important in ASEAN-member countries as a factor to mitigate GHG emissions[footnote 8]. Present expectations are that reforestation in these countries can sequester large quantities of carbon in order to mitigate excessive emissions elsewhere. However, any program that aims to set aside land for the purpose of sequestering carbon must do so without displacing communities and threatening food security in the region. One of the options for releasing lands for reforestation and therefore carbon sequestration would be the intensification of agricultural production on some of the better lands, for example by increased fertiliser inputs, which ultimately enhance GHG emissions (e.g. N2O)[footnote 9].
Agricultural Management
Main GHG emissions from agriculture (including cash crops such as rubber and oil palm) on mineral soil are N2O emissions. There are management options to reduce these, such as following fertiliser recommendations, as application of too much nitrogen (N) creates a surplus of N not required by the crop and instead becomes available for microbial N2O production; use of slow release N fertilisers and cover crops (ideally N fixing plants, which allow reduced application of mineral N fertilisers)[footnote 10]. CH4 emissions from rice cropping can be reduced by more effective water management strategies such as drip or micro-irrigation. These methods, in turn, reduce energy consumption, promote water savings, reducing labour, as well as fertiliser inputs, whilst at the same time maximising yields. At the same time, agroforestry can increase carbon sequestration by and mitigates emissions from cropland[footnote 11].
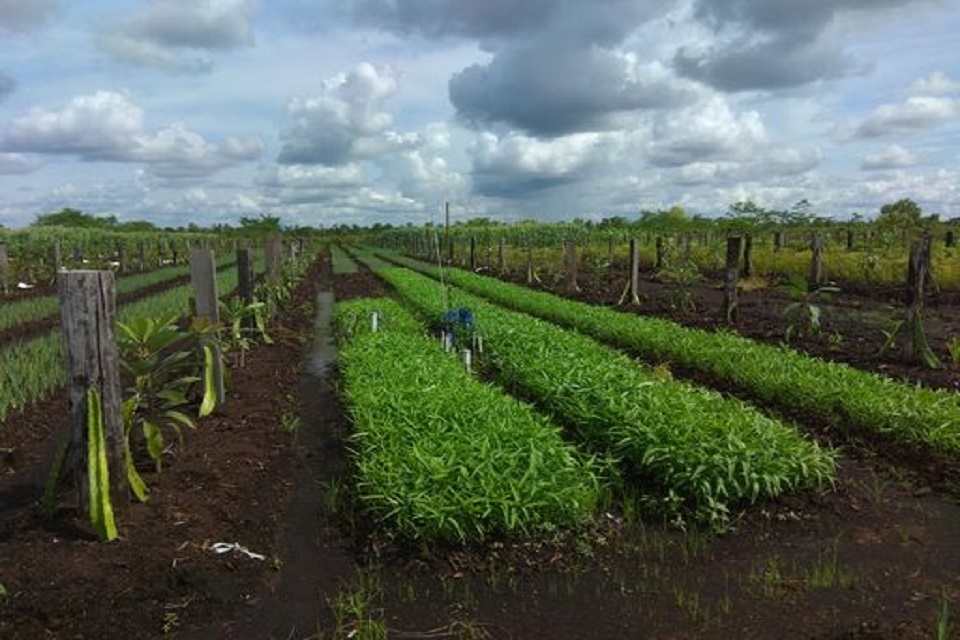
Photo by: Jonay Jovani
Co-benefits from NbS include climate change adaptation, which is particularly important for SEA, as it will be disproportionately impacted by climate change[footnote 12],[footnote 13]. In urban environments, co-benefits include better air quality, reduced flooding risks, cooler air, less noise, and well-being benefits provided by urban green spaces[footnote 13]. In natural and semi-natural ecosystems biodiversity conservation is an important co- benefit as Southeast Asia is a biodiversity hotspot[footnote 15],[footnote 16]. Co-benefits also include securing and regulating water supplies in catchment headwaters through the protection and restoration of natural forests along with nature-based tourism and biodiversity[footnote 17],[footnote 18]. Within agricultural landscapes, including monoculture plantations, and rice farming, NbS co-benefits, in addition to food production, can potentially be maximised using various management practices[footnote 19]. Irrigated rice, which is the main cultivated agroecosystem in Asia, can potentially provide a range of ecosystem services similar to natural wetlands, such as drought regulation and biodiversity conservation, when good agricultural practices are followed[footnote 20],[footnote 21]. While in oil palm landscapes, specific management measures, such as agroforestry and mixed crop plantations10,11 can prevent or reduce the loss of ecosystem services[footnote 22].
Table 2: Land-use, intervention options, impact on emissions and co-benefits for terrestrial forest and agricultural systems on mineral soil (green) and on peatlands (teal).
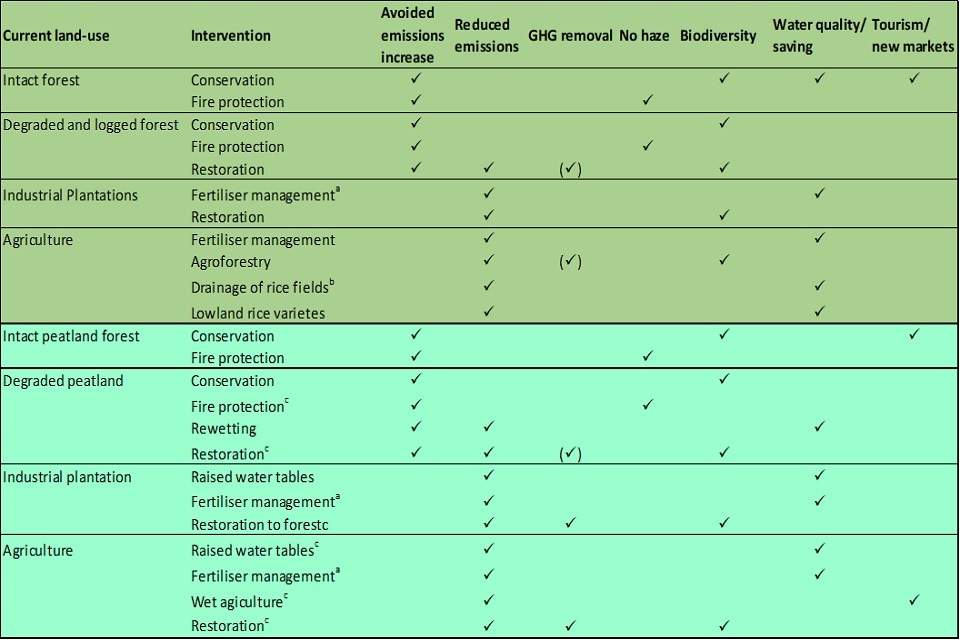
Table 2: Land-use, intervention options, impact on emissions and co-benefits for terrestrial forest and agricultural systems on mineral soil (green) and on peatlands (teal)
a Dose, timing and type of fertiliser important to reduce N2O emissions
b Intermittent drainage of rice fields to reduce CH4 emissions
c Require intervention to raise water tables
IV.3. Implementation and prioritisation
Green NbS can reduce carbon emissions by up to 1.35 Gt CO2 yr-1 or ~20% of all tropical NbS in a cost effective way[footnote 7], [footnote 23]. However, at the moment only a few NbS projects exist. For example, the total amount of carbon offsets generated by the current 18 Southeast Asian NCS projects certified by the Verified Carbon Standards represent only ~2% (or ~0.03 Gt CO2 yr-1) of the total NCS potential for the region (see Verra Registry[footnote 12]). Existing projects include Malaysia’s sustainable forest management implementation and enhancing the forest sinks [footnote 13] while Indonesia reports three mitigation actions in the agriculture sector: management of lowland rice; utilisation of cow manure fertiliser as compost (a trade-off being an increase in N2O emissions); and utilisation of livestock biogas[footnote 14].
Factors such as high opportunity and development costs, land-use constraints and operational limitations are barriers to setting up some NbS projects. For instance, designation of NbS projects on land that supports smallholder agriculture could displace livelihoods, compromise food security and lead to land grabbing. Further, long-term security of carbon stocks within NbS projects requires site maintenance and protection against anthropogenic and natural threats including illegal logging, tree diebacks (from both droughts and floods) and wildfires. In the case of reforestation, accounting for on-the-ground financial, land use and operational constraints across Southeast Asia limits the climate mitigation potential to a small fraction (0.3–18%) of the biophysical potential[footnote 28]. By focusing on areas with fewer barriers, NbS projects can prioritise sites with high biophysical suitability and lower associated socio-economic costs.
Figure 1. Map of profitable green carbon areas across the Asia-Pacific region with overlaps with key biodiversity areas and rural communities. Profitable carbon data from Koh et al. 2021[footnote 25].
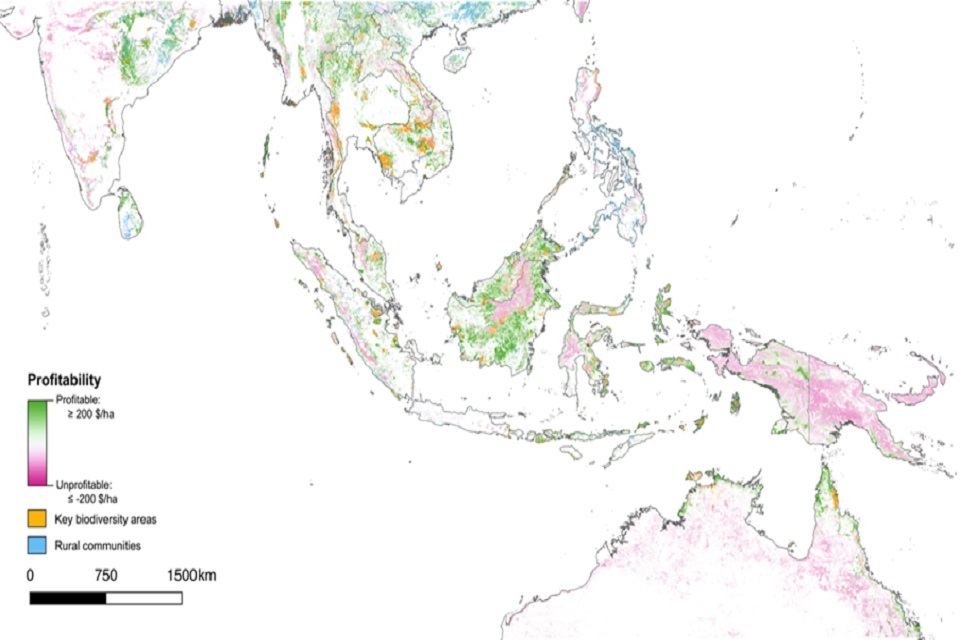
Figure 1: Map of profitable green carbon areas across the Asia-Pacific region with overlaps with key biodiversity areas and rural communities. Profitable carbon data from Koh et al. 2021
V. Part Two: Peatlands
V.1. Identification and description of mitigation options
Peatlands are amongst the world’s most efficient natural systems for carbon capture and they offer a substantial nature- based solution to climate change. Terrestrial plant biomass decomposes in waterlogged and oxygen-poor conditions, leading to the accumulation of peat which acts as a carbon sink. However, peatland carbon storage is ensured only as long as it is saturated by water. Lowering of the water table alters the balance between peat accumulation and decomposition, resulting in the release of stored carbon as greenhouse gases (mainly as CO2).
Tropical peatlands contain some of the richest carbon stocks, yet they are also the most threatened, with nearly 50% of all tropical peatlands being classified as degraded[footnote 15]. In Southeast Asia, peatland degradation reaches to approximately 80%[footnote 11], primarily by deforestation, drainage, as well as fire. At the moment, drained and burnt peatlands emit around 3-4% of global GHG emissions[footnote 15], [footnote 16]. Preventing further degradation of peatlands will protect their vital role in carbon sequestration and storage. Additionally, implementing peatland conservation and restoration measures mitigates climate change and acts as an NbS by avoiding future GHG emissions.
Opportunities for NbS for climate mitigation on peatlands
The main areas of tropical peatlands in ASEAN are in Indonesia, Malaysia and Brunei. Both Indonesia and Malaysia have considerable areas of peatland that can contribute towards climate mitigation[footnote 17]. The three main categories of peatland that can be used for NbS are:
(i) degraded peatland such as fire-prone forest and scrubland areas
(ii) peatland areas used for industrial scale production of oil palm and pulp wood
(iii) smallholder agriculture on peatland that mainly produces fruits, tubers, vegetables, rubbers, and oil palm
Estimated potential emissions reduction from NbS on peatlands are 476, 106 and 0.9 Tg CO2eq yr-1 in Indonesia, Malaysia, and Brunei, respectively (Table 3). This equates to 17, 146 and 15% of the NDCs in Indonesia, Malaysia, and Brunei, respectively, highlighting the importance of sustainable peatland management to support climate mitigation. In Indonesia and Malaysia, the largest gains in climate mitigation from NbS on tropical peatlands are firstly from better management of industrial plantations and secondly from restoring degraded peatland areas (e.g. fire-prone scrubland). In Brunei, the largest gains are from restoring degraded peatlands.
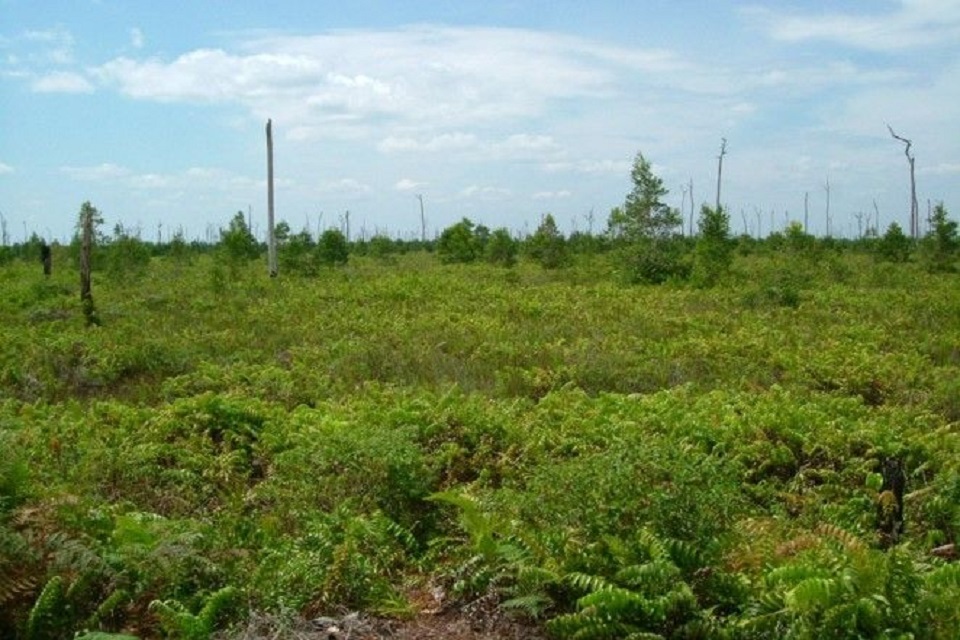
Photo by Susan Page
Table 3. Mitigation potential of 4 peatland natural climate solutions pathways at “cost-effective” levels (USD <100 MgCO2e-1).
Units are Tg CO2 eq yr-1 based on current emissions savings. Values calculated based on GHG emissions reported in the scientific literature from different land uses including emissions of CO2, CH4 and N2O. Avoided emissions from protecting peatland forest from conversion to the four other NbS pathways are based on the total carbon stock in intact peatland forests.
| Protect – Forest | Manage – Agriculture | Manage – Agriculture | Restore – Forest | |
|---|---|---|---|---|
| Country | Avoided Forest Conversion [footnote 18] | Industrial plantation Nutrient and Watertable Management | Smallholder Nutrient and Watertable Management | Reforestation |
| Indonesia | 59000 | 204.0 | 123.0 | 149.4 |
| Malaysia | 12200 | 67.9 | 17.4 | 20.2 |
| Brunei | 270 | 0.002 | 0.1 | 0.8 |
Values calculated based on annual GHG emissions reported in the scientific literature (for reference, see footnotes 19 to 40) for peatland forest, industrial plantation, smallholder agriculture and degraded peatlands not used for production. Values combine emissions of CO2, CH4 and N2O using their global warming potential and are scaled to the area of different land uses[footnote 17], [footnote 41] in the three ASEAN countries that have substantial peatland areas. Only studies reporting CO2 fluxes from peat degradation (i.e. excluding impact of vegetation) were included in the calculations as this gives more accurate representation of CO2 losses.
Mitigation potential for improved management of industrial plantation and smallholder agriculture and restoration of degraded peatland are calculated using emissions from pristine peatland forests as the baseline. Avoided emissions from protecting peatland forest are based on the total carbon stock (i.e. both biomass in trees and in the peat soil) in intact peatland forests.
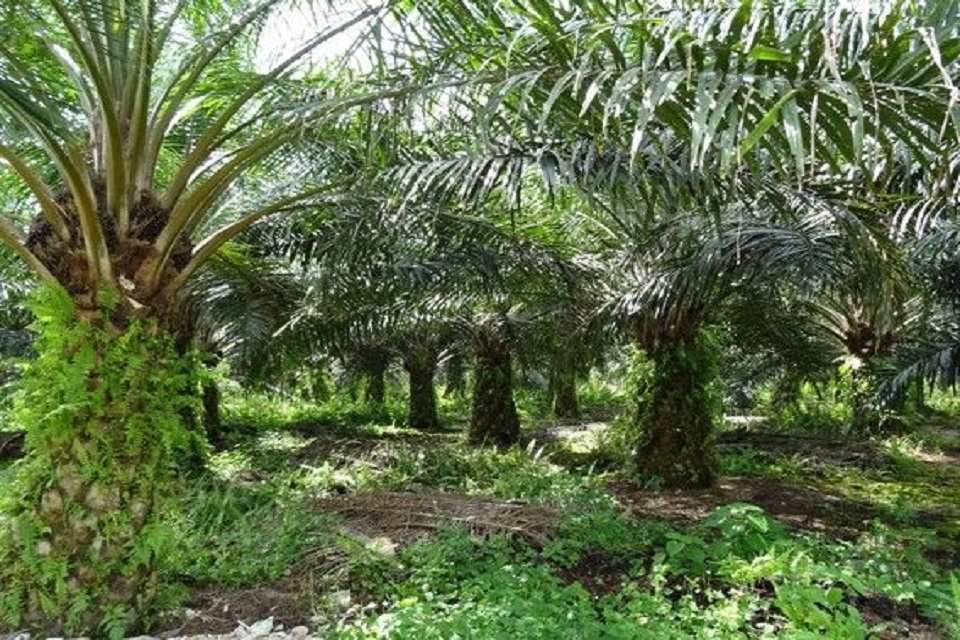
Photo by: Susan Page
V.2. Implementation and prioritisation
NbS mitigation options for peatlands fall into three categories:
(i) protection of existing forest from fire and conversion to plantations or agriculture
(ii) raising of water tables and replanting forest with native species
(iii) raised water tables, reduced fertilisation, and increased mixed cropping on existing plantation and agricultural land
Protection of existing peatlands should be a key national priority in the peatland-rich nations of Indonesia, Malaysia and Brunei as further degradation of peatlands will dramatically increase the emissions of GHGs. Regeneration of degraded peatlands must combine reforestation and raising water levels to natural high levels (i.e. close to the land surface) to stop fires. As peatlands cover large areas, integrated landscape-level approaches are needed.
When deciding which NbS to target, policy makers must consider: the greatest opportunity for mitigating climate change in the context of a particular country; the scale at which the intervention needs to be taken to be effective; potential conflicts with current uses of that land; and the co-benefits linked to the mitigation option (Tables 2 and 3). Restoration of degraded peatlands such as fire-prone scrubland is a key recommendation as this action is highly effective for climate change mitigation, does not cause conflicts with financial outputs from plantations or farm areas, and will have the important added benefit of stopping fires which result in transboundary haze (Tables 2 and 3) . However, the logistics of rewetting and replanting remote areas are challenging and potentially costly, and require long-term commitments (see next section on Barriers to implementation of NbS mitigation). More environmentally friendly management of plantations is our second recommendation. Key actions include integrated approaches that consider both above- and below-ground ecological principles[footnote 11] not just to protect these unique ecosystems but also to improve socio-economic outcomes[footnote 42]. Additional vital and achievable actions include controlling water tables to make sure they are no more than an annual average of 40 cm from the peat surface and reduce fertiliser inputs. Water tables as close to the surface as possible, e.g., at 20 cm will further reduce emissions [footnote 16], [footnote 43] but may have negative impacts on plantation growth and yield.
V.3. Co-benefits for NbS on peatlands
Restoration of peatlands brings several very important co-benefits. Rewetting peatlands stops fires, reduces haze and improves human health. Restoring peatlands will improve the quality of water in rivers and increase downstream water availability during droughts. Reforesting peatlands will improve the conservation and recovery of biodiversity and provide opportunities for tourism. Other sources of improved revenue include new markets for wetland crops on peatland areas, as well as cost-savings from reducing fertiliser inputs.
V.4. Barriers to implementation of NbS mitigation (policy/human/physical)
Monitoring and verification constraints
Monitoring: accurate datasets of peatland area and loss, and data on carbon stocks, fluxes, and emission factors are important in estimating national-scale sinks and emissions for Nationally Determined Contributions (NDCs), and for proving carbon additionality for site-scale projects. Foundational datasets are available for the area and extent of peatlands[footnote 17], [footnote 44] while carbon stocks, fluxes, and emission factors have been widely investigated[^45–48]. However, there remain major gaps in knowledge on peat depths, volumes and carbon stocks, and uncertainties regarding the impacts of fires, drainage, application of fertilisers on peatlands, and particularly regarding the effectiveness of different NbS in mitigating the effects of disturbance on peatland carbon losses and greenhouse gas fluxes, and preserving the benefits that these ecosystems provide[footnote 15], [footnote 42].
Carbon verification (of industrial plantations): Starting from 2017, the RSPO requires public reporting of GHG emissions assessment for new developments and has developed a New Development GHG Calculator to assist the estimation of GHG emissions, where emissions from peat cultivation are calculated based on a CO2 flux measurements equation[footnote 45]. Under the RSPO Drainability Assessment Procedure, companies are also required to phase out oil palm and/or rehabilitate the assessed area at least 40 years prior to reaching the drainage base. While these efforts are commendable, the extent to which they will provide a motivation for accurate reporting needs to be considered. Lack of verification data means that financing of long-term restoration projects can be difficult. However, with the advent of new technologies, such as remote sensing (i.e. satellite and drones), as well as the Internet of Things (IoT) networks, verification does become more effective.
Financial constraints
Protection – avoiding emissions: Many peatland protection projects in Indonesia were initiated in the hope of securing funding from either the carbon markets or REDD+ finance mechanisms. However, the economics of carbon sequestration may not provide sufficient funding to out-compete with other potential peatland uses. At COP21, it was acknowledged that carbon markets are insufficiently developed to support climate change mitigation efforts. Furthermore, there has been a mismatch between the initial perception of funding opportunities from foreign governments and their actual availability[footnote 49]. For example, Norway’s high-profile USD 1 billion REDD+ pledge to Indonesia in 2010 has so far only disbursed USD 56 million[footnote 50].
Management – raising water tables and reducing over fertilisation: Wetland agriculture is often proposed as an alternative economic activity for smallholders that will raise water tables and control fires on peatlands. However, despite the identification of a number of potentially suitable crops, wetland agriculture development in Indonesia and Malaysia is very limited due to knowledge gaps, uncertain market conditions and unsupportive regulatory environments[footnote 42]. To counter the problem of fertiliser over-application, solutions like the use of slow-release fertilisers, mixed cropping techniques or adopting microbial ecology principles to enrich the beneficial biota for increased productivity and reduced oxidation can be used. However, these high-tech interventions are yet to scaled-up due to operational costs and low awareness.
Restoration – regeneration of peat swamp forests to remove GHGs: Estimates of the cost to complete Indonesia’s peatland restoration agency’s (i.e. BRGM’s) proposed 2-million-hectare peatland restoration initiative range from USD 1.7 billion[footnote 51] to USD 4.6 billion[footnote 52], substantially more than the funds allocated to the challenge across Indonesian (USD 60 million) and international donor (USD 140 million) budgets [footnote 51]. Furthermore, as restoration projects are in nature very long-term, obtaining continuous project funding over long periods can be challenging, and this is compounded by various financial disincentives including the over-focus on firefighting over fire prevention, community members becoming reliant on wages for restoration projects, and lack of infrastructure for alternative livelihoods like eco-tourism[footnote 42].
Governance constraints
Peatland degradation across the region has been driven by the expansion of industrial plantations for palm oil, rubber and acacia as part of national strategies for land-use development and foreign direct investment. In particular, palm oil has been designated as a Key National Economic Area for Malaysia and a strategic commodity for Indonesia[footnote 53]. Both countries have put in place jurisdictional-based palm oil sustainability schemes but best management practices for planting on peat under these schemes remain vague. Furthermore, the federal-state system in Malaysia empowers regional/state authorities to de-gazette protected peatland areas.
Some national-level legislation and policies exist that may impact positively on peatland sustainability, including Malaysia’s capping the total oil palm area to 6.5 million hectares and Indonesia’s peatland moratorium, its Online Single Submission System[footnote 54] for new land investments, and policy PP 71/2014 juncto PP 57/2016 [footnote 55] which requires the maintenance of an average groundwater level of 40-cm depth from the ground surface to reduce fire hazard and slow down the peat decomposition process. In both countries, however, challenges remain in safeguarding protected forests from illegal logging, land encroachment and conversion by companies and communities. In Indonesia, while companies can be better controlled through regulations, there are exceptions for peatland use and drainage facilities for the local communities with smallholder agriculture on peat occupying as large an area as company plantations.
NbS interventions on peatlands alter the way in which humans interact with their environment and significant challenges remain in ensuring long term and equitable benefits for local communities. Peatland restoration involving canal-blocking activities to manage water tables may disrupt community use of canals and their water supply to the surrounding communities. Conflict may also arise between governments, NGOs, or donors and communities over the selection of tree or crop species for forest regeneration, where communities may prefer species that can relatively rapidly provide economic benefits over natural forest species[footnote 42].
V.5. Case study of peatland under restoration
Several degraded peatlands are under active restoration to reduce fire risk (and thus haze) and improve their ecosystem functioning. Such restoration actions need to weigh the ecological ‘needs’ of the degraded peatland against the needs of local communities. One example of a peatland under restoration is the North Selangor Peat Swamp Forest which is the largest peat swamp forest remaining in Peninsular Malaysia. This peatland has been impacted by smallholder and industrial-scale plantations. An Integrated Management Plan has been developed (facilitated by an NGO, Global Environment Centre, and the state Forestry Department) aimed at preventing further forest degradation and forest fires and restoring degraded areas to a more natural forest.
Management actions typically focus on water resource management, fire prevention and control, forest protection and rehabilitation. Local communities living in and around the forest and industrial stakeholders are also engaged to enhance local livelihoods. As a result, large areas have been restored by the local communities themselves. For example, collaboration with plantation companies and smallholders has resulted in raised water levels in boundary canals, and local communities carrying out fire patrol and prevention in buffer areas. Key to the success of restoration of this peatland has been the community-based approach, the development of the management plan in consultation with multiple stakeholders, and the combination of rewetting and replanting of the forest.
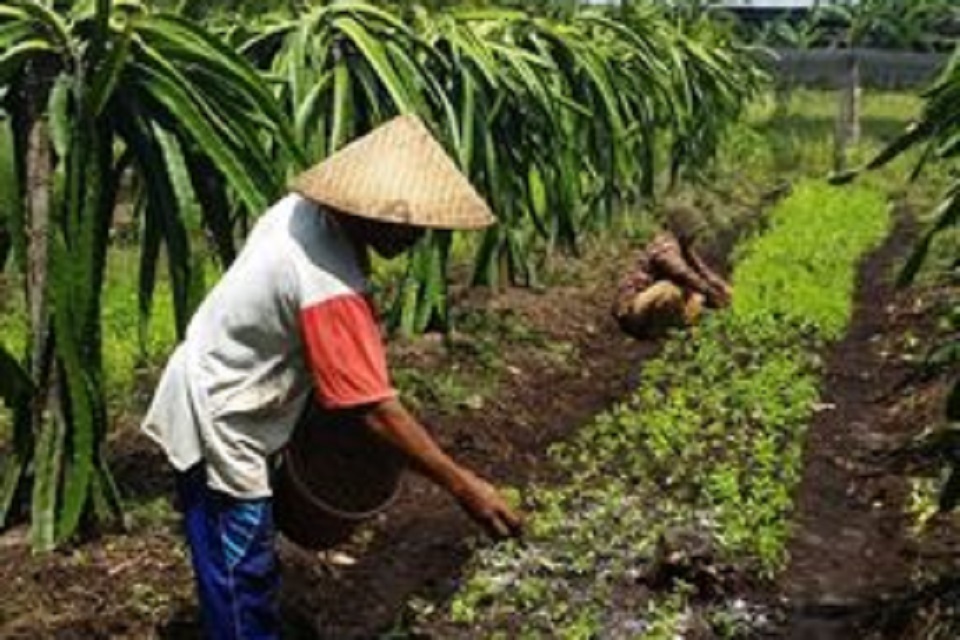
Photo by: Susan Page
VI. Part Three: Blue Carbon
“Blue carbon” is the organic carbon stored by vegetated coastal ecosystems, primarily mangrove forests, seagrass meadows and tidal marshes. Blue carbon ecosystems share two key characteristics: firstly, their ability to remove greenhouse gases from the atmosphere (or their emissions if they are lost) must be substantial. We now have strong evidence to show that blue carbon ecosystems are able to sequester and store carbon dioxide at rates per hectare that are substantially higher than most terrestrial ecosystems[footnote 56], [footnote 57]. Secondly, carbon must be stored over time scales relevant to climate change; blue carbon ecosystems are able to do this over millennia in their waterlogged soils.
Southeast Asia has the most extensive mangrove forests globally, covering 5.2 Mha[footnote 58]. However, they are some of the most threatened in the world; 80% of all human-caused mangrove loss globally occurs in 6 countries in Southeast Asia[footnote 58]. Rates of mangrove loss have reduced since the 20th century, but Southeast Asia’s mangroves were still lost at 0.2% per year between 2000 and 2012, with rates in particular countries such as Myanmar averaging 0.5% per year. Approximately 30% of mangrove change was caused by conversion to aquaculture, 22% to rice paddy, and 16% to oil palm[footnote 59].
Southeast Asia is also home to more than 3.7 Mha of seagrass meadows[footnote 60]. Regional rates of seagrass loss are less certain than for mangroves, but could be as high as 2.8% per year[footnote 61] which is an order of magnitude higher than rates of mangrove loss. The causes of seagrass loss are also more diverse than mangroves; in addition to land cover conversion through reclamation and urban development, seagrasses are also strongly influenced by point source threats such as trawling, and diffuse stressors such as watershed organic pollution.
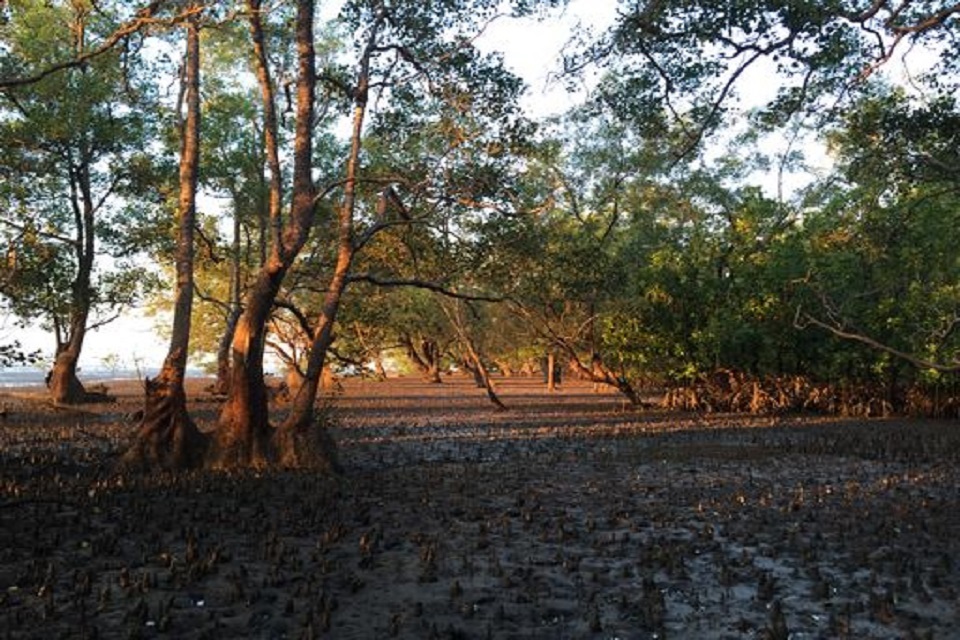
Photo by: Susan Page
VI.1. Scope of Blue Carbon Opportunities in Southeast Asia
The threatened status of mangroves and seagrasses in the region give a clear opportunity for management to contribute to both conservation and restoration of blue carbon stocks and emissions reductions from land use change. Opportunities abound at both the national scales (NDCs) and at the site-scale for the generation of carbon credits. Of the ASEAN nations, only the Philippines included blue carbon in both categories of their initial NDCs[footnote 62], though interest in blue carbon for NDCs has increased subsequently and blue carbon is being increasingly incorporated into the 2021 updated NDCs. Similarly, we are seeing rapid and substantial interest in the establishment of local-scale carbon credit projects in the ASEAN region since 2020.
Opportunities for mangrove blue carbon
At the national scale, mangroves are now explicitly discussed in the context of NDCs for Indonesia, Malaysia, Philippines and Vietnam. There is substantial scope for saving carbon through “avoided deforestation”; regional mangrove carbon stocks add up to approximately 1900 Tg C (approximately 45% of the world’s total), and Indonesia alone was responsible for almost 50% of global carbon emissions linked to mangrove deforestation between 2000 and 2012[footnote 63]. If all ASEAN countries stopped human-caused mangrove deforestation, it could save as much as 887 Tg CO2e yr-1 by 2100, or 66% of the world’s total (calculated from Adame et al., 2021[footnote 64]). Griscom et al. (2020)7 similarly highlight national-scale opportunities for both avoided deforestation and restoration of carbon (Table 4).
Table 4. Mitigation potential of 2 mangrove natural climate solutions pathways at “cost-effective” levels (<100 USD Tg CO 2e-1).
Units are mean annual million metric tonnes of CO2 equivalents during the period 2030-2050 (Tg CO2e yr-1). Values taken from Griscom et al. 20207, note that Griscom et al. 2020 did not include Singapore and Brunei. Seagrasses were not included in Griscom et al. 2020’s analysis due to a lack of spatially explicit information.
| Protect - Wetland | Restore - Wetland | |
|---|---|---|
| Country/Territory | Avoided Mangrove Loss | Mangrove restoration |
| Cambodia | 0.41 | 0.13 |
| Indonesia | 24.29 | 4.38 |
| Laos | n/a | n/a |
| Malaysia | 2.13 | 0.39 |
| Myanmar | 3.19 | 1.02 |
| Philippines | 1.72 | 0.37 |
| Thailand | 1.37 | 0.41 |
| Vietnam | 1.13 | 0.41 |
At the site scale, a recent analysis suggests that 577,300 ha of Southeast Asia’s mangroves may meet the criteria for blue carbon avoided deforestation projects and be financially viable, equating to a climate change mitigation potential of 20.3 million tCO2-e per year[footnote 65]. There is also ample scope for restoration or other land management changes to increase blue carbon stocks. More than 300,000 ha of formerly converted mangrove areas may be biophysically suitable for restoration in Southeast Asia[footnote 66], and mangrove restoration interventions can quickly sequester carbon, or reduce greenhouse gas emissions from abandoned aquaculture ponds.
Figure 2. Map of potential opportunities where mangrove blue carbon projects are feasible (purple) and profitable (green). Source: Zeng et al. (2021)[footnote 65].
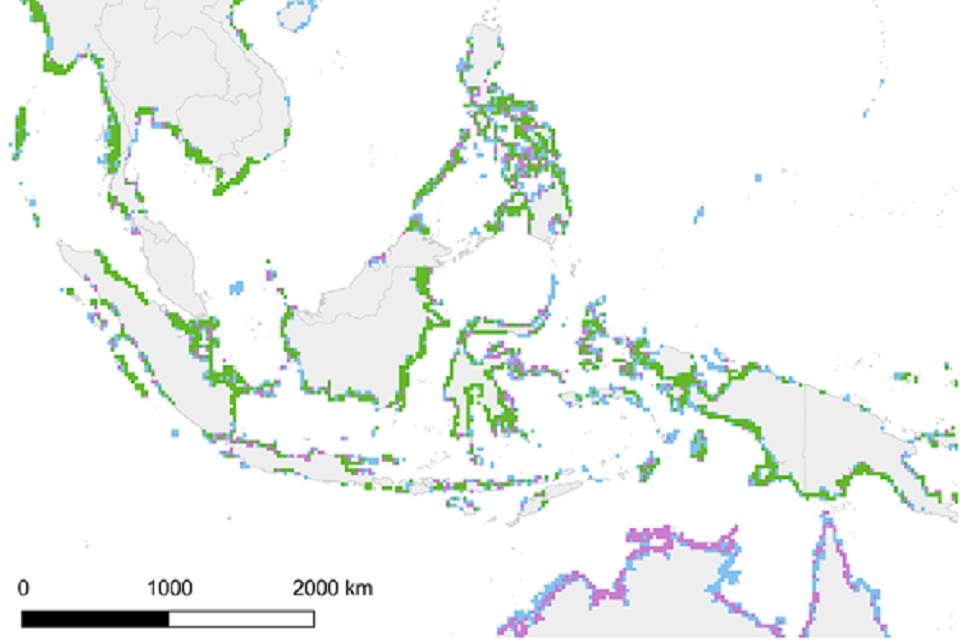
Figure 2. Map of potential opportunities where mangrove blue carbon projects are feasible (purple) and profitable (green). Source: Zeng et al. (2021)
Opportunities for seagrass blue carbon
Seagrasses lag behind mangroves in terms of incorporation into blue carbon strategies. Seagrasses are currently not embedded in ASEAN NDCs [footnote 61], in part because their marine status means that they are often not considered under terrestrial land use emissions accounting. However, the potential to do so is huge. Regional seagrass carbon stocks have been coarsely estimated at 429 Tg C. High rates of habitat loss mean that regional carbon emissions from seagrass loss range from 0.7-2.1 Tg CO2- e per year; seagrass conservation to reduce these emissions could help ASEAN countries meet 7% of their CO2 emissions reduction goals by 2030[footnote 61]. Opportunities may also exist to restore seagrass and their carbon stocks, though successful experiences in upscaling seagrass restoration are limited in the region.
We have substantial knowledge gaps on the potential opportunities for site-scale seagrass blue carbon projects. This is in part due to data availability, but also because blue carbon projects for seagrasses are complex as threats to seagrass blue carbon are often diffuse, originate across large areas (e.g., watersheds), and hence require many participants to be involved in a project.
VI.2. Limitations of Blue Carbon in Southeast Asia
Despite the huge interest in blue carbon from government, non-governmental and commercial stakeholders, the implementation of robust national carbon accounting or on-the-ground blue carbon projects is limited.
Scope and scales of blue carbon
The small extent of blue carbon which is constrained to the coastal zone, means that blue carbon contributes only ~1.3% of global carbon sequestration by vegetated ecosystems[footnote 56], meaning that its influence on climate change mitigation at the global scale contribution is likely to be limited. However, there is scope for blue carbon to contribute to emissions reduction at the national scale[footnote 56] particularly if high rates of mangrove loss in some countries such as Myanmar can be reduced further. But the most impactful scale is likely to be the site-scale; their high carbon densities per hectare compared to other ecosystems means that blue carbon ecosystems can generate high densities of carbon credits to support livelihood projects or local offsetting.
Monitoring and verification constraints
In terms of blue carbon data, the region’s mangrove forests are generally well represented in terms of stocks, but we lack robust and regionally appropriate information on carbon fluxes (gaseous, dissolved) and emissions factors during habitat conversion. Our knowledge of seagrass stocks and fluxes are substantially behind mangroves, though recent efforts have increased the base knowledge, particularly for ASEAN seagrass stocks[footnote 61]. We have little to no knowledge of tropical saltmarsh distribution, habitat loss, carbon stocks and fluxes across ASEAN countries.
Carbon verification methodologies have traditionally been based on terrestrial projects. It has been particularly challenging to incorporate soil carbon into existing accounting mechanisms, which have generally not been considered for terrestrial ecosystems, but represent the largest proportion of peatland and blue carbon pools. Encouragingly, verification organisations have recently focused on adapting their standards to be more applicable to blue carbon projects, such as updating the Voluntary Carbon Standard REDD Methodology Framework VM0007.
Financial constraints
Resources for blue carbon conservation can come from public and private funds. Examples of public funds include those linked to the achievement of international conservation agreements (e.g. the Global Environment Facility) and commitments under the Paris Agreement. Prominent amongst private funding are opportunities for Payments for Ecosystem Services (PES), in which buyers (such as tourists) pay for a service provided by a blue carbon ecosystem (such as desirable snorkelling over seagrass meadows).
Blue Carbon PES projects can have significant initiation costs (for example, around USD 400,000 in the case of the Kenyan initiative Mikoko Pamoja[footnote 67]) and once established need to ensure sufficient income to meet the costs of marketing, monitoring and verification. The flows of ecosystem service must therefore be sufficient to meet these costs. A sole focus on one service, such as carbon, can make this difficult; for example seagrass may have insufficient carbon density to make carbon-based PES projects viable. Solutions to this may involve combining a single service across ecosystems (for example combining carbon across mangroves and seagrasses), incorporating, stacking or bundling multiple ecosystem services (for example biodiversity and carbon), or using blended forms of finance with public and private sources[footnote 68].
Governance constraints
Governance of blue carbon ecosystems can occur at multiple levels and jurisdictions. However, their position in often marginal lands in the intertidal and subtidal zone means that these ecosystems often fall through the “policy gap” between terrestrial and marine governance structures. Across ASEAN, management of blue carbon tends to fall under the remit of multiple ministries. As such, it is sometimes not clear who has authority for mangrove and seagrass management, or the authority to reduce stressors that occur higher up in the watershed but ultimately flow downstream and affect blue carbon dynamics. Blue carbon ecosystems can also find themselves in the middle of conflicts between different ministries or agencies with different mandates, e.g., biodiversity conservation vs. food security. Indeed, historically, mangrove losses across ASEAN were driven by economic and food security objectives.
There are paths forward to clarify governance structures and overcome these challenges. Legislation and policy can be used to restrict land allocations (e.g. state policy designates aquaculture covers <30% and mangrove forest >20% in Vietnam[footnote 69]) but the designation of these targets is somewhat arbitrary and rarely includes fully-budgeted evaluations of carbon. Establishing and enforcing marine protected areas (MPAs) is one way to promote environmental governance. Across ASEAN, protected marine areas comprise low proportions of total marine areas: Thailand (4.4 %), Philippines (2.5%), Malaysia (2%), Indonesia (2%), Vietnam (1.7%), Brunei Darussalam (1.4%), Singapore (1.4%) and Myanmar (0.31%)[footnote 70]. MPAs can better incorporate intertidal and ‘terrestrial’ systems such as mangroves. Local-scale initiatives that encourage greater community governance, such as community forest management and PES can have positive blue carbon outcomes, if we can ensure long term and equitable benefits for local communities. Tangible socio- economic, socio-cultural and ecosystem co-benefits are at the heart of successful NbS and full engagement of all stakeholder groups is necessary in planning NbS projects.
Adoption of the IUCN9 core principles would mean that NbS are “an integral part of the overall design of policies, and measures or actions, to address a specific challenge”. Across ASEAN, the threats to coastal ecosystems often cross national borders, park designations and terrestrial-aquatic ecosystems, and successful delivery of blue carbon will require cooperation and coordination across the ASEAN region and beyond, with local management actions being viewed alongside river-basin scale initiatives.
V1.3. Co-benefits of blue carbon approaches
Conservation and restoration using blue carbon can also protect or increase a vast array of other co-benefits that these ecosystems provide. Mangroves and seagrasses support local livelihoods through the creation of provisioning services such as fuel, construction materials, food products (including fish and shellfish) and sources of traditional medicines and pharmaceuticals. Both ecosystems are well known for their role as a fish nursery and as a form of coastal protection against some types of meteorological events. Increasingly, we are also beginning to understand the cultural services provided by blue carbon ecosystems, particularly recreation and ecotourism, which is estimated to be a multi- billion dollar industry in mangroves globally[footnote 71]. The benefits of ASEAN’s mangroves alone may be worth an average of USD 4,185 per hectare per year, and ongoing mangrove deforestation means that we may be foregoing benefits of USD 2.2 billion per year by 2050 [footnote 72]. These numbers are themselves likely to be underestimations, as many benefits cannot be easily monetised.
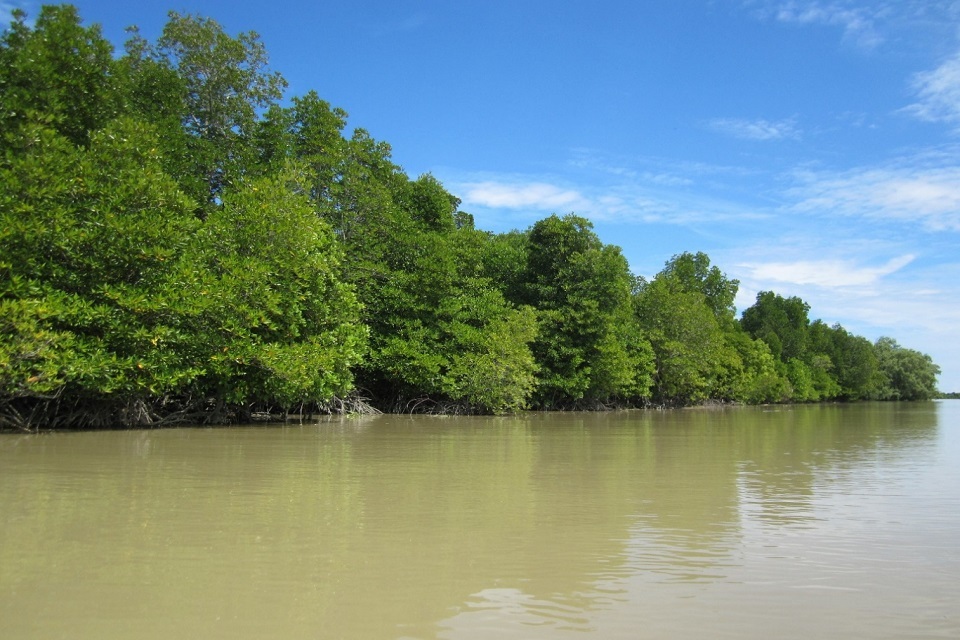
Photo by: Daniel A. Friess
VII. Conclusion
Nature-based solutions offer countries real opportunities for meeting their NDCs in a cost effective way. The impact of some NbS options, such as forest restoration, will continue over the coming decades, while improved agricultural management such as reduced nitrogen fertiliser application and the use of intermittent flooding in rice agriculture may result in faster emissions mitigation. To maximise the use of NbS, stronger policy frameworks, controls of compliance and long term financing are urgently needed. Indeed, with increasing support and interest from corporates, NGOs and development banks, the transacted volume of nature-based carbon credits in the voluntary carbon market grew by over 250% between 2016 and 2018, from 14 Tg CO2e yr-1 to 51 Tg CO2e yr-1 [footnote 73]. In addition to the promising economic factors, it is the tangible socio-economic, socio-cultural and ecosystem co- benefits that are at the heart of successful NbS projects. Accordingly, full engagement of all stakeholder groups is necessary in successful planning NbS projects.
With this limited supply and growing demand, there is an urgent need to rapidly increase the implementation of high quality NbS[footnote 73]. One key consideration is the potential financial returns on NbS projects if they are funded through carbon finance[footnote 25]. For example, the Southeast Asian region is estimated to generate USD ~19.6 billion per year by protecting terrestrial (including peatland) forests at risk from deforestation, with the largest potential within Indonesia (USD 10.1 billion per year) and Malaysia (USD 2.6 billion per year)[footnote 25]. By prioritising areas with the highest returns in terms of climate mitigation, NbS can maximise its ability to draw from public and private sector investments.
NbS will be further maximised as governance arrangements within ASEAN countries allow and support the creation of carbon projects. Given the enormous potential of NbS investment and subsequent co-benefits to the ASEAN region, it is imperative for ASEAN member states to coordinate the carbon credit market to both capitalise on their fiscal returns and co-benefits, but to also adequately meet their Paris Climate Agreement NDC objectives. Nonetheless, for the effective implementation and coordination of the carbon market across the region, it is vital that the terms within Article 6 of the Paris Climate Agreement – which would govern how carbon credits are managed, accounted, and traded locally and internationally through national or commercial carbon projects – are resolved in the upcoming COP26 in Glasgow. Nature-based solutions will not be successful, however, if they are solely judged on investments and returns alone; all projects should safeguard and ensure equitable benefit sharing to local communities living within NbS landscapes. Indeed, it is vitally important to highlight, however, that while economic returns are a great outcome of NbS projects, the strength and true value of NbS come from social and ecological co-benefits.
VIII. Glossary
| Additionality | Additionality is an essential criterion for credits in all standards and schemes. A credit is considered additional if the emissions reduction that underpins the credit would not have occurred in the absence of the activity that generates the credit (the business-as-usual scenario)[footnote 74]. |
| Association of Southeast Asian Nations (ASEAN) | an economic union comprising 10 member states in Southeast Asia, which promotes intergovernmental cooperation and facilitates economic, political, security, military, educational, and sociocultural integration between its members and other countries in Asia[footnote 75]. |
| Blue Carbon | Ocean-based carbon sequestration (e.g. mangroves and seagrasses) |
| Carbon Stocks | The quantity of carbon in a “pool”, meaning a reservoir or system which has the capacity to accumulate or release carbon. |
| Carbon Verification | Verification is the process of evaluating calculations of the actual amount of greenhouse gas emissions that have been avoided or sequestered through implementation of the project. |
| Co-benefits | Co-benefits are a win- win strategy aimed at capturing both development and climate benefits in a single policy or measure[footnote 76]. With natural climate solutions, examples of co-benefits would include, inter alia, greater ecosystem resilience, increase in biodiversity, and local and regional economic opportunities. |
| Green Carbon | Terrestrial-based carbon sequestration (e.g. forests and agriculture) |
| Greenhouse gas (GHG) | A Greenhouse gas is any gas that has the property of absorbing infrared radiation (net heat energy) emitted from Earth’s surface and reradiating it back to Earth’s surface, thus contributing to the greenhouse effect. Carbon dioxide, methane, and water vapour are the most important greenhouse gases[footnote 77]. |
| IoT | Internet of Things |
| Nationally Determined Contributions (NDCs) | NDCs are at the heart of the Paris Agreement and the achievement of these long-term goals. NDCs embody efforts by each country to reduce national emissions and adapt to the impacts of climate change. The Paris Agreement (Article 4, paragraph 2) requires each Party to prepare, communicate and maintain successive NDC that it intends to achieve. Parties shall pursue domestic mitigation measures, with the aim of achieving the objectives of such contributions[footnote 78]. |
| Nature-based Climate Solutions | are the conservation, restoration, and/or improved land management actions that increase carbon storage and/or avoid GHG emissions across global forests, wetlands, grasslands, and agricultural lands[footnote 6]. |
| Net zero | Net zero emissions are achieved when anthropogenic emissions of GHG to the atmosphere are balanced by anthropogenic removals over a specified period. Where multiple greenhouse gases are involved, the quantification of net zero emissions depends on the climate metric chosen to compare emissions of different gases (such as global warming potential, global temperature change potential, and others, as well as the chosen time horizon)[footnote 79]. |
| Payments for Ecosystem Services (PES) | occur when the beneficiaries or users of an ecosystem service make payments to the providers of that service. In practice, this may take the form of a series of payments in return for receiving a flow of benefits or ecosystem services[footnote 80]. |
| REDD+ | REDD+ (Reducing Emissions from Deforestation and Forest Degradation): The aim of REDD+ is to encourage developing countries to contribute to climate change mitigation efforts by: i) reducing GHG emissions by slowing, halting and reversing forest loss and degradation; and ii) increasing removal of GHGs from the earth’s atmosphere through the conservation, management and expansion of forests[^81] (FAO, 2020). |
| Reforestation | The process of replanting trees in an area of degradation. |
| Restoration | The process of restoring degraded ecosystems. |
| Rewetting | Peatland rewetting is a low-cost, low-technology, high impact NbS to restore peatland forests. |
| Roundtable on Sustainable Palm Oil (RSPO) | A not-for-profit that unites stakeholders from the 7 sectors of the palm oil industry: oil palm producers, processors or traders, consumer goods manufacturers, retailers, banks/investors, and environmental and social non-governmental organisations (NGOs), to develop and implement global standards for sustainable palm oil[footnote 82]. |
| Smallholder Agriculture | Includes small farmers who own/control the land they farm and those who do not. Often, the term “outgrower” is used to refer to a smallholder who is in a dependent, managed relationship with an exporter[footnote 83]. |
IX. Acknowledgements
Each of the four vital and timely COP26 ASEAN policy reports would not have been possible without the support and coordination of the British High Commission and COP26 Universities Network. The nature-based solutions authors would especially like to thank the lead authors of the other three reports (Green Finance, Adaptation and Mitigation, and Energy Transition) for the ongoing collaboration and support throughout the process. For this report, we’d also like to acknowledge the additional contributions from Daniel A. Friess, Sofie Sjögersten, and Julia Drewer who were the lead authors for each of the carbon sections and provided invaluable feedback throughout the process. Finally, thank you to Tan Shi Xuan Stanley of the NUS Centre for Nature-based Climate Solutions for his editing and formatting of the final report.
| [^81]: FAO. Overview | REDD+ Reducing Emissions from Deforestation and Forest Degradation, Food and Agriculture Organization of the United Nations. http://www.fao.org/redd/overview/en/ (2020). |
-
Tollefson, J. IPCC says limiting global warming to 1.5 °C will require drastic action. Nature 562, 172–173 (2018). ↩ ↩2
-
WEF. The business and economic case for safeguarding nature. 111 https://www.weforum.org/reports/new-nature-economy-report-series/ (2020). ↩ ↩2
-
UNEP. Emissions Gap Report 2020. 128 http://www.unenvironment.org/emissions-gap-report-2020 (2020). ↩ ↩2
-
Prakash, A. Boiling Point: One of the most vulnerable regions to climate change is witnessing the world’s biggest jump in greenhouse gas emissions. 5 https://www.imf.org/external/pubs/ft/fandd/2018/09/pdf/southeast-asia-climate-change-and-greenhouse-gas-emissions-prakash.pdf (2018). ↩ ↩2
-
Griscom, B. W. et al. Natural climate solutions. PNAS 114, 11645–11650 (2017). ↩ ↩2 ↩3
-
Griscom, B. W. et al. National mitigation potential from natural climate solutions in the tropics. Philosophical Transactions of the Royal Society B: Biological Sciences 375, 20190126 (2020). ↩ ↩2 ↩3 ↩4
-
Raghav, S. et al. The Business Case for Natural Climate Solutions: Insights and Opportunities for Southeast Asia. /en/ideas/business-case-natural-climate-solutions-southeast-asia.html (2020). ↩ ↩2
-
IUCN. Guiding Principles and Recommendations for Responsible Operations in and around Key Biodiversity Areas (KBAs). 27 https://www.iucn.org/sites/dev/files/content/documents/draft2_guiding_principles_and_reco mmendations_for_businesses_in_and_around_kbas_2december.pdf (2016). ↩ ↩2
-
Dhandapani, S., Girkin, N. T., Evers, S., Ritz, K. & Sjögersten, S. Is Intercropping an Environmentally-Wise Alternative to Established Oil Palm Monoculture in Tropical Peatlands? Front. For. Glob. Change 3, 8 (2020). ↩
-
Mishra, S. et al. Degradation of Southeast Asian tropical peatlands and integrated strategies for their better management and restoration. Journal of Applied Ecology 58, 1370–1387 (2021). ↩ ↩2 ↩3
-
Verra. Welcome to the Verra Registry. https://registry.verra.org/ (2021). ↩ ↩2
-
Government of Malaysia. Malaysia Third Biennial Update Report to the UNFCCC. 285 https://unfccc.int/sites/default/files/resource/MALAYSIA_BUR3-UNFCCC_Submission.pdf (2020). ↩ ↩2 ↩3
-
Leifeld, J. & Menichetti, L. The underappreciated potential of peatlands in global climate change mitigation strategies /704/47/4113 /704/106/47 article. Nature Communications 9, (2018). ↩ ↩2 ↩3 ↩4
-
Evans, C. D. et al. Overriding water table control on managed peatland greenhouse gas emissions. Nature 593, 548–552 (2021). ↩ ↩2 ↩3
-
Miettinem, J., Shi, C. & Liew, S. C. Land cover distribution in the peatlands of Peninsular Malaysia, Sumatra and Borneo in 2015 with changes since 1990. Global Ecology and Conservation 6, 67–78 (2016). ↩ ↩2 ↩3 ↩4
-
Republic of Indonesia.WIJEDASA, L. S. PEAT SWAMP FOREST CONSERVATION IN SOUTHEAST ASIA. (National University of Singapore, 2019). ↩ ↩2
-
Cooper, H. V. et al. Greenhouse gas emissions resulting from conversion of peat swamp forest to oil palm plantation. Nature Communications 11, 407 (2020). ↩
-
Dhandapani, S., Ritz, K., Evers, S., Yule, C. M. & Sjögersten, S. Are secondary forests second-rate? Comparing peatland greenhouse gas emissions, chemical and microbial community properties between primary and secondary forests in Peninsular Malaysia. Science of The Total Environment 655, 220–231 (2019). ↩
-
Ishikura, K., Darung, U., Inoue, T. & Hatano, R. Variation in Soil Properties Regulate Greenhouse Gas Fluxes and Global Warming Potential in Three Land Use Types on Tropical Peat. Atmosphere 9, 465 (2018). ↩
-
Oktarita, S., Hergoualc’h, K., Anwar, S. & Verchot, L. V. Substantial N2O emissions from peat decomposition and N fertilization in an oil palm plantation exacerbated by hotspots. Environmental Research Letters 12, 104007 (2017). ↩
-
Jauhiainen, J., Limin, S., Silvennoinen, H. & Vasander, H. Carbon dioxide and methane fluxes in drained tropical peat before and after hhydrological restoration. Ecology 89, 3503– 3514 (2008). ↩
-
Republic of Indonesia. Indonesia Second Biennial Update Report Under the United Nations Framework Convention on Climate Change. 167 https://unfccc.int/sites/default/files/resource/Indonesia-2nd_BUR.pdf (2018). ↩
-
Hirano, T., Jauhiainen, J., Inoue, T. & Takahashi, H. Controls on the Carbon Balance of Tropical Peatlands. Ecosystems 12, 873–887 (2009). ↩
-
Jauhiainen, J. et al. Nitrous oxide fluxes from tropical peat with different disturbance history and management. Biogeosciences 9, 1337–1350 (2012). ↩ ↩2 ↩3
-
Wahyunto, W., Supriatna, W. & Agus, F. LAND USE CHANGE AND RECOMMENDATION FOR SUSTAINABLE DEVELOPMENT OF PEATLAND FOR AGRICULTURE: Case Study at Kubu Raya and Pontianak Districts, West Kalimantan. Indonesian Journal of Agricultural Science 11, 32–40 (2010). ↩
-
Harrison, M. E. et al. Tropical forest and peatland conservation in Indonesia: Challenges and directions. People and Nature 2, 4–28 (2020). ↩ ↩2 ↩3 ↩4 ↩5
-
RSPO Manual on Best Management Practices (BMPs) for Management and Rehabilitation of Natural Vegetation Associated with Oil Palm Cultivation on Peat. 81 (2012). ↩
-
Gumbricht, T. et al. An expert system model for mapping tropical wetlands and peatlands reveals South America as the largest contributor. Global Change Biology 23, 3581–3599 (2017). ↩
-
Hooijer, A. et al. Current and future CO 2 emissions from drained peatlands in Southeast Asia. Biogeosciences 7, 1505–1514 (2010). ↩
-
Enrici, A. M. & Hubacek, K. Challenges for REDD+ in Indonesia: A case study of three project sites. Ecology and Society 23, (2018). ↩
-
Jong, H. N. Indonesia to receive $56m payment from Norway for reducing deforestation. Mongabay https://news.mongabay.com/2020/05/indonesia-norway-redd-payment-deforestation-carbon-emission-climate-change/#:~:text=Indonesia will be the latest, from deforestation and forest degradation. (2020). ↩
-
Sari, A. P., Dohong, A. & Wardhana, B. Innovative financing for peatland restoration in Indonesia. Springer Climate 247–264 (2021) doi:10.1007/978-3-030-55536-8_12. ↩ ↩2
-
Hansson, A. & Dargusch, P. An Estimate of the Financial Cost of Peatland Restoration in Indonesia. Case Studies in the Environment 2, 1–8 (2018). ↩
-
Varkkey, H. & O’Reilly, P. Socio-Political Responses Towards Transboundary Haze The Oil Palm in Malaysia’s Discourse. in Southeast Asia and Environmental Sustainability in Context (ed. Kukreja, S.) (2019). ↩
-
Ministry of Investment. OSS - Sistem Perizinan Berusaha Terintegrasi Secara Elektronik. https://oss.go.id/en (2021). ↩
-
Pemerintah Pusat. Peraturan Pemerintah (PP) tentang Perlindungan Dan Pengelolaan Ekosistem Gambut. 71 37 (2014). ↩
-
Taillardat, P., Friess, D. A. & Lupascu, M. Mangrove blue carbon strategies for climate change mitigation are most effective at the national scale. Biology Letters 14, 6 (2018). ↩ ↩2 ↩3
-
Donato, D. C. et al. Mangroves among the most carbon-rich forests in the tropics. Nature Geosci 4, 293–297 (2011). ↩
-
Goldberg, L., Lagomasino, D., Thomas, N. & Fatoyinbo, T. Global declines in human-driven mangrove loss. Global Change Biology 26, 5844–5855 (2020). ↩ ↩2
-
Richards, D. R. & Friess, D. A. Rates and drivers of mangrove deforestation in Southeast Asia, 2000–2012. PNAS 113, 344–349 (2016). ↩
-
Fortes, M. et al. Seagrass in Southeast Asia: a review of status and knowledge gaps, and a road map for conservation. undefined (2018). ↩
-
Stankovic, M. et al. Quantification of blue carbon in seagrass ecosystems of Southeast Asia and their potential for climate change mitigation. The Science of the total environment 783, 48 (2021). ↩ ↩2 ↩3 ↩4
-
Herr, D. & Landis, E. Coastal blue carbon ecosystems: opportunities for Nationally Determined Contributions. Policy Brief. 28 https://portals.iucn.org/library/sites/library/files/documents/Rep-2016-026-En.pdf (2016). ↩
-
Hamilton, S. E. & Friess, D. A. Global carbon stocks and potential emissions due to mangrove deforestation from 2000 to 2012. Nature Clim Change 8, 240–244 (2018). ↩
-
Adame, M. F. et al. Future carbon emissions from global mangrove forest loss. Global Change Biology 27, 2856–2866 (2021). ↩
-
Zeng, Y., Friess, D. A., Sarira, T. V., Siman, K. & Koh, L. P. Global potential and limits of mangrove blue carbon for climate change mitigation. Current Biology 31, 1737-1743.e3 (2021). ↩ ↩2
-
Worthington, T. & Spalding, M. Mangrove Restoration Potential: A global map highlighting a critical opportunity. 36 https://www.repository.cam.ac.uk/bitstream/handle/1810/292000/MANGROVE-TNC-REPORT-FINAL.31.10.LOWSINGLES.pdf?sequence=1&isAllowed=y (2018). ↩
-
UNEP. Out of the Blue: The Value of Seagrasses to the Environment and to People. 96 http://www.unep.org/resources/report/out-blue-value-seagrasses-environment-and-people (2020). ↩
-
UNEP. Opportunities and Challenges for Community-Based Seagrass Conservation. 46 Mhttp://www.unep.org/resources/report/opportunities-and-challenges-community-based-seagrass-conservation> (2020). ↩
-
Nguyen, H.-H. The relation of coastal mangrove changes and adjacent land-use: A review in Southeast Asia and Kien Giang, Vietnam. Ocean & Coastal Management 90, 1–10 (2014). ↩
-
ASEAN Centre for Biodiversity. Protected Area Gap Analysis in the ASEAN Region. http://chm.aseanbiodiversity.org/index.php?option=com_content&view=article&id=145&Itemi d=231 (2020). ↩
-
Spalding, M. & Parrett, C. L. Global patterns in mangrove recreation and tourism. Marine Policy 110, 103540 (2019). ↩
-
Brander, L. M. et al. Ecosystem service values for mangroves in Southeast Asia: A meta-analysis and value transfer application. Ecosystem Services 1, 62–69 (2012). ↩
-
Forests Trends Ecosystem Marketplace. Ecosystem Marketplace Insights Brief: Voluntary Carbon and the Post-Pandemic Recovery. 16 https://app.hubspot.com/documents/3298623/view/88656172?accessId=b01f32&__hsfp=1537623729&__hssc=251652889.1.1624869992888&__hstc=251652889.d322ea2ccac3bd44 efe50683b4fa3a98.1624869992887.1624869992887.1624869992887.1 (2019). ↩ ↩2
-
The World Bank. Multilateral Development Banks’ Harmonized Framework for Additionality in Private Sector Operations. 19 http://documents1.worldbank.org/curated/en/839481540790602457/pdf/131398-WP-MDBs-Harmonized-Framework-for-Additionality-in-Private-Sector-Operations-PUBLIC.pdf (2018). ↩
-
CFR. What Is ASEAN? Council on Foreign Relations https://www.cfr.org/backgrounder/what-asean (2021). ↩
-
Miyatsuka, A. & Zusman, E. Fact Sheet No.1 What are Co-benefits? (2009). ↩
-
Mann, M. Britannica. Greenhouse Gas https://www.britannica.com/science/greenhouse-gas (2020). ↩
-
United Nations Framework Convention on Climate Change. Nationally Determined Contributions (NDCs) UNFCCC. https://unfccc.int/process-and-meetings/the-paris-agreement/the-paris-agreement/nationally-determined-contributions-ndcs (2020). ↩
-
IPCC. IPCC, 2018: Summary for Policymakers. https://www.ipcc.ch/sr15/ (2018). ↩
-
Fripp, E. Payments for Ecosystem Services (PES). 36 https://www.cifor.org/publications/pdf_files/Books/BFripp1401.pdf (2014). ↩
-
RSPO. About. https://rspo.org/about (2021). ↩
-
WIEGO. Smallholder Farmers, WIEGO. https://www.wiego.org/informal-economy/occupational-groups/smallholder-farmers (2021). ↩