UK House Price Index Wales: April 2016
Published 14 June 2016
Applies to Wales

© Crown copyright 2016
This publication is licensed under the terms of the Open Government Licence v3.0 except where otherwise stated. To view this licence, visit nationalarchives.gov.uk/doc/open-government-licence/version/3 or write to the Information Policy Team, The National Archives, Kew, London TW9 4DU, or email: psi@nationalarchives.gov.uk.
Where we have identified any third party copyright information you will need to obtain permission from the copyright holders concerned.
This publication is available at https://www.gov.uk/government/statistics/uk-house-price-index-wales-april-2016/uk-house-price-index-wales-april-2016
1. Headline statistics
For April 2016:
- the average price of a property in Wales was £139,385
- the annual price change of a property for Wales was 1.7%
- the monthly price change of a property for Wales was -1.9%
- the index figure for Wales was 102.4 (January 2015 = 100)
2. Price change
2.1 Annual price change
Annual price change for Wales over the past 5 years
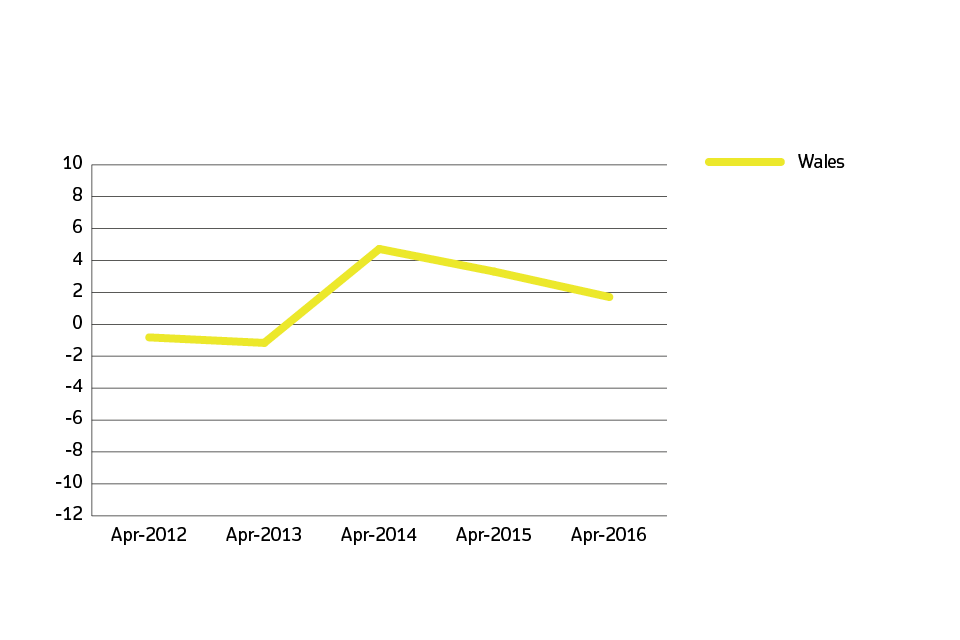
Annual price change for Wales over the past 5 years
Annual price change by local authority for Wales
| Local authorities | April 2016 | April 2015 | Difference |
|---|---|---|---|
| Blaenau Gwent | £77,629 | £69,721 | 11.3% |
| Bridgend | £136,051 | £125,201 | 8.7% |
| Caerphilly | £111,890 | £110,436 | 1.3% |
| Cardiff | £189,405 | £176,134 | 7.5% |
| Carmarthenshire | £126,251 | £125,562 | 0.5% |
| Ceredigion | £160,082 | £172,920 | -7.4% |
| Conwy | £145,441 | £140,015 | 3.9% |
| Denbighshire | £139,895 | £137,494 | 1.7% |
| Flintshire | £152,284 | £146,605 | 3.9% |
| Gwynedd | £143,668 | £136,549 | 5.2% |
| Isle of Anglesey | £159,891 | £157,334 | 1.6% |
| Merthyr Tydfil | £82,217 | £92,457 | -11.1% |
| Monmouthshire | £219,381 | £206,060 | 6.5% |
| Neath Port Talbot | £105,042 | £99,064 | 6.0% |
| Newport | £142,592 | £135,742 | 5.0% |
| Pembrokeshire | £159,190 | £159,445 | -0.2% |
| Powys | £166,655 | £156,915 | 6.2% |
| Rhondda Cynon Taf | £99,423 | £93,360 | 6.5% |
| Swansea | £134,152 | £127,658 | 5.1% |
| Torfaen | £123,781 | £120,584 | 2.7% |
| Vale of Glamorgan | £193,473 | £194,987 | -0.8% |
| Wrexham | £144,115 | £138,013 | 4.4% |
| Wales | £139,385 | £137,039 | 1.7% |
Average price by local authority for Wales
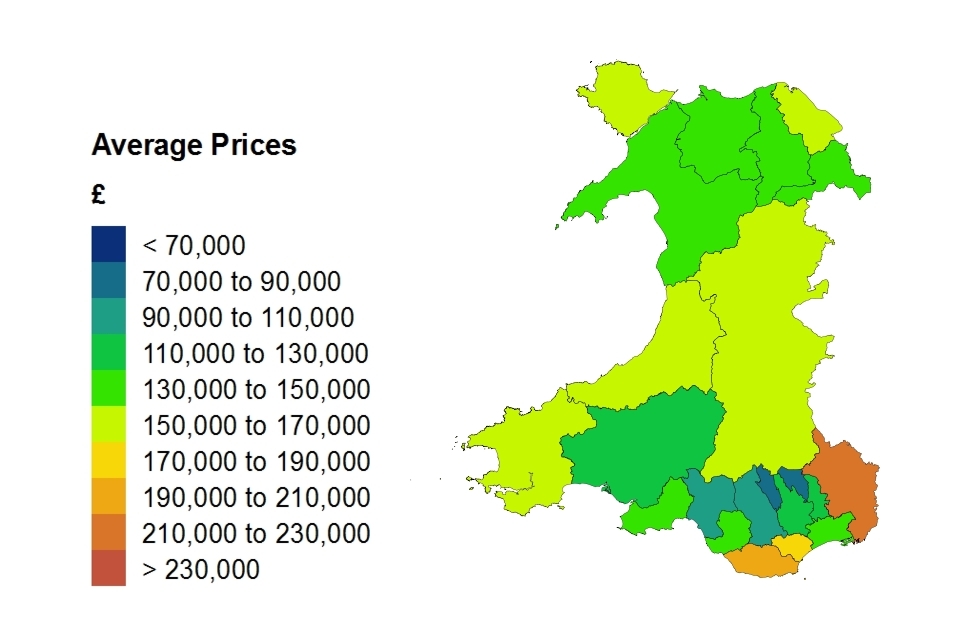
Average price by local authority in Wales
2.2 Average price change by property type
Average price change by property type for Wales
| Property type | April 2016 | April 2015 | Difference |
|---|---|---|---|
| Detached | £207,034 | £206,244 | 0.4% |
| Semi-detached | £135,193 | £130,863 | 3.3% |
| Terraced | £108,873 | £106,913 | 1.8% |
| Flat or maisonette | £99,265 | £98,838 | 0.4% |
| All | £139,385 | £137,039 | 1.7% |
3. Sales volumes
Due to a period of 2 to 8 weeks between completion and registration of sales, volume figures for the most recent two months are not yet complete, so they are not included in the report.
3.1 Sales volumes by local authority
Sales volumes for Wales by Local Authority: February 2016
| Local authorities | Sales volume |
|---|---|
| Blaenau Gwent | 40 |
| Bridgend | 146 |
| Caerphilly | 143 |
| Cardiff | 365 |
| Carmarthenshire | 153 |
| Ceredigion | 55 |
| Conwy | 137 |
| Denbighshire | 88 |
| Flintshire | 138 |
| Gwynedd | 108 |
| Isle of Anglesey | 71 |
| Merthyr Tydfil | 47 |
| Monmouthshire | 94 |
| Neath Port Talbot | 107 |
| Newport | 153 |
| Pembrokeshire | 102 |
| Powys | 119 |
| Rhondda Cynon Taf | 202 |
| Swansea | 223 |
| Torfaen | 73 |
| Vale of Glamorgan | 150 |
| Wrexham | 82 |
| Wales | 2,796 |
3.2 Sales volumes: February 2016
Sales volumes for Wales over the past 5 years
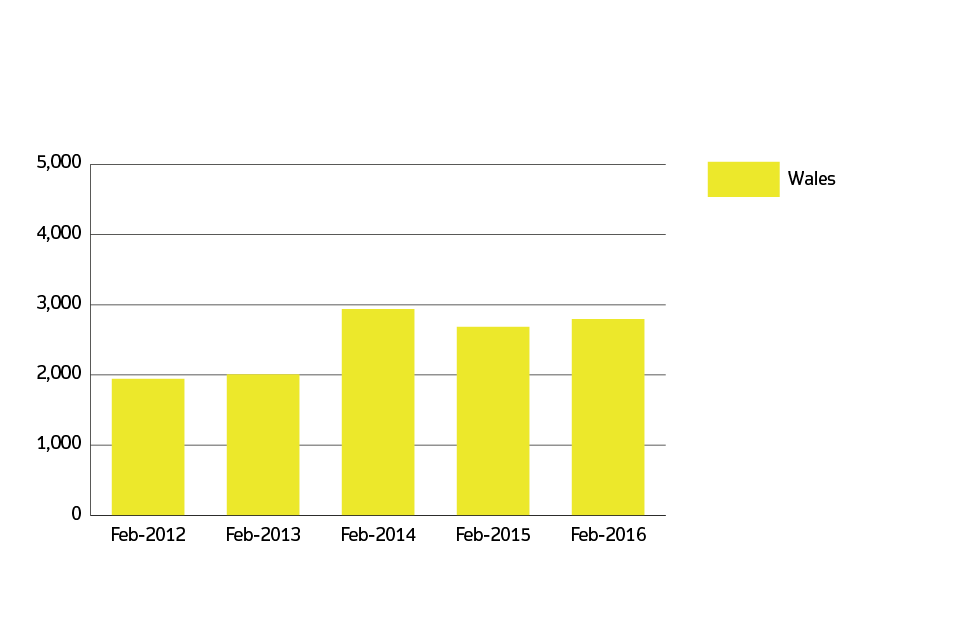
Annual number of sales volumes for Wales over the past 5 years
4. Building status
New build and existing resold property for Wales
| Property status | Average price | Monthly change | Annual change |
|---|---|---|---|
| New build | £180,549 | 3.0% | 4.0% |
| Existing resold property | £136,924 | -2.3% | 1.6% |
5. Buyer status
First time buyer and former owner occupier for Wales
| Type of buyer | Average price | Monthly change | Annual change |
|---|---|---|---|
| First time buyer | £120,779 | -1.7% | 1.8% |
| Former owner occupier | £161,004 | -2.2% | 1.6% |
6. Funding status
Cash and mortgage indicator for Wales
| Funding status | Average price | Monthly change | Annual change |
|---|---|---|---|
| Cash | £135,566 | -2.7% | 1.2% |
| Mortgage | £141,655 | -1.5% | 2.0% |
7. About the UK House Price Index
The UK House Price Index (UK HPI) is calculated by the Office for National Statistics and Land & Property Services Northern Ireland. Find out about the methodology used to create the UK HPI.
Data for the UK House Price Index is provided by Land Registry, Registers of Scotland, Land & Property Services Northern Ireland and the Valuation Office Agency.
Find out more about the UK House Price Index.
8. Access the data
Download the data as CSV files or access it with our UK HPI tool.
9. Contact
Eileen Morrison, Data Services Team Leader, HM Land Registry
Email eileen.morrison@landregistry.gov.uk
Telephone 0300 006 5288