UK House Price Index summary: October 2017
Published 12 December 2017

© Crown copyright 2017
This publication is licensed under the terms of the Open Government Licence v3.0 except where otherwise stated. To view this licence, visit nationalarchives.gov.uk/doc/open-government-licence/version/3 or write to the Information Policy Team, The National Archives, Kew, London TW9 4DU, or email: psi@nationalarchives.gov.uk.
Where we have identified any third party copyright information you will need to obtain permission from the copyright holders concerned.
This publication is available at https://www.gov.uk/government/statistics/uk-house-price-index-summary-october-2017/uk-house-price-index-summary-october-2017
1. Headline statistics for October 2017
the average price of a property in the UK was
£223,807
the annual price change for a property in the UK was
4.5%
the monthly price change for a property in the UK was
-0.5%
the monthly index figure (January 2015 = 100) for the UK was
117.4
Estimates for the most recent months are provisional and are likely to be updated as more data is incorporated into the index. Read the revision policies.
2. Economic statement
UK house prices grew by 4.5% in the year to October 2017, experiencing a 0.3 percentage point decrease from the previous month.
In terms of housing demand the Royal Institution of Chartered Surveyors’ (RICS) Residential Market Survey for October 2017 reported that the headline near term price expectations series slipped to -11%, from -8% in September, and has now been negative in each of the last three months. New buyer enquiries continue to signal a softening in demand, with the net national balance remaining at -20%.
The UK Property Transaction Statistics (PDF, 824KB) showed that the number of seasonally adjusted transactions on residential properties with a value of £40,000 or greater has increased by 9.2% in the year to October 2017. Between September 2017 and October 2017, property transactions increased by 1.7%.
The Bank of England’s Agents’ summary of business conditions (PDF, 442KB) reported that housing market demand has strengthened overall but with a divergence between the regions, as there are signs of excess supply in London and the South East but excess demand in the majority of other UK regions.
Looking more closely at regional levels of the UK, the largest annual growth was in the East Midlands at 7.0%, up from 6.3% in September 2017. It was followed by the South West, which showed annual growth of 6.7%. The slowest annual growth was in London at 2.1%, down from 2.9% in September 2017. This is the 11th consecutive month where the growth in London house prices has remained below the UK average. The second slowest annual growth was in the North East at 2.4%.
On the supply side, RICS reported a renewed deterioration in the flow of fresh listings coming to market, at a net balance of -14%, following a two month period of stability.
3. Price changes
3.1 Annual price change
Annual price change for UK by country over the past five years
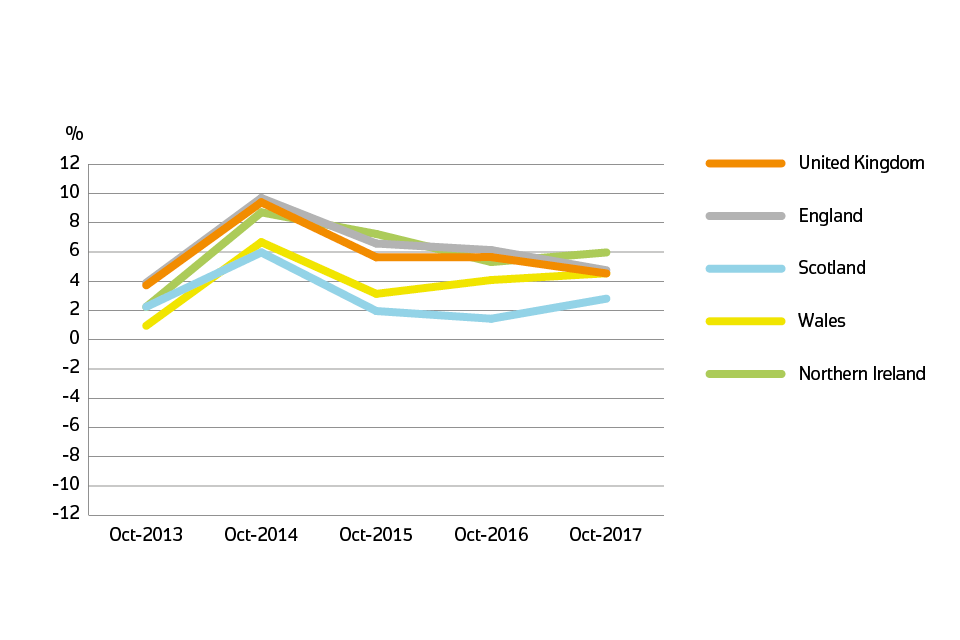
Annual price change for UK by country over past five years
Average house prices in the UK have increased by 4.5% in the year to October 2017 (down from 4.8% in the year to September 2017).
The main contribution to the increase in UK house prices came from England, where house prices increased by 4.7% over the year to October 2017.
Wales saw house prices increase by 4.5% over the last 12 months.
In Scotland, the average price increased by 2.8% over the year.
The average price in Northern Ireland increased by 6.0% over the year to quarter 3 (July to September) 2017.
3.2 Average price by country and government office region
Price, monthly change and annual change by country and government office region
| Country and government office region | Price | Monthly change | Annual change |
|---|---|---|---|
| England | £240,860 | -0.6% | 4.7% |
| Northern Ireland (Quarter 3 - 2017) | £132,169 | 3.0% | 6.0% |
| Scotland | £143,544 | -0.7% | 2.8% |
| Wales | £153,316 | 0.8% | 4.5% |
| East Midlands | £184,544 | 0.2% | 7.0% |
| East of England | £289,168 | 0.1% | 6.1% |
| London | £481,102 | -0.9% | 2.1% |
| North East | £127,224 | -0.1% | 2.4% |
| North West | £154,056 | -2.0% | 3.9% |
| South East | £322,311 | -0.5% | 4.6% |
| South West | £251,376 | 0.2% | 6.7% |
| West Midlands Region | £186,351 | -1.1% | 5.2% |
| Yorkshire and The Humber | £155,281 | -1.1% | 3.3% |
Price changes by country and government office region
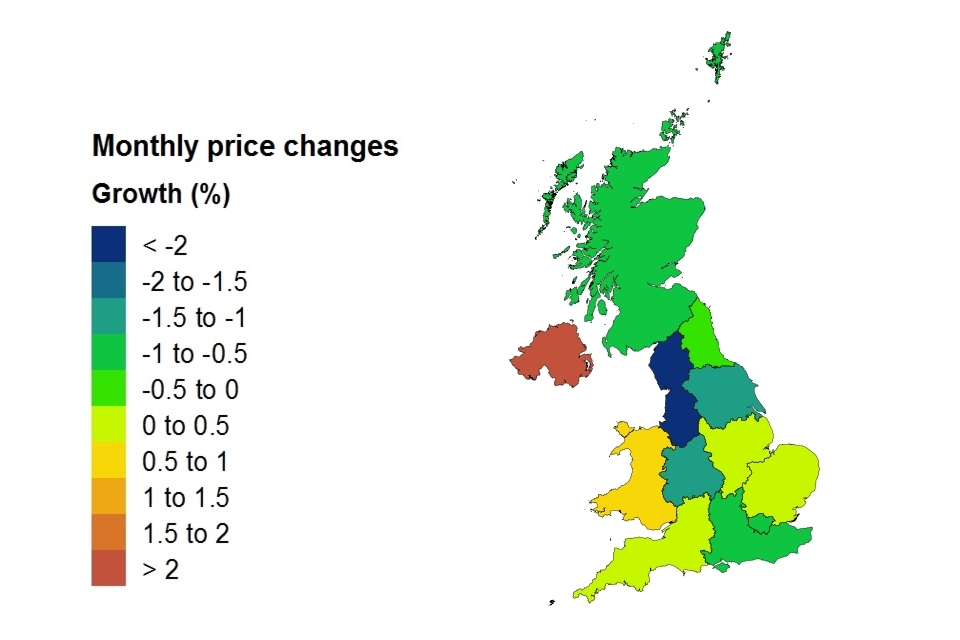
Price changes by country and government office region
3.3 Average price by property type
Average monthly price by property type
| Property type | October 2017 | October 2016 | Difference |
|---|---|---|---|
| Detached | £340,996 | £323,441 | 5.4% |
| Semi-detached | £211,014 | £200,703 | 5.1% |
| Terraced | £179,327 | £172,619 | 3.9% |
| Flat or maisonette | £201,527 | £194,540 | 3.6% |
| All | £223,807 | £214,107 | 4.5% |
4. Sales volumes
Due to a period of 2 to 8 weeks between completion and registration of sales, volume figures for the most recent two months are not yet at a reliable level for reporting, so they are not included in the report.
Sales volume data is also available by property status (new build and existing property) and funding status (cash and mortgage) in our downloadable data tables. Transactions involving the creation of a new register, such as new builds, are more complex and require more time to process. Read Revisions to the UK HPI data for more information.
4.1 Sales volumes
Number of sales by country
| Country | August 2017 | August 2016 | Difference |
|---|---|---|---|
| England | 70,117 | 79,655 | -12.0% |
| Northern Ireland (Quarter 3 - 2017) | 5,453 | 5,968 | -8.6% |
| Scotland | 9,282 | 8,641 | 7.4% |
| Wales | 3,982 | 4,122 | -3.4% |
4.2 Sales volumes for the UK over the past 5 years
Sales volumes for 2013 to 2017 by country: August 2017
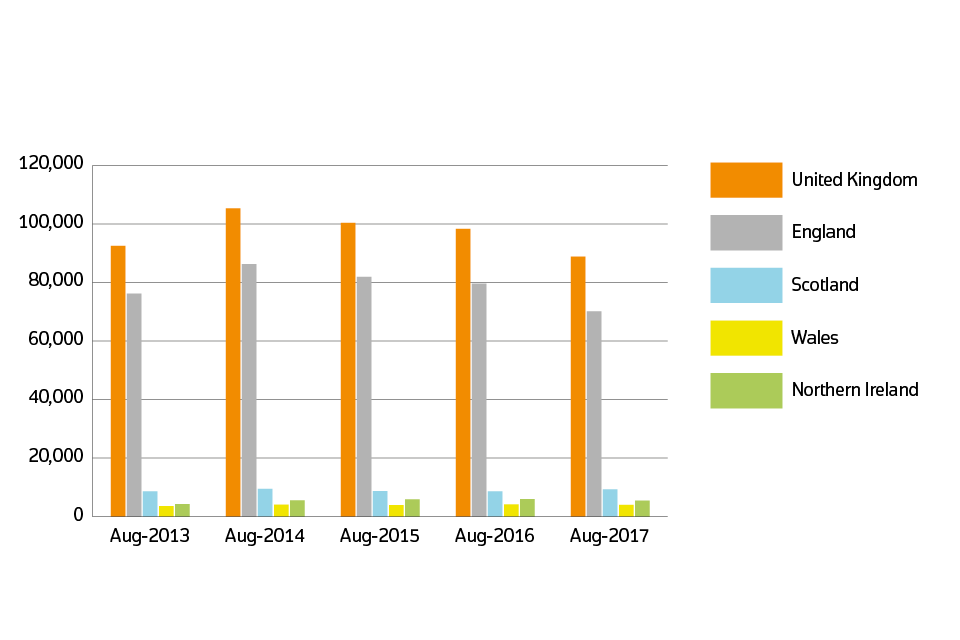
Sales volumes for 2013 to 2017 by country: August 2017
In August 2017 the number of property transactions completed in the UK decreased by 9.7% when compared to August 2016. Compared with July 2017, the number of property transactions completed in the UK increased by 3.0%. The estimate for August 2017 is calculated based on around 90% of the final registered transactions. It is likely that the number of property transactions for August 2017 will increase as more transactions are incorporated into the index. See our Revisions Policy for more information.
5. Property status for UK
New build and existing resold property
The first estimate for new build is based on a small sample which can cause volatility in this initial estimate.
| Property status | Average price August 2017 | Monthly change | Annual change |
|---|---|---|---|
| New build | £288,931 | -0.5% | 12.3% |
| Existing resold property | £221,972 | 0.5% | 4.6% |
Note: for this release, amendments have been made to our estimation model when calculating our provisional estimate. Find out further information and the impact of this change in Improvement to the calculation of provisional estimates within the UK HPI.
6. Buyer status for Great Britain
First time buyer and former owner occupier
For Great Britain only, Northern Ireland data is not available for buyer status.
| Type of buyer | Average price October 2017 | Monthly change | Annual change |
|---|---|---|---|
| First time buyer | £188,173 | -0.7% | 4.2% |
| Former owner occupier | £260,223 | -0.4% | 4.9% |
7. Funding status for Great Britain
Cash and mortgage
For Great Britain only, Northern Ireland data is not available for funding status.
| Funding status | Average price October 2017 | Monthly change | Annual change |
|---|---|---|---|
| Cash | £213,337 | -0.5% | 4.7% |
| Mortgage | £233,337 | -0.6% | 4.5% |
8. Access the data
Download the data as CSV files or access it with our UK HPI tool.
Data revisions
View any revisions to previously published data in the data downloads or find out more about revisions in our guidance About the UK HPI.
9. About the UK House Price Index
The UK House Price Index (UK HPI) is calculated by the Office for National Statistics and Land & Property Services Northern Ireland. Find out about the methodology used to create the UK HPI.
Data for the UK House Price Index is provided by HM Land Registry, Registers of Scotland, The Land & Property Services/Northern Ireland Statistics & Research Agency and the Valuation Office Agency.
Find out more about the UK House Price Index.
10. Contact
Eileen Morrison, Data Services Team Leader, HM Land Registry
Email eileen.morrison@landregistry.gov.uk
Telephone 0300 006 5288
Ian Boreham, Head of Housing Market Indices, Office for National Statistics
Email ian.boreham@ons.gov.uk
Telephone 01633 456228
Ciara Cunningham, Statistician for the Northern Ireland HPI
Email ciara.cunningham@finance-ni.gov.uk
Telephone 028 90 336035
Garreth Jones, Land & Property Data Team, Registers of Scotland
Email Garreth.Jones@ros.gov.uk
Telephone 0131 378 4114