UK House Price Index summary: February 2018
Published 18 April 2018

© Crown copyright 2018
This publication is licensed under the terms of the Open Government Licence v3.0 except where otherwise stated. To view this licence, visit nationalarchives.gov.uk/doc/open-government-licence/version/3 or write to the Information Policy Team, The National Archives, Kew, London TW9 4DU, or email: psi@nationalarchives.gov.uk.
Where we have identified any third party copyright information you will need to obtain permission from the copyright holders concerned.
This publication is available at https://www.gov.uk/government/statistics/uk-house-price-index-summary-february-2018/uk-house-price-index-summary-february-2018
1. Headline statistics for February 2018
the average price of a property in the UK was
£225,047
the annual price change for a property in the UK was
4.4%
the monthly price change for a property in the UK was
-0.1%
the monthly index figure (January 2015 = 100) for the UK was
118.0
Estimates for the most recent months are provisional and are likely to be updated as more data is incorporated into the index. Read Revisions to the UK HPI data.
Next publication of UK HPI
The March 2018 UK HPI will be published at 9.30am on Wednesday 23 May 2018. See the calendar of release dates.
2. Economic statement
UK house prices grew by 4.4% in the year to February 2018, down from 4.7% in the year to January 2018.
Looking at the demand for housing, the Royal Institution of Chartered Surveyors’ (RICS) UK Residential Market Survey for February 2018 reported their new buyer enquiries series fell for the 11th consecutive month, with a net balance of -16% of respondents reporting a fall in demand. Responders reported a lack of stock in the second-hand market, limiting choice and depressing demand. This was corroborated by the Bank of England’s Agents’ summary of business conditions (PDF, 876KB)which also reported that demand for new-build property was robust, supported by the Help to Buy scheme.
The UK Property Transaction Statistics for February 2018 showed that on a seasonally adjusted basis, the number of transactions on residential properties with a value of £40,000 or greater is 0.7% lower compared to a year ago. Between January 2018 and February 2018, transactions decreased by 0.3%.
The Bank of England’s Money and Credit release showed that on a seasonally adjusted basis, 63,910 mortgages were approved in February 2018. This is a decrease of 3,200 from the previous month and is below the 6-month average of 65,162. Mortgage approvals are seen to be a leading indicator of transactions volumes.
On the supply side, RICS reported the net balance for their new instructions series fell again. Average stocks per responding estate agent have fallen to a record low. Both sales and price expectations continue to be flat in the near term, although there is greater optimism in the longer-term outlook.
Looking at the regional level, the West Midlands showed the highest annual growth, with prices increasing by 7.3% in the year to February 2018. The lowest annual growth was in London, where prices decreased by 1.0% over the year. This is the lowest annual growth in London since September 2009 when it was negative 3.2%. London has shown a general slowdown in its annual growth rate since mid 2016.
3. Price changes
3.1 Annual price change
Annual price change for UK by country over the past 5 years
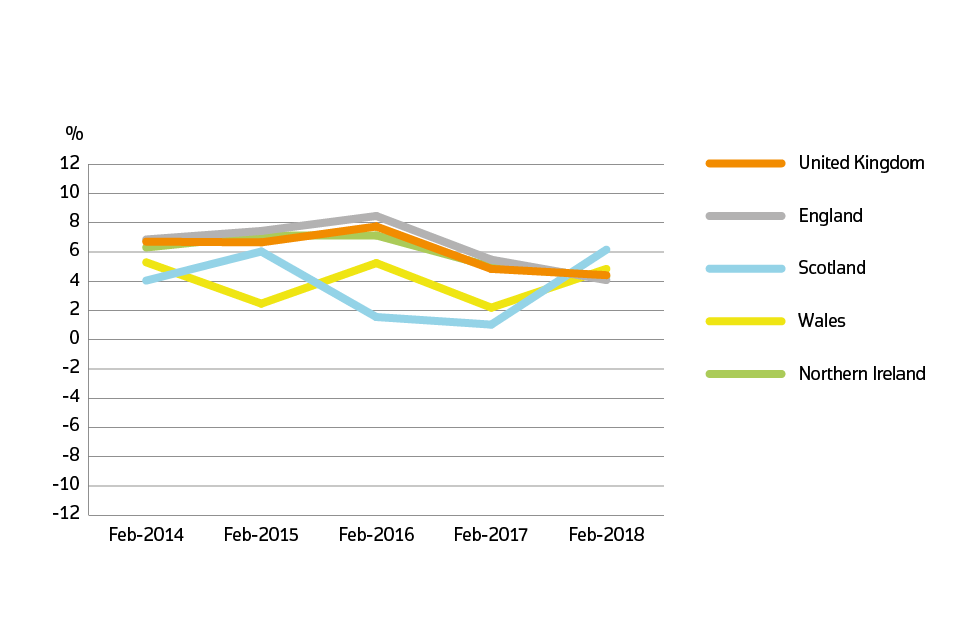
Annual price change for UK by country over the past 5 years
Download this chart’s data (CSV, 1KB)
Average house prices in the UK have increased by 4.4% in the year to February 2018 (down from 4.7% in the year to January 2018).
At the country level, the largest annual price growth was recorded in Scotland, where house prices increased by 6.2% over the year to February 2018.
Wales saw house prices increase by 4.8% over the last 12 months.
In England, the average price increased by 4.1% over the year.
The average price in Northern Ireland increased by 4.3% over the year to quarter 4 (October to December) 2017.
3.2 Average price by country and government office region
Price, monthly change and annual change by country and government office region
| Country and government office region | Price | Monthly change | Annual change |
|---|---|---|---|
| England | £242,176 | 0.2% | 4.1% |
| Northern Ireland (Quarter 4 - 2017) | £130,482 | 1.0% | 4.3% |
| Scotland | £144,377 | -2.7% | 6.2% |
| Wales | £152,891 | -0.4% | 4.8% |
| East Midlands | £186,071 | 0.5% | 6.3% |
| East of England | £288,468 | -0.4% | 4.0% |
| London | £471,986 | -2.1% | -1.0% |
| North East | £128,218 | 3.1% | 3.3% |
| North West | £158,152 | 1.6% | 4.8% |
| South East | £322,489 | -0.1% | 4.0% |
| South West | £250,816 | -1.1% | 4.9% |
| West Midlands Region | £192,648 | 2.2% | 7.3% |
| Yorkshire and The Humber | £155,385 | -0.1% | 3.1% |
Download this table’s data (CSV, 1KB)
Price changes by country and government office region
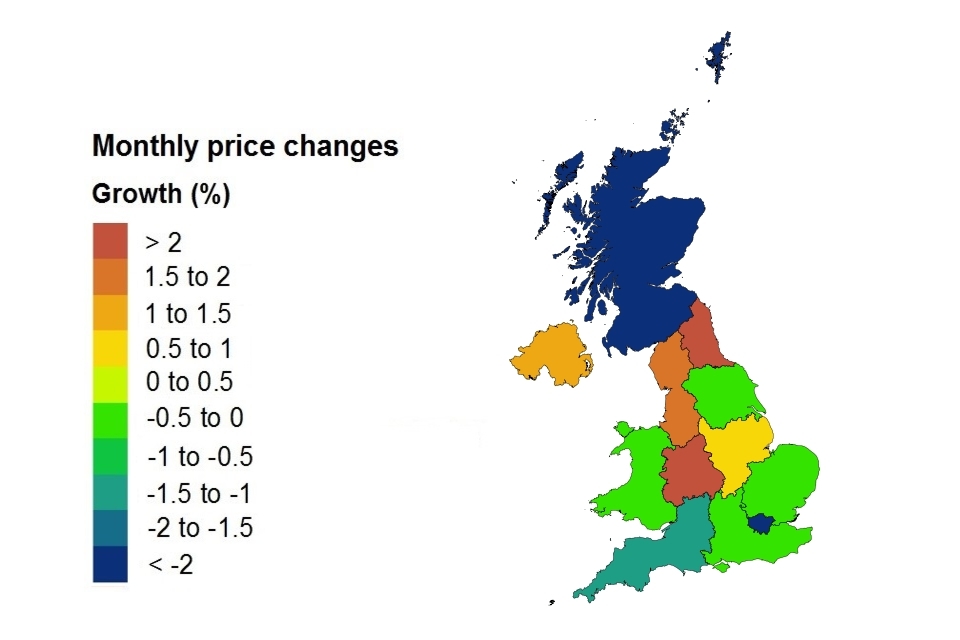
Price changes by country and government office region
On a seasonally adjusted basis, average house prices in the UK increased by 0.2% between February 2018 and January 2018, compared with an increase of 0.5% in average prices during the same period a year earlier.
Note that the Northern Ireland figure represents a three-month change and is not comparable with the other regions and countries.
3.3 Average price by property type
Average monthly price by property type
| Property type | February 2018 | February 2017 | Difference |
|---|---|---|---|
| Detached | £342,954 | £324,883 | 5.6% |
| Semi-detached | £211,079 | £200,801 | 5.1% |
| Terraced | £181,833 | £173,585 | 4.8% |
| Flat or maisonette | £201,657 | £198,120 | 1.8% |
| All | £225,047 | £215,539 | 4.4% |
Download this table’s data (CSV, 1KB)
4. Sales volumes
Due to a period of 2 to 8 weeks between completion and registration of sales, volume figures for the most recent two months are not yet at a reliable level for reporting, so they are not included in the report.
Sales volume data is also available by property status (new build and existing property) and funding status (cash and mortgage) in our downloadable data tables. Transactions involving the creation of a new register, such as new builds, are more complex and require more time to process. Read Revisions to the UK HPI data for more information.
4.1 Sales volumes
Number of sales volumes by country
| Country | December 2017 | December 2016 | Difference |
|---|---|---|---|
| England | 62,697 | 79,605 | -21.2% |
| Northern Ireland (Quarter 4 - 2017) | 5,501 | 6,033 | -8.8% |
| Scotland | 8,052 | 8,488 | -5.1% |
| Wales | 3,927 | 4,581 | -14.3% |
Download this table’s data (CSV, 1KB)
4.2 Sales volumes for the UK over the past 5 years
Sales volumes for 2013 to 2017 by country: December
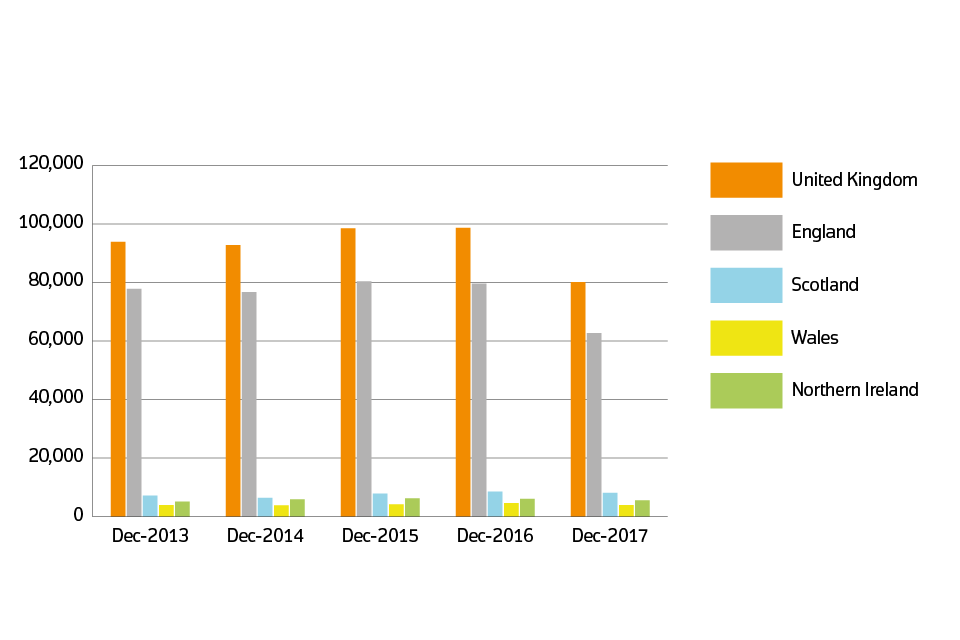
Sales volumes for 2013 to 2017 by country
Download this table’s data (CSV, 1KB)
In December 2017, the number of property transactions completed in the UK decreased by 18.8% when compared to December 2016. Compared to November 2017, the number of property transactions completed in the UK decreased by 9.1%.
The estimate for December 2017 is calculated based on around 90% of the final registered transactions. It is likely that the number of property transactions for December 2017 will increase as more transactions are incorporated into the index. See our revisions policy for more information.
5. Property status for UK
New build and existing resold property
| Property Status | Average price December 2017 | Monthly change | Annual change |
|---|---|---|---|
| New build | £286,985 | 2.7% | 9.1% |
| Existing resold property | £221,850 | 0.4% | 4.5% |
Download this table’s data (CSV, 1KB)
Note: since October 2017 release, amendments have been made to our estimation model when calculating our provisional estimate. Find out further information and the impact of this change in Improvement to the calculation of provisional estimates within the UK HPI.
6. Buyer status for Great Britain
First time buyer and former owner occupier
For Great Britain only, Northern Ireland data is not available for buyer status.
| Type of buyer | Average price February 2018 | Monthly change | Annual change |
|---|---|---|---|
| First time buyer | £189,584 | 0.0% | 4.0% |
| Former owner occupier | £260,975 | -0.2% | 4.6% |
Download this table’s data (CSV, 1KB)
7. Funding status for Great Britain
Cash and mortgage
For Great Britain only, Northern Ireland data is not available for funding status.
| Funding status | Average price February 2018 | Monthly change | Annual change |
|---|---|---|---|
| Cash | £214,473 | -0.1% | 4.2% |
| Mortgage | £234,493 | -0.2% | 4.4% |
Download this table’s data (CSV, 1KB)
8. Access the data
Download the data as CSV files or access it with our UK HPI tool.
Data revisions
View any revisions to previously published data in the data downloads or find out more about revisions in our guidance About the UK HPI.
Northern Ireland House Price Index (NI HPI)
Statistics are revised each quarter to include sales received since the last publication, namely sales of new properties which have been entered into the Northern Ireland Valuation List and late sales reported to HM Revenue & Customs. There was a large downward revision to the new dwelling prices/index in Quarter 3 2017 which was mainly due to more sales becoming available but was exacerbated by the detection of an internal process error. More information is available on page 4 of the NI HPI statistical report.
9. About the UK House Price Index
The UK House Price Index (UK HPI) is calculated by the Office for National Statistics and Land & Property Services Northern Ireland. Find out about the methodology used to create the UK HPI.
Data for the UK House Price Index is provided by HM Land Registry, Registers of Scotland, The Land & Property Services/Northern Ireland Statistics & Research Agency and the Valuation Office Agency.
Find out more about the UK House Price Index.
10. Contact
Eileen Morrison, Data Services Team Leader, HM Land Registry
Email eileen.morrison@landregistry.gov.uk
Telephone 0300 006 5288
Aimee North, Head of Housing Market Indices, Office for National Statistics
Email aimee.north@ons.gov.uk
Telephone 01633 580090
Ciara Cunningham, Statistician for the Northern Ireland HPI
Email ciara.cunningham@finance-ni.gov.uk
Telephone 028 90 336035
Garreth Jones, Land & Property Data Team, Registers of Scotland
Email Garreth.Jones@ros.gov.uk
Telephone 0131 378 4114