Chapter 5. Tuberculosis in children aged 0 to 17 years, England, 2025
Published 29 October 2026
Applies to England

© Crown copyright 2026
This publication is licensed under the terms of the Open Government Licence v3.0 except where otherwise stated. To view this licence, visit nationalarchives.gov.uk/doc/open-government-licence/version/3 or write to the Information Policy Team, The National Archives, Kew, London TW9 4DU, or email: psi@nationalarchives.gov.uk.
Where we have identified any third party copyright information you will need to obtain permission from the copyright holders concerned.
This publication is available at https://www.gov.uk/government/publications/tuberculosis-in-england-2026-report/chapter-5-tuberculosis-in-children-aged-0-to-17-years-england-2025
Main points
The main points of this chapter are:
-
in 2025, 238 children (aged 0 to 17 years) were notified with TB, a decrease of 18.8% compared with 2024 (293 children), which was a much larger decrease than observed in all TB notifications in 2025 (0.7% decrease)
-
in 2025, the TB notification rate in children was 1.99 per 100,000 population, approaching the previous low of just under 1.88 per 100,000 in 2021 and compared to a peak of just over 5 per 100,000 in 2012
-
the proportion of children notified with TB who were born in the UK was 41.6% in 2025, similar to 39.7% in 2024 and remaining much higher than the proportion in adults (17.7%)
-
the rate of TB notifications in children born in the UK has been stable in recent years at around 1 per 100,000 population. For children born outside of the UK the TB notification rate remains significantly higher at 13.15 per 100,000 population despite a decrease in 2025 compared with the 2 preceding years
-
nearly 1 in 3 children with TB born outside of the UK were reported as seeking asylum (41 out of 126 with information recorded), most of whom (40) were aged 15 to 17 years
-
median diagnostic delay in 2025 for children notified with pulmonary TB was 54 days, the highest in the last 10 years, but lower than for adults (74 days)
-
over half of children notified with pulmonary TB in 2025 started treatment within 2 months of symptom onset (56.1%) and over 90% of those expected to complete treatment within 12 months completed in this timeframe (91.1%) with no deaths recorded for any of the children notified
Supplementary tables
Data relating to this chapter can be found in the Supplementary data tables in the accompanying spreadsheet, which is available to download.
TB in children
Children are particularly vulnerable to TB, especially those aged under 5 years who are at greatest risk of developing severe TB disease. Older children aged 15 years or over tend to have a similar TB risk and clinical presentation to adults (aged 18 years or over).
The epidemiology, care pathways and management of children with suspected and confirmed TB infection and disease are distinct from those for adults, so data for children is presented separately in this report.
In TB reports prior to last year, children were defined as those aged under 15 years, in line with WHO reporting. Last year, the scope was expanded to include data on children up to and including 17 years of age, and this approach has been continued in this year’s annual report. This reflects UK paediatric services, which include individuals up to 16 years and may cover those up to 18 years following the clinical guidance from the British Association for Paediatric Tuberculosis.
Children are identified as a specific population group requiring actions in the joint UKHSA and NHS England (NHSE) collaborative action plan 2021 to 2026 so data on this group are reported separately in this chapter.
TB incidence and epidemiology in children
TB notification numbers, notification rates and geographical distribution.
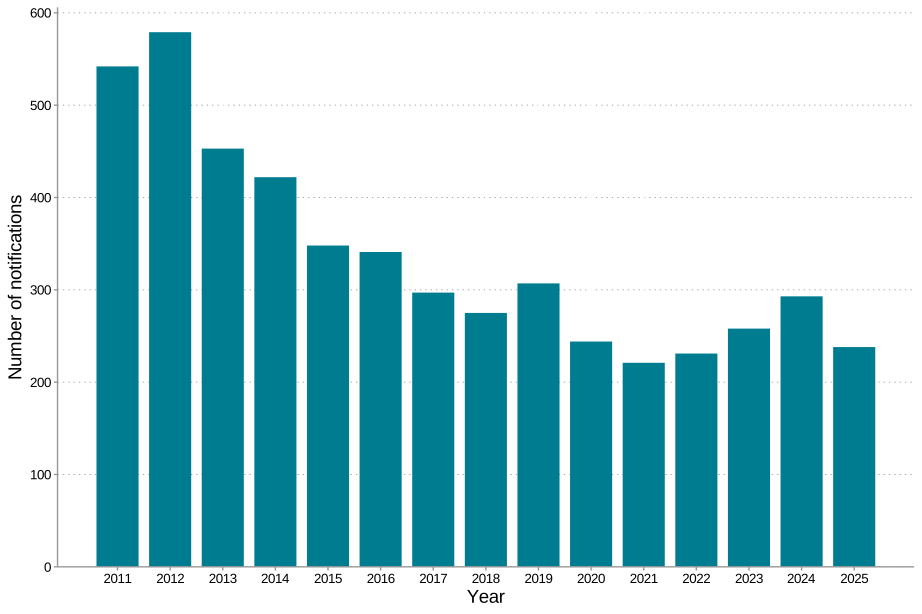
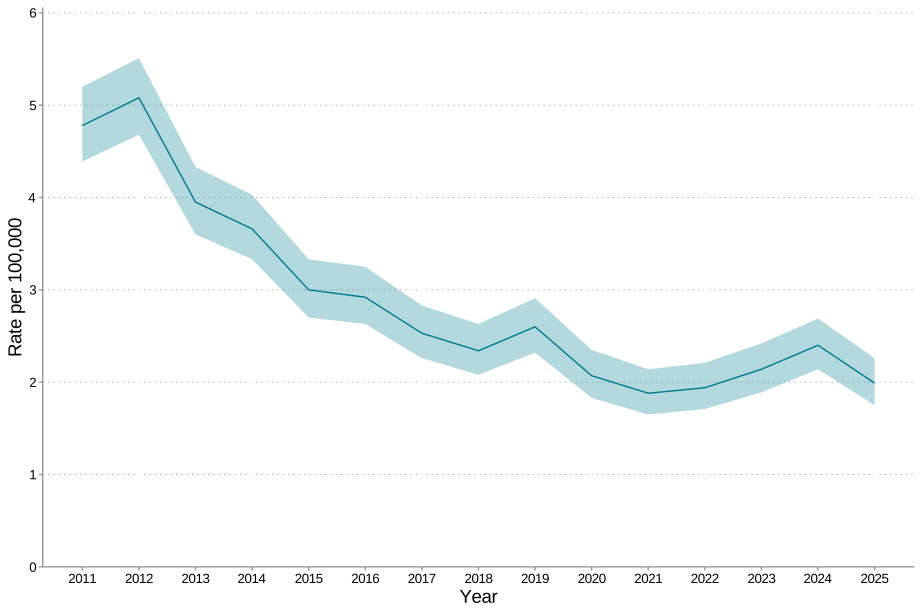
In 2025, 238 children aged under 18 years were notified with TB in England as shown in Figure 1. This is a decrease of 18.8% compared with 2024 and in contrast to the very small decrease for all TB notifications (0.7% decrease, see Chapter 1: Tuberculosis incidence and epidemiology, 2025). This reverses the recent increases from 2022 to 2024 as shown in Figure 2. In 2025, the TB notification rate per 100,000 population was 1.99 (95% confidence interval (CI): 1.75 to 2.26) was similar to 2024 when it was 2.4 (95% CI: 2.14 to 2.69) (Supplementary Table 1).
Figure 1. The overall number TB notifications in children aged under 18 years, England, 2011 to 2025.
The data used in Figure 1 can be found in Supplementary Table 1 of the accompanying data set.
Figure 2. The rates of TB notifications in children aged under 18 years, England, 2011 to 2025.
The data used in Figure 2 can be found in Supplementary Table 1 of the accompanying data set.
Distribution of TB in children by UKHSA region
The number of children with TB varies by UK Health Security (UKHSA) region with London having the highest number of notifications (69 notifications, 29.0%). There was also variation in the percentage change in notifications by UKHSA region compared with 2024, with the largest percentage increase observed in the South West (85.7% increase), though numbers are very small. This is presented in Supplementary Table 2 of the accompanying data set and largely reflects the regional patterns for all TB notifications.
Demographic characteristics of children with TB in England
TB in children by country of birth and ethnicity
In 2025, 99 out of 238 (41.6%) children notified with TB were born in the UK which is similar to 2024 (39.6%).
Figures 3A to 3C show the numbers and rates of TB notification for UK born children and children born outside the UK.
In 2025, the TB notification rate in children born in the UK was 0.87 per 100,000 (95% CI 0.71 to 1.06), similar to recent years in which the downward trend appears to have levelled off (Supplementary Table 1).
In 2025, the TB notification rate in children born outside the UK was considerably higher than in children born in the UK at 13.15 per 100,000. This is lower than in 2024 (17.29 per 100,000)
Figure 3A. Numbers of TB notifications in UK born children and children born outside of the UK under 18 years, England, 2011 to 2025
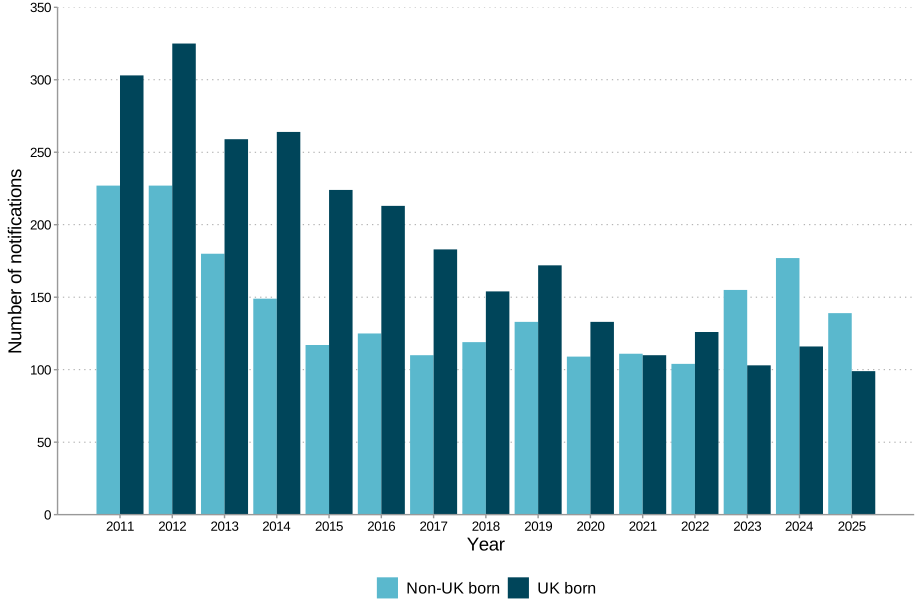
Figure 3B. TB notification rates in UK born children under 18 years, England, 2011 to 2025
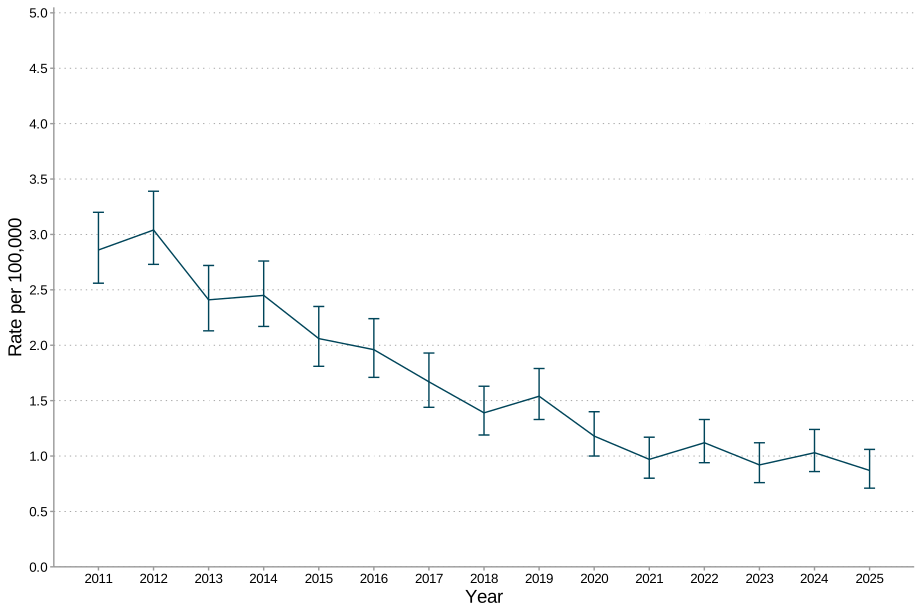
Figure 3C. TB notification rates in children born outside of the UK under 18 years, England, 2011 to 2025
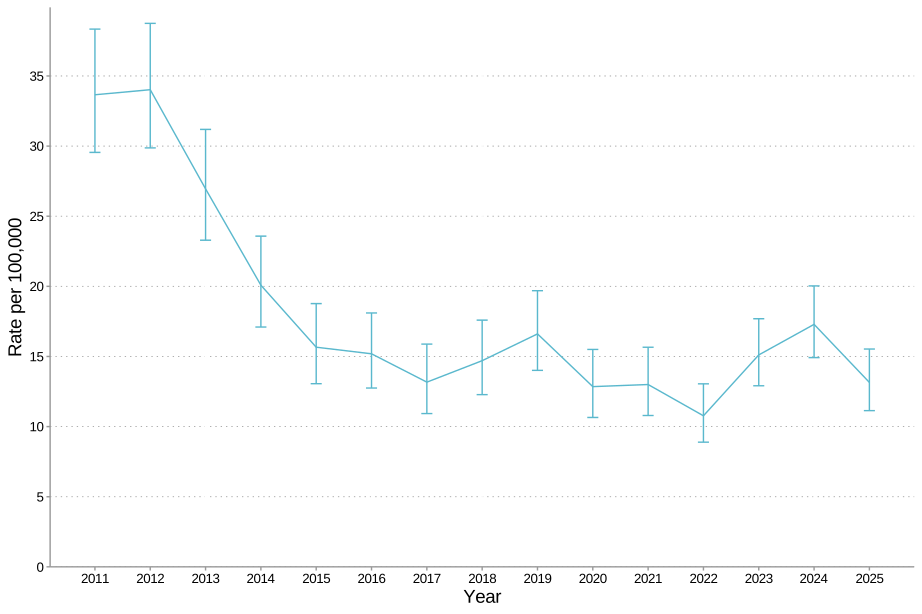
The data used in Figure 3A, B and Figure 3C can be found in Supplementary Table 1.
Table 1 shows that after the UK, India, Ethiopia and Sudan were the most frequent countries of birth among children diagnosed with TB in 2025.
Table 1. The top 5 countries of birth for children with TB, England, 2025
| Country of birth | Number of children | Proportion of children (%) |
|---|---|---|
| United Kingdom | 99 | 41.6 |
| India | 16 | 6.7 |
| Ethiopia | 15 | 6.3 |
| Sudan | 15 | 6.3 |
| Pakistan | 11 | 4.6 |
Note for Table 1: there was no missing country of birth.
Differences in TB notification rates between UK-born children and children born outside of the UK by ethnicity
Supplementary Table 3 shows the numbers and TB notification rates for children by place of birth (UK-born and born outside of the UK) by reported ethnicity. Ethnicity-specific numbers and rates are presented for the aggregated 5-year period of time between 2021 and 2025, due to small numbers in individual years.
The most common ethnicity in children born in the UK between 2021 and 2025 was White (24.9%) but the highest notification rates were in children of Black-African (5.67 per 100,000) and Black-Other ethnicity (5.43 per 100,000). Among children born outside the UK, the highest proportion and notification rates were observed among children of Black African ethnicity, at 38.3% and 27.65 per 100,000, respectively.
The greatest difference in rates between UK-born children and children born outside the UK within the same ethnic group was observed among Black-African children (5.67 compared with 27.65 per 100,000, respectively). This is similar to what is seen in adults, with TB notification rates being higher for people of all ethnic groups who were born outside the UK compared with the same ethnic groups born in the UK (see Chapter 1: Tuberculosis incidence and epidemiology, 2025 and Supplementary Table 3).
Age and sex distribution differ between UK-born children and children born outside of the UK
Age-specific numbers and rates for 2025 and for data aggregated from 2011 to 2025 are shown in Figures 4a, 4b and 5.
Figure 4a. The number and proportion of TB notifications in UK born children by sex and age group, England, 2025
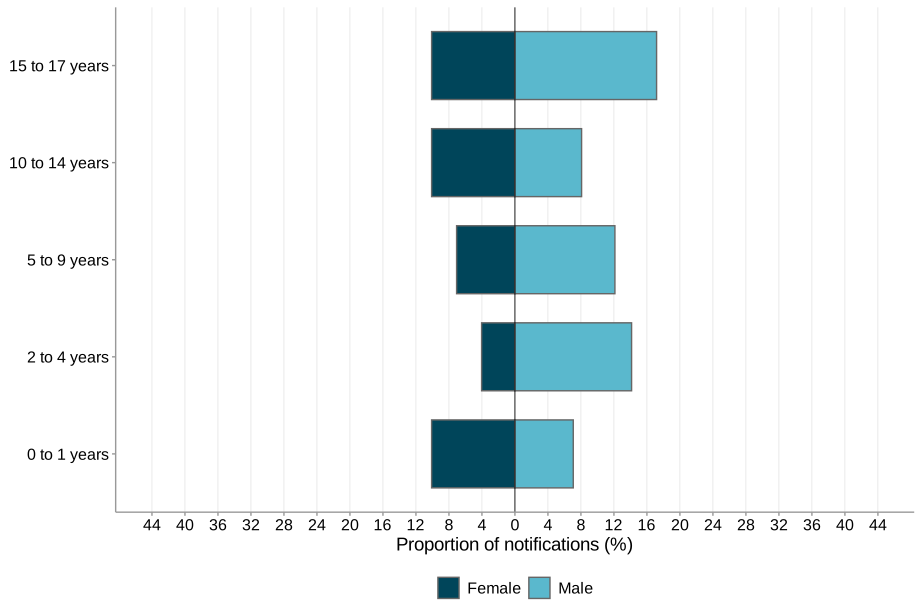
Figure 4b. The number and proportion of TB notifications in children born outside of the UK by sex and age group, England, 2025
The data used in Figures 4a and 4b can be found in Supplementary Table 4.
In 2025, there were more notifications of TB in children in males (143 of 238, 60.1%) than females (95 of 238, 39.9%). Figures 4a and 4b and Supplementary Table 4 show the differences in proportion by age and sex in UK born children and children born outside of the UK respectively.
The most common age group in children notified with TB was 15 to 17 years with 116 children (48.7% of total children) and the least common group was those aged 2 to 4 years (20 children, 8.4%).
Figure 5. Number of TB notifications by age for UK born children and children born outside of the UK, 2011 to 2025 (aggregated data)
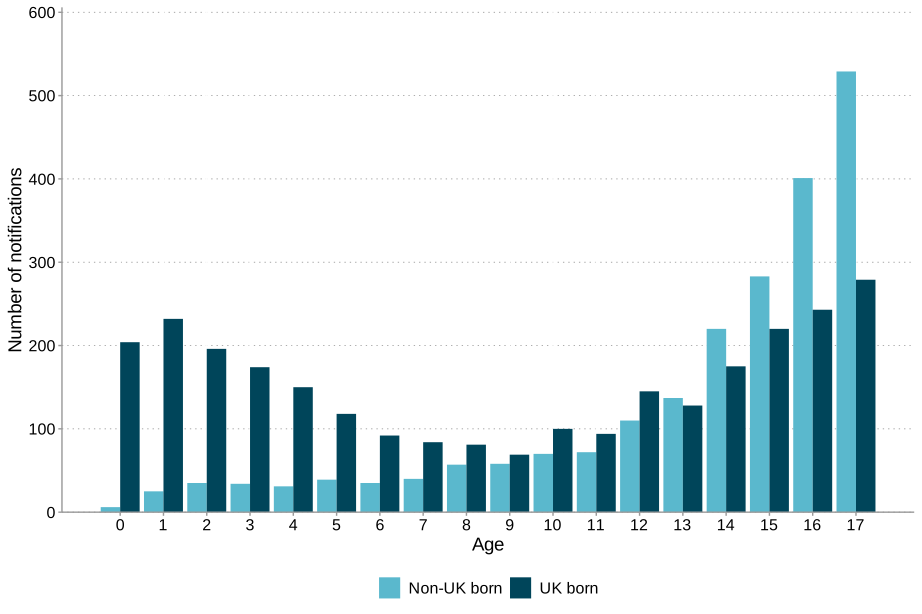
The data used in this graph can be found in Supplementary Table 5.
Rates for children born in the UK are highest in those aged 0 to 1 years and 15 to 17 years (Supplementary Table 5). In children born outside the UK rates are highest in those aged 15 to 17 years.
The age distribution of TB among UK-born children reflects the global pattern with higher incidence in children under 5, decreasing through the middle childhood years and then increasing again in adolescence.
Appendix Figures 1a and 1b shows the number of TB notifications by age (per year).
Clinical characteristics
Site of disease
Over half (62.6%) of children had pulmonary disease. The proportion differed by age group, being highest in the 0 to 1 year group (77.8%) and lowest in 10 to 14 year olds at 47.2% (Table 2).
There were 20 children (8.4%) classified as having TB disease with potential central nervous system (CNS) involvement (TB meningitis, cryptic disseminated or miliary TB).
Table 2. Site of disease in children with TB, England, 2025 In this Table [z] denotes where the calculation is not applicable.
| Site of disease | 0 to 1 years: number | 0 to 1 years: percentage | 2 to 4 years: number | 2 to 4 years: percentage | 5 to 9 years: number | 5 to 9 years: percentage | 10 to 14 years: number | 10 to 14 years: percentage | 15 to 17 years: number | 15 to 17 years: percentage |
|---|---|---|---|---|---|---|---|---|---|---|
| Total number of children | 18 | [z] | 20 | [z] | 31 | [z] | 53 | [z] | 116 | [z] |
| Pulmonary TB | 14 | 77.8 | 14 | 70.0 | 22 | 71.0 | 25 | 47.2 | 74 | 63.8 |
| Extra pulmonary TB | 8 | 44.4 | 8 | 40.0 | 19 | 61.3 | 36 | 67.9 | 67 | 57.8 |
| TB disease with potential CNS involvement | 1 | 5.6 | 2 | 10.0 | 3 | 9.7 | 4 | 7.5 | 10 | 8.6 |
| Lymph node only | 5 | 27.8 | 5 | 25.0 | 11 | 35.5 | 25 | 47.2 | 25 | 21.6 |
| Other | 1 | 5.6 | 1 | 5.0 | 4 | 12.9 | 8 | 15.1 | 12 | 10.3 |
Notes for Table 2:
- TB disease with potential CNS involvement comprises TB meningitis, miliary TB or cryptic disseminated TB
- children with pulmonary disease may have disease in other sites as well and therefore numbers may add up to more than the number of total children
Rates of TB notification in children as a proxy for recent transmission
TB in children is often associated with recent transmission as children have a limited time during which they could have become infected and, if they develop active disease, this is usually within 12 months. Therefore, the rate of TB notification in children (aged under 15 years) born in the UK can be used as a proxy for recent transmission within England; however, it is an imperfect measure and should be interpreted alongside other indicators of transmission.
Figure 6 shows the rate for UK born children only over the period 2011 to 2025. After a fairly steady decline from 2012, the TB notification rate in this group increased slightly in 2019, then declined again, and remained relatively static in 2025 at under 2 notifications per 100,000 population.
Figure 6. The overall rate of TB notification in children (under 15 years) born in the UK, England, 2011 to 2025
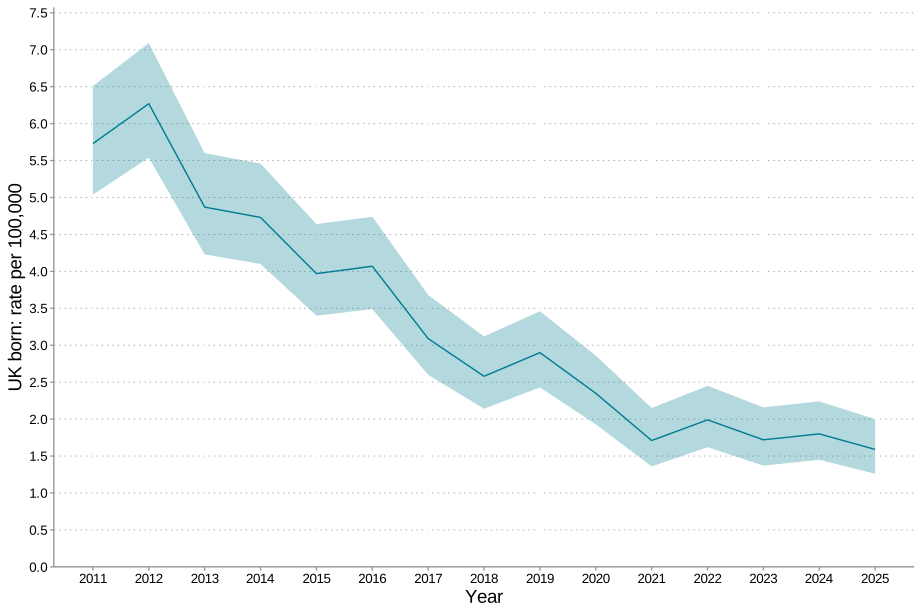
The data used in Figure 6 can be found in Supplementary Table 1.
Clinical comorbidities
In 2025, among children with recorded information on each comorbidity, 12 out of 215 children notified with TB (5.6%) had an immunosuppressive disorder. Hepatitis B was reported in 1 out of 202 children (0.5%), who was aged 15 to 17 years old. A history of smoking was reported in 3 out of 213 children (1.4%); 2 were aged 10 to 14 years and 1 aged 15 to 17 years.
Diabetes was recorded in 1 child, while no children with TB were recorded with hepatitis C or HIV in 2025 (see Supplementary Table 6 for a breakdown of clinical comorbidities by age group for 2021 to 2025).
Social risk factors (SRFs) in children with TB
In 2025, no children were reported with alcohol misuse and only 1 child with drug misuse (in the 15 to 17 year age group) (see Supplementary Table 6 and 7).
Homelessness and asylum seeker status in children notified with TB
In 2025, 5.6% of children under 18 years old with information recorded were reported to have a history of homelessness (12 out of 214). The proportion was higher among children aged 15 to 17 years old, at 11.2% (12 out of 107) (Figure 7). Overall, 6.4% of people in all age groups notified with TB were reported to have a history of homelessness (see Chapter 1: TB incidence and Epidemiology in England, 2025).
Figure 7. Proportion of children notified with TB who reported a history of homelessness by age group, England, 2021 to 2025
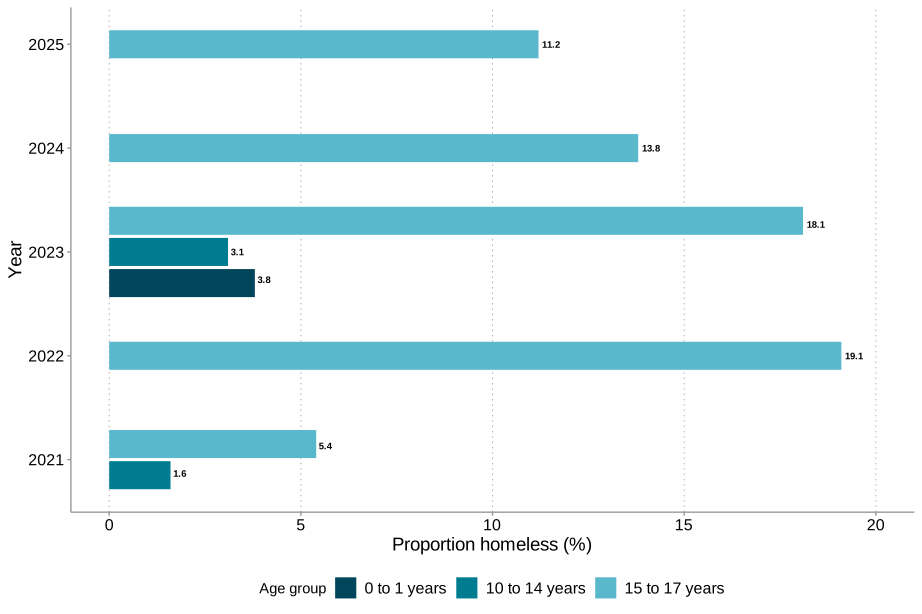
Notes to Figure 7:
- numbers of children are shown to the right of the bars
- proportions are calculated for those with reported values
- history of homelessness was missing in 4.5% in 2021, 6.1% in 2022, 6.6% in 2023, 4.8% in 2024 and 10.1% in 2025
The data used in this graph can be found in Supplementary Table 7.
The number of children with TB reported to be seeking asylum has increased since 2021 with 20 children in 2021, 38 in 2022, 48 in 2023, 48 in 2024 and 41 in 2025, representing 18.2% of all children notified with TB. As in previous years, most of the children with TB reported to be seeking asylum were aged 15 to 17 years (40 individuals) (Figure 8 and Supplementary Table 7).
Figure 8. Proportion of asylum seekers by age group for England, 2021 to 2025
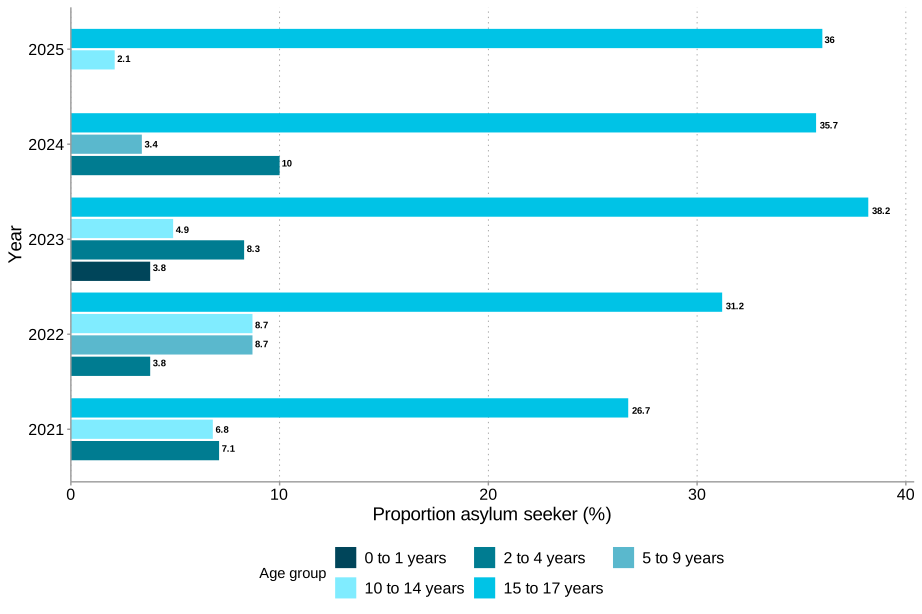
Notes to Figure 8:
- numbers of children are shown to the right of the bars
- proportions are calculated for those with reported values
- asylum seeker status was collected more systematically from 2021 onwards, with very high proportions of missing data before this time. Asylum seeker status was missing in 29.4% in 2021, 2.2 in 2022, 5% in 2023, 6.5% in 2024 and 5.5% in 2025
The data used in this graph can be found in Supplementary Table 7.
Detecting TB in children
Delays in the care pathway in children
The prompt diagnosis and treatment of active TB can improve treatment outcomes and reduce the period of infectiousness and potential onwards transmission.
Breaking down the period of treatment delay into the periods between symptom onset, seeking of healthcare, diagnosis and then start of treatment can identify where further investigation into the causes of delay and of appropriate interventions should be targeted.
There are likely to be different factors associated with delays between presentation at a healthcare service, receipt of diagnosis and then treatment commencement.
Diagnostic delay attributable to pre-healthcare or in-healthcare factors in children notified with pulmonary TB.
Diagnostic delay covers the time-period between symptom onset and a TB diagnosis being made, whilst healthcare-related diagnostic delay covers the time period between presentation to a healthcare service and a TB diagnosis being made.
In 2025, median diagnostic delay was 54 days, representing a small increase over the past 5 years, however, this remained considerably lower than the 74-day median delay observed in adults (Figure 9a) (Supplementary Table 8) (see Chapter 3: Tuberculosis diagnosis and microbiology, England, 2025). The median time from presentation at a healthcare setting to diagnosis was 24 days in 2025, similar to 2024 (23 days) (Figure 9b).
Figure 9a. Box plot showing the number of days between symptom onset and diagnosis, England, 2016 to 2025
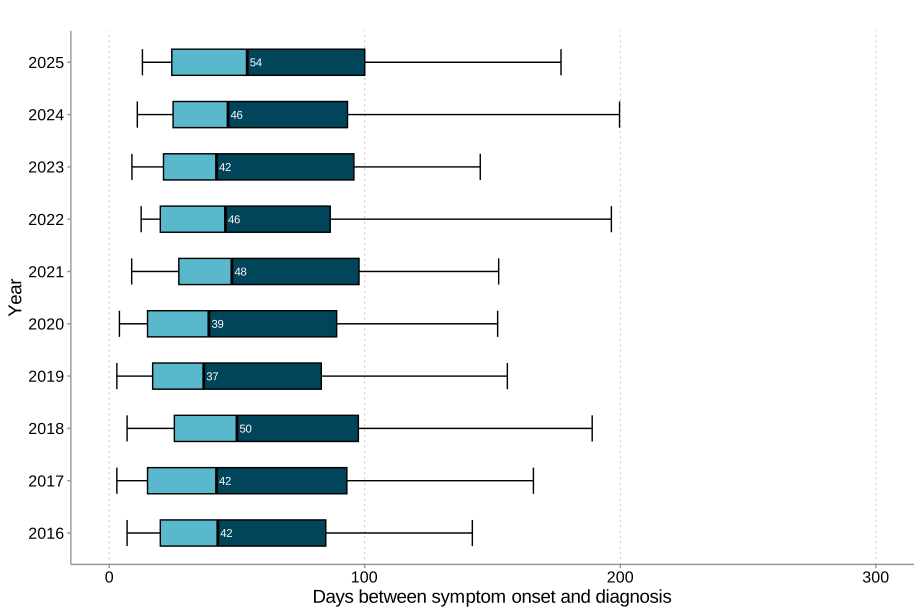
Notes for Figure 9a:
- the box shows the 25th to 75th percentile, the whiskers show the 10th to 90th percentile, and the number indicates the median
- excludes 1 child notified postmortem, 3 children with a diagnostic delay of less than 0 days, and 353 children with missing information on symptom onset to diagnosis, out of 1,737 children with pulmonary infection
Figure 9b. Box plot of the number of days between presenting to healthcare service and diagnosis, 2016 to 2025
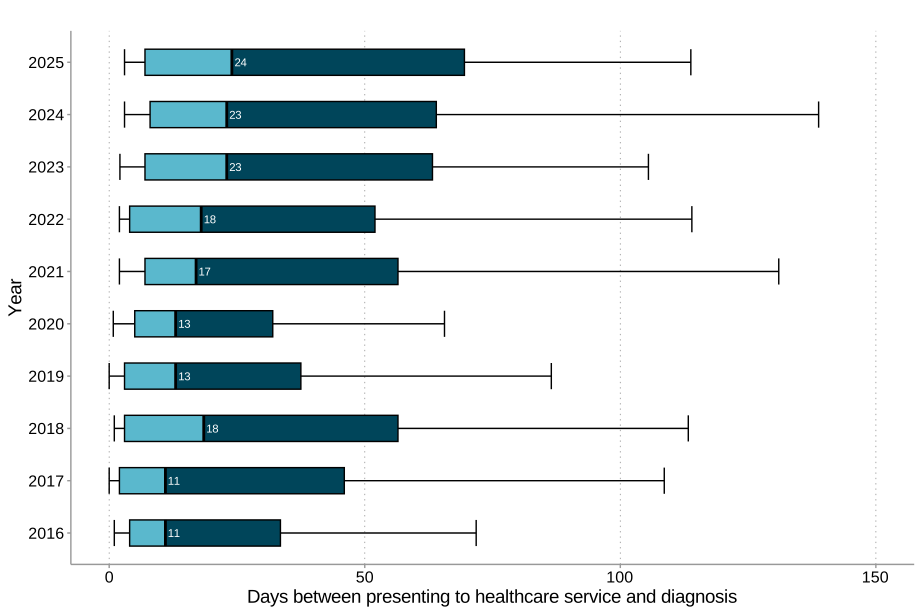
Notes on Figure 9b:
- the box shows the 25th to 75th percentile, the whiskers show the 10th to 90th percentile, and the number indicates the median
- excludes 1 child notified post-mortem, 6 children with a diagnostic delay of less than 0 days, and 223 children with missing information on symptom onset to diagnosis, out of 1,737 children with pulmonary infection
Time to notification
Notification of TB is required within 3 days of a suspected or confirmed TB diagnosis. The median time to notification for children with pulmonary TB in England was 2 days in 2025.
In 2025, 61.7% of children were notified within 3 days of diagnosis, (Supplementary Table 9), this is similar to the notification rate within 3 days observed in adults (62.9%).
Diagnostic confirmation
Use of molecular testing, including polymerase chain reaction (PCR), can provide a more rapid diagnosis than culture and reduce delay between symptom onset and start of treatment. The National Institute for Health and Care Excellence (NICE) recommends that respiratory samples should have a PCR in all cases for diagnosis of TB in children. PCR information relies on user entry into NTBS and therefore numbers recorded may underestimate diagnostic testing.
In 2025, PCR test results were recorded for 107 of 238 (45.0%) children notified with TB, of which 65.4% were positive.
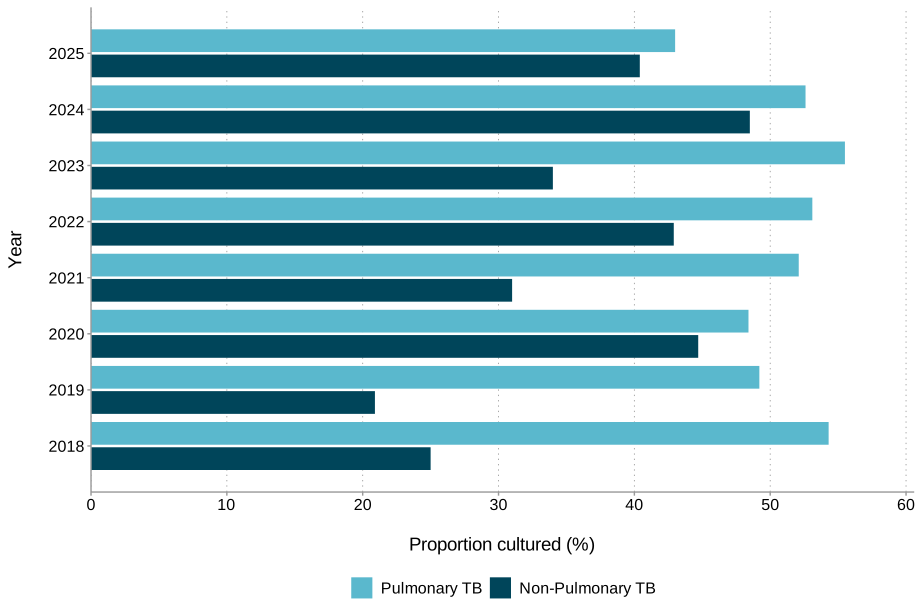
In 2025, 42% (100 out of 238 individuals) of children had TB disease confirmed by culture. The proportion was slightly higher in pulmonary (43.0%) than non-pulmonary (40.4%) disease (Figure 10 and Supplementary Table 10).
Figure 10. Proportion of pulmonary and non-pulmonary notifications that were confirmed by culture in England, 2018 to 2025
Data for this chart are shown in Supplementary Table 10.
Culture confirmation proportions in pulmonary disease were much lower in children than in all individuals with TB (73.2%). A lower proportion of culture confirmation, especially for pulmonary TB, in children is expected as it is harder to obtain samples as young children may not produce sputum from coughing (Table 3). Obtaining clinical samples from children can require invasive procedures. Fewer children have samples taken for culture confirmation and are treated empirically (in line with British Association for Paediatric Tuberculosis clinical guidance).
Table 3. Proportion of all TB notifications culture confirmed by age-group, England 2018 to 2025
| Age group | 2018 | 2019 | 2020 | 2021 | 2022 | 2023 | 2024 | 2025 | Total cultured |
|---|---|---|---|---|---|---|---|---|---|
| 0 to 1 years | 34.4 | 23.1 | 28.0 | 33.3 | 26.7 | 57.7 | 23.3 | 44.4 | 64 |
| 2 to 4 years | 13.9 | 21.2 | 14.3 | 5.9 | 15.4 | 20.8 | 20.0 | 20.0 | 34 |
| 5 to 9 years | 22.2 | 21.1 | 16.7 | 22.7 | 30.4 | 29.2 | 19.4 | 19.4 | 52 |
| 10 to 14 years | 46.2 | 38.0 | 47.2 | 43.5 | 52.8 | 32.3 | 50.7 | 54.7 | 232 |
| 15 to 17 years | 63.3 | 51.8 | 75.0 | 54.7 | 64.2 | 61.3 | 69.3 | 45.7 | 559 |
Data for this chart are shown in Supplementary Table 10.
Culture confirmation proportions for children differed by UKHSA region (Supplementary Table 11). As numbers are small in most regions, there can be significant fluctuation in culture confirmation proportions from year to year.
Drug resistance
Susceptibility of the TB bacteria to anti-tuberculous agents is reported for all individuals with culture-confirmed TB. In 2025 of the 100 children with culture confirmed TB:
- 1 had isoniazid resistance (1%), without MDR TB, at diagnosis
- 3 had MDR or rifampicin-resistant (RR) TB at diagnosis (3%)
- 1 child had pre-extensively drug-resistant TB (pre-XDR) at diagnosis
A total of 4 children were treated for MDR-TB or pre-XDR (1.7% of the children with TB in 2025). This is slightly lower than 2024 (9 children, 3.1%), though as numbers are very small, they readily fluctuate from year to year.
TB treatment and outcomes in children
Time from symptom onset to TB treatment start (treatment delay)
Treatment delay is defined as the period from the start of symptoms (as reported by the patient) and the start of TB treatment. Delay in starting treatment is defined as any time after 2 months of diagnosis. This is further split into ‘2 to 4 months’ post-diagnosis and ‘greater than 4 months’ post-diagnosis.
Only the delays for children with pulmonary disease are described in the following section.
Table 4 shows the number and proportion of children notified with pulmonary TB with a treatment delay between 0 to 2 months, 2 to 4 months and more than 4 months from 2016 to 2025. A similar proportion of children were missing information on treatment delays in 2024 and 2025 (33.8% and 34.2% respectively), which was mainly due to missing information for date of symptom onset.
Table 4. The number and proportion of children notified with pulmonary TB with a treatment delay between 0 to 2 months, 2 to 4 months and more than 4 months, England, 2016 to 2025
| Year | Total (number) | 0 to 2 months delay: number | 0 to 2 months delay: percentage | 2 to 4 months delay: number | 2 to 4 months delay: percentage | over 4 months delay: number | over 4 months delay: percentage | Pulmonary (number) | Missing (percentage) |
|---|---|---|---|---|---|---|---|---|---|
| 2016 | 192 | 119 | 62.0 | 47 | 24.5 | 26 | 13.5 | 220 | 12.7 |
| 2017 | 180 | 114 | 63.3 | 29 | 16.1 | 37 | 20.6 | 194 | 7.2 |
| 2018 | 171 | 92 | 53.8 | 48 | 28.1 | 31 | 18.1 | 199 | 14.1 |
| 2019 | 155 | 99 | 63.9 | 33 | 21.3 | 23 | 14.8 | 197 | 21.3 |
| 2020 | 140 | 86 | 61.4 | 34 | 24.3 | 20 | 14.3 | 159 | 11.9 |
| 2021 | 87 | 50 | 57.5 | 21 | 24.1 | 16 | 18.4 | 121 | 28.1 |
| 2022 | 103 | 60 | 58.3 | 23 | 22.3 | 20 | 19.4 | 147 | 29.9 |
| 2023 | 107 | 69 | 64.5 | 18 | 16.8 | 20 | 18.7 | 155 | 31.0 |
| 2024 | 129 | 75 | 58.1 | 33 | 25.6 | 21 | 16.3 | 195 | 33.8 |
| 2025 | 98 | 55 | 56.1 | 27 | 27.6 | 16 | 16.3 | 149 | 34.2 |
Notes for Table 4:
- ‘0 to 2 months’ covers 0 to 60 days, ‘2 to 4 months’ covers 61 to 121 days and ‘Over 4 months’ includes delays from 122 days onwards
- children diagnosed with TB post-mortem are excluded from these analyses
- the total includes the number of children with pulmonary TB with known duration of treatment delay
- the total pulmonary reflects the number of children with pulmonary TB, including those with no known duration of treatment delay
In 2025, just over half of children (56.1%, 55 of 98) with pulmonary disease were treated within 2 months from TB symptom onset. 16 children (16.3%) experienced a delay of more than 4 months from symptom onset to treatment start. Treatment delay was less common in children than individuals with TB overall (see, Chapter 4: Tuberculosis treatment and outcomes, England, 2025).
In 2025, the median treatment delay for children notified with pulmonary TB was 56 days (IQR: 26 to 101 days) compared with 47 days in 2024.
Treatment delay by age group, sex and place of birth
Due to small numbers, the data is presented as aggregated numbers across the last 10 years (2016 to 2025). Treatment delays were more common among older children. A delay of 2 to 4 months was most prevalent in children aged 15 to 17 years (13.5%), followed by those aged 10 to 14 years (5.1%). A similar pattern was observed for delays of over 4 months, with 9.1% of children aged 15 to 17 years experiencing this delay, followed by 4.0% of those aged 10 to 14 years (Appendix Table A1). This pattern was also evident when examining treatment delays greater than 2 months by sex, with the highest proportions observed in older age groups for both females and males. Among children aged 15 to 17 years, 23.0% of females and 33.7% of males experienced a treatment delay of more than 2 months, compared with 14.5% and 8.1%, respectively, among those aged 10 to 14 years (Appendix Table A2). Analysis by place of birth showed that treatment delays of over 2 months were similar among children born outside the UK (50.2% for delays of 2 to 4 months and 51.7% for delays of over 4 months) and those born in the UK (49.2% and 47.8%, respectively) (Appendix Table A3).
Enhanced support for children undergoing TB treatment
Enhanced care management (ECM) is a package of tailored supportive care. All children notified with TB should be offered at least level 1 of ECM. The ECM levels recorded in the National TB Surveillance System (NTBS) comprise:
- level 0 for standard care management
- level 1 for people with clinical or social issues or both which have an impact on treatment, which may include children with TB, or those with human immunodeficiency virus (HIV) and taking antiretrovirals
- level 2 for people with complex clinical or social issues or both affecting treatment and necessitating, for example, weekly visits and may include persons with complex side effects or single drug resistance
- level 3 for people with very complex clinical or social issues or both affecting treatment and necessitating directly observed therapy (DOT) or video observed therapy (VOT) and may include people experiencing homelessness, multidrug-resistant or rifampicin-resistant TB, or those with complex contact tracing or those where the involvement of social services is required. (See the Royal College of Nursing’s Case Management Tool for TB Prevention, Care and Control in the UK. Note: this is an archived version, the original document has been withdrawn pending update in spring 2027).
Table 5 shows levels of ECM by year. In 2025, 195 children notified with TB (81.9%) were assessed as needing some level of ECM, which is slightly lower than in recent years, and lower than the 100% indicated by the case management guidance.
Table 5. Enhanced case management (ECM) in children notified with TB by year, England, 2021 to 2025.
| Year | Total | Any ECM | ECM percentage | ECM Level 1: number of notifications | ECM Level 1: percentage | ECM Level 2: number of notifications | ECM Level 2: percentage | ECM Level 3: number of notifications | ECM Level 3: percentage | ECM Unknown level: number of notifications | ECM Unknown level: percentage |
|---|---|---|---|---|---|---|---|---|---|---|---|
| 2021 | 221 | 137 | 62.0 | 57 | 25.8 | 17 | 7.7 | 43 | 19.5 | 20 | 9.0 |
| 2022 | 231 | 197 | 85.3 | 124 | 53.7 | 26 | 11.3 | 47 | 20.3 | 0 | 0.0 |
| 2023 | 258 | 223 | 86.4 | 112 | 43.4 | 30 | 11.6 | 80 | 31.0 | 1 | 0.4 |
| 2024 | 293 | 257 | 87.7 | 124 | 42.3 | 44 | 15.0 | 89 | 30.4 | 0 | 0.0 |
| 2025 | 238 | 195 | 81.9 | 103 | 43.3 | 35 | 14.7 | 56 | 23.5 | 1 | 0.4 |
In 2025, there was a reduction in the number of children notified with TB requiring some level of enhanced case management (81.9%) compared to 2024 (87.7%).
Supplementary Table 12 of the accompanying data set shows the proportion of children by age, sex, place of birth and site of disease who were assessed as requiring different levels of ECM in 2025. Some level of ECM was applied relatively evenly across groups.
Directly observed treatment (DOT) or video observed treatment (VOT)
According to National Institute for Health and Care Excellence (NICE) guidelines, DOT, which includes video observed therapy (VOT), should be offered as part of enhanced case management to children who themselves or whose parents:
- do not adhere to treatment (or have not in the past)
- have been treated previously for TB
- have a history of homelessness, drug or alcohol misuse
- are currently in prison, or have been in the past 5 years
- have a major psychiatric, memory or cognitive disorder
- are in denial of the TB diagnosis
- have multidrug-resistant TB
- request DOT after discussion with the clinical team
- are too ill to administer the treatment themselves
Data reporting on whether DOT or VOT was offered and received by children with TB from 2016 to 2025 is shown in Supplementary Table 13 of the accompanying data set.
In 2025, missing data in relation to the offer of DOT or VOT was similar to 2024.
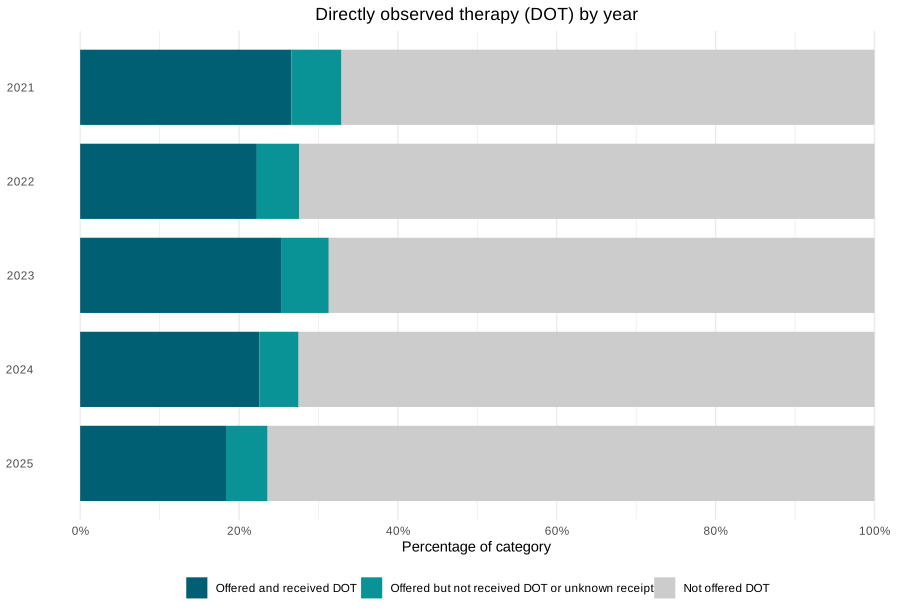
In 2025, DOT was offered to 23.6% of children (54 out of 229), similar to 27.5% (78 out of 284) in 2024 (Figure 11). Among children offered DOT 77.8% (42 out of 54) received it. Among children offered VOT 80.0% (20 out of 25) received it.
Figure 11. Proportion offered and received DOT, England, 2021 to 2025
Data used in this figure can be seen in Supplementary Table 13
Notes to Figure 11:
- people with information on whether DOT was offered was missing were excluded (95)
- people who were diagnosed postmortem were excluded (1)
Treatment outcomes in children with non-MDR or non-RR TB (without central nervous system (CNS) disease)
For children treated for non-MDR or non-RR TB, outcomes are reported for those notified up to and including 2024 as that is the latest year of notifications for which treatment completion is expected within the 2025 data. For children treated for MDR or RR TB, outcomes are reported for those notified up to and including 2023 as treatment duration can be up to 24 months.
Further definitions of TB treatment cohorts can be found in the Methodology and definitions chapter.
Mutually exclusive treatment outcome categories are shown in Table 6 below. For 258 children with non-MDR or non-RR TB notified in 2024 with non-CNS disease, 235 (91.1%) had completed treatment by 12 months. At the time of data extraction, 93.4% of children had completed treatment at their last recorded outcome. No children in this cohort were reported to have died.
Table 6. TB outcome at 12 months and the last recorded TB outcome for children notified in 2024 with non-MDR or RR TB, with an expected treatment duration of under 12 months, England, 2025
| Treatment outcome | Treatment outcome at 12 months: number of notifications | Treatment outcome at 12 months percentage | Last recorded outcome: number of notifications | Last recorded outcome percentage |
|---|---|---|---|---|
| Died | 0 | 0.0 | 0 | 0.0 |
| Lost to follow-up | 12 | 4.7 | 12 | 4.7 |
| Not evaluated | 6 | 2.3 | 3 | 1.2 |
| Still on treatment | 3 | 1.2 | ||
| Treatment completed | 235 | 91.1 | 241 | 93.4 |
| Treatment stopped | 2 | 0.8 | 2 | 0.8 |
| Total | 258 | 100 | 258 | 100 |
Notes for Table 6:
- excludes children treated for MDR or RR TB and those with potential CNS disease and children diagnosed with TB postmortem
- ‘Not evaluated’ includes unknown and transferred out
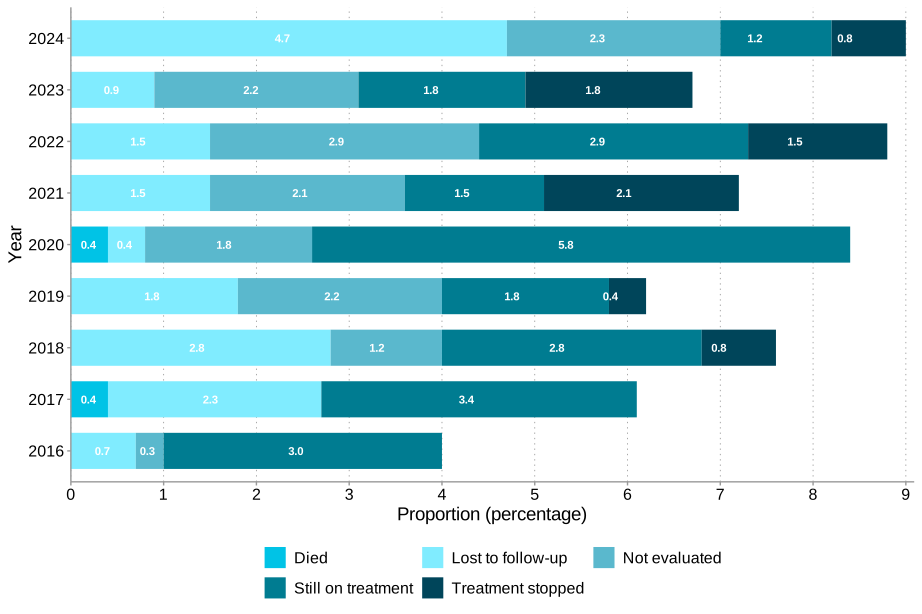
Treatment completion at 12 months was greater in children compared with all people with TB, 91.1% versus 84.8% (TB treatment and outcomes in England, 2025 report) and has remained stable over the last 10 years (between 91.1% and 96.1%) (Supplementary Table 14). The distribution of non-treatment completion outcomes at 12 months over the last 10 years is shown in Figure 12 showing only 2 deaths over this period out of 2,205 children (0.09%).
Figure 12 below shows that the proportion of children who died, were lost to follow-up, still on treatment or stopped treatment has remained very low and comparable over the last 10 years.
Figure 12. Breakdown of children evaluated who did not complete treatment at 12 months for children with non-MDR or non-RR TB and expected treatment duration under 12 months, England, 2016 to 2024
Notes for Figure 12:
- excludes children treated for MDR or RR TB and those with potential CNS disease and children diagnosed with TB postmortem
- ‘Not evaluated’ includes unknown and transferred out
The data used in this graph can be found in Supplementary Table 14.
Of those notified in 2024 and reported to still be on treatment at 12 months (3 children) all went on to complete treatment as their last recorded outcome. Of the 6 children reported as not evaluated at 12 months, 3 subsequently completed treatment and the remaining remained as not evaluated. The 12 children who were lost to follow-up at 12 months remained lost to follow-up at their last reported outcome. This pattern of increased treatment completion and no further deaths at last recorded treatment outcome over the last 10 years can be seen in Supplementary Table 15.
Twelve-month treatment outcomes by age and sex
Treatment outcomes at 12 months for the cohort of children treated for non-MDR or non-RR TB and without CNS disease are reported in the following tables:
- treatment completion by age group for children notified from 2016 to 2024 in Supplementary Table 16
- all treatment outcomes by age and sex for children notified in 2024 in Supplementary Table 17
For children notified in 2024, 83.3% of 0 to 1 year olds, 90.0% of 2 to 4 year olds,92.3% of 5 to 9 year olds, 87.5% of 10 to 14 year olds and 94.4% of 15 to 17 year olds completed treatment at 12 months. Treatment completion was similar between males and females at 91.7% and 90.3%, respectively (see Supplementary Table 17 for a more detailed breakdown).
Numbers are too low to provide an overview of TB treatment outcomes in children by geographical regions.
Treatment duration
Of 241 children notified without MDR or RR TB notified in 2024 who completed treatment, 237 had known completed treatment time. Of these, most completed treatment within the standard 6 months (51.1%, 121 out of 237) (WHO consolidated guidelines on tuberculosis: Module 4). Only 2.5% (6 of 237) took more than 12 months to complete treatment (see Supplementary Table 18).
TB treatment outcomes for the non-MDR or non-RR TB cohort with CNS TB disease
Supplementary Table 19 shows last recorded treatment outcome for children notified with potential CNS TB (TB meningitis, miliary or cryptic disseminated TB) treated for non-MDR or non-RR TB by year for children notified from 2015 to 2024. From the 25 children notified in 2024, 23 (92.0%) had completed treatment at the last recorded outcome, 1 child had died, and 1 had stopped treatment.
Last recorded TB treatment outcomes for the entire non-MDR or non-RR TB cohort
Last recorded treatment outcome for the entire non-MDR or non-RR TB cohort, notified in 2024 including those with miliary or cryptic disseminated TB or TB meningitis are shown by site of disease in Supplementary Table 20.
Factors affecting treatment completion at last recorded outcome in the entire non-MDR or non-RR-cohort
As shown in Supplementary Table 21, when aggregated over the last 10 years there were only small differences, that were not statistically significant, in the proportion of children who completed TB treatment by the socio-demographic and disease characteristics of age, sex, place of birth, and treatment delay.
TB treatment outcomes in the drug-resistant (MDR or RR TB) cohort
Supplementary Table 22 shows TB treatment outcomes at 24 months for children notified with MDR or RR TB by year from 2016 to 2023 and totalling 38 children.
Supplementary Table 23 shows the last recorded treatment outcome for the same group. There were no deaths in any of these 38 children notified over this period and 36 (95.0%) had completed treatment by their last recorded treatment outcome.
Appendix
Figure 1a. Rates of TB by age for UK born children, 2011 to 2025 (aggregated data)
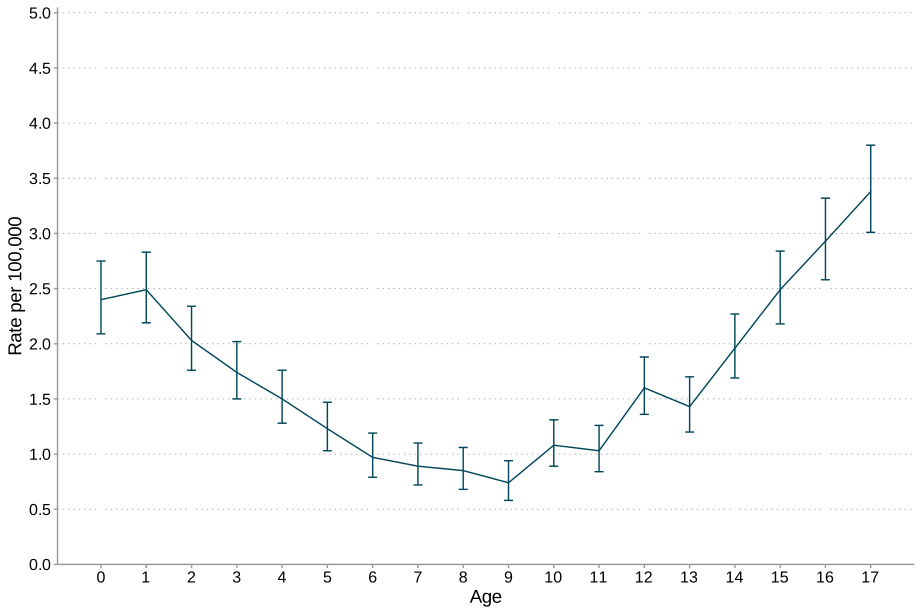
Figure 1b. Rates of TB by age for children born outside the UK, 2011 to 2025 (aggregated data)
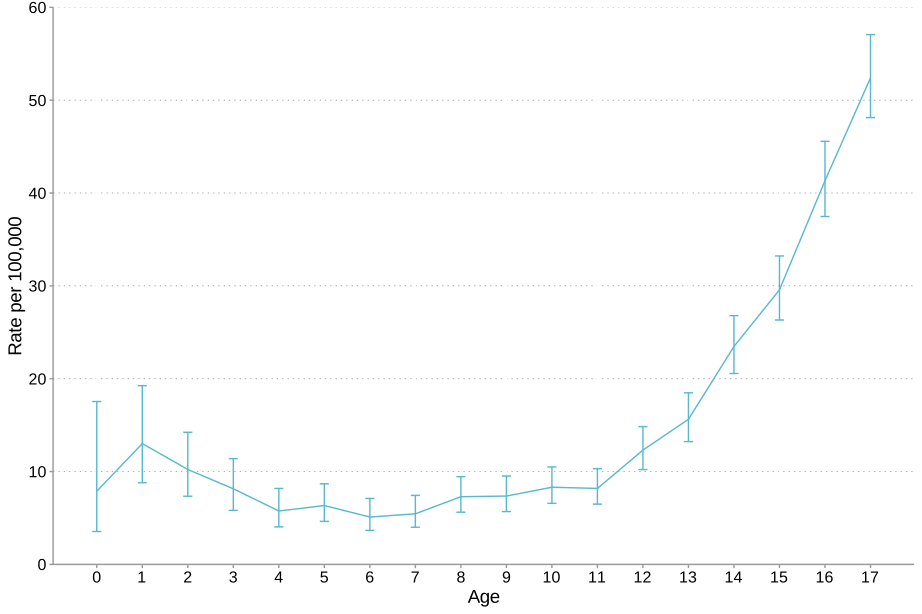
The data used in these graphs can be found in Supplementary Table 5.
Table A1. Number and proportion of children with treatment delay notified with pulmonary TB by age group, England, 2016 to 2025
In this table, [z] denotes where the calculation is not applicable.
| Time from symptom onset to treatment start | 0 to 1 years: number | 0 to 1 years: percentage | 2 to 4 years: number | 2 to 4 years: percentage | 5 to 9 years: number | 5 to 9 years: percentage | 10 to 14 years: number | 10 to 14 years: percentage | 15 to 17 years: number | 15 to 17 years: percentage | Total |
|---|---|---|---|---|---|---|---|---|---|---|---|
| 0 to 2 months delay | 101 | 75.4 | 115 | 75.2 | 93 | 68.9 | 179 | 59.3 | 331 | 51.6 | 819 |
| 2 to 4 months delay | 17 | 12.7 | 21 | 13.7 | 22 | 16.3 | 69 | 22.8 | 184 | 28.7 | 313 |
| over 4 months delay | 16 | 11.9 | 17 | 11.1 | 19 | 14.1 | 54 | 17.9 | 124 | 19.3 | 230 |
| Total | 134 | [z] | 153 | [z] | 135 | [z] | 302 | [z] | 639 | [z] | 1,365 |
Table A2. Number and proportion of children with treatment delay (greater than 2 months) notified with pulmonary TB by age group and sex, England, 2016 to 2025
| Age group | Female: number | Male: number | Female: percentage | Male: percentage | Total |
|---|---|---|---|---|---|
| 0 to 1 years | 18 | 15 | 3.3 | 2.8 | 33 |
| 2 to 4 years | 20 | 18 | 3.7 | 3.3 | 38 |
| 5 to 9 years | 16 | 25 | 2.9 | 4.6 | 41 |
| 10 to 14 years | 79 | 44 | 14.5 | 8.1 | 123 |
| 15 to 17 years | 125 | 183 | 23.0 | 33.7 | 308 |
| All | 258 | 285 | 47.5 | 52.5 | 543 |
Note to Table A2: the row and column totals include the number of eligible children notified with pulmonary TB with a valid duration between symptom onset and treatment start between 60 and 730 days.
Table A3. Number and proportion of children with treatment delay notified with pulmonary TB by place of birth, England, 2016 to 2025
In this Table [z] denotes where the calculation is not applicable.
| Time from symptom onset to treatment start | UK born: number | UK born: percentage | Born outside UK: number | Born outside UK: percentage | Total |
|---|---|---|---|---|---|
| 0 to 2 months delay | 470 | 57.6 | 346 | 42.4 | 816 |
| 2 to 4 months delay | 154 | 49.5 | 157 | 50.5 | 311 |
| over 4 months delay | 110 | 48.0 | 119 | 52.0 | 229 |
| Total | 734 | [z] | 622 | [z] | 1,365 |
Notes to Table A3:
- the row and column totals include the number of eligible children notified with pulmonary TB with a valid duration between symptom onset and treatment start and a known place of birth
- ‘0 to 2 months’ covers 0 to 60 days, ‘2 to 4 months’ covers 61 to 121 days and ‘over 4 months’ includes delays from 122 to 730 days