Chapter 3. Tuberculosis diagnosis and microbiology, England, 2025
Published 29 October 2026
Applies to England

© Crown copyright 2026
This publication is licensed under the terms of the Open Government Licence v3.0 except where otherwise stated. To view this licence, visit nationalarchives.gov.uk/doc/open-government-licence/version/3 or write to the Information Policy Team, The National Archives, Kew, London TW9 4DU, or email: psi@nationalarchives.gov.uk.
Where we have identified any third party copyright information you will need to obtain permission from the copyright holders concerned.
This publication is available at https://www.gov.uk/government/publications/tuberculosis-in-england-2026-report/chapter-3-tuberculosis-diagnosis-and-microbiology-england-2025
Main points
Main points of this chapter are:
- the median time to diagnosis from symptom onset is 74 days, this remains long and unchanged since 2018
- polymerase chain reaction (PCR) testing can help speed up diagnosis, and the proportion of adults with pulmonary TB having a PCR test recorded has increased from 38.4% in 2022 to 58.5% in 2025
- timely notification supports prompt public health action; 62.9% of notifications were made in 2025 within the statutory 3-day window from diagnosis, slightly higher than previous years
- TB infection is optimally confirmed by culture which provides full information on drug resistance and transmission; in 2025, 60.2% of individuals had positive cultures, similar to previous years
- the proportion of people with MDR (multidrug-resistant) or RR (rifampicin-resistant) TB has risen slightly in the last 10 years with 2.1% of people with positive cultures having this pattern of resistance in 2025 compared with 1.5% in 2015
- the proportion of individuals with culture positive disease in a genomic cluster, suggesting recent transmission, has declined since 2018 (40.7%), and was 31.7% in 2025
Supplementary tables
The data behind the charts in this chapter can be found in the accompanying spreadsheet, which is available to download.
Diagnostic delay
The prompt diagnosis and treatment of active TB improves patient outcomes and, for pulmonary TB, reduces the period of infectiousness and onward TB transmission. Diagnostic delay is the time from onset of symptoms to diagnosis and may be affected by symptom recognition, healthcare seeking behaviours, access to services, clinical pathways and awareness, and service capacity.
Median diagnostic delay for pulmonary TB was 74 days in 2025 , which has been generally static since 2018 (see Appendix Figure A1 and Supplementary Table 1 in the accompanying spreadsheet.
Healthcare-related diagnostic delay covers the period between presentation to a healthcare service and a TB diagnosis being made. In 2025 the median healthcare diagnostic delay was 32 days, a small increase from 28 days in 2024 (see Appendix Figure A2 and Supplementary Table 1 in the accompanying spreadsheet.
Time to notification
TB disease is notifiable within 3 days of diagnosis under the Health Protection Regulations and prompt notification supports early public health action.
In 2025 timely notification of TB was delayed beyond the statutory period in 37.1% of individuals (2,020 out of 5,449) which is a small improvement since 2021. The proportion of individuals notified more than 30 days after diagnosis, was 8.6%, similar to the previous year (see Appendix Figure A3 Supplementary Table 2 in the accompanying spreadsheet..
There is variation between regions in the timeliness of notification (see Supplementary Table 3), with the highest proportion of notifications after 3 days in the London region (32%) and the highest proportion after 30 days in the North East region (15.2%) (Appendix Figure A4).
Diagnostic confirmation
In 2025, 95.5% (5,206 out of 5,449) of individuals notified with TB had at least one diagnostic test recorded (including radiology, histology and microbiology). This is similar to 2024. The proportion is higher in people with pulmonary (98.3%; 2,816 out of 2,866 individuals) than non-pulmonary disease (92.5%; 2,390 out of 2,583 individuals) (see Supplementary Table 4 in the accompanying spreadsheet.
Polymerase chain reaction (PCR) tests
Use of molecular testing, including polymerase chain reaction (PCR), can provide a more rapid diagnosis than culture and reduce delay between symptom onset and start of treatment. The National Institute for Health and Care Excellence (NICE) recommends that respiratory samples should have a PCR in all cases for diagnosis of TB in children. PCR is recommended in adults if any of the following conditions are met: resistance to rifampicin is suspected, the patient has HIV, the result would change management, or a large contact tracing exercise is being planned. For non-respiratory samples, PCR is indicated if it would change management.
In 2025, data on PCR testing was recorded in NTBS for 49.7% of notifications (2,710 of 5,449), which is a small increase compared with 2024 (45.4%).
Overall, in 2025, 79.4% (2,152 of 2,710) of people with TB who had a PCR result recorded were PCR positive (see Supplementary Table 5 in the accompanying spreadsheet.
Of adults notified with pulmonary TB in 2025, 58.5% (1,632 out of the 2,791) were recorded as having a PCR test done. This was small increase compared to 2024 (53.5%, 1,535 out of 2,871 people), but a significant increase since 2022 (38.4%, 888 out of 2,312 people). This may reflect better data recording, or more use of PCR to support diagnosis, or both. The proportion of PCR tests that were positive on adults with pulmonary TB was 86.3% (1,409 out of 1,632). This proportion has remained stable since 2022. Only 41.3% (31 of 75) of children (aged less than 15 years) with pulmonary disease had PCR testing information recorded, of whom 54.8% (17 out of 31) had a positive test. The proportion of children with pulmonary disease with a PCR test recorded has increased from 22.5% in 2022 (20 out of 89 children).
Culture confirmation
Culture of M. tuberculosis /MTBC is required to allow drug resistance information to be provided and for typing. In 2025, 60.2% of individuals (3,281 of 5,449) with TB had their diagnosis confirmed on culture. This is similar to previous years. Culture confirmation is higher in pulmonary than non-pulmonary disease due to the greater ease of sampling the respiratory system and often a higher bacterial load. In 2025, 73.2% of individuals (2,098 of 2,866,) with pulmonary disease had culture confirmation compared to 45.8% of individuals (1,183 of 2,583) with non-pulmonary disease. These proportions are in line with previous years, and the proportion of pulmonary disease confirmed by culture remains below the National Action Plan target of 80% (see Supplementary Tables 4 and 6 in the accompanying spreadsheet.
There is regional variation in culture confirmation: details can be found by UK Health Security (UKHSA) region in Appendix Figure A5 and Supplementary Table 7, and by integrated care board (ICB) in Supplementary Table 8 in the accompanying spreadsheet.
As in previous years, males, people born outside the UK and young adults (aged 15 to 44) are more likely to have diagnoses confirmed by culture than the relevant comparator groups. Children aged 0 to 14 have the lowest culture confirmation proportions (Figure 1).
Figure 1. Risk ratio of being culture positive univariable analysis of aggregate data 2018 to 2025, England
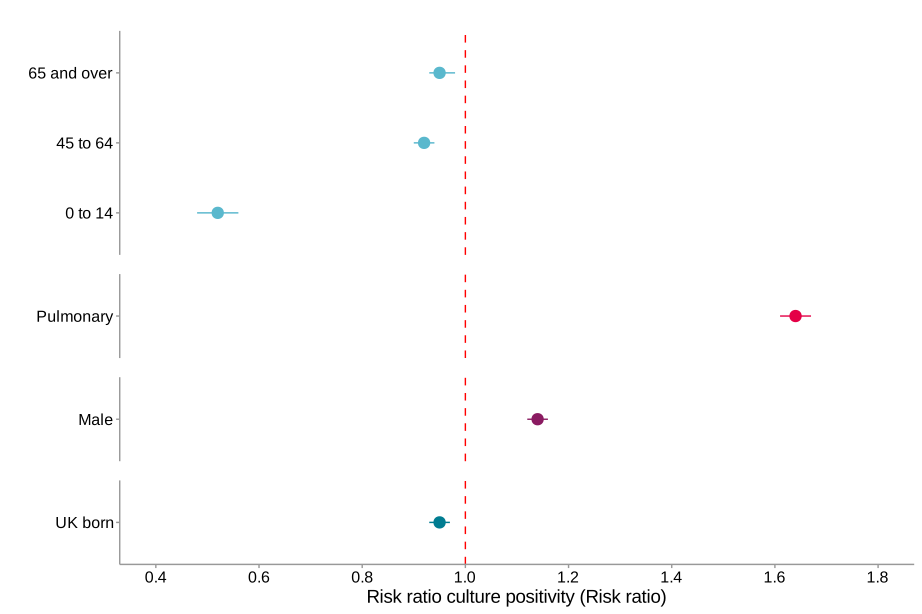
Note: the reference categories are: 15 to 44 years for age, non-pulmonary for site of disease, female for sex, and non-UK born for place of birth: these all have a risk ratio of 1 (see Supplementary Table 9 in the accompanying spreadsheet).
Determination of Mycobacterium tuberculosis complex (MTBC) species
Determination of species within the Mycobacterium tuberculosis complex (MTBC) has important implications for individual treatment and public health action. Most disease in humans is caused by M. tuberculosis rather than other members of the complex. In 2025, of the 3,177 people with positive cultures, 96.8% had M. tuberculosis, consistent with previous years. Supplementary Table 10 of the accompanying spreadsheet reports the breakdown of all species within the complex that caused human disease from 2011 to 2025.
Identification and classification of drug resistance
Whole-genome sequencing (WGS) is used for all individuals with culture confirmation to make drug susceptibility predictions for the first-line agents rifampicin, isoniazid, pyrazinamide, and ethambutol, plus aminoglycosides and fluoroquinolones.
Identification and reporting of drug resistance using WGS is more rapid than conventional phenotypic drug susceptibility testing (pDST). However, pDST is still performed for first-line drugs if there are incomplete results from WGS. pDST is performed for first-, second- and third-line agents if resistance to first-line agents is detected by WGS.
Drug resistance
In 2025, 99.1% of people whose TB was confirmed by culture (3,252 out of 3,281) had results reported for Isoniazid and Rifampicin drugs (see Supplementary Table 11, Figure 2). This is just below the National Action Plan and WHO End TB target of 100%, but higher than in previous years. The 100% target is not attainable due to biological failures in subculture of organisms and contamination of samples with other organisms which cannot always be eliminated.
In 2025, for individual first-line antibiotics in the 3,281 people with culture-confirmed TB (see Supplementary Table 12 in the accompanying spreadsheet):
- 7.0% of people had resistance to isoniazid
- 2.1% of people had resistance to rifampicin
- 1.4% of people had resistance to ethambutol
We are not reporting on the proportion with resistance to pyrazinamide (and therefore the category of any first-line agent only includes rifampicin, isoniazid, and ethambutol) in 2023 to 2025 because the laboratory testing was adversely impacted by a problem with quality control in the supply chain for the media used for pDST for this drug. The manufacturer issued a Field Safety Notice in July 2024 stating that there may have been false detection of resistance from June 2023.
Figure 2. Drug resistance proportion of culture positive cases, England 2025.
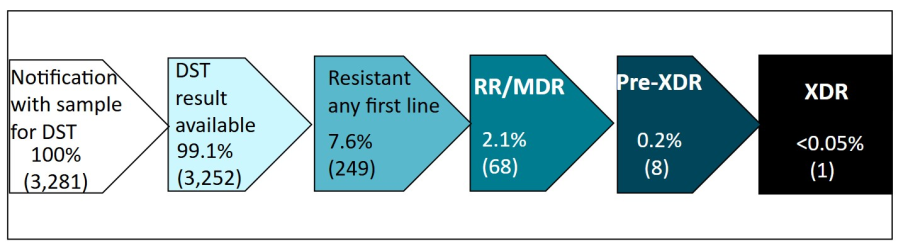
Note: resistance to any first-line drug excludes pyrazinamide for 2025.
Isoniazid-resistant TB
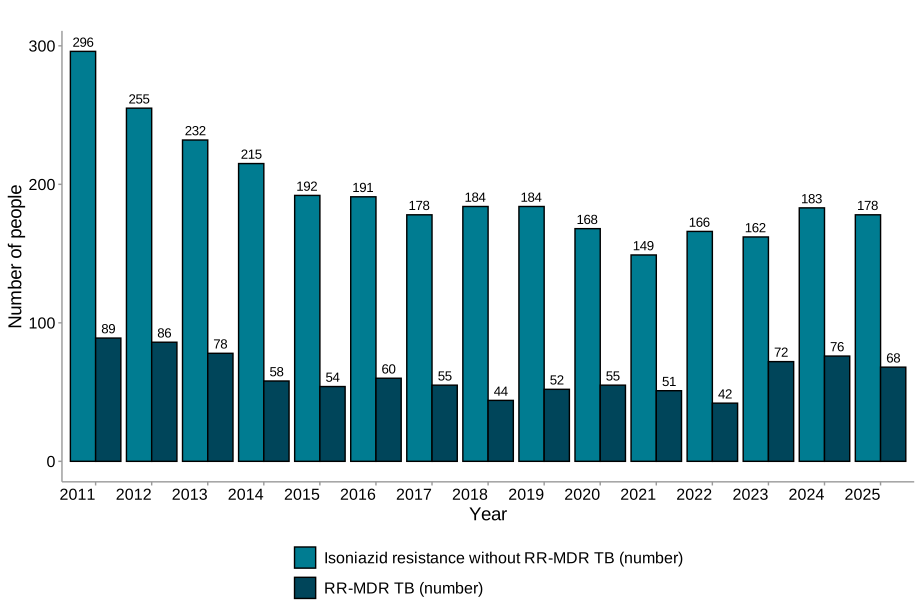
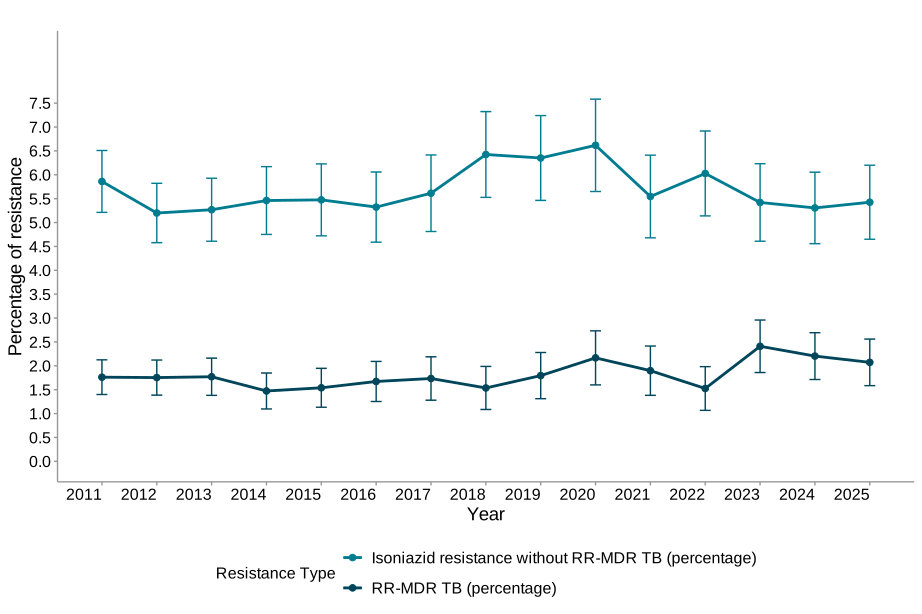
In 2025, 5.4% of individuals (178 of 3,281 culture positive) had isoniazid-resistant TB which was not additionally resistant to rifampicin. This proportion is consistent with previous years (see Supplementary Table 13 in the accompanying spreadsheet.
Multidrug-resistant (MDR) or rifampicin-resistant (RR) TB
In 2025, there were 68 (out of 3,281) individuals with culture confirmed MDR or RR TB, a small decrease from 2024 (76 individuals), but similar percentage of culture-positive individuals (2.1% in 2025, 2.2% in 2024) (see Figure 3 and Supplementary Tables 13, 14 and 15 in the accompanying spreadsheet).
One person developed resistance on treatment, consistent with previous years.
In addition, a further 27 individuals were treated as MDR or RR TB in the absence of culture confirmation. People may be treated for MDR or RR TB in the absence of culture confirmation if the diagnosis was made from a molecular test alone, made abroad or based on a close contact history with an individual known to have MDR or RR TB. In addition, individuals may be treated with an MDR regimen if they are unable to tolerate rifampicin-based combinations because of severe intolerances or critical drug interactions. Overall, 1.7% (95 out of 5,449) of people notified with TB were treated as having MDR or RR TB in 2025, similar to 2024.
Treatment of MDR or RR TB requires involvement of a specialist centre, and may require prolonged admission, especially for pulmonary disease, which places heavy burdens on local services.
A total of 67.6% of individuals with MDR or RR TB in 2025 had pulmonary involvement (see Supplementary Table 16 and 17). Contact tracing around individuals with MDR or RR TB is often complex and extensive.
In 2025, 60 individuals (88.2%) with MDR or RR TB were born outside the UK. Of these 58.3% had entered the UK within 5 years (see Supplementary Table 16 in the accompanying spreadsheet).
The breakdown of MDR or RR TB case numbers by UKHSA region is in Supplementary Table 18.
Figure 3. Number and proportions of RR-MDR TB and isoniazid resistance without MDR TB since 2011, England 2025
Testing and resistance to World Health Organization (WHO) group A and new and repurposed drugs (linezolid, clofazimine, moxifloxacin, levofloxacin, delamanid and bedaquiline)
WHO defines pre-extensively drug-resistant (pre-XDR) TB as MDR or RR TB with additional resistance to any quinolone, and XDR as MDR or RR TB which is also resistant to any quinolone and at least one additional group A drug (bedaquiline or linezolid) (WHO consolidated guidelines on drug-resistant TB).
Overall, the proportion of infections with MDR or RR TB which have additional resistance leading to classification as pre-XDR has increased slightly over time and was 11.6% in 2025 (see Supplementary Table 19). There were 8 individuals with XDR TB in England in the years 2018 to 2025 (see Supplementary Table 12 in the accompanying spreadsheet).
Details of resistance to other agents in individuals with MDR or RR TB are found in Supplementary Tables 19 and 20 in the accompanying spreadsheet.
Results of phenotypic testing for quinolones and new and repurposed agents including linezolid, bedaquiline, clofazimine and delamanid, are reported in this chapter for the third year. Susceptibility testing results for pretomanid, a key component of the short course all-oral MDR TB treatment regimen (WHO and NHSE) are reported for the second time this year.
Susceptibility testing for the new and repurposed antituberculous antibiotics is widely recognised as essential to support the use of these drugs and avoid further resistance development (Gunther and others, 2024).
In common with other WHO supranational reference laboratories, UKHSA is using lineage-specific breakpoints for pretomanid, although understanding of the clinical implications of this is limited (Koser, 2025).
Quinolone resistance was seen in 2.0% (65 of 3,281) of cultured isolates in 2025. The majority of this quinolone resistance is in people with MDR or RR TB (Figure 4) with the highest proportion in people with pre-XDR TB from India (see Supplementary Tables 19 and 21 in the accompanying spreadsheet).
Figure 4. Proportion of Quinolone resistance in the RR-MDR, isoniazid resistance without MDR and non MDR or isoniazid resistant cases, England 2025
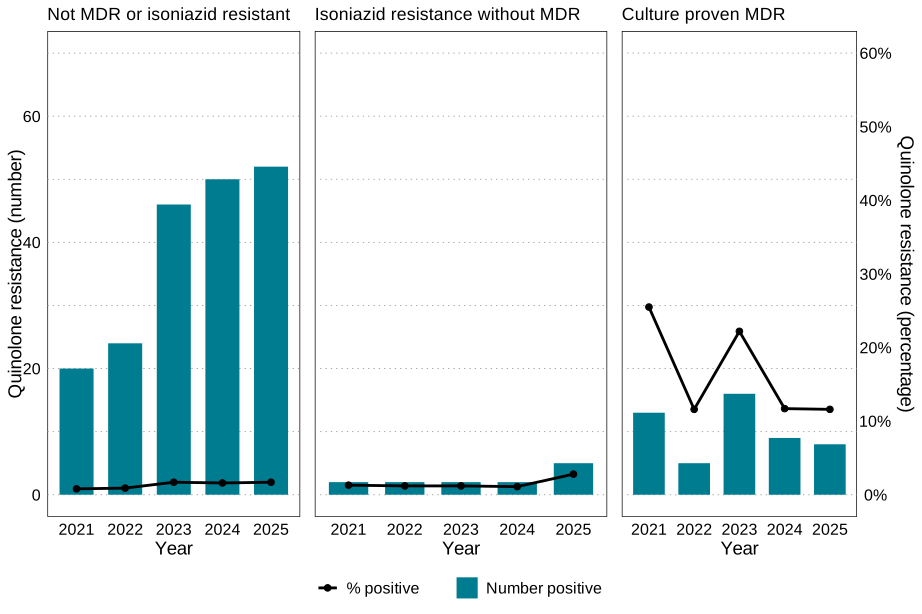
Phenotypic susceptibility testing for linezolid, bedaquiline, clofazimine, delamanid and pretomanid was performed for all MDR or RR TB in 2025 and in selected individuals with non RR-MDR TB treated with MDR regimens. Numbers of isolates tested for all these agents has increased sharply since 2022 and resistance proportions are presented on numbers tested between 2024 and 2025. Resistance to the new and repurposed agents was only found in RR or MDR isolates, and proportions were low for all of these drugs (see Supplementary Table 20). The drug from this group with the highest resistance in RR or MDR isolates was bedaquiline at 5.1% (8 out of 158) of tested isolates. Delamanid resistance was seen in 4.4% (7 out of 158), pretomanid in 3.6% (3 out of 84), clofazimine in 2.5% (3 out of 158) and linezolid in 0.8% (2 out of 265).
Increasing use of these agents and corresponding global emergence of resistant strains means that testing and surveillance need to be maintained. The complexity of the pDST testing for new and repurposed drugs mean that little information is available globally on the baseline resistance for these drugs, or of specific intrinsic resistance against these drugs for the distinct species and lineages.
Clustering
WGS also provides information on relatedness and potential transmission. In England, individuals with a positive culture are grouped into genomic clusters if they have at least one other individual within 12 single nucleotide polymorphisms (SNPs). This information is used to guide contact tracing and public health action. More information is found in the WGS handbook.
A total of 31.7% of individuals with a positive TB culture were part of a cluster in 2025 down from over 40% in 2019, but similar to 2024 (32.0%).
Figures showing the variation in the proportion of people in genomic clusters over time and by region are in Supplementary Table 22 in the accompanying spreadsheet.
Drug resistance in genomic clusters
In the period 2018 to 2025, the most common drug resistance in genomic clusters was isoniazid resistance without MDR or RR TB. This was found in 5.0% of individuals in a cluster, which is similar to the proportion of people with isoniazid resistance in the dataset as a whole.
A total of 177 individuals (38.1%) with MDR or RR TB between 2018 and 2025 were in a genomic cluster (see Supplementary Table 23), with similar likelihood of being in a cluster as people without RR or MDR disease.
Risk factors for being in a genomic cluster
Males, people aged 0 to 14 and 15 to 24 are more likely to be in genomic clusters, as are people with pulmonary disease and those born in the UK (Figure 5 and Supplementary Table 23). Individuals with pulmonary disease are the most likely to be infectious and so transmit TB to other people, resulting in clustering. Younger individuals and those born in the UK are more likely to have been exposed to TB in the UK relatively recently, which increases the likelihood that there will be a genomically-related individual in England. The presence of any social risk factor nearly doubles the likelihood of being in a cluster (relative risk 1.9), with drug misuse and history of incarceration having the highest risks. This is related to increased contact between individuals at high risk of having TB.
People born outside the UK who are recorded as having asylum seeker status are twice as likely to be in a cluster than non-UK born individuals not seeking asylum (relative risk 2.0, confidence intervals 1.9 to 2.2). It is unclear if this represents transmission in the UK, recent transmission en route, or due to recent outbreaks caused by failing healthcare in the countries from where asylum seekers travel. History of incarceration and drug misuse remain the social risk factors with the highest relative risk of clustering (Appendix Figure A6).
Figure 5. Risk Ratios of being in a genomic cluster, univariable analysis of aggregate data 2018 to 2025, England
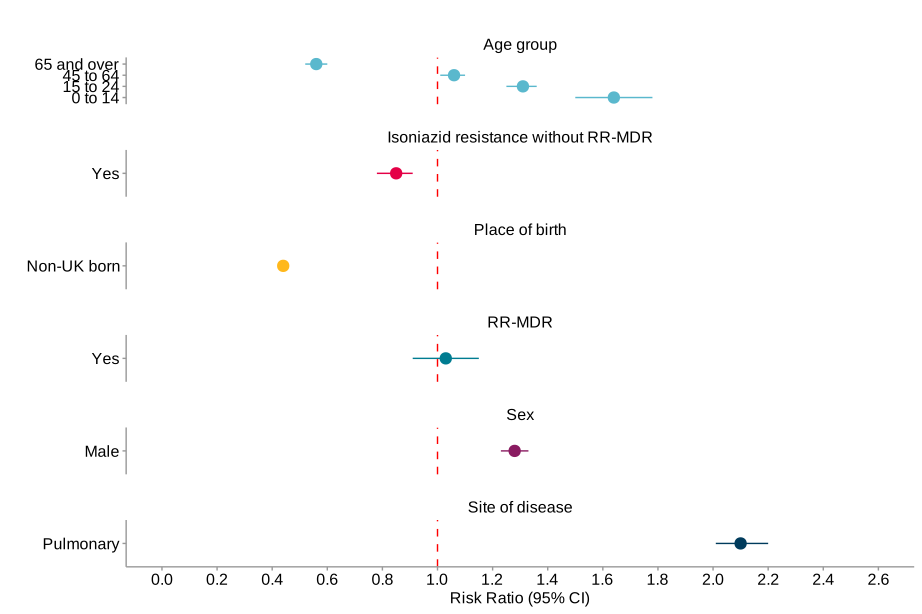
Note: only culture positive cases are considered. The reference categories are: 25 to 44 years for age, non-pulmonary for site of disease, female for sex, UK born for place of birth, non-RR-MDR and non-isoniazid resistance without RR-MDR for the resistance categories: these all have a risk ratio of 1 (see Supplementary Table 23 in the accompanying spreadsheet).
Appendix
Figure A1. Box plot of the number of days between symptom onset and diagnosis, 2018 to 2025, England
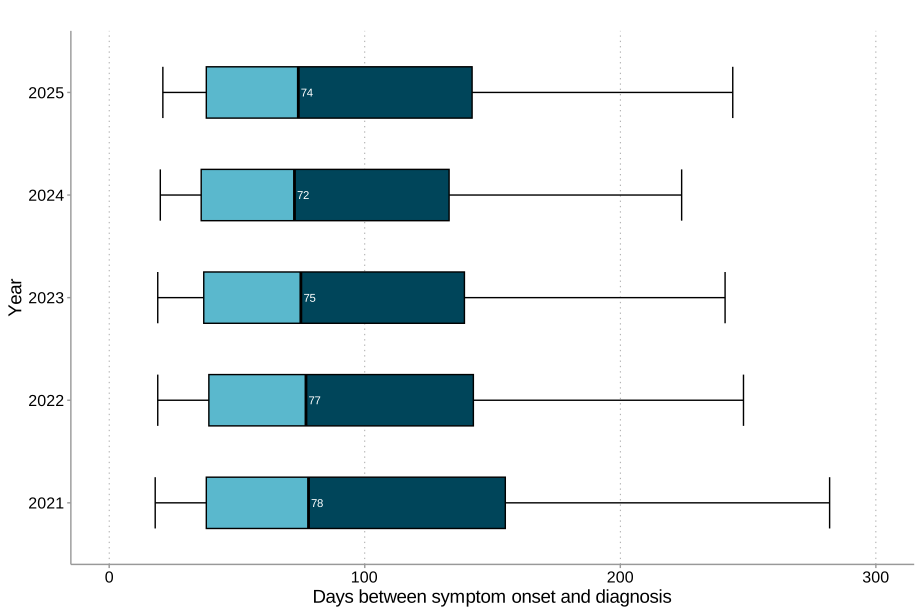
Whiskers show 10th and 90th percentile, box represents 25th and 75th percentile, median is indicated by the number.
Missing data: 132 people notified post mortem, 12 people with diagnostic delay under 0 days and 1,974 people with missing data (all due to missing symptom onset date) out of 13,216 pulmonary infections, are not reported
Figure A2. Box plot of the number of days between presenting to healthcare service and diagnosis, 2018 to 2025, England
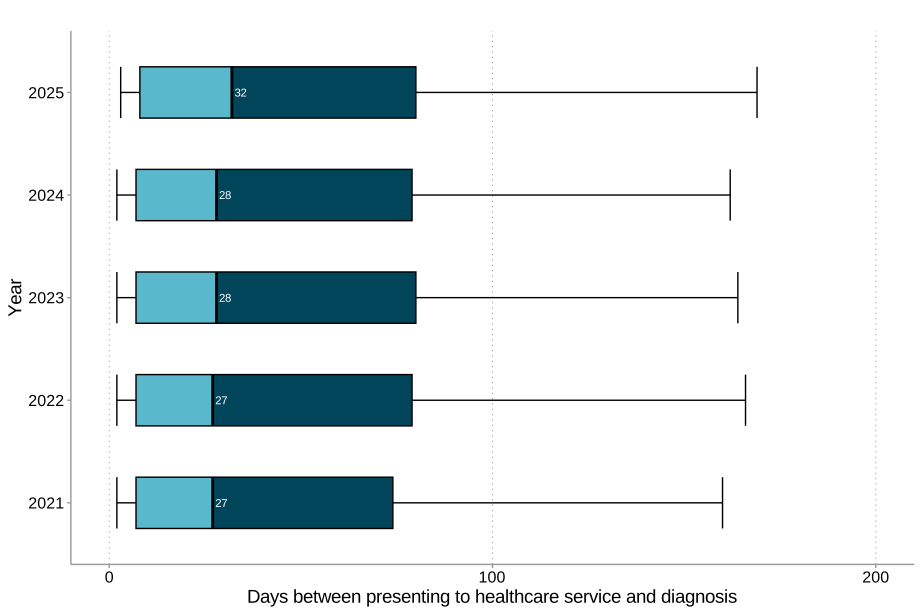
Whiskers show 10th and 90th percentile, box represents 25th and 75th percentile, median is indicated by the number.
Missing data: 132 people notified post mortem, 49 people with healthcare associated delay under 0 days and 496 people with missing data (all due to missing first presentation date) out of 13,216 pulmonary infections, are not reported.
Figure A3. Duration from tuberculosis (TB) diagnosis to notification by year, 2018 to 2025, England
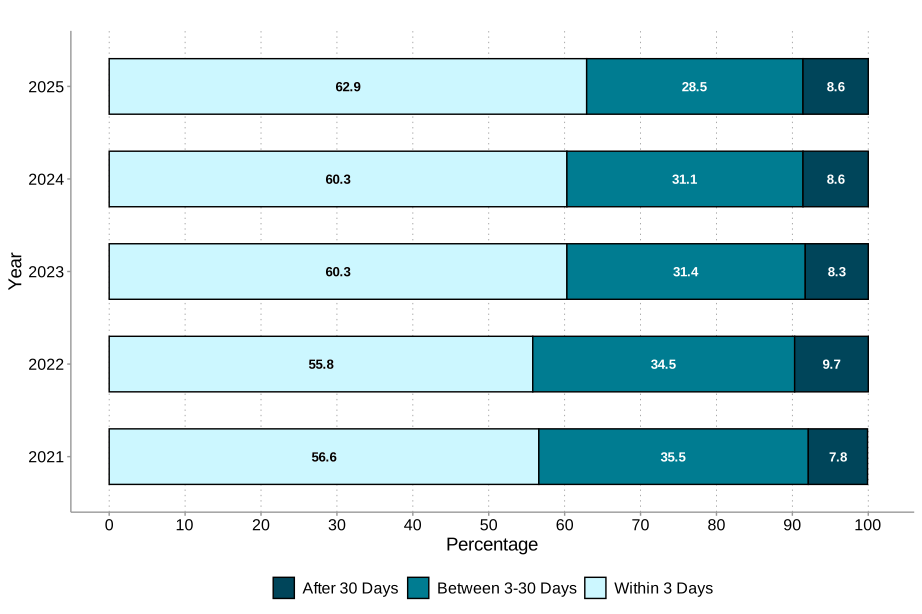
Figure A4. Duration from tuberculosis (TB) diagnosis to notification by UKHSA region, 2025 only, England
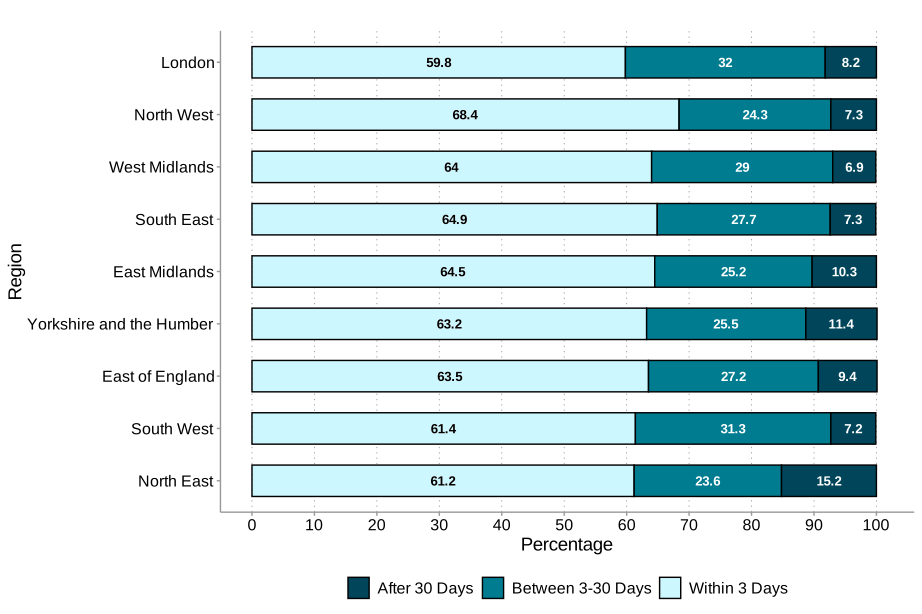
Figure A5. Proportion of people with culture confirmation by UKHSA region, England 2025
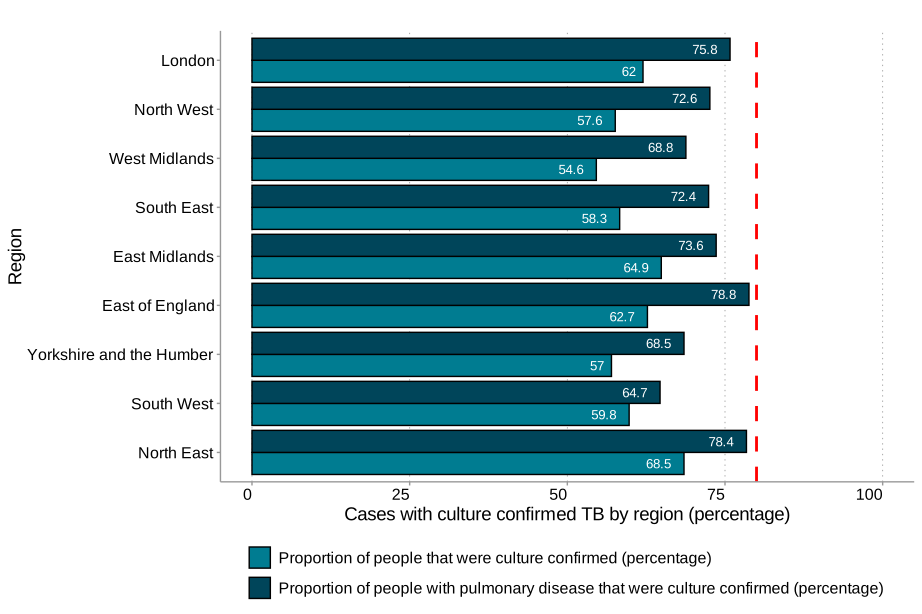
Figure A6. Risk ratio between presence of social risk factors and belonging to a cluster univariable analysis of aggregate data 2018 to 2025, England
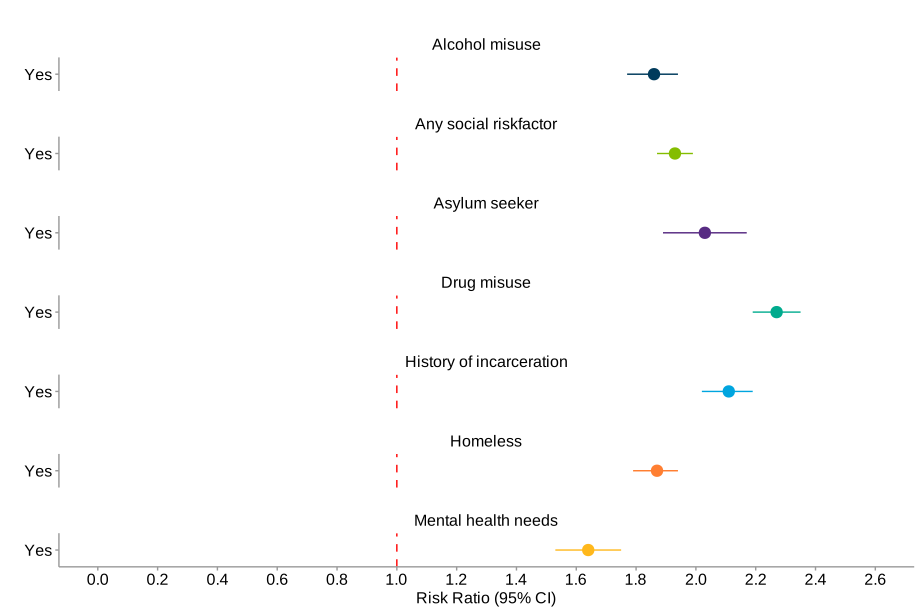
Risk ratio of social risk factors associated with being in a cluster, of note only culture positive cases are considered. The reference categories for each social risk factor is not possessing the social risk factor, these all have a risk ratio of 1 (see Supplementary Table 23 in the accompanying spreadsheet).
Note: the effect of being an asylum seeker is only evaluated in the non-UK born population.