Chapter 2. Tuberculosis prevention, England, 2025
Published 29 October 2026
Applies to England

© Crown copyright 2026
This publication is licensed under the terms of the Open Government Licence v3.0 except where otherwise stated. To view this licence, visit nationalarchives.gov.uk/doc/open-government-licence/version/3 or write to the Information Policy Team, The National Archives, Kew, London TW9 4DU, or email: psi@nationalarchives.gov.uk.
Where we have identified any third party copyright information you will need to obtain permission from the copyright holders concerned.
This publication is available at https://www.gov.uk/government/publications/tuberculosis-in-england-2026-report/chapter-2-tuberculosis-prevention-england-2025
Main points
The main points of this chapter are:
- in 2025, 588,113 applicants for long term visas from high tuberculosis (TB) incidence countries were screened for pulmonary TB (PTB) before entry to the UK, a decrease for the second year running after the peak in 2023 (1,257,723). 268 people were diagnosed with PTB through the pre- entry programme in 2025, a lower number but similar case detection rate to 2024
- the number of new entrant migrants eligible for the NHS England (NHSE) Latent TB infection (LTBI) testing programme in 2025 decreased by 12.4% compared with 2024 to 206,092 individuals. 13.2% of those eligible in 2025 were tested. This increased to 17.0% when including individuals whose eligibility based on country of birth could not be verified
- in 2025, 15% of people tested had a positive result for LTBI, which was slightly lower than in 2024 (16%)
- 532 new entrant migrants (0.38% of tested from 2016 to 2025) were notified with active TB soon after LTBI testing and were likely diagnosed with their active TB sooner through being seen as part of the LTBI programme
- of 140,089 people tested through the NHSE LTBI programme from 2016 to 2025, 484 people who tested positive for LTBI were subsequently notified with active TB, of whom only 4 were reported to have completed treatment for LTBI
- in 2025 from 2,862 people notified with pulmonary TB in England, screening 6,337 close contacts (69.5% of those identified) resulted in the identification of 1,124 people with LTBI (17.7% of those screened) and 136 people with active TB disease
- the Bacille Calmette Guerin (BCG) neonatal vaccination programme is a risk-based programme recommended for individuals at higher risk of exposure to TB. BCG coverage at 3 months of age for eligible infants in England was 77.0% in 2025, similar to previous years
Supplementary tables
The data behind the charts in this chapter can be found in the accompanying spreadsheet, which is available to download.
UK pre-entry TB screening programme
In 2025, 82.3% of all people notified with TB in England with known place of birth were born outside the UK (see TB incidence and epidemiology chapter). The UK pre-entry TB screening programme is intended to reduce the importation of active pulmonary TB among applicants for long-term visas. Migrants from high TB incidence countries (more than 40 per 100,000) are screened for active pulmonary TB by symptom review and chest X-ray (CXR) when applying for a long-term (more than 6 months) UK visa (UK tuberculosis technical instructions).
Screening numbers over time, by country and screening provider
The programme has operated in 102 countries since 2014 (see Supplementary Table 1).
In 2025 there were 588,113 people screened, a decrease of 18.8% from 724,332 in 2024 (see Figure 1 and Supplementary Table 2). This is the second consecutive year in which screening numbers have declined, correlating with the reduction of migration because of policy changes in 2024 (see the Office for National Statistics report Long-term international migration, provisional). Screening is provided by either International Organization of Migration (IOM) or non-IOM clinics. Detailed analysis is reported for the provider types separately due to issues with data completion from non-IOM providers. Some countries have both types of providers (see Supplementary Table 1 for more details).
The rollout of a new digital platform for data collection commenced in October 2025 to improve data quality and completeness across both clinic provider types. As data reconciliation between the current system and the new platform is not yet complete, approximately 4,000 records from 8 clinics are currently unavailable for analysis, representing less than 1% of all screens. This data will be included in future reporting.
Figure 1. Number of people screened by screening provider, 2014 to 2025
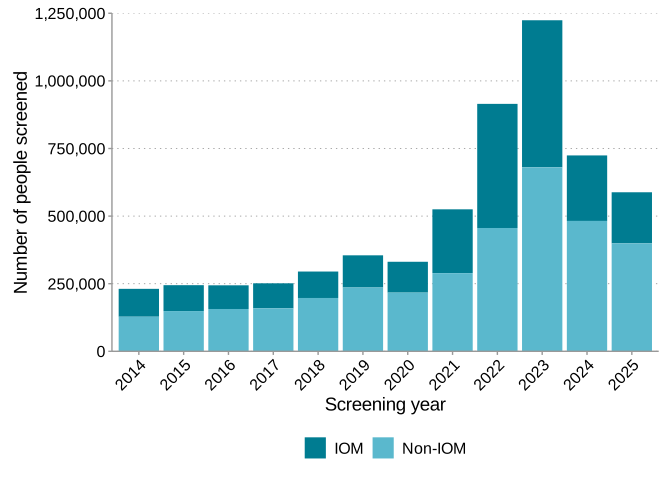
Data used to create Figure 1 can be found in Supplementary Table 2.
The largest number of people screened in 2025 were in India (155,988, 26.5%), followed by China (100,404, 17.1%) and Pakistan (78,845, 13.4%) (see Table 1 and Supplementary Table 3). In comparison to 2024, the number of people screened in countries shown in Table 1 all decreased, apart from Nigeria which increased by 8.0% (62,814 compared to 57,805).
Table 1. Number of reported screening episodes and people screened by country of screening in 2025
| Country of screening | Number of screening episodes | Number of people screened | Percentage of people screened by country |
|---|---|---|---|
| India | 160,300 | 155,988 | 26.5 |
| China | 100,982 | 100,404 | 17.1 |
| Pakistan | 80,443 | 78,845 | 13.4 |
| Nigeria | 64,158 | 62,814 | 10.7 |
| Nepal | 29,961 | 29,411 | 5.0 |
| Bangladesh | 25,679 | 25,062 | 4.3 |
| Ghana | 19,635 | 19,160 | 3.3 |
| Sri Lanka | 11,068 | 10,820 | 1.8 |
| Other | 107,556 | 105,726 | 18.0 |
| Total | 599,782 | 588,113 | 100.0 |
Note to Table 1: the table is ordered by number of screens per country and limited to countries reporting more than 10,000 screening episodes. Some individuals were reported as having been screened more than once, accounting for the difference between the number of screening episodes and people screened. Some people were also screened in more than one country, so the total of people screened is less than the sum of people screened in each country. For a detailed breakdown of all countries by service provider see Supplementary Table 3.
Age, sex and visa type of screening population
Age was known for 84.7% of screening episodes (507,989 of 599,782). The greatest proportion of screens in 2025 was among people aged 20 to 29 (55.5%; 281,767 of 507,989 episodes with known age) (see Appendix figure A1(A) and Supplementary Table 4). The proportion of males and females screened in each age category was similar with an overall proportion of 52.4% males (266,052 of 507,940 where sex was known) (see Supplementary Table 5 for more details).
Student visas accounted for the largest proportion of screens with a known visa type (62.4%; 317,066 of 507,915) followed by work visas (17.1%; 86,829 of 507,915) and settlement and dependents’ visas (16.3%; 82,948 of 507,915). The proportions changed across age categories. See Appendix Figure A1(B) and Supplementary Table 6 for more details).
TB case detection rate by the programme
In 2025, 268 people were diagnosed with pulmonary TB by the programme, which is a decrease from 343 in 2024 (see Figure 2 and Supplementary Table 7 ). The overall TB case detection rate was 45.6 per 100,000 (95% Confidence interval (CI) 40.1 to 51.0); 92.0 (95% CI 78.4 to 105.7) for IOM clinics and 23.6 (95% CI 18.8 to 28.3) for non-IOM clinics. Despite a reduction in TB diagnoses in 2025, the overall TB case detection rate remained similar to the previous year (47.4 per 100,000).
Figure 2. Number of people with confirmed TB (panel A) and TB case detection rate (panel B) by screening provider, 2018 to 2025
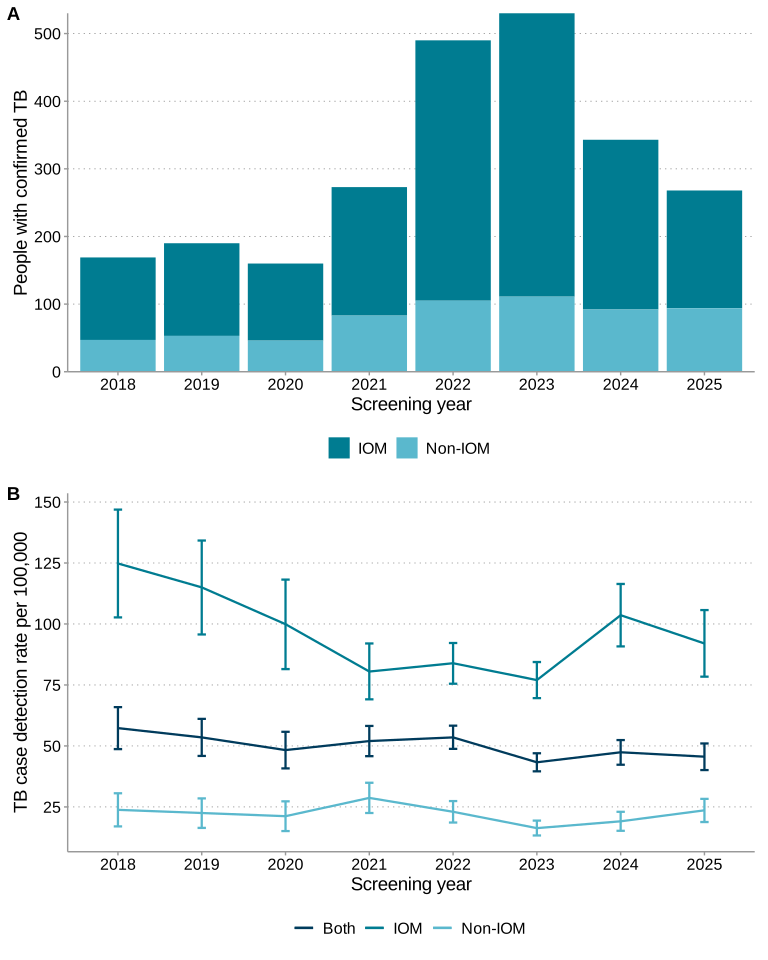
Note to Figure 2: data is presented from 2018 due to earlier data quality and a change in methodology affecting non-IOM clinics – for more information see the Methodology and data sources chapter of this report.
Data used to create Figure 2 can be found in Supplementary Table 7.
TB detection rates were lower in non-IOM screening clinics; however, sputum test results were incomplete for 43.7% (1,625 out of 3,722) of sputum referrals, due to pending results, loss to follow-up, and unknown reasons, and this is likely to result in an underestimate of the true rate of detection. Incomplete sputum results in IOM clinics were noticeably lower at 14.6% (717 out of 4,896). In non-IOM data, applicants with an abnormal CXR but no sputum culture result who were recorded as ‘TB suspected’ were considered possible TB cases (see Methodology and data sources chapter of this report). If people with possible TB were included (Appendix Figure A2) the total number of people with active TB in 2025 was 1,047. This results in a TB case detection rate that is higher in non-IOM compared with IOM clinics and, therefore, is most likely an overestimate.
Data reflecting the diagnostic flow resulting in a person being diagnosed with culture-confirmed or clinically diagnosed TB reported by IOM clinics and non-IOM clinics is shown in Appendix Figures A3 and A4 and Supplementary Table 8.
Demographics of individuals diagnosed with TB
In 2025, the highest case detection rate was from people screened in the Philippines (254.9 per 100,000, 95%CI: 150.9 to 358.9), followed by Nepal (176.8 per 100,000, 95%CI: 128.8 to 224.8), where the greatest number of people with confirmed TB were diagnosed. Both countries had most or all screens from IOM clinics (see more detail in Supplementary Table 3).
Age, sex and visa type information of individuals diagnosed with TB in the programme were analysed over 3 years between 2023 and 2025. TB case detection rate was similar in males (44.9 per 100,000, 95%CI: 41.0 to 48.7) and females (42.6 per 100,000, 95% CI: 38.7 to 46.5). The TB case detection rate increased with age. It was 42.6 per 100,000 (95%CI: 38.7 to 46.5) in the largest age group of 20 to 29 years, significantly increasing in each subsequent age group, reaching 312.2 per 100,000 (95%CI: 205.9 to 418.6) in those aged 60 years or more (see Appendix Figure A5). The case detection rate in people with student visas was significantly lower at 30.5 per 100,000 (95% CI: 27.1 to 33.8) than people with other visa categories (see Appendix Figure A6). See Supplementary Table 9 for more details.
Drug susceptibility in culture-confirmed TB cases
TB culture and drug susceptibility testing (DST) is a mandatory requirement under the UK tuberculosis technical instructions. Very limited conclusions can be drawn about drug resistance in the pre- entry screening cohort due to incomplete data returns. While culture confirmation is reported for 82.1% (220 out of 268) individuals with confirmed TB in 2025, this is mainly from countries covered by IOM clinics and excludes a number of high burden countries for multidrug-resistant (MDR) disease. Drug susceptibility is reported for 72.7% (160 out of 220) of individuals with culture-confirmed TB (see Table 2 and Supplementary Table 10).
Table 2. Drug resistance in people with culture-confirmed tuberculosis in both IOM and non-IOM clinics in 2025
| Drug susceptibility category | Number of people with positive sputum culture | Percentage of total positive sputum cultures (total = 220) |
|---|---|---|
| Isoniazid mono-resistant | 13 | 5.9 |
| Mono-resistant other | 1 | 0.5 |
| Multidrug-resistant or rifampicin-resistant | 3 | 1.4 |
| Pre-extensively drug-resistant | 1 | 0.5 |
Note to Table 2: drug sensitivity results were reported for 160 of 220 positive cultures in 2025; 142 were sensitive to all drugs tested.
Table 2 shows drug resistance in people with culture-confirmed tuberculosis in 2025 in both IOM and non-IOM clinics as defined under the 2021 World Health Organization (WHO) TB DST definitions. See Supplementary Table 10 for more details and a breakdown by screening provider and country.
Screening of Hong Kong British National Overseas (HK BN(O)) visa applicants in the UK
There are a number of people who can undergo pre-entry screening from within the UK when applying for a Hong Kong British National Overseas (HK BN(O)) visa (see Background information for more details).
Between 2022 and 2025, 2,895 HK BN(O) visa applicants were screened in the UK, 121 CXR results were abnormal suggestive of TB, and no applicants were diagnosed with active TB.
Table 3. Number of people screened in the UK for HK BN(O) visa applications
| Year of screening | Number of people screened | Number of CXRs suggestive of TB | Number of people with confirmed TB |
|---|---|---|---|
| 2022 | 743 | 26 | 0 |
| 2023 | 705 | 31 | 0 |
| 2024 | 886 | 40 | 0 |
| 2025 | 575 | 24 | 0 |
Note to Table 3: some people were screened in more than one year, so the total of people screened is less than the sum of people screened in each year.
NHS England latent tuberculosis infection (LTBI) testing and treatment programme for new entrant migrants
The NHS England LTBI programme was commissioned in areas with higher TB rates in 2015 and became widely operational in 2016. At the time of programme initiation the units of commissioning were clinical commissioning groups, that are roughly equivalent to current sub-Integrated Care Boards (SICBs). In 2025, 22 out of 36 ICBs were programmatic. Within each ICB, the proportion of SICBs participating in 2025 varied.
Individuals are eligible for testing in the programme if they migrated to England from a high TB incidence country (more than 150 per 100,000 population or any country in sub-Saharan Africa) and are 16 to 35 years of age at the time of testing. The programme targets people who have registered with a GP within an estimated year of entry to the UK but individuals are eligible to be tested for up to 5 years after entry to the UK (see National latent tuberculosis infection testing and treatment programme).
This report describes test data from individuals with known eligibility criteria separately to those who were tested through the programme but for whom country of birth or migration could not be verified and whose data therefore was not migrated into the new LTBI platform, but who were previously accepted as tested as part of the programme (see the Methodology and Definitions chapter). The total target population was the sum of GP registrations from eligible individuals in a calendar year plus the number of tested individuals with verified eligibility who were not identified in the GP registration data (please see the Methodology and definitions chapter for more details including about the numbers of people excluded due to not meeting programmatic criteria).
Proportion of eligible new entrant migrants tested
The number of people eligible for testing doubled between 2021 (151,003 individuals) and 2023 (305,695 individuals) but has since decreased to 206,092 in 2025. (Figure 3 and Supplementary Table 11). In 2025, 13.2% (27,296 people with verified eligibility) of the target population were tested, similar to 2024 and increased compared with previous years for both number and percentage of eligible migrants tested. This is below the initial annual goal of the programme to test 25% of eligible new entrant migrants; but exceeds the original commissioned number of 20,000 tests annually.
Figure 3. Number of eligible new entrant migrants and number tested by year with the proportion tested England from 2016 to 2025
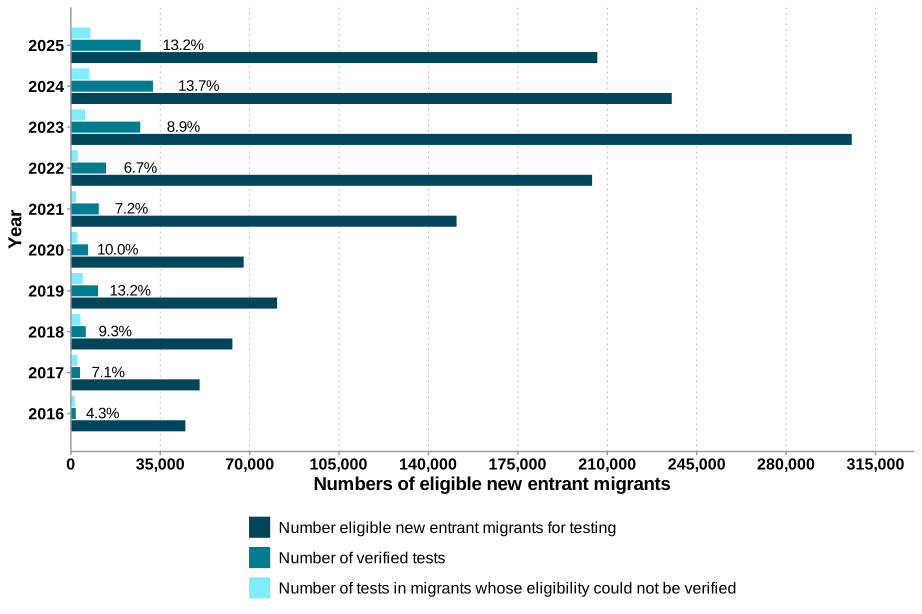
Note for Figure 3: the percentage of eligible population tested is calculated using only the verified test number
In 2025 test data was received for a further 7,684 people whose full eligibility could not be verified (mostly missing country of birth or travel), but when included, as has been in the past, would increase the percentage tested to 17.0%, similar to 2024. (Supplementary Table 11).
Data used in Figure 3 can be found in Supplementary Table 11 and by UKHSA region, ICB and SICBL for each year in Supplementary Tables 12 and 13 and 14 of the accompanying data set.
Numbers tested by UKHSA region from 2016 to 2025 are shown in Appendix Figure A7. London, with the highest number of eligible migrants, has the most people tested each year, but the proportion of people tested was highest outside London. In 2025, Yorkshire and the Humber tested the greatest proportion at 33.2% (with the second largest number of tests) and North West the least at 4.8% (Supplementary Table 12). This may reflect challenges in TB services. Two ICBs tested over 30% of the target eligible population: South Yorkshire (33.5%) and West Yorkshire (33.1%) (Supplementary Table 13). At SICB level, NHS West Yorkshire ICB - X2C4Y (Kirklees) within West Yorkshire ICB tested the highest proportion at 80.2% (1,183 people tested). NHS West and North London ICB - W2U3Z SICB within North West London ICB tested the greatest number of people (8,308) but only 17.6% of their total eligible target population. In 2025, nearly half of the reported tests in people whose eligibility could not be verified were from 2 SICBs: North West London (NHS West and North London ICB - W2U3Z) and North East London (NHS North East London ICB - A3A8R). If these are included test coverage in these SICBs would have reached 26.7% and 22.5%. (Supplementary Table 14).
Demographic characteristics of eligible new entrant migrants who were tested compared with those who were not tested, aggregated over the period 2016 to 2025 can be seen in Supplementary Table 15. Age and sex were similar between those who were tested and not tested.
In 2025 the greatest number of eligible new entrant migrants were born in or travelled from India (82,580). However, the countries with the highest proportion of eligible new entrant migrants tested were Afghanistan (22.1%) and Bangladesh (19.3%) (see Table 4).
Proportion of people testing positive
In 2025, 4,265 people for whom eligibility could be verified, tested positive for latent TB (15.6%), lower than in 2024 (5,253,16.3%) (see Figure 4). If test data for people whose eligibility could not be verified were included, the rate of the proportion testing positive decreased in all years and in 2025 was 14.4% (see Appendix Figure A9).
Figure 4. The number of tests and positive tests in people with verified eligibility, in England from 2016 to 2025
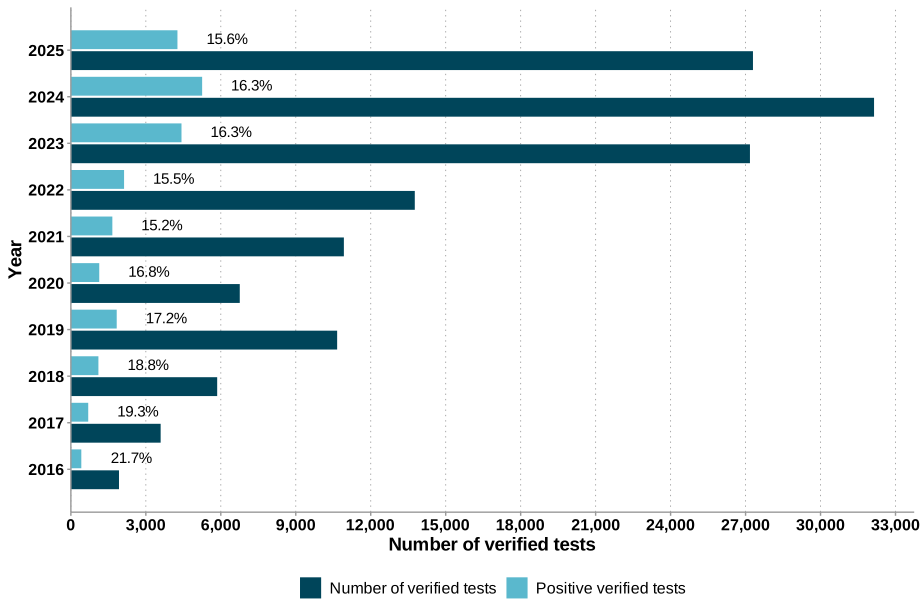
Figure 4 notes:
- The proportion of positive tests can be found at the end of the positive test number bar.
- Only tests where eligibility criteria were verified were used.
Data used this figure can be found in Supplementary Table 16.
LTBI testing and rates of the proportion testing positive by country of birth or migration
In 2025 the top country of birth or travel for eligible new entrant migrants tested through the programme was India with nearly 11,000 people tested, equivalent to 13.3% of the eligible target population with India recorded as their country of birth. The proportion testing positive ranged from 7.9% for people from Bangladesh and 9.9% in people from Ghana to close to 30% for people from Sudan, Somalia and Eritrea (see Table 4). The range in the proportion testing positive does not correspond to the range in reported national TB incidence for 2024 (WHO Global TB report 2025), suggesting that the risk of infection in the groups who migrate may not be representative of the overall rate in their country of birth. The proportion of people tested through the NHS LTBI programme who may have additional risk factors for TB such as seeking asylum is not known.
In 2025, the top 10 countries of birth of people tested were similar to 2024, with Somalia replacing Zimbabwe but the other countries remaining the same.
Table 4. LTBI testing rates and proportion testing positive for the top 10 countries by number of eligible new migrants, England, 2025
| Country of birth | WHO rate per 100,000 population [note 1] | Number of eligible new entrant migrants | Number of eligible new entrant migrants tested | Percentage eligible new entrant migrants tested | Positive tests | Proportion testing positive |
|---|---|---|---|---|---|---|
| India | 187 | 82,580 | 10,967 | 13.3 | 1,677 | 15.3 |
| Pakistan | 266 | 35,579 | 4,950 | 13.9 | 545 | 11.0 |
| Nigeria | 219 | 15,929 | 1,960 | 12.3 | 384 | 19.6 |
| Nepal | 227 | 15,026 | 944 | 6.3 | 139 | 14.7 |
| Bangladesh | 221 | 11,268 | 2,173 | 19.3 | 172 | 7.9 |
| Afghanistan | 203 | 6,450 | 1,426 | 22.1 | 245 | 17.2 |
| Eritrea | 115 | 6,020 | 764 | 12.7 | 237 | 31.0 |
| Ghana | 126 | 4,407 | 730 | 16.6 | 72 | 9.9 |
| Sudan | 47 | 3,825 | 526 | 13.8 | 153 | 29.1 |
| Somalia | 151 | 3,482 | 612 | 17.6 | 179 | 29.2 |
Note to Table 4: WHO rate from 2024.
Data used in this table can be found in Supplementary Table 17 of the accompanying data set.
The proportions of people testing positive by country between 2016 and 2025 and found in Supplementary Table 17.
Proportion of new entrant migrants diagnosed with LTBI who complete prophylactic treatment.
In 2025, 745 of the 4,265 people (17.5%) who tested positive for LTBI were recorded as having initiated prophylactic treatment. Of the individuals who were recorded as initiating treatment 90.5% (674 people) completed it. Overall, recorded treatment completion for the cohort testing positive was 15.8%. This was lower than in 2024 (17.0%, 895 people) and 2023 (20.4%, 902 people) (see Figure 5 and Supplementary Table 18). Missing start and completed information is shown in Supplementary Table 18.
The lower treatment completion rate in 2025 may in part result from delays in updating treatment information in the LTBI system. There is a shorter follow-up period for those testing positive in 2025. Additionally, TB treatment drug shortages resulting in prioritisation of treatment of people with active TB and high- risk close contacts may have impacted prophylactic treatment in the migrant testing programme. However, the large amounts of missing data on treatment uptake and completion, particularly for the regions with the most positive tests (see Figure A9) mean these figures should be interpreted with caution. Currently, ICBs receive reimbursement from the NHSE national programme for tests completed but not for recording treatment completion data. Testing and treatment are often delivered by different services, with treatment outcome data not necessarily shared with the service responsible for programme reporting.
Figure 5. The numbers of LTBI positive tests in in people with verified eligibility, completed treatments and proportion of treatments completed in England from 2016 to 2025
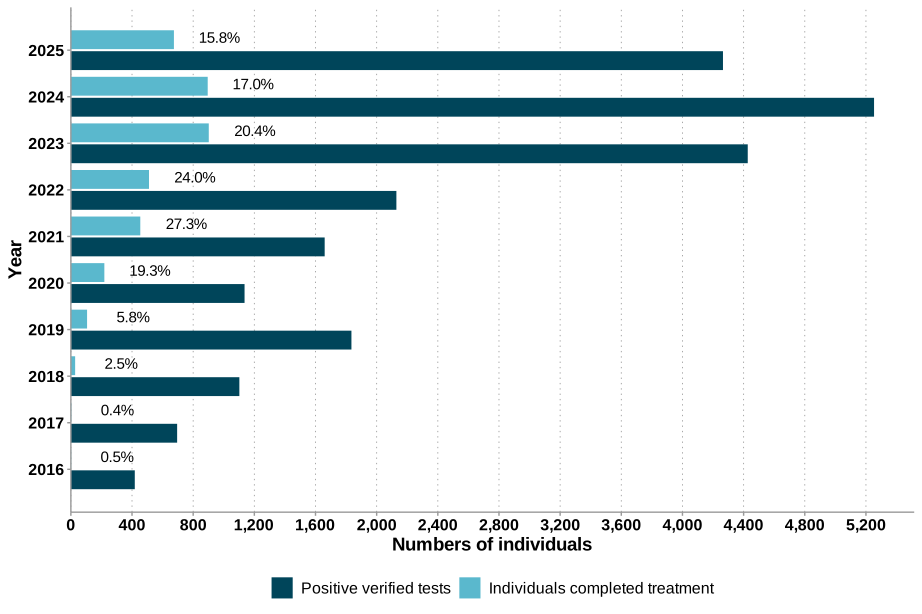
Figure 5 notes:
- Percentage completion can be found at the end of the completed treatment bar.
- Data used only included those with a country of birth.
Data used this figure can be found in Supplementary Table 18.
Treatment uptake and completion data including those missing a start and completion date for 2016 to 2025 by UKHSA region, ICB and SICB level are presented in Supplementary Tables 12, 13 and 14. These demonstrate large variation in treatment completion between areas. At the regional level, in 2025, treatment completion was over 40% in 3 regions, but combined these regions included relatively few individuals (Figure 6). When examined by SICB treatment completion rates ranged from 2.0% (1 out of 51 people with latent TB infection) in NHS Derby and Derbyshire ICB-15M SICB to 69.1% (96 out of 139 people with latent TB infection) in NHS Thames Valley ICB-U2G6B SICB.
Treatment completion in those recorded as initiating prophylactic treatment ranged from 60.0% to 100.0% with 12 out of 21 SICBs reporting treatment completion over 90% and another 6 SICBs more than 80%. This suggests that high levels of treatment completion are possible in people who start treatment. However, it is also possible that treatment start data is less likely to be entered for people who do not complete, leading to an overestimate of treatment completion in this group.
Proportion of positive LTBI tests by demographic characteristics
The proportion of positive tests increased with age and was higher in males (Figure 6). Since 2016 the proportion of positive tests has reduced in the older age groups. (Supplementary Table 19).
Figure 6. Proportion of positive LTBI tests in different age groups by sex England in 2025
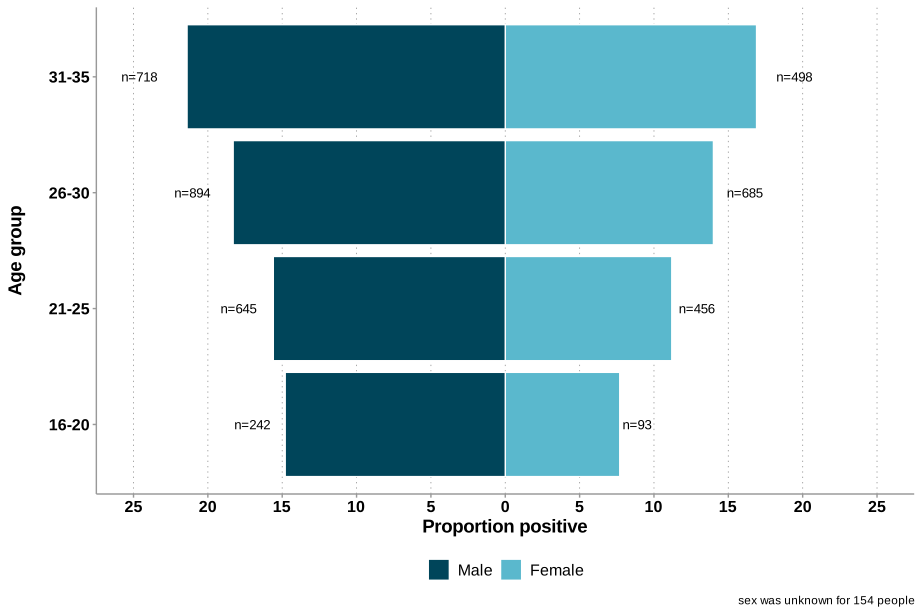
Data used figure 6 can be found in Supplementary Table 19.
Active TB disease in new entrant migrants tested and not tested through LTBI programmatic testing
Figure 7 shows the following 3 populations from 2016 to 2025 and how they overlap:
- Total target eligible population defined as the sum of the target eligible populations identified through GP registration data over this period.
- Total tested by the programme.
- Total active TB notifications.
Between 2016 and 2025, 140,089 LTBI tests on individuals with verified eligibility were conducted through the NHSE LTBI programme out of an estimated total eligible population of 140,1663 (10.0%). Between 2016 and 2025, 1,168 people (0.8%) who had been tested by the programme during the same period were notified with active TB disease. Nearly half of these (532) occurred within 90 days of being tested for LTBI and were therefore classified as probable co-prevalent active TB. Participation in the programme may have expedited diagnosis, although this cannot be established from these data (Figure 7). Between 2016 and 2025 an additional 3,942 people who were eligible for LTBI testing but not tested were notified with active TB (0.31% of 1,264,912 people). Between 2016 and 2025 an additional 3,749 people who were eligible for LTBI testing but not tested were notified with active TB (0.30% of 1,252,842 people).
Figure 7. Venn diagram showing populations of GP registered eligible new entrant migrants, NHSE LTBI tested population and notifications of active TB from the national TB surveillance system in England from 2016 to 2025
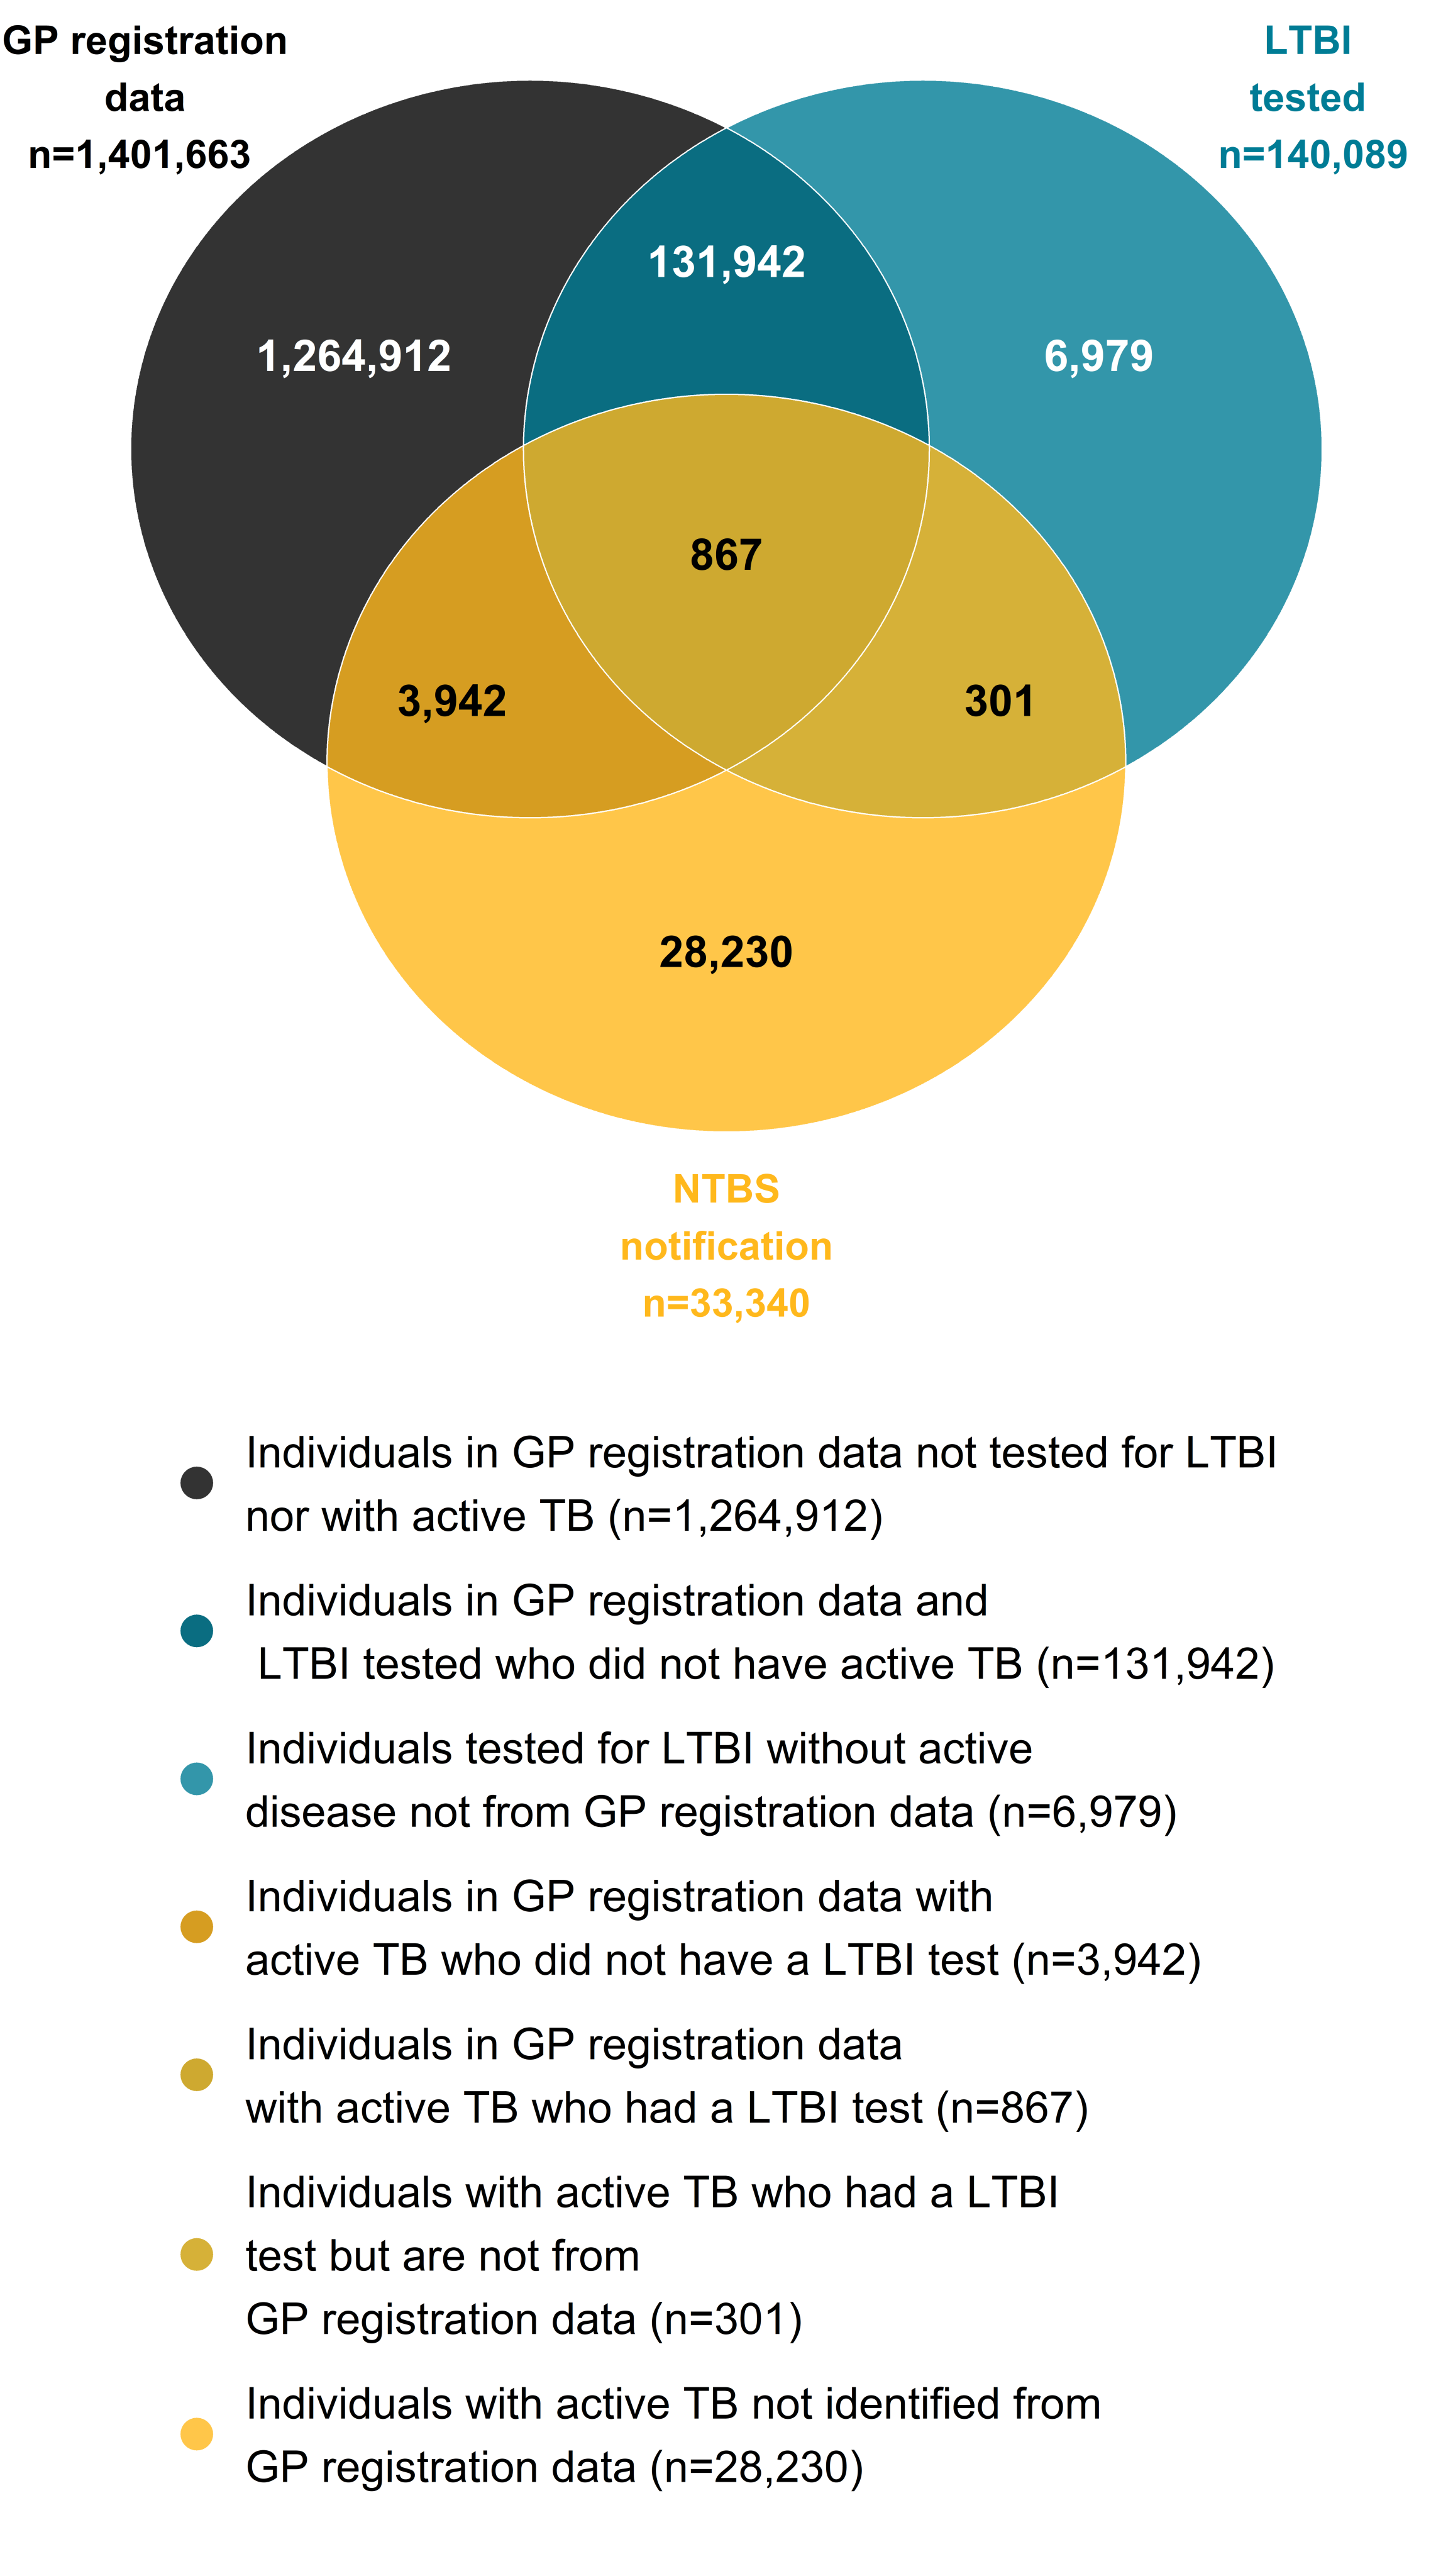
In 2025, 143 of 187 people with active TB identified from the 2025 cohort of people tested for LTBI under the NHSE national programme were notified within 90 days of an LTBI test (Table 5). As follow-up time increases the proportion of subsequent active TB cases is expected to increase for each testing year, and therefore the relative proportion of probable co-prevalent cases (those notified within 90 days) decrease (Table 5).
Table 5. Proportions of people subsequently notified with active TB by LTBI test year between 2016 and 2025 in England
| Year | Number of verified tests | Number of LTBI tested people with active TB | Percentage of people tested for LTBI with Active TB | Active TB within 90 days of LTBI test | Percentage of active TB notified within 90 days of LTBI test | Active TB 90 days or more after LTBI test |
|---|---|---|---|---|---|---|
| 2016 | 1,926 | 19 | 1.0 | 6 | 31.6 | 13 |
| 2017 | 3,593 | 27 | 0.8 | 8 | 29.6 | 19 |
| 2018 | 5,855 | 93 | 1.6 | 26 | 28.0 | 67 |
| 2019 | 10,656 | 114 | 1.1 | 24 | 21.1 | 90 |
| 2020 | 6,759 | 69 | 1.0 | 27 | 39.1 | 42 |
| 2021 | 10,925 | 89 | 0.8 | 23 | 25.8 | 66 |
| 2022 | 13,763 | 100 | 0.7 | 32 | 32.0 | 68 |
| 2023 | 27,175 | 199 | 0.7 | 85 | 42.7 | 114 |
| 2024 | 32,141 | 267 | 0.8 | 155 | 58.1 | 112 |
| 2025 | 27,296 | 191 | 0.7 | 146 | 76.4 | 45 |
People notified with active TB, sub-grouped by test result, treatment initiation and completion
Figure 8 below shows the breakdown of active TB notifications from the population tested whose eligibility could be verified by: time of TB notification after testing; LTBI test result and LTBI treatment. After exclusion of the 532 people with probable active TB at the time of LTBI testing, 16.0% of those tested were positive and were confirmed as having latent TB infection, of whom 18.9% were recorded as having started prophylactic LTBI treatment. Data on treatment was missing for the remaining 18,230 people who had tested positive for LTBI. Treatment completion in those that were recorded as LTBI positive and having initiated treatment was high at 89.5%. Overall this resulted in 16.9% of people testing positive for LTBI, without having active TB at the time of testing, recorded as having completed treatment.
Of the 636 incident TB notifications that occurred at least 90 days after LTBI testing, 141 (22.2%) occurred in people who had tested negative for LTBI and therefore could not be prevented by prophylactic treatment. Active TB was subsequently notified in 4 of 3,794 people recorded as completing LTBI treatment and 484 of 18,230 people with no recorded treatment information. Figures 7 and 8 should not be interpreted as a direct estimate of treatment effectiveness because treatment ascertainment, follow-up duration and other characteristics differ between groups.
For individuals with active TB more than 90 days after a positive LTBI test, but with no LTBI treatment information available, 65.7% were notified within 1 year and 84.1% within 2 years of the date of their LTBI test. The concentration of notifications in the first 2 years after testing is consistent with evidence that progression risk is highest in the period soon after infection (Behr MA and others). However, the timing of infection is not known in the cohort. This supports LTBI testing soon after arrival in the UK to prevent more cases of active disease.
Figure 8. The flow of the numbers of individuals tested, the test results, treatments and notification in NTBS, England from 2016 to 2025
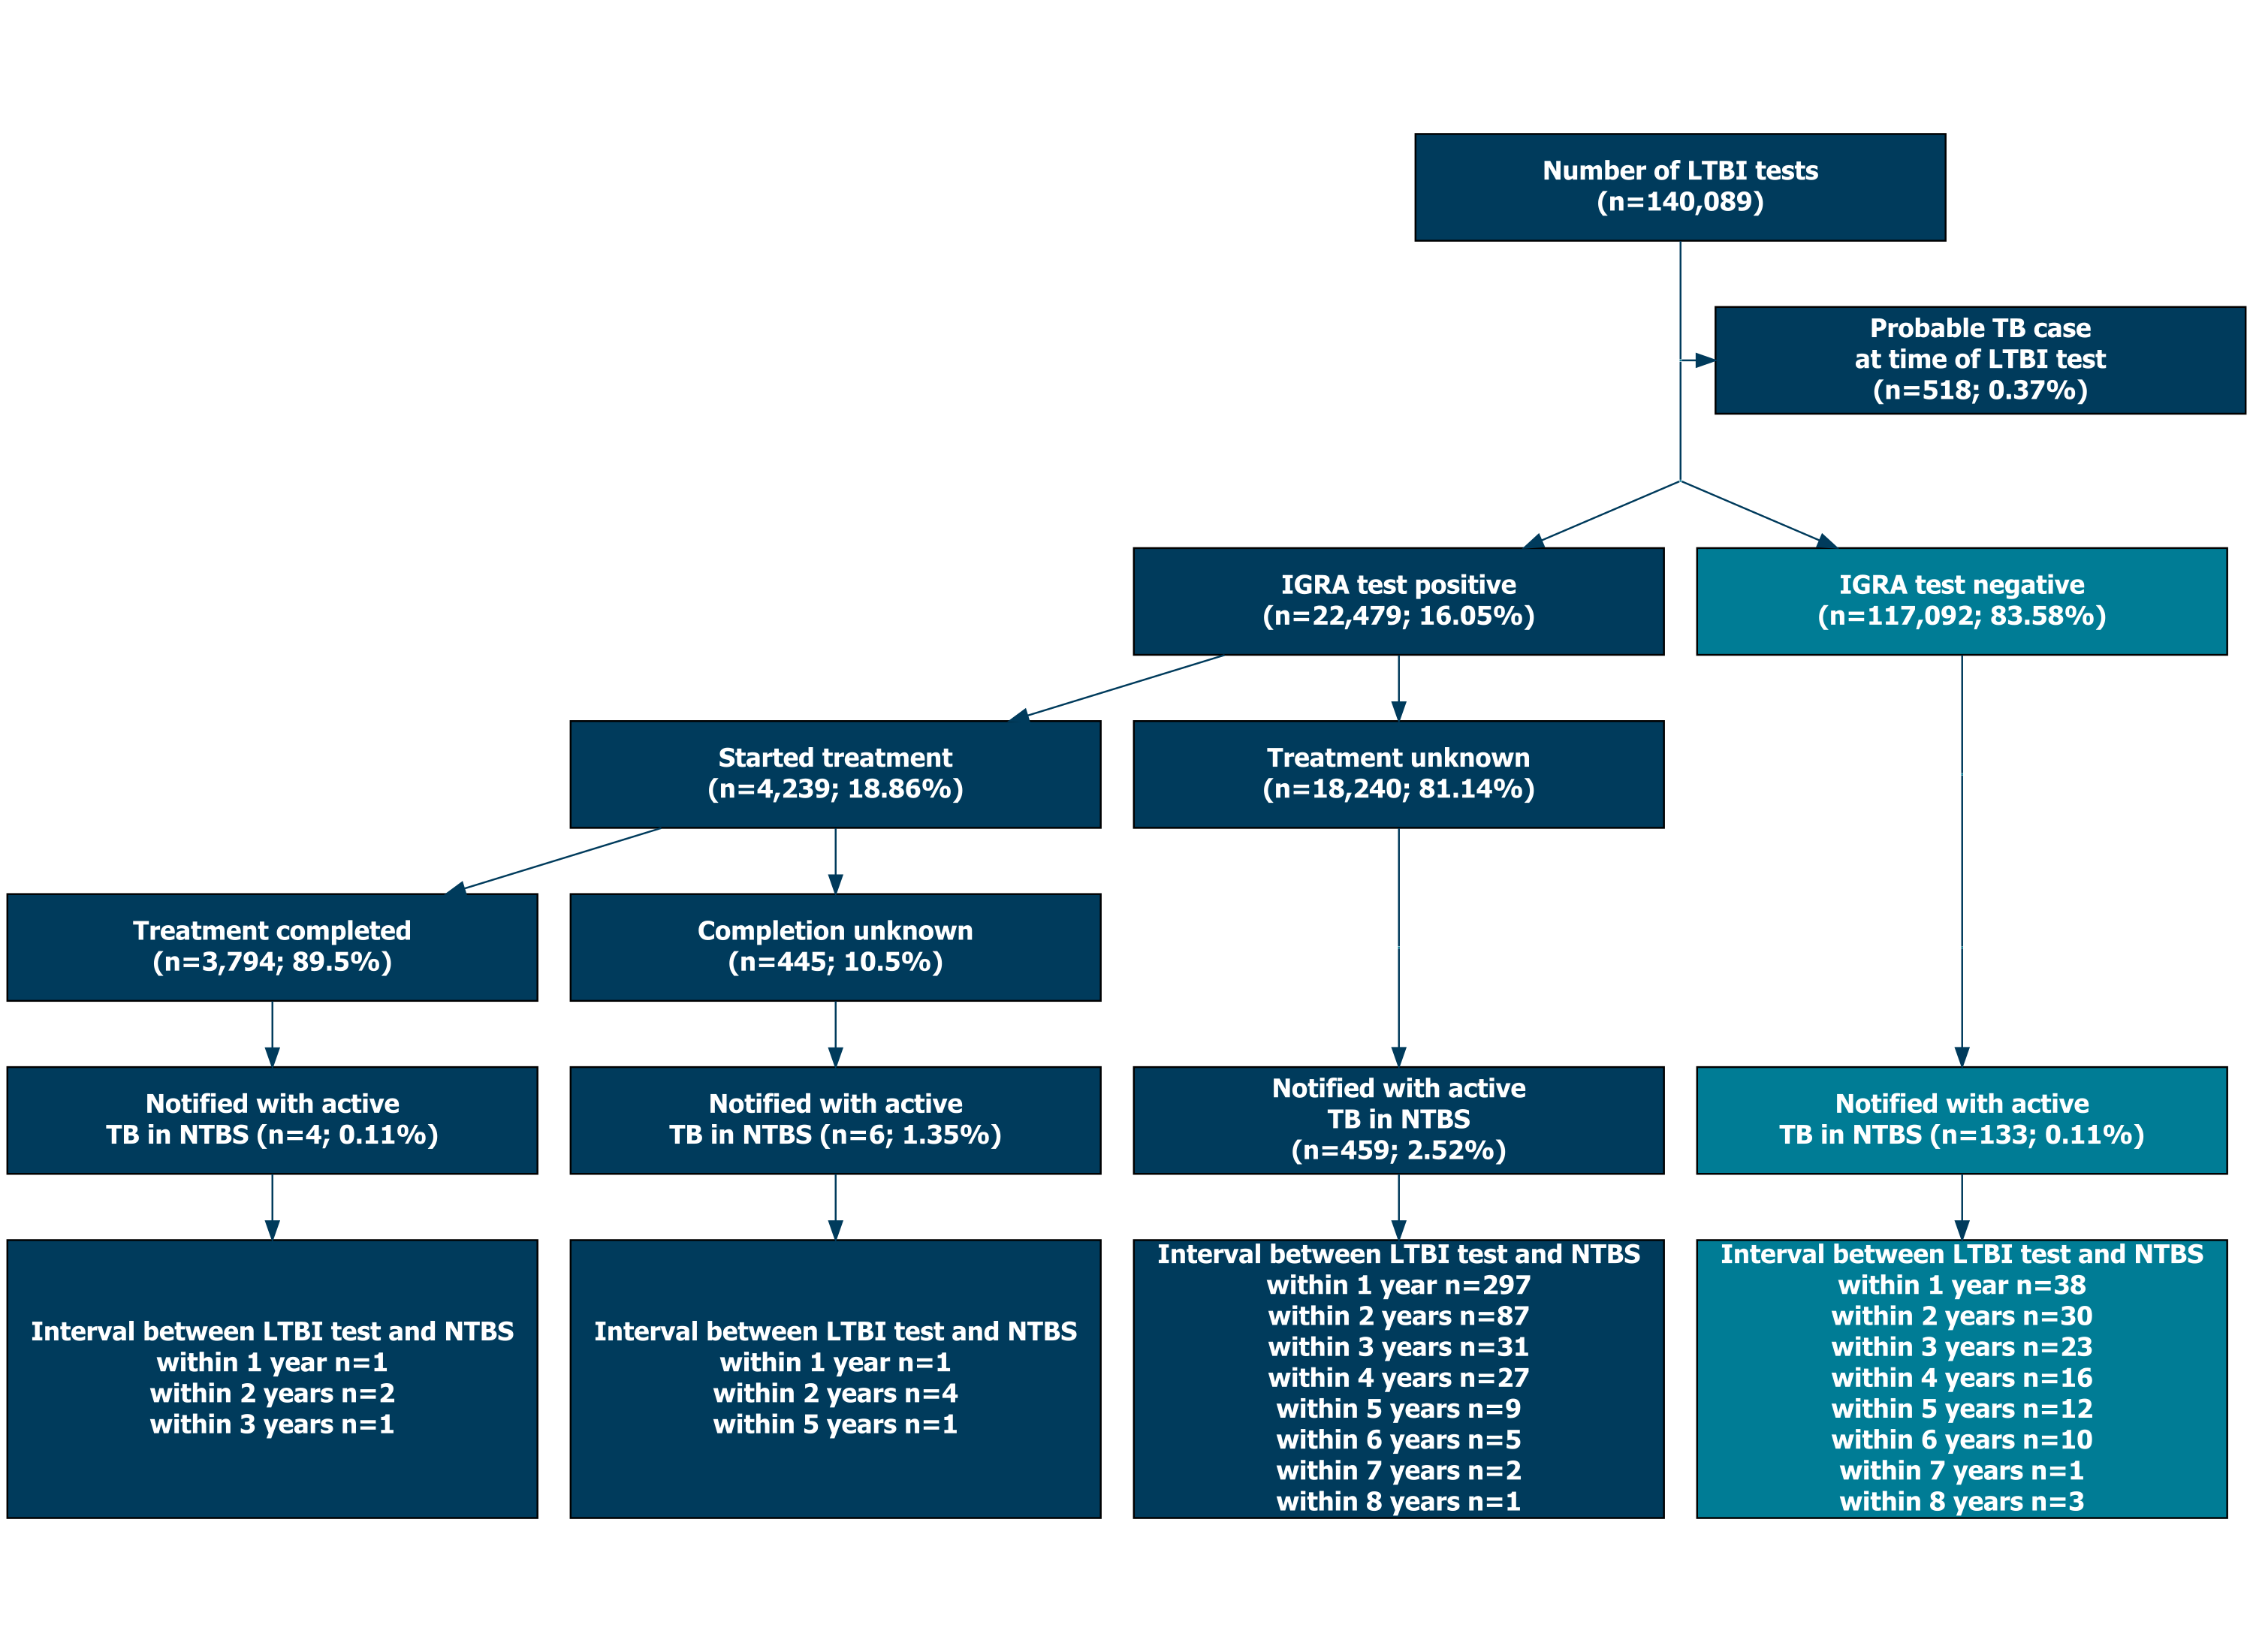
Text version of Figure 8
This flow chart shows aggregated counts of people tested for LTBI (number = 140,089) from 2016 to 2025.
532 people were notified with active TB within 90 days of an LTBI test.
The flow chart shows that 117,088 people had negative LTBI test result of these 141 people were notified of active disease.
People that had negative LTBI test results had TB notifications in the following time points:
- 38 within 1 year number 33 within 2 years 23 within 3 years 19 within 4 years 14 within 5 years 10 within 6 years 1 within 7 years 3 within 8 years
- there were 22,469 people with positive LTBI test results
- of the people with LTBI positive test results 4,239 started treatment and 18,230 had an unknown treatment status
- of the people with positive test results that started treatment 3,794 completed treatment and 445 treatment completion is unknown
- of the people that completed treatment 4 were notified with active TB with 1 notifications within 1 year of the LTBI positive test, 2 notifications within 2 years of the LTBI positive test and 1 notifications within 2 years of the LTBI positive test
- of the people that started treatment with an unknown treatment status 7 were notified with active TB with 1 notifications within 1 year of LTBI positive test, 5 notifications within 2 years of LTBI positive test and notification within 1 year of a LTBI positive test
- of those people that had a positive LTBI test but no record of treatment 484 were notified with active TB. Of these 318 were notified within 1 year, 89 within 2 years, 32 within 3 years and 27 within 4 years of the positive LTBI test
Contact tracing of people notified with TB
Contact tracing data is presented from England between 2018 and 2025. Data on contact tracing information in individuals with pulmonary TB was first reported in the TB prevention in England 2022 report. In this report, for the first time, contact tracing results for people notified with non-pulmonary TB is also included. Evidence shows a high TB prevalence among close contacts of people with non-pulmonary TB (see Background information for more details).
Individuals with more than 65 contacts were excluded as indicative of a large outbreak investigation and therefore not representative of routine contact tracing. For people notified in 2025 recording of contact tracing information is likely to be ongoing after data extraction for this report. Therefore, contact tracing information for 2025 is expected to increase in subsequent reports.
Contact tracing information for people with active TB
In 2025, 5,449 people were notified with TB, of whom 2,862 had pulmonary disease and had fewer than 65 contacts identified, who therefore required contact tracing according to NICE guidance (see Supplementary Table 20. In 2025, 81.5% of people with pulmonary TB (2,335 individuals) had contact tracing information recorded and had fewer than 65 contacts identified, a 7.7% decrease compared with 2024 (see Figure 10). The proportions of people with pulmonary TB for whom contact information was recorded by UKHSA region for 2021 to 2025 are shown in Appendix Figure A10 and Supplementary Table 21.
Figure 9 describes the number of contacts and how many were screened for people notified with pulmonary TB (index individuals) in England in 2025, split between those with 1 to 4 contacts identified and those with 5 or more contacts identified. Data between 2021 to 2025 is presented in Supplementary Table 20.
A 2021 to 2026 TB Action Plan target was to increase the number of pulmonary index individuals with at least 5 close contacts screened. However, the proportion of pulmonary index individuals with 5 or more close contacts identified, 674 (28.9%), of whom 571 (84.7%) had their contacts screened (2,335 index individuals for whom contact tracing information was recorded), a slight drop from previous years (Supplementary Table 20).
Figure 9. Flow diagram of the number of contacts of people notified with pulmonary TB (index individuals) identified, traced and screened, England 2025
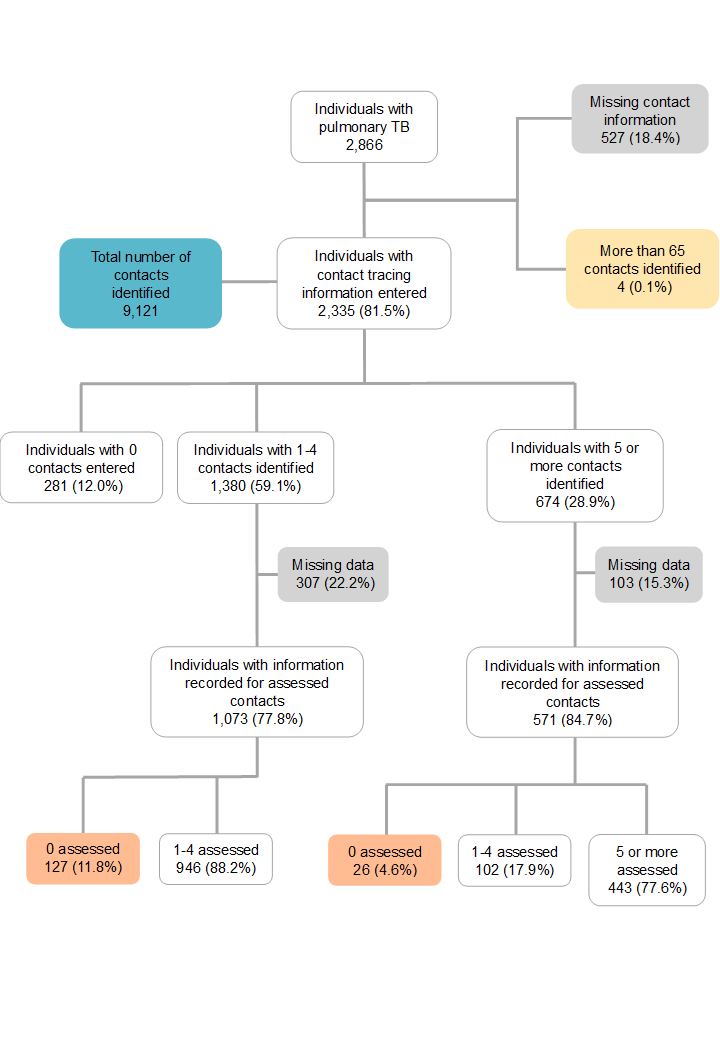
Data used to create Figure 9 can be found in Supplementary Table 20.
Notes to Figure 9:
- proportions for index individuals with contact tracing information entered, missing contact tracing information and those with greater 65 contacts identified are derived from the total number of pulmonary notifications
- proportions for index individuals with 0, 1 to 4, and 5 or more contacts identified are derived from index individuals with contact tracing information entered
- proportions for index individuals with information recorded for screened contacts was derived from the number of index individuals with 0, 1 to 4, and 5 or more contacts identified
- proportions for index individuals with 0, 1 to 4, and 5 or more contacts screened are derived from the number of index individuals with information recorded for screened contacts
Text version of Figure 9
This flowchart shows the number and proportion of index individuals with contact information in England in 2025. It starts with 2,866 pulmonary index individuals, of which 527 (18.4%) are missing contact information. Of the 2,866 index individuals, 4 (0.1%) had more than 65 contacts identified.
A total of 9,121 contacts were identified for the 2,335 index individuals who did have contact tracing information entered.
Of the 2,335 index individuals who did have contact tracing information entered, 281 (12.0%) had 0 contacts entered, and therefore no contacts were identified.
Of 2,335 index individuals with contact tracing information entered, 1,380 (59.1%) had 1 to 4 contacts identified. Of these 1,380 index individuals, 307 (22.2%) had no information recorded for contacts who were screened, leaving 1,073 (77.8%) who did have information recorded for contacts and who were screened. Of these 1,073, 127 (11.8%) had 0 contacts screened, and 946 (88.2%) had 1 to 4 contacts screened.
Of the 2,335 index individuals who did have contact tracing information entered, 674 (28.9%) had 5 or more contacts identified. Of these 674 index individuals, 103 (15.3%) had no information recorded for screening of contacts, leaving 571 (84.7%) who did have information recorded for contacts and who were screened. Of these 571, 26 (4.6%) had 0 contacts screened, 102 (17.9%) had 1 to 4 contacts screened, and 443 (77.6%) had 5 or more contacts screened.
In 2025 the median number of contacts for people notified with pulmonary TB was 3 (interquartile range (IQR): 1 to 5). For the 2,583 people notified with non-pulmonary TB, 3,969 contacts were identified with 50.7% of people having at least 1 contact identified. The median number of contacts was lower at 1 (IQR: 0 to 3), unchanged over the last 5 years (Appendix Figure A11 and Supplementary Table 22).
Screening and treatment results in close contacts
Contact tracing results for people notified with pulmonary and non-pulmonary TB (index individuals) in 2025 are shown in Figure 10 panels A and B and Supplementary Table 23. For index individuals with pulmonary TB, 69.5% (6,337 contacts) of identified contacts were screened for active and latent TB, 2.1% (136 contacts) of whom were diagnosed with active TB and 17.7% (1,124 contacts) of whom were positive for latent TB. Of those contacts with a positive latent TB test result, more than two-thirds (68.8%; 773 contacts) started treatment and 47.7% (536 contacts) were recorded as having completed treatment. For non-pulmonary index individuals, a slightly lower percentage of contacts were screened compared to the pulmonary group (63.6%; 2,525 contacts), of whom 0.6% (16 contacts) had active TB and less than ten percent (9.7%; 245 contacts) tested positive for latent TB. The proportion who started latent TB treatment was similar to the pulmonary group (69.9%; 171 contacts) but a slightly higher percentage of contacts was recorded as completing treatment (53.5%; 131 contacts).
For index individuals with pulmonary TB this equates to 58 people with active TB and 481 with LTBI being identified for every 1,000 index individuals contact traced. In the non-pulmonary group, this would equate to 8 people with active TB and 124 with LTBI being identified for every 1,000 index individuals.
Figure 10. Results of contact tracing for people notified with pulmonary TB (Panel A) and non-pulmonary TB (Panel B) (index individuals), England, 2025
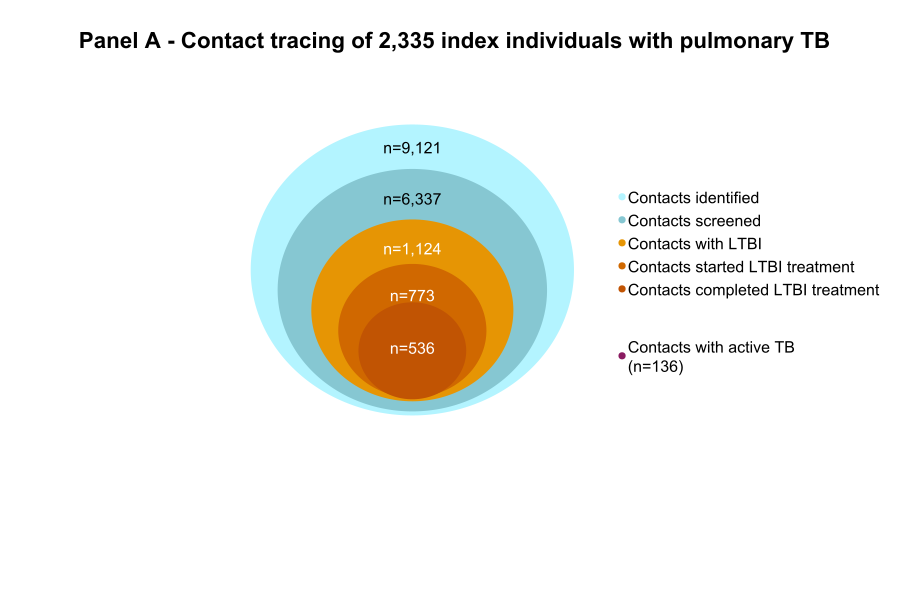
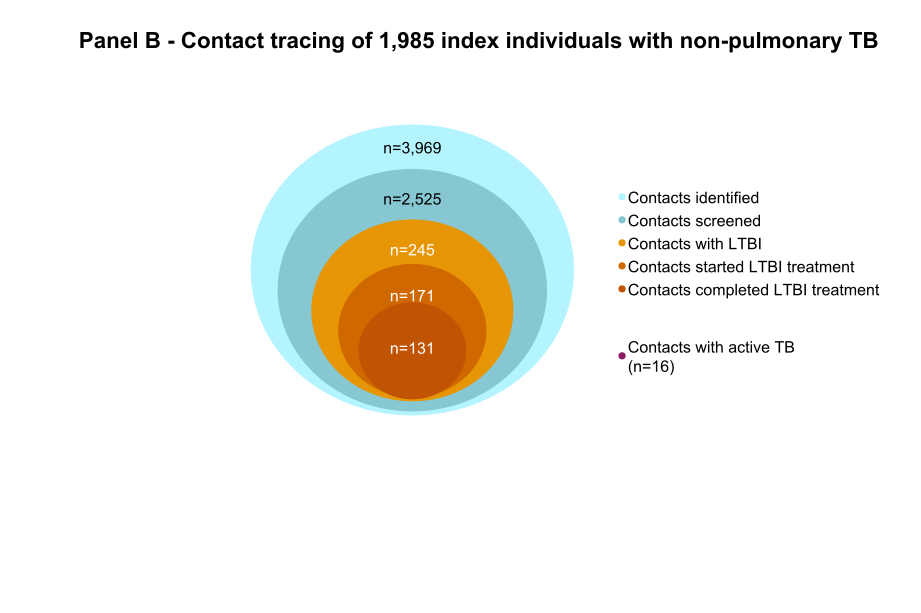
Figure 10 note: contacts with active TB have been shown merely as a legend, and is not visible in the figure in Panel A and Panel B due to low numbers.
Data used to create Figure 10 can be found in Supplementary Table 23.
Screening and treatment results varied by UKHSA region and are shown in Supplementary Table 24, and proportions of treatment completion for LTBI by UKHSA region for 2021 to 2025 in Appendix Figure A12. The proportion of close contacts with active TB ranged from 3.0% in the North West to 1.6% in the East of England. The proportion of test LTBI positives among close contacts was highest in London, where more than one in five contacts (21.2%) tested positive, compared with 12.1% in the South West. Prophylactic treatment completion was lower in 2025 compared with previous years for all regions, ranging from 47.6% to 62.9% (see Supplementary Table 25). Drug shortages may have contributed to lower treatment completion in 2025, with limited supplies prioritised for people with active TB and for LTBI treatment for children under 15 years of age. In the previous 4 years only North West and West Midlands reported treatment completion more than 60% for all years.
Screening and treatment results in adult compared with child close contacts
In 2025, children (aged 14 years or under) made up 22.6% of all contacts identified. Child contacts were more likely to be screened than adult contacts, and slightly more likely to have active (2.7% of child contacts, 1.9% of adults) and latent TB disease (20.6% versus 16.8%). This was similar to 2024 (see Table 6) The proportion of children who completed treatment for latent TB infection was higher than in adult contacts (62.1% compared with 41.9%) in 2025, with the same pattern observed in 2024 but with on overall higher rate of completion reported, perhaps due to ongoing treatments or late data updates in 2025, as a similar disparity was reported in last year’s annual report.
Table 6 shows the numbers and proportion of adult and child contacts of people notified with pulmonary TB in 2024 and 2025 who were identified, screened, tested positive for LTBI, then started and completed treatment
| Screening and treatment categories | Adult contacts (PTB) 2024 | Child contacts (PTB) 2024 | Adult contacts (PTB) 2025 | Child contacts (PTB) 2025 | Adult contacts (non-pulm TB) 2024 | Child contacts (non-pulm TB) 2024 | Adult contacts (non-pulm TB) 2025 | Child contacts (non-pulm TB) 2025 |
|---|---|---|---|---|---|---|---|---|
| Number of contacts identified | 8,299 | 2,353 | 7,056 | 2,065 | 2,797 | 1,375 | 2,664 | 1,305 |
| Number of contacts screened for active TB and latent TB (%) | 6,216 (74.9%) | 1,991 (84.6%) | 4,773 (67.6%) | 1,564 (75.7%) | 1,996 (71.4%) | 1,098 (79.9%) | 1,666 (62.5%) | 859 (65.8%) |
| Number of contacts with active TB (%) | 126 (2%) | 72 (3.6%) | 93 (1.9%) | 43 (2.7%) | 20 (1%) | 9 (0.8%) | 16 (1%) | 0 (0%) |
| Number of contacts with latent TB (%) | 1074 (17.3%) | 419 (21%) | 802 (16.8%) | 322 (20.6%) | 268 (13.4%) | 80 (7.3%) | 181 (10.9%) | 64 (7.5%) |
| Number of contacts who started treatment for latent TB (%) | 788 (73.4%) | 393 (93.8%) | 502 (62.6%) | 271 (84.2%) | 195 (72.8%) | 72 (90%) | 112 (61.9%) | 59 (92.2%) |
| Number of contacts who completed treatment for latent TB (%) | 605 (56.3%) | 331 (79%) | 336 (41.9%) | 200 (62.1%) | 154 (57.5%) | 65 (81.2%) | 84 (46.4%) | 47 (73.4%) |
Notes to Table 6:
- the denominator for proportion of contacts screened for active TB and latent TB infection is number of contacts identified
- the denominator for the proportion of contacts positive for active TB and LTBI is the number of contacts screened
- the denominator for the proportion of contacts who started and completed treatment is the number of contacts positive for LTBI
- individuals with greater than 65 contacts were excluded in the analysis
Screening and treatment outcomes in close contacts by socio-demographic characteristics of pulmonary and non-pulmonary index cases
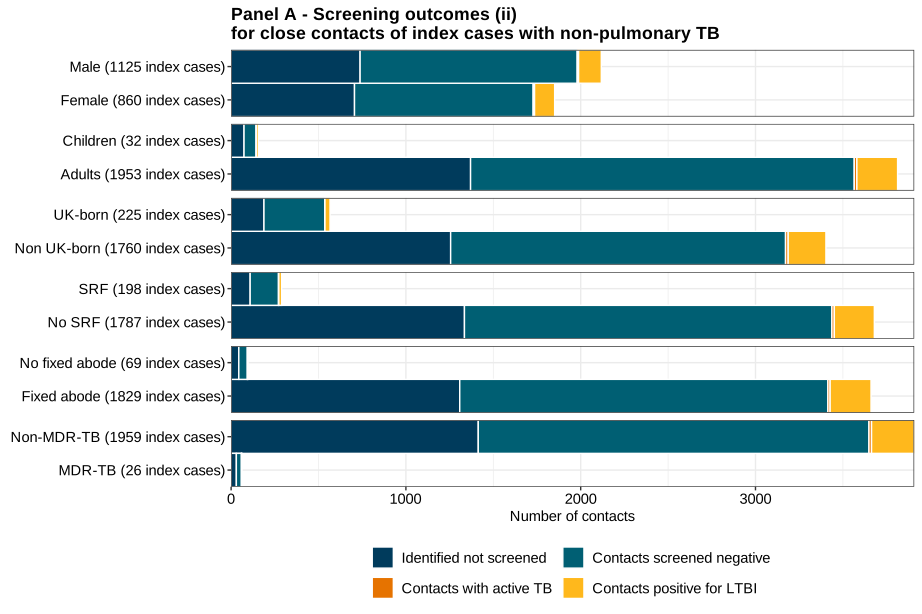
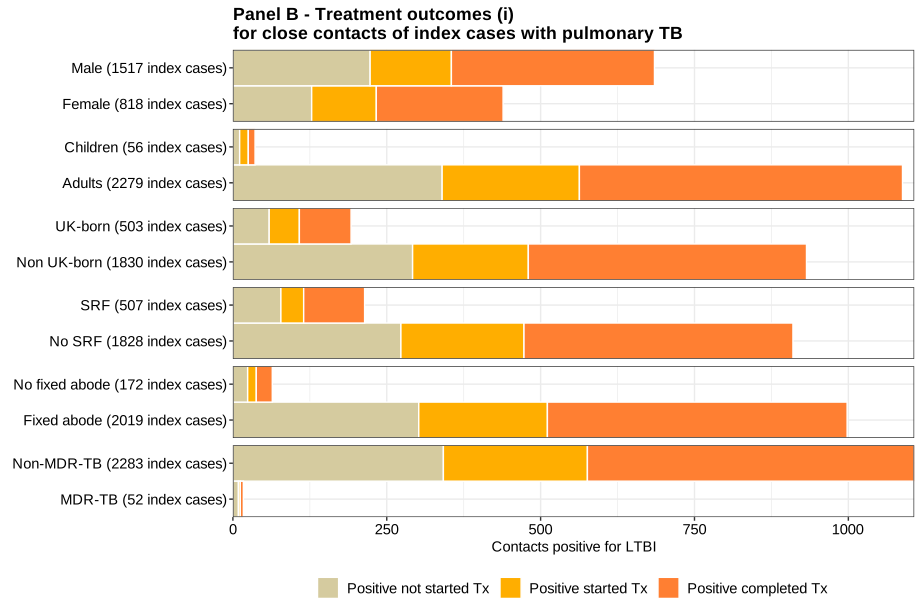
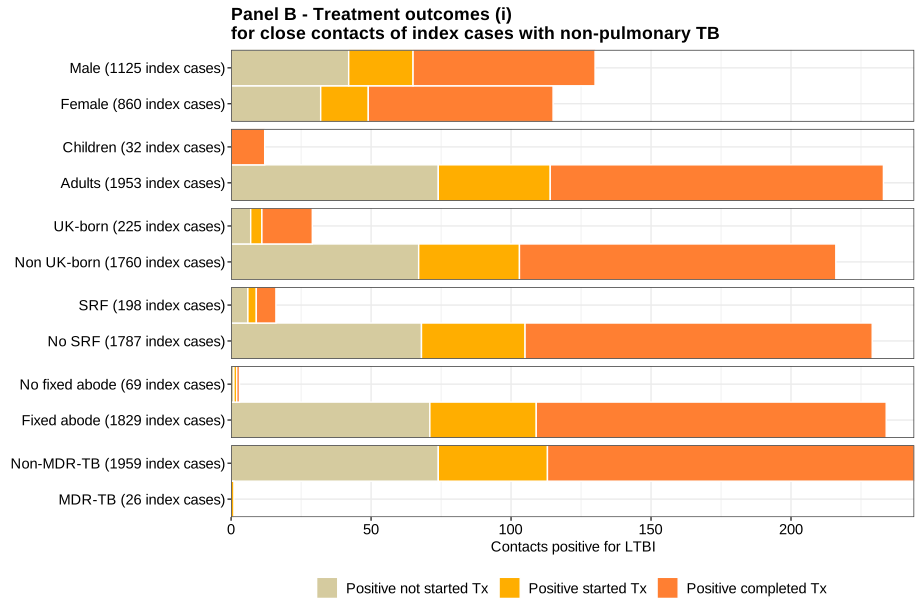
Appendix Figure A13 and Supplementary Table 26 show screening and treatment outcomes in close contacts of index individuals by site of disease, demography and other characteristics in 2025. Differences in screening uptake (panel A) in contacts of different subgroups of index individuals were generally small. However, uptake of screening was lower in contacts of child index cases, of currently homeless index individuals and index individuals treated for non-pulmonary MDR/XDR TB.
Higher proportions of active TB and LTBI were observed among contacts of children (active TB 4.3%; latent TB infection 14.2%) compared with adult index individuals (active TB 1.4%, latent TB infection 12.3%), (Appendix Figure A13 panel A). This finding likely reflects clusters of transmission in households with young children in which the index case is most likely to be an adult household member. Currently notification data cannot link people notified with active TB detected through contact tracing to the index individual (the person whose diagnosis triggered contact tracing). It should be noted that diagnosis dates cannot determine directions of TB transmission (please see Clustering section in Diagnosis and Microbiology chapter for more details)
LTBI treatment uptake and completion were lower in contacts of people with social risk factors, homelessness, and MDR TB in contacts of both pulmonary and non-pulmonary TB. Prophylactic treatment is not always possible for MDR TB depending on the antibiotic susceptibility of the index case ‘s infection (Appendix Figure A13 panel B and Supplementary Table 26).
BCG vaccination
The BCG vaccine is recommended for babies at increased risk of TB, including those with family links to high-incidence countries and those living in high-incidence areas of the UK (see Background information for more details).
In Table 7 BCG vaccine coverage data is presented for England and by region from January to December 2025. For England, BCG coverage at 3 months of age for eligible children was 77.0%, varying from 40.9% in the North East to 83.5% in the West Midlands, similar to previous years (see Supplementary Table 27).
In Table 8 BCG vaccine coverage data is presented for local authorities with a 3-year TB incidence rate of greater than 20 per 100,000. The only local authorities with TB rates over 40 per 100,000 population were Newham, Brent and Leicester with BCG coverage of 82.1%, 57.9% and 84.2% compared with the highest coverage of 91.9% in Wolverhampton and lowest of 56.3% in Harrow. Supplementary Table 28 presents vaccine coverage by local authority for 2023 and 2025.
Table 7. Annual BCG vaccine coverage of children up to 3 months old in England and in regions: January to December 2025
| Region name | Eligible population | Number of children vaccinated | Coverage (Percentage) |
|---|---|---|---|
| England | 188,222 | 145,023 | 77.0 |
| London | 57,792 | 42,045 | 72.8 |
| North West | 20,797 | 16,618 | 79.9 |
| West Midlands | 25,484 | 21,267 | 83.5 |
| South East | 25,076 | 20,620 | 82.2 |
| East Midlands | 12,910 | 9,725 | 75.3 |
| Yorkshire and The Humber | 15,812 | 12,784 | 80.8 |
| East of England | 18,124 | 14,801 | 81.7 |
| South West | 7,948 | 5,450 | 68.6 |
| North East | 4,279 | 1,752 | 40.9 |
Table 8. Annual BCG vaccine coverage of children up to 3 months old in English local authorities with a 3-year average TB rate of greater than 20 per 100,000: January to December 2025
| UTLA name | Three-year average (2022 to 2025) annual TB rate per 100,000 | Number of eligible children | Number of children vaccinated | BCG coverage (percent) |
|---|---|---|---|---|
| Coventry | 20.3 (17.7, 23.2) | 2,379 | 2,144 | 90.1 |
| Croydon | 20.4 (17.9, 23.1) | 2,782 | 2,294 | 82.5 |
| Reading | 22.1 (18.3, 26.4) | 1,321 | 1,159 | 87.7 |
| Wolverhampton | 24.5 (21.2, 28.1) | 1,805 | 1,659 | 91.9 |
| Barking and Dagenham | 25.3 (21.7, 29.4) | 2,574 | 1,855 | 72.1 |
| Luton | 25.7 (22.1, 29.7) | 3,353 | 2,916 | 87.0 |
| Hillingdon | 26.9 (23.7, 30.4) | 2,476 | 1,817 | 73.4 |
| Manchester | 28.3 (25.8, 30.9) | 4,058 | 3,330 | 82.1 |
| Redbridge | 31.4 (27.9, 35.2) | 3,333 | 2,580 | 77.4 |
| Hounslow | 33.6 (29.9, 37.7) | 2,515 | 1,851 | 73.6 |
| Ealing | 35.3 (31.9, 38.9) | 3,122 | 2,098 | 67.2 |
| Slough | 35.4 (30.4, 41.1) | 1,918 | 1,663 | 86.7 |
| Harrow | 39.4 (35.2, 44.0) | 2,497 | 1,407 | 56.3 |
| Newham | 42.0 (38.3, 46.0) | 5,275 | 4,330 | 82.1 |
| Brent | 42.8 (39.0, 47.0) | 3,021 | 1,750 | 57.9 |
| Leicester | 45.2 (41.4, 49.3) | 3,137 | 2,640 | 84.2 |
Appendix
Figure A1. Distribution of number of screening episodes by age and sex (panel A) and age and visa type (panel B), 2025
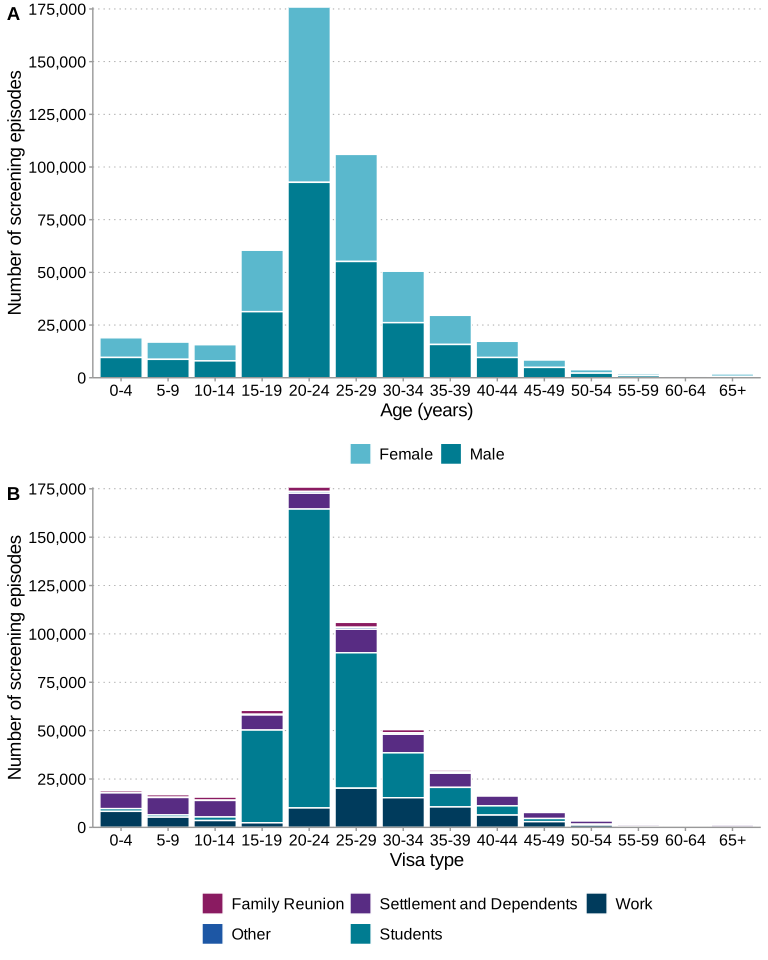
Note to Figure A1: panel A excludes 62 people screened with known age but unknown sex. Panel B excludes 87 people screened with known age but unknown visa type.
Data used to create Figure A1 can be found in Supplementary Tables 5 and 6.
Figure A2. Number of people with confirmed and possible TB by screening provider, 2018 to 2025
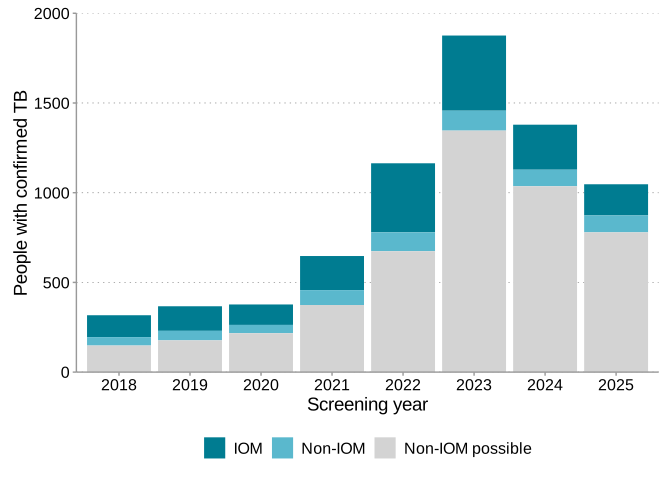
Data underlying this figure can be seen in Supplementary Table 7.
Figure A3. Flow diagram of the number of screening episodes, chest X-ray results, sputum test results and laboratory- and clinically-confirmed cases of TB for non-IOM screening providers in 2025
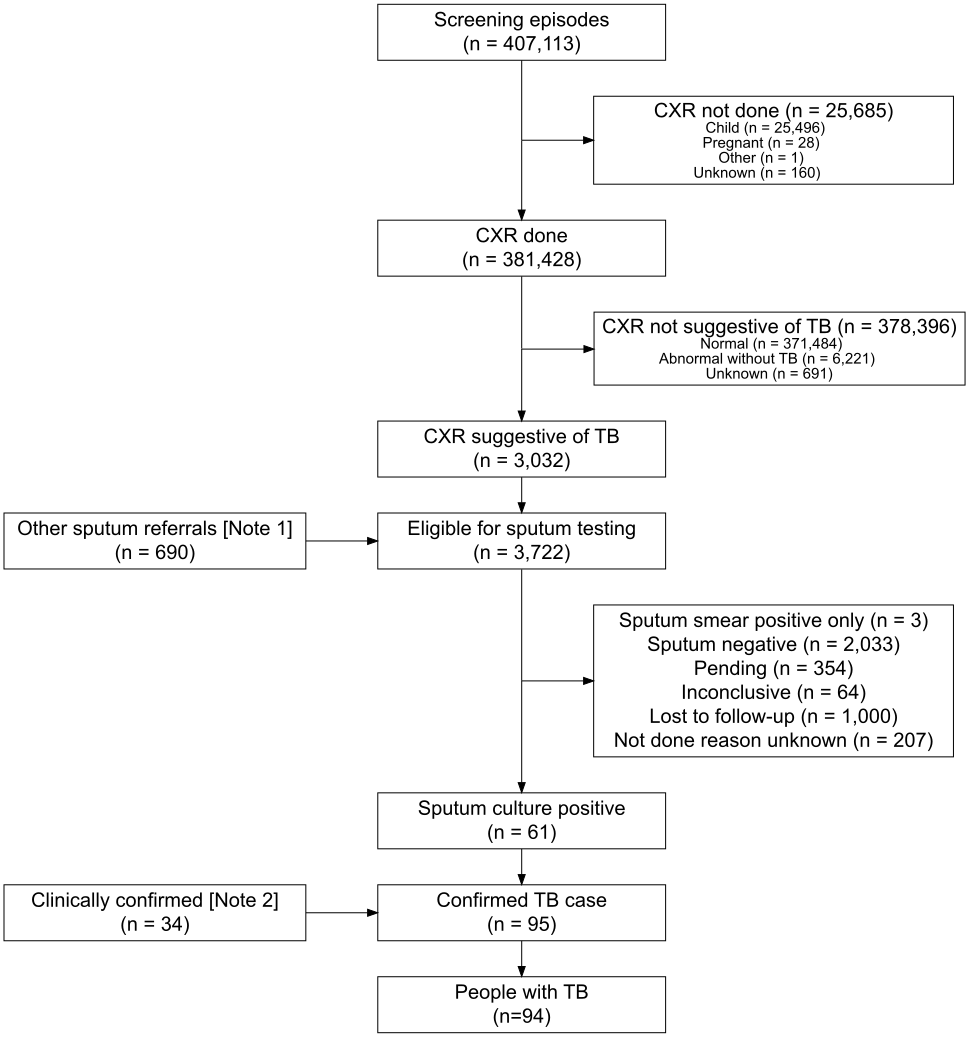
Note 1: other sputum referrals are sputum tests carried out in applicants that 1) did not have a CXR suggestive of TB, but TB was still suspected or 2) in applicants that did not have a CXR due to pregnancy.
Note 2: a clinically-confirmed case is one that does not have a sputum culture-positive test result but meets clinical criteria for diagnosis.
Data used to create Figure A3 can be found in Supplementary Table 8.
Text version of Figure A3
This flow chart shows the number of screening episodes in 2025 at non-IOM clinics. The steps in the process include the chest X-rays (CXRs), sputum tests, and the final number diagnosed with TB.
It starts with 407,113 screening episodes of which 381,428 had a CXR and 25,685 did not. Of the 25,685 episodes that did not have a CXR, 25,496 were a child, 28 were pregnant, 1 had another reason and 160 had an unknown reason.
Of the 381,428 screening episodes that had a CXR, 378,396 were not suggestive of TB and 3,032 were abnormal suggestive of TB. Of the 378,396 episodes not suggestive of TB, 371,484 were normal, 6,221 were abnormal without TB and 691 were an unknown result.
In addition to the 3,032 screening episodes that had a CXR suggestive of TB, a further 690 episodes were referred for sputum testing because TB was still suspected despite a negative CXR, or because the applicant did not have a CXR due to pregnancy. This brought the total number eligible for sputum testing to 3,722.
Of the 3,722 eligible for sputum testing, 3 were smear positive only, 2,033 were sputum negative, 354 were pending a result, 64 had an inconclusive result, 1,000 were lost to follow-up and 207 were not done for unknown reasons. The remaining 61 episodes were culture positive.
An additional 34 episodes were diagnosed as clinically confirmed TB where one does not have a sputum culture positive result but meets the clinical criteria for diagnosis. This brought the total number of confirmed TB cases to 95, which represented 94 individual people with TB.
Figure A4. Flow diagram of the number of screening episodes, chest X-ray results, sputum test results and laboratory- and clinically-confirmed cases of TB for IOM screening providers in 2025
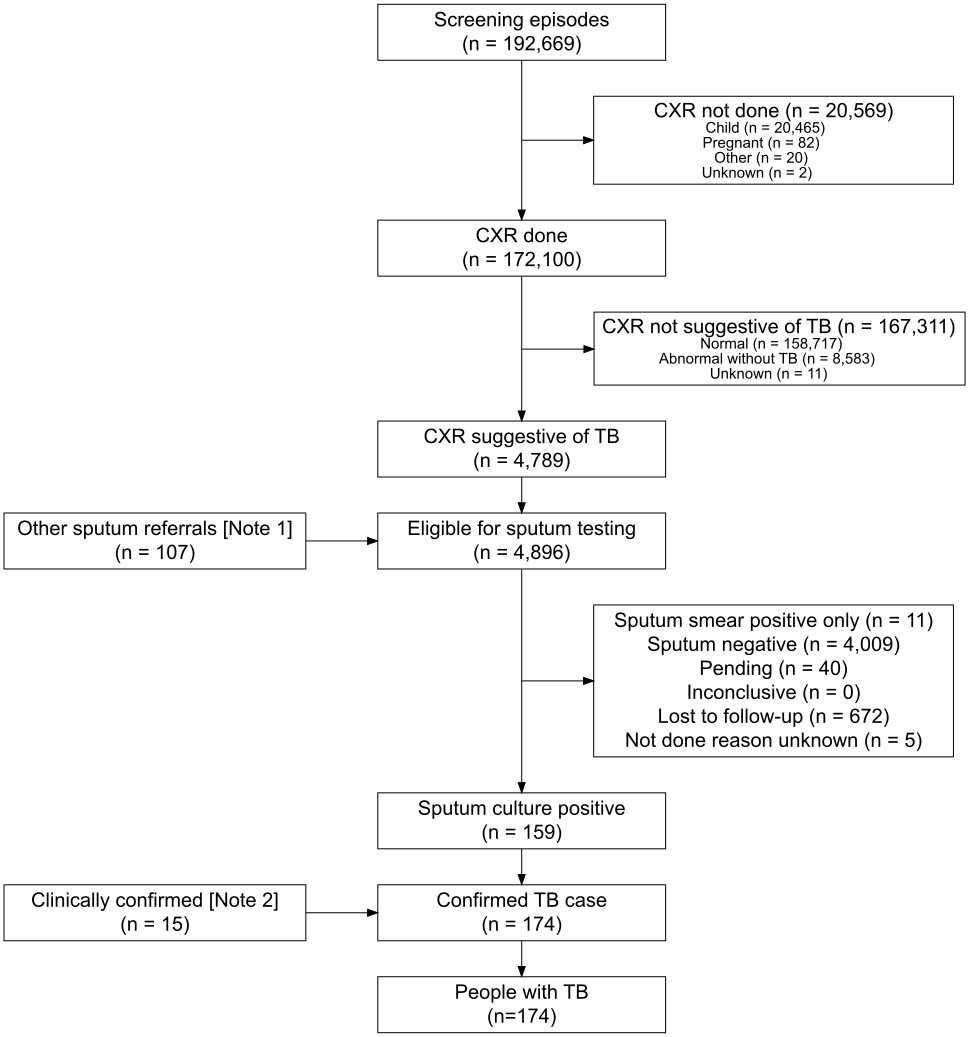
Note 1: other sputum referrals are sputum tests carried out in applicants that 1) did not have a CXR suggestive of TB, but TB was still suspected or 2) in applicants that did not have a CXR due to pregnancy.
Note 2: a clinically-confirmed case is one that does not have a sputum culture-positive test result but meets clinical criteria for diagnosis.
Data used to create Figure A4 can be found in Supplementary Table 8.
Text version of Figure A4
This flow chart shows the number of screening episodes in 2025 at IOM clinics. The steps in the process include the chest X-rays (CXRs), sputum tests, and the final number diagnosed with TB.
It starts with 192,669 screening episodes of which 172,100 had a CXR and 20,569 did not. Of the 20,569 episodes that did not have a CXR, 20,465 were a child, 82 were pregnant, 20 had another reason and 2 had an unknown reason.
Of the 172,100 screening episodes that had a CXR, 167,311 were not suggestive of TB and 4,789 were abnormal suggestive of TB. Of the 167,311 episodes not suggestive of TB, 158,717 were normal, 8,583 were abnormal without TB and 11 were an unknown result.
In addition to the 4,789 screening episodes that had a CXR suggestive of TB, a further 107 episodes were referred for sputum testing because TB was still suspected despite a negative CXR, or because the applicant did not have a CXR due to pregnancy. This brought the total number eligible for sputum testing to 4,896.
Of the 4,896 eligible for sputum testing, 11 were smear positive only, 4,009 were sputum negative, 40 were pending a result, 0 had an inconclusive result, 672 were lost to follow-up and 5 were not done for unknown reasons. The remaining 159 episodes were culture positive.
An additional 15 episodes were diagnosed as clinically confirmed TB where one does not have a sputum culture positive result but meets the clinical criteria for diagnosis. This brought the total number of confirmed TB cases to 174, which represented 174 individual people with TB.
Figure A5. TB case detection rate by 10-year age group (2023 to 2025)
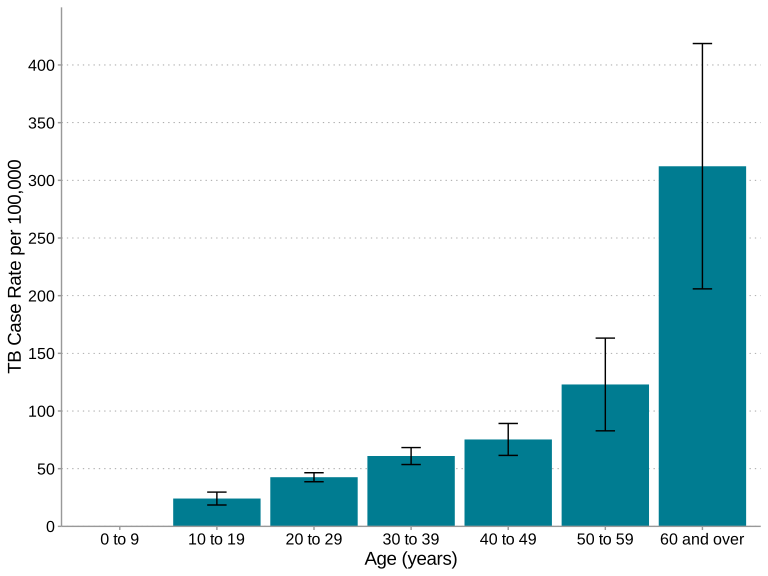
Figure A6. TB case detection rate by visa type (2023 to 2025)
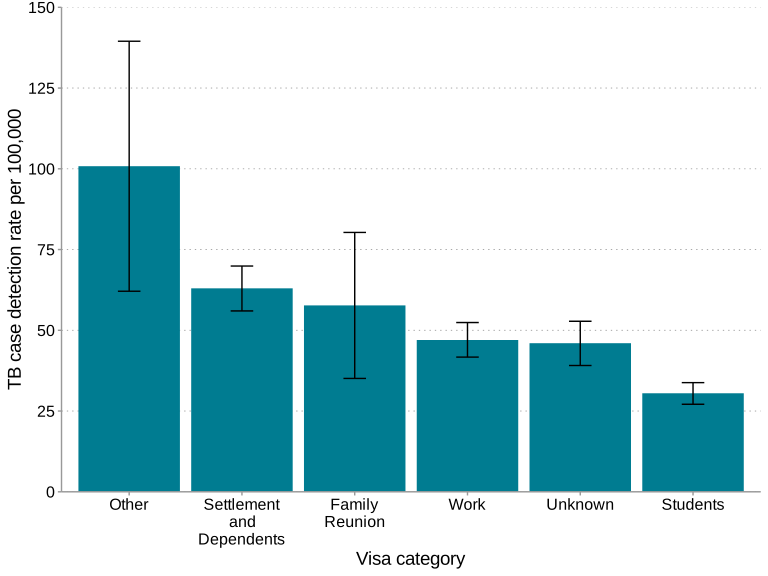
Figure A7. The number of tests with verified eligibility by UKHSA region in England from 2016 to 2025
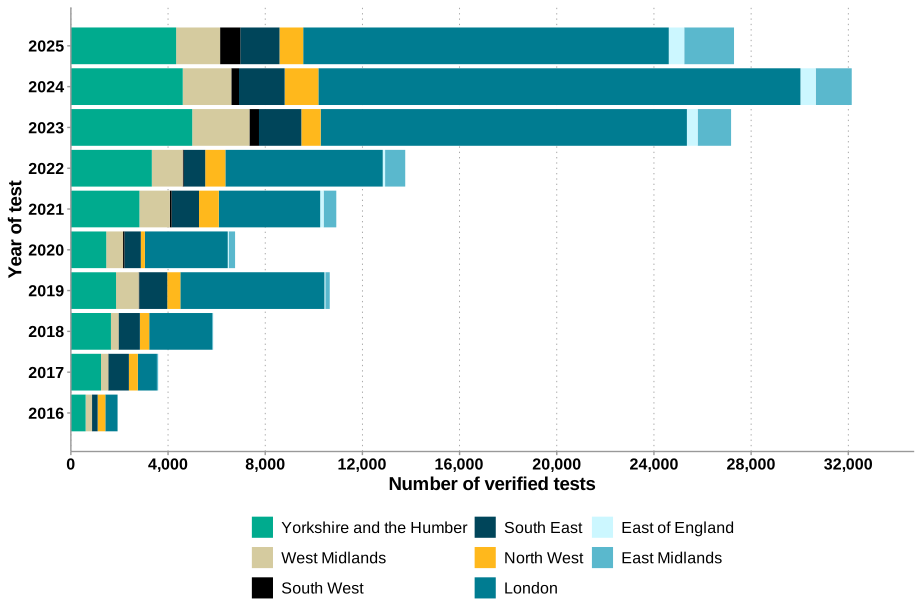
Data used in this Figure can be found in Supplementary Table 12 of the accompanying data set.
Note: as a low incidence area, the North East region of England does not have any ICBs commissioned for programmatic testing.
Figure A7 and Supplementary Table 12 in the accompanying data set describe testing numbers by UKHSA region from 2016 to 2025. The South West were not entering negative tests prior to 2022 and so is under-reported before this time. In 2025 Yorkshire and the Humber tested the highest proportion of its eligible migrant population (33.2%), the region that tested the smallest proportion of its eligible migrant population was the North West (4.8%). Information by ICB and SICB level can be found in Supplementary Tables 13 and 14 respectively.
Figure A8. The treatment initiation among people testing positive and the proportion of test positives including test results from validated and unvalidated test results from 2016 to 2025
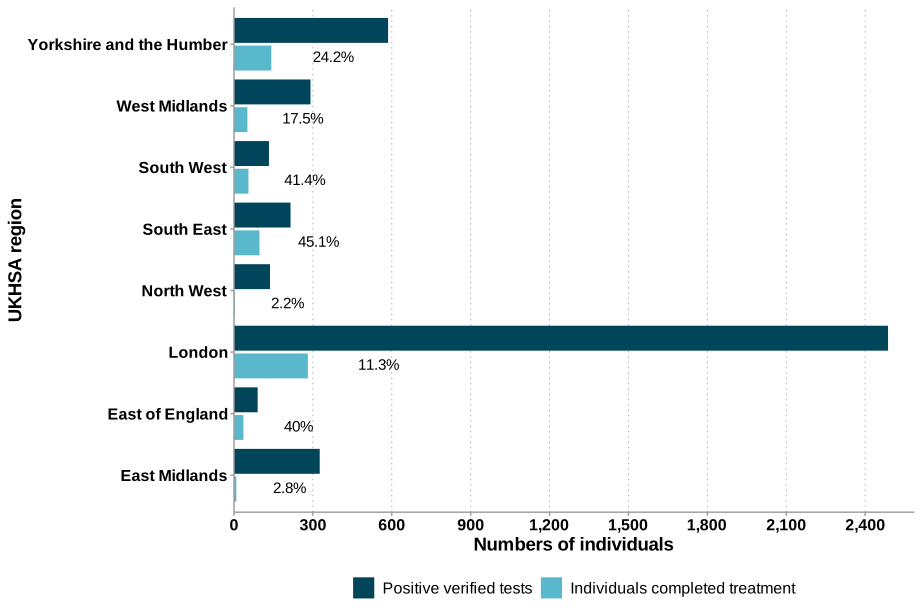
Data used in this figure can be found in Supplementary Table 16.
Figure A9. The number of positive tests and completed treatments with percent completion by UKHSA region, England, 2025
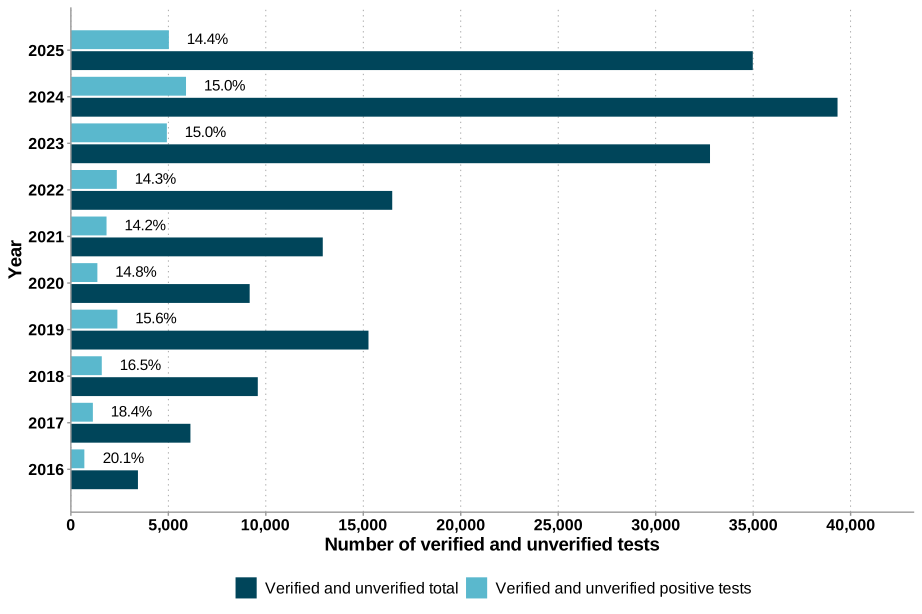
Note to Figure A9: treatment completion as a percentage of those who tested positive is shown at the end of the completed treatment bar.
Data used in this figure can be found in Supplementary Table 12
Information by ICB and SICB can be found in Supplementary Tables 13 and 14 respectively.
Figure A10. Proportion of people notified with pulmonary TB with contact tracing information recorded by UKHSA region, England 2021 to 2025
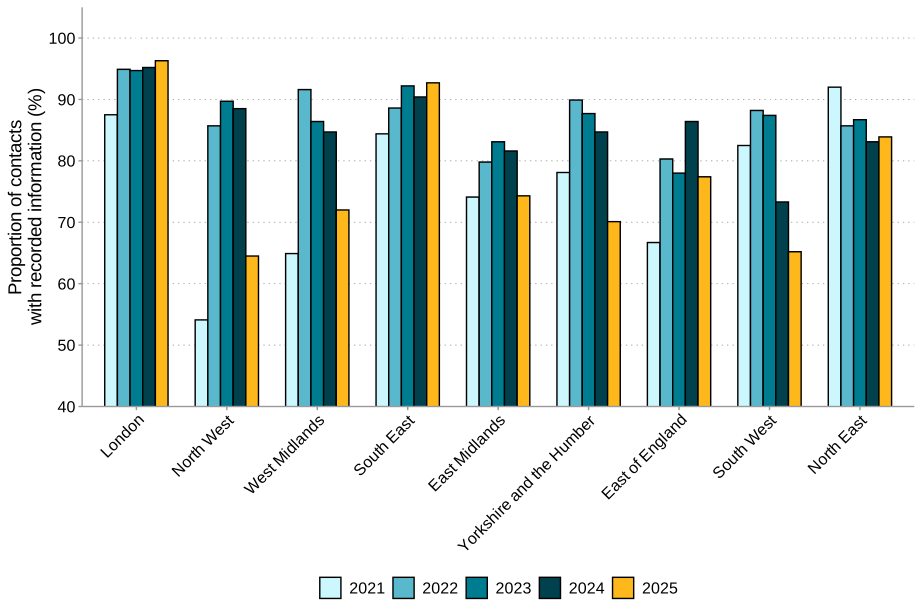
Data used to create Appendix Figure A10 can be found in Supplementary Table 21.
Figure A11. Boxplot showing the distribution of the number of contacts identified of people notified with pulmonary and extra-pulmonary TB (index individuals), England, 2021 to 2025
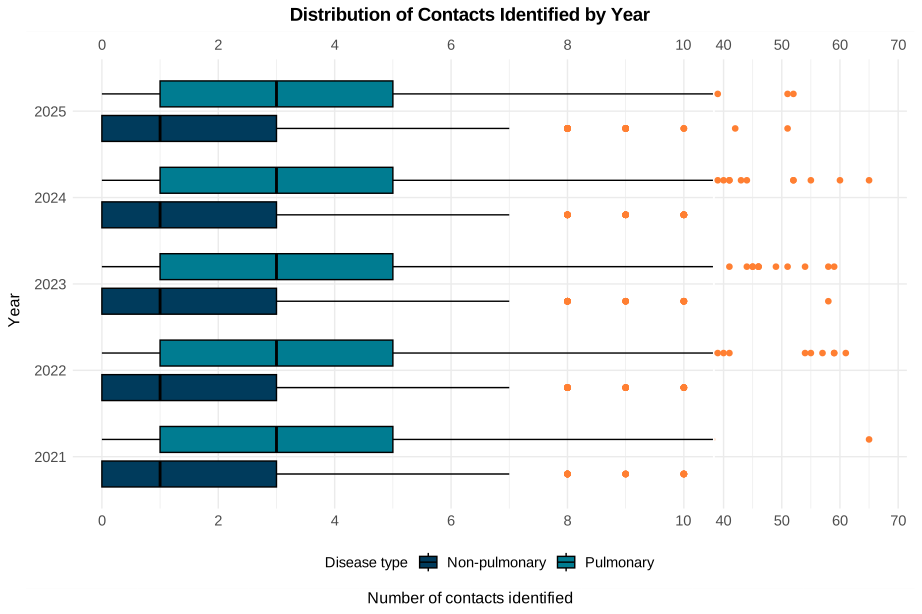
Data used to create Appendix Figure A11 can be found in Supplementary Table 22.
Figure A12. LTBI treatment completion in close contacts of people with pulmonary TB by UKHSA region, England 2021 to 2025
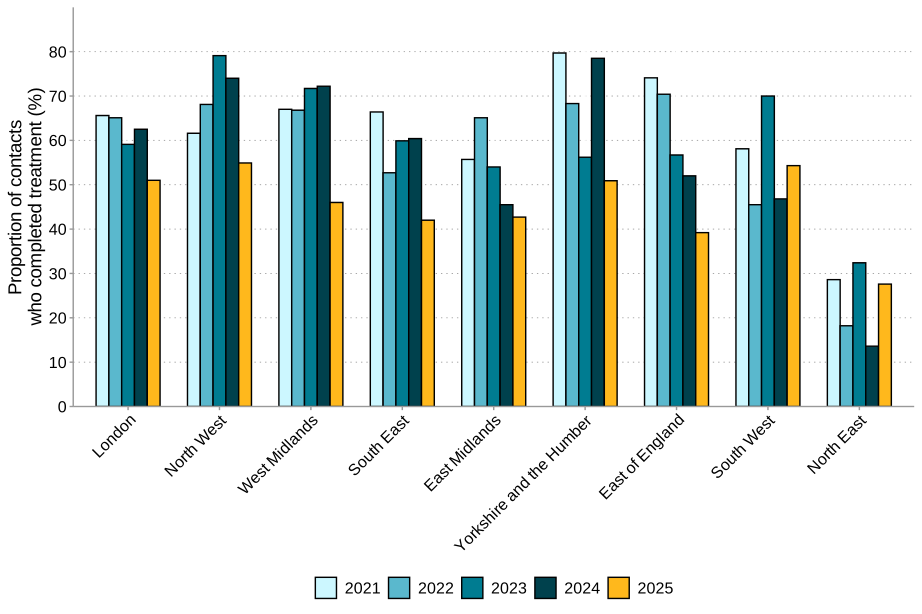
Data used to create Figure A12 can be found in Supplementary Table 24.
Figure A13. Screening (Panel A) and treatment outcomes (panel B) in close contacts by site of disease, demography and other characteristics of pulmonary index individuals, and non-pulmonary individuals England, 2025
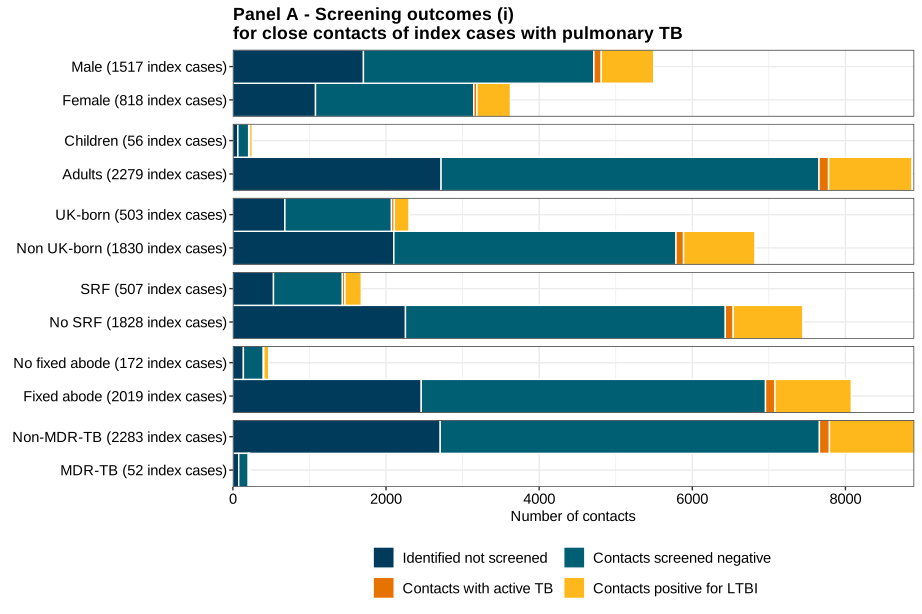
Data used to create Figure A13 can be found in Supplementary Table 26.
Background information
Pre-entry screening programme
The UK pre-entry screening programme replaced on-entry screening at UK airports in March 2014. It uses chest x-ray (CXR) based screening for active pulmonary TB carried out by appointed panel clinics, usually in the country of origin, with sputum cultures conducted for those with those with abnormal CXR considered to be consistent with TB.
Whilst pre-entry screening for active TB is a requirement when applying for a long-term visa prior to entry into the United Kingdom, but there are a number of people who can apply for a Hong Kong British National Overseas (HK BN(O)) visa from within the UK without undergoing pre-entry screening. This is due to applicants initially being able to enter the UK on a short-term visa (less than 6 months). Individuals applying for a HK BN (O) visa that already reside in the UK and did not provide a TB test certificate when they last entered the UK must undergo TB screening at one of eight clinics approved by the Home Office [Tuberculosis testing in the UK for Hong Kong BN(O) - GOV.UK].
NHSE new entrant migrant LTBI testing programme
The NHSE National LTBI testing, and treatment programme was introduced in 2015 as part of the Tuberculosis (TB): collaborative strategy for England (2015 to 2020). It is a key component of the TB Action Plan. The programme is commissioned and managed by NHSE with UKHSA responsible for the data collection database and the analysis and submission of these data to NHSE, used for payment per test to participating ICBs and monitoring and evaluation of the programme.
Some ICBs have local arrangements for LTBI testing and treatment outside of the nationally commissioned programme, for which no data is received by UKHSA and are not reported here.
Contact tracing
Contact tracing remains a cornerstone of TB management and prevention by interrupting chains of transmission and reducing the overall burden of disease.
Contact tracing has 3 main objectives:
- identification of individuals with undiagnosed active TB
- testing to identify people with latent infection followed by chemoprophylaxis to prevent development of active disease
- vaccination with BCG of those eligible
There is evidence that treating latent infection with chemoprophylaxis is safe and prevents progression to active disease, reducing morbidity and mortality for the individual and further spread of TB into the population.
Assessment and screening of close contacts should be undertaken in line with National Institute for Health and Care Excellence (NICE) guidance.
BCG vaccination
The BCG vaccination programme is a risk-based programme recommended for individuals at higher risk of exposure to TB. Eligibility includes all infants under the age of 12 months who have a parent or grandparent born in a country with a TB incidence of more than 40 cases per 100,000 population, and all infants residing in an area in the UK where TB incidence exceeded 40 per 100,000 population.
Eligible babies should be offered the BCG vaccine at 28 days or soon after. Detailed information on the BCG programme can be found in the Green Book. Evaluation studies have identified that BCG is most effective against the most severe forms of the disease, such as TB meningitis in children and less effective in preventing respiratory disease, which is the more common form in adults.
As part of the Cover of Vaccination Evaluated Rapidly (COVER) programme, BCG is included in the quarterly childhood vaccine coverage data extraction from local child health information systems (CHIS). This includes denominators of eligible children and therefore coverage for all local authorities of children at 3 months.