Chapter 1. Tuberculosis incidence and epidemiology, England, 2025
Published 29 October 2026
Applies to England

© Crown copyright 2026
This publication is licensed under the terms of the Open Government Licence v3.0 except where otherwise stated. To view this licence, visit nationalarchives.gov.uk/doc/open-government-licence/version/3 or write to the Information Policy Team, The National Archives, Kew, London TW9 4DU, or email: psi@nationalarchives.gov.uk.
Where we have identified any third party copyright information you will need to obtain permission from the copyright holders concerned.
This publication is available at https://www.gov.uk/government/publications/tuberculosis-in-england-2026-report/chapter-1-tuberculosis-incidence-and-epidemiology-england-2025
Main messages
The main points of this chapter are:
- in 2025 there were 5,449 people notified with tuberculosis (TB), similar to 2024 (5,485) and resulting in a stabilisation of notifications following the previous increases seen in 2023 and 2024. Provisional data for 2026 to date suggest a further small decrease (5.7%) in notifications compared with the same period in 2025
- in 2025 the TB notification rate for England was stable at 9.26 per 100,000 population compared with 2024 (9.36 per 100,000 population)
- TB notification rates continued to be highest in London and the Midlands and among those living in the most deprived areas of England
- the majority of TB notifications continue to be in people born outside the UK (82.3%)
- the TB notification rate was 45.64 per 100,000 in people born outside the UK and 2.04 per 100,000 population for people born in the UK. For both groups there were small decreases, not reaching statistical significance, compared with 2024
- amongst those born outside the UK, 40.8% of TB notifications were within 5 years of entry to the UK in 2025. This is similar to 2024
- in 2025, 1 in 6 people notified with TB had one or more social risk factors reported, the most common being asylum seeker status, history of homelessness and drug use
Supplementary tables
The data behind the charts in this chapter can be found in the accompanying spreadsheet, which is available to download.
International context
Globally, TB remains a major public health challenge and continues to be the leading cause of death from a single infectious agent. TB continues to disproportionately affect the poorest and most vulnerable populations, contributing to persistent health inequalities.
In 2015, the World Health Organization (WHO) launched the global End TB Strategy, setting out an ambitious roadmap to end the TB epidemic by 2035. The strategy includes a series of milestones and targets for countries to reduce TB deaths by 95% and the incidence of TB by 90%. Global TB incidence and mortality indicate that the modest annual reductions achieved in the last decade have not been sustained, and trends are not on course to meet the ‘End TB Strategy’ targets.
Global epidemiology
The latest WHO estimates show that 10.7 million people fell ill with TB worldwide in 2024, similar to the 10.8 million in 2023 and 10.7 million in 2022 (WHO Global TB Report, 2025). This plateauing is thought to reflect the stabilisation from the increases in TB incidence observed globally between 2020 and 2023, when the COVID-19 pandemic disrupted TB prevention, diagnosis and treatment services ((WHO Global TB Report, 2025).
In 2024, 8 countries accounted for two-thirds of global TB cases: India (25%), Indonesia (10%), the Philippines (6.8%), China (6.5%), Pakistan (6.3%), Nigeria (4.8%), the Democratic Republic of the Congo (3.9%) and Bangladesh (3.6%)
Global TB deaths continued a slow decline, with 1.23 million estimated deaths in 2024 (including 150,000 among people with HIV), down from 1.25 million in 2023.
National epidemiology and progress towards WHO elimination targets
TB in England
In 2025, 5,449 people were notified with TB similar to 2024 (5,485, 0.7% decrease). TB notification rate (per 100,000 population) remained stable (9.36 in 2024 and 9.26 in 2025) (95% CI: 9.02 to 9.51) (Figure 1). The WHO use a threshold of estimated TB incidence of less than 10 per 100,000 population to define a country as having low TB incidence. Tuberculosis rates reported by the UK Health Security Agency (UKHSA) are based on actual TB notifications whereas WHO rates apply assumptions for the proportion of non-diagnosed or non-reported cases, leading to differences in TB rates reported between organisations. In 2025 England was below 10 TB notifications per 100,000 population, but over 10 if the same assumption used by WHO (12.5% missed cases) was applied. For the UK as a whole, the TB notification rate is lower than for England (8.6 in 2025). The WHO rate for the UK is therefore expected to remain just under the 10 per 100,000 threshold when WHO data are published later this year.
Figure 1. Number of TB notifications and TB notification rate per 100,000, England, 1971 to 2025
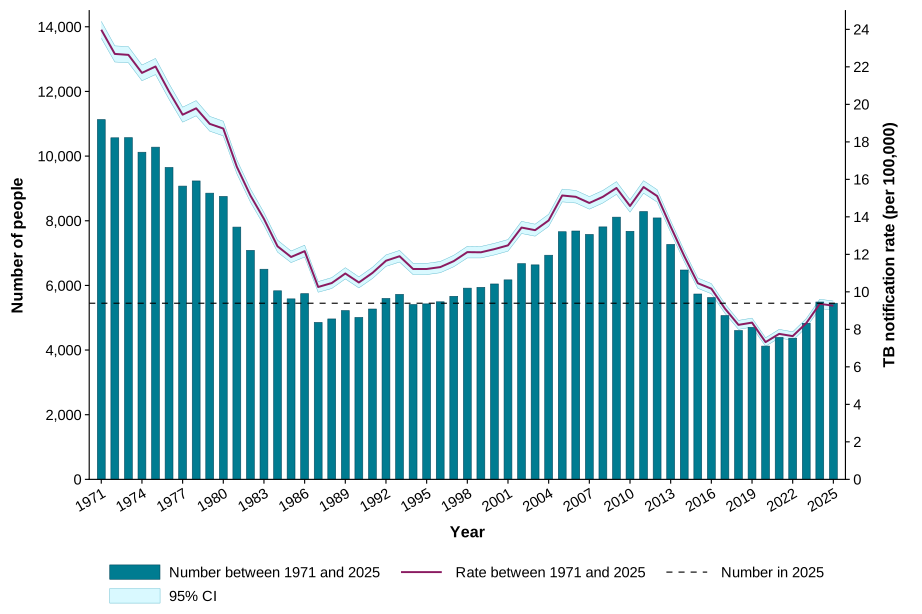
The data used in this graph can be found in Supplementary Table 1 of the accompanying spreadsheet.
Although year-on-year increases since 2022 indicated that TB notification rate in England was approaching the WHO low incidence threshold, forecasts that the threshold would be breached were not realised and the rate remained just below the threshold in 2025, with no further increase compared with the previous year (Figure 2).
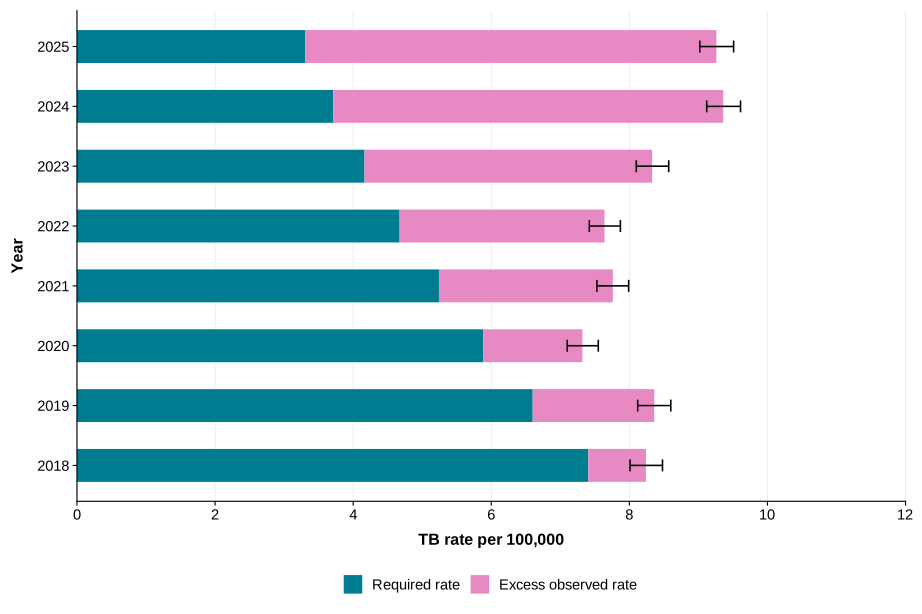
To meet the WHO End TB goal of a 90% reduction in incidence by 2035, an annual decline of 19.6% in TB notifications in England is required for the next 10 years (Figure 2). Since 2018, the gap between the trajectory required to meet this target and the observed trajectory has widened significantly as shown in Appendix Figure A1 and (supplementary table 3).
Figure 2. Observed rates of decrease in TB notification in England from 2010 to 2035 compared with required rate of decrease to achieve the WHO End TB goal of a 90% reduction in TB incidence from 2015 to 2035
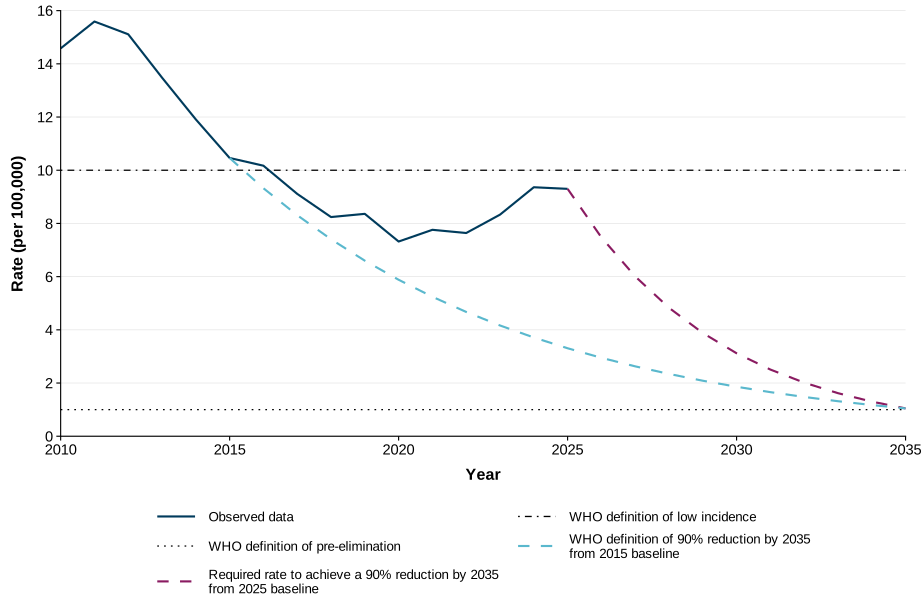
Notes to Figure 2:
- the WHO defines the pre-elimination threshold as a notification rate of 1 case per 100,000 population
- the WHO defines the low-incidence threshold as a notification rate of 10 cases per 100,000 population
- to achieve a 90% reduction from the 2015 baseline by 2035, the required average annual decline is 19.6%
The data used in this graph can be found in Supplementary Table 2.
Geographical variation in the number and notification rate of people with TB
London continued to report the highest total number of notifications (1,846), in addition to the highest TB notification rate of any UKHSA region per 100,000 in 2025 (20.2, 95% CI:19.3 to 21.2) The second highest rate was reported by the West Midlands (10.2 (95% CI:9.4 to 11.0)) whilst the second highest total number of notifications was reported by the North West region (670 notifications). Notification rates remained similar to 2024 in all regions (Table 1 and Supplementary Table 4).
Table 1. Number of TB notifications and annual notification rates per 100,000 people by UKHSA Region, England, 2025
| UKHSA region | Number of notifications | Notification rate per 100,000 | Lower CI | Upper CI |
|---|---|---|---|---|
| London | 1,846 | 20.2 | 19.3 | 21.2 |
| North West | 670 | 8.6 | 8.0 | 9.3 |
| West Midlands | 634 | 10.2 | 9.4 | 11.0 |
| South East | 573 | 6.1 | 5.6 | 6.6 |
| East Midlands | 456 | 9.0 | 8.2 | 9.8 |
| Yorkshire and Humber | 440 | 7.8 | 7.0 | 8.5 |
| East of England | 416 | 6.0 | 5.4 | 6.6 |
| South West | 249 | 4.2 | 3.7 | 4.8 |
| North East | 165 | 6.0 | 5.1 | 7.0 |
Appendix Figures A2a to A2c show notifications in each of the 9 UKHSA regions over time from 2011 to 2025.
TB notifications and rates by NHS region and UKHSA region for notifications from 2001 to 2025 are shown in Supplementary Tables 4 and 5.
TB notifications and rates aggregated for notifications between 2023 and 2025 are presented for integrated care boards (ICBs) and ICB sub-localities in Supplementary Tables 6 and 7 of the accompanying spreadsheet.
In 2025, a quarter of ICBs had rates above 10 per 100,000 (9 out of 36; Supplementary Table 7) .3 local authorities had a 3-year average notification rate above 40 per 100,000: Leicester (44.8), Brent (42.4) and Newham (41.3). 5 local authorities had rates between 30 and 40 per 100,000: Harrow (38.9), Slough (34.9), Ealing (34.8), Hounslow (33.2), and Redbridge (31.1) The main burden of disease remains concentrated in large urban areas (3-year average notification rates, 2023 to 2025, by local authority areas provided in Figures 3a and 3b, and in Supplementary Table 8).
Figure 3a. Three-year average TB notification rates by local authority in London, England, 2023 to 2025
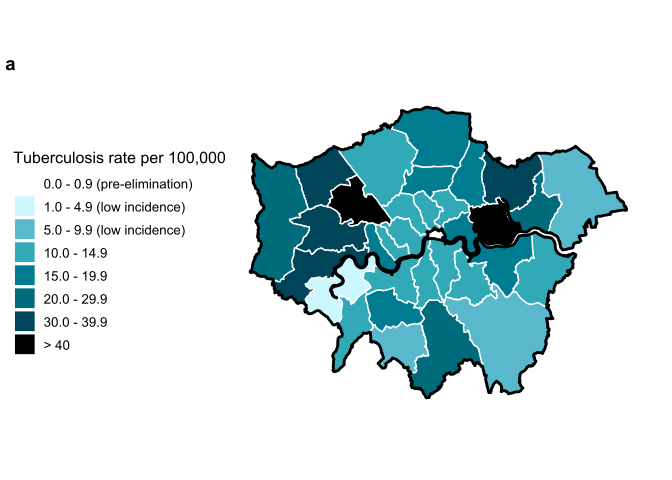
Note to Figure 3a: due to small numbers, small local authorities were merged with neighbouring local authorities. City of London is merged with Hackney, and merged rates are presented in this figure.
Figure 3b. Three-year average TB notification rates by local authority district, England, 2023 to 2025

Note to Figure 3b: UKHSA region boundaries are outlined in black.
The data used in these figures can be found in Supplementary Table 8.
Social and demographic characteristics of people with TB
Notification rates of TB by place of birth, sex and age
People born outside the UK accounted for 82.3% (4,479 out of 5,441 with known place of birth) of TB notifications in 2025, a proportion which is similar to 2024 and which has slowly increased since 2016 (Table 2). TB notification rates continued to be much higher in those born outside the UK compared with those born in the UK in 2025 (45.6 versus 2.0 per 100,000 population). In 2025 the TB notification rate in people born outside of the UK was similar to previous years (3.1% decrease), compared with large increases in 2023 and 2024. In people born in the UK the TB notification rate in 2025 was also similar to 2024 (1.1% decrease) compared with the upward trend in 2023 and 2024. The decrease in TB notification rates between 2024 and 2025 did not reach statistical significance in either the non-UK-born or UK-born populations, as the 95% confidence intervals overlap (see Table 2 and Supplementary Table 9).
Table 2. Proportion of TB notifications in the non-UK born and TB notification rates by place of birth, England, 2016 to 2025
| Year | Non-UK born (percentage) | Non-UK born rate per 100,000 | Non-UK born lower CI | Non-UK born upper CI | UK born rate per 100,000 | UK born lower CI | UK born upper CI |
|---|---|---|---|---|---|---|---|
| 2016 | 73.80 | 49.05 | 47.57 | 50.58 | 3.15 | 2.99 | 3.32 |
| 2017 | 71.50 | 41.94 | 40.59 | 43.34 | 3.07 | 2.91 | 3.23 |
| 2018 | 72.00 | 38.43 | 37.14 | 39.77 | 2.73 | 2.58 | 2.88 |
| 2019 | 73.70 | 39.57 | 38.27 | 40.92 | 2.60 | 2.46 | 2.75 |
| 2020 | 73.20 | 34.19 | 32.99 | 35.44 | 2.32 | 2.19 | 2.46 |
| 2021 | 77.20 | 37.72 | 36.47 | 39.02 | 2.11 | 1.98 | 2.25 |
| 2022 | 79.10 | 37.84 | 36.60 | 39.12 | 1.93 | 1.81 | 2.06 |
| 2023 | 80.10 | 41.26 | 39.98 | 42.58 | 2.04 | 1.92 | 2.17 |
| 2024 | 82.20 | 47.09 | 45.73 | 48.49 | 2.06 | 1.93 | 2.19 |
| 2025 | 82.30 | 45.64 | 44.32 | 47.00 | 2.04 | 1.92 | 2.17 |
The age and sex distribution of people notified with TB in 2025 differed between place of birth (UK or outside of the UK) and are shown in Appendix Figure A3a (UK-born) and A3b (non-UK born) and Supplementary Table 10. In people born in the UK, the median age was 45 and 64.2 % (618 out of 962) were male. The number of notifications were similar across the older adolescent and adult age groups (Figure 4a). The highest notification rates per 100,000 population were reported in those aged 35 to 39 years old (Figure 4b and Supplementary Table 11).
In 2025, people notified with TB and born outside the UK were younger than people with TB born in the UK with a median age of 35, and a slightly lower proportion were male 60.9% (2,728 out of 4,479), especially in the older age groups (Figure A3b), The number of notifications and notification rates were highest in older adolescents and young adults (Figures 4a and 4b and Supplementary Table 11).
Figure 4a. Number of TB notification by age groups and by place of birth (UK and non-UK born), England, 2025
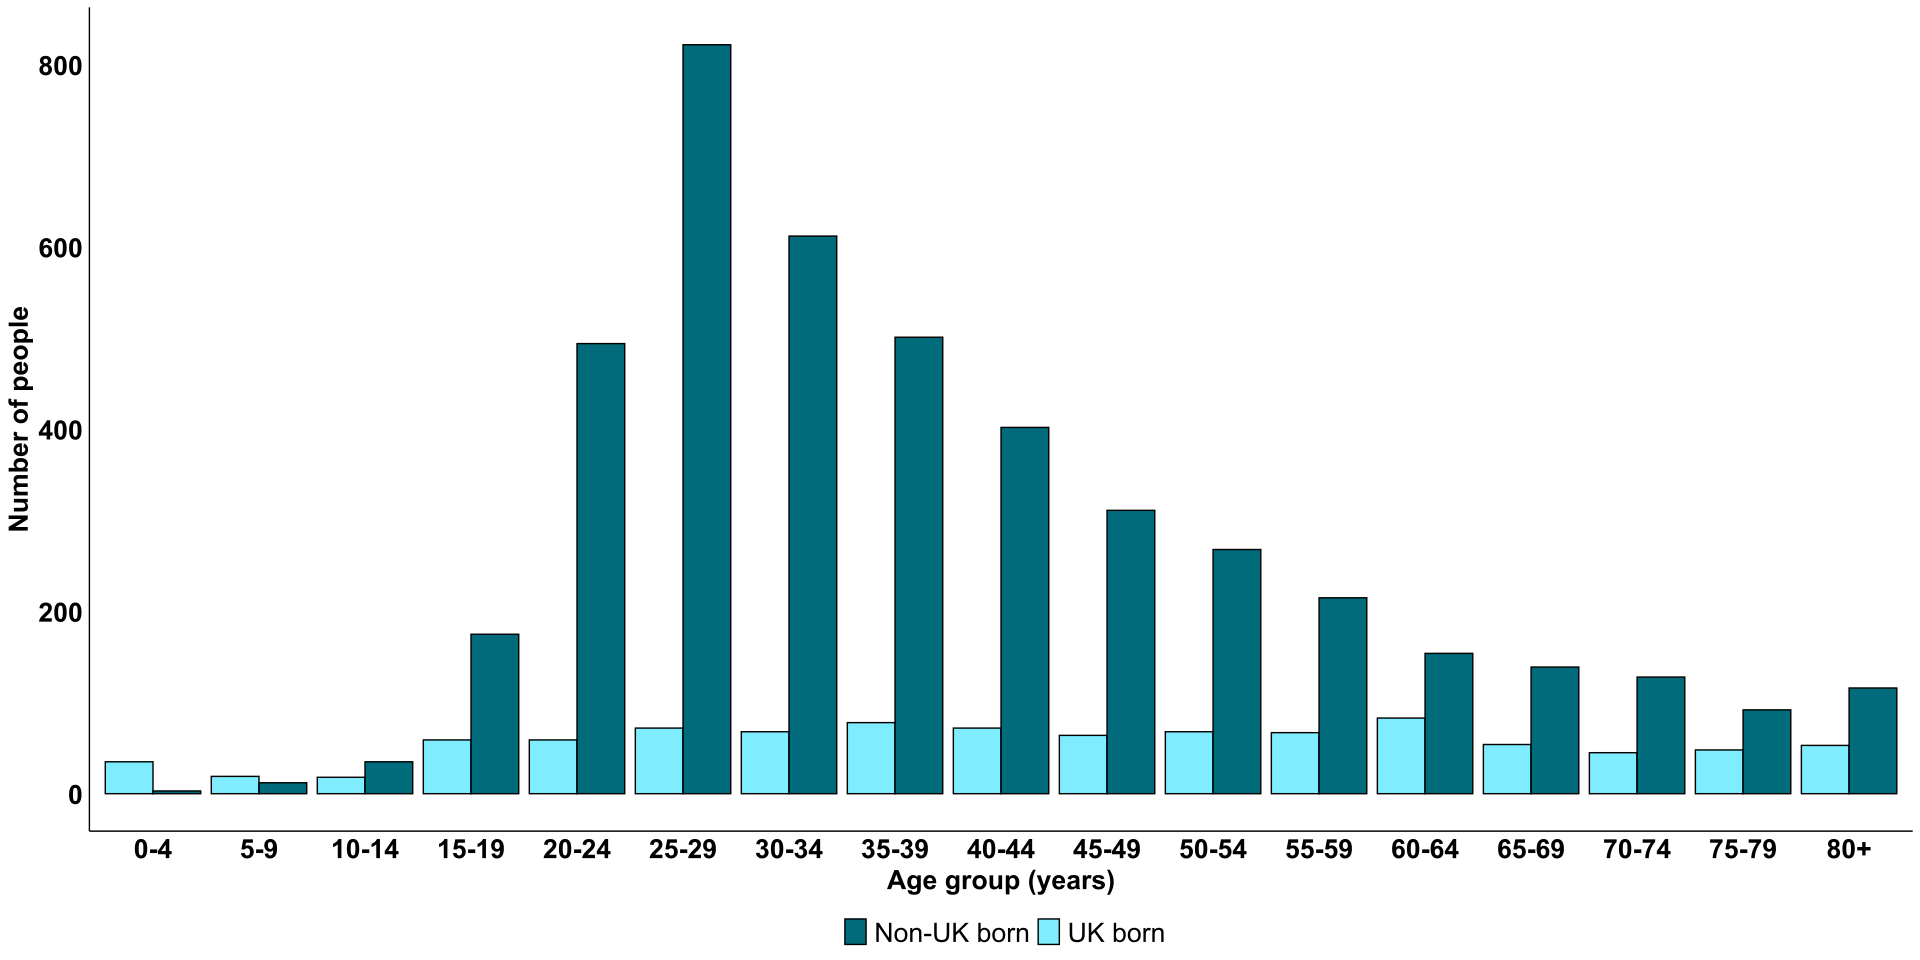
Figure 4b. TB notification rates by age groups and by place of birth (UK and non-UK born), England, 2025
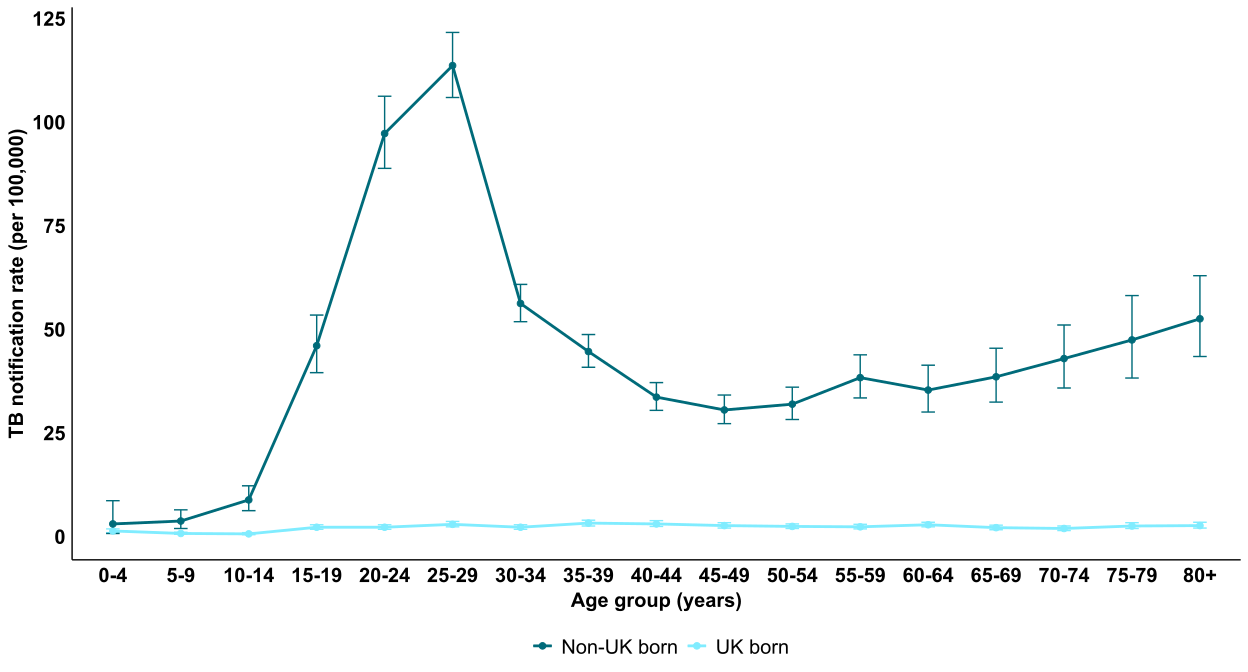
Data used in this figure can be seen in Supplementary Table 11.
TB notification rates by UKHSA region for people born inside and outside of the UK from 2001 to 2025 are shown in Supplementary Table 12.
Countries of birth and time between entry to the UK and TB notification
The National TB Action Plan 2021 to 2026 sets out a key objective to reduce the proportion of TB disease notifications in people born outside the UK within 5 years of their arrival by 5.0% each year using the 2017-2019 average as a baseline. There are 2 national screening programmes that support this target (see TB Prevention chapter):
- Pre-entry active pulmonary TB screening led by the UKHSA Border Health team and Home Office.
- Post-entry latent TB infection (LTBI) testing and treatment delivered by the NHS.
TB notifications in people born outside the UK by time of entry show significant changes over the last 5 years. The proportion of notifications less than 5 years of entry has increased from 27.7% in 2021 to 40.8% in 2025. The proportion of all TB notifications less than 3 years of entry in particular, increased from 20.1% in 2021 to 31.3% in 2025. This pattern was also observed for pulmonary TB notifications which increased from 9.7% less than 3 years in 2021 to 15.4% in 2025 (Figure 5) and (Supplementary Table 13).
Figure 5 Proportion of notifications (all sites of disease and pulmonary TB (PTB) only) in people born outside of the UK by time since entry to the UK, England 2020 to 2025
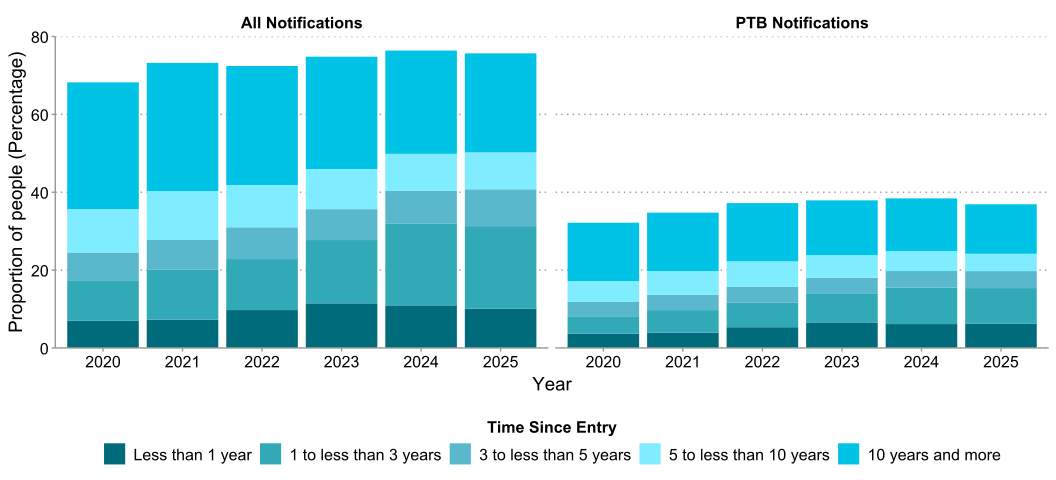
The data used in this figure can be seen in Supplementary Table 13.
Notes to Figure 5:
- the denominators in the above figure are the total number of notifications per year
- time between entry to the UK and TB notification is calculated as whole years (only year of entry is reported to National TB Surveillance (NTBS)
- year of entry to the UK is missing for a proportion of non-UK born individuals each year ranging from 6.4% in 2023 to 7.0% in 2024 and 7.9% in 2025
In 2025 the most common country of birth for people notified with TB was India (25.1%,) followed by the UK 17.7% (962), Pakistan (11.9%,), Nigeria (4.1%,) and Eritrea (3.9%,) Figure 6 panel A. India has been the most common country of birth for people with TB in England since 2022 (Supplementary Table 14).
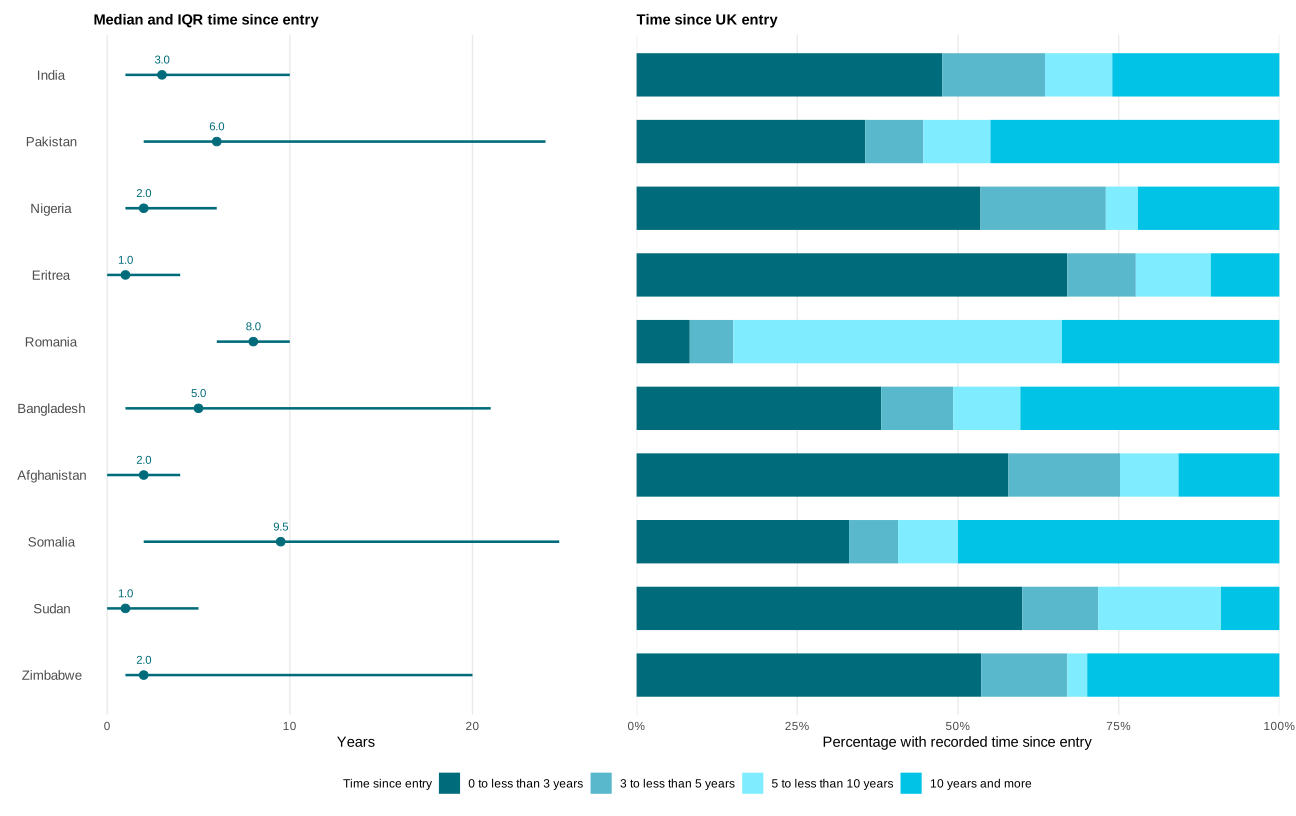
For people entering the UK from India, the median time from entry to TB notification was 3 years. The median time from entry was 6 years for those from Pakistan, 2 years for those from Nigeria, 1 year for those from Eritrea and 8 years for those from Romania (Figure 6 panel B and Supplementary Table 15). For people entering from India, the proportion notified within 5 years of entry has increased from 28% in 2019 to 59.5% in 2025 (814 out of 1,369). For those entering from Pakistan, the proportion notified within 5 years of entry also increased from 21.2% in 2019 to 38.8% (252 out of 649) in 2025 (Figure 6 panel B and Supplementary Table 16).
Figure 6 Panel A. Profiles for the top 10 countries of birth in 2025, England, 2025
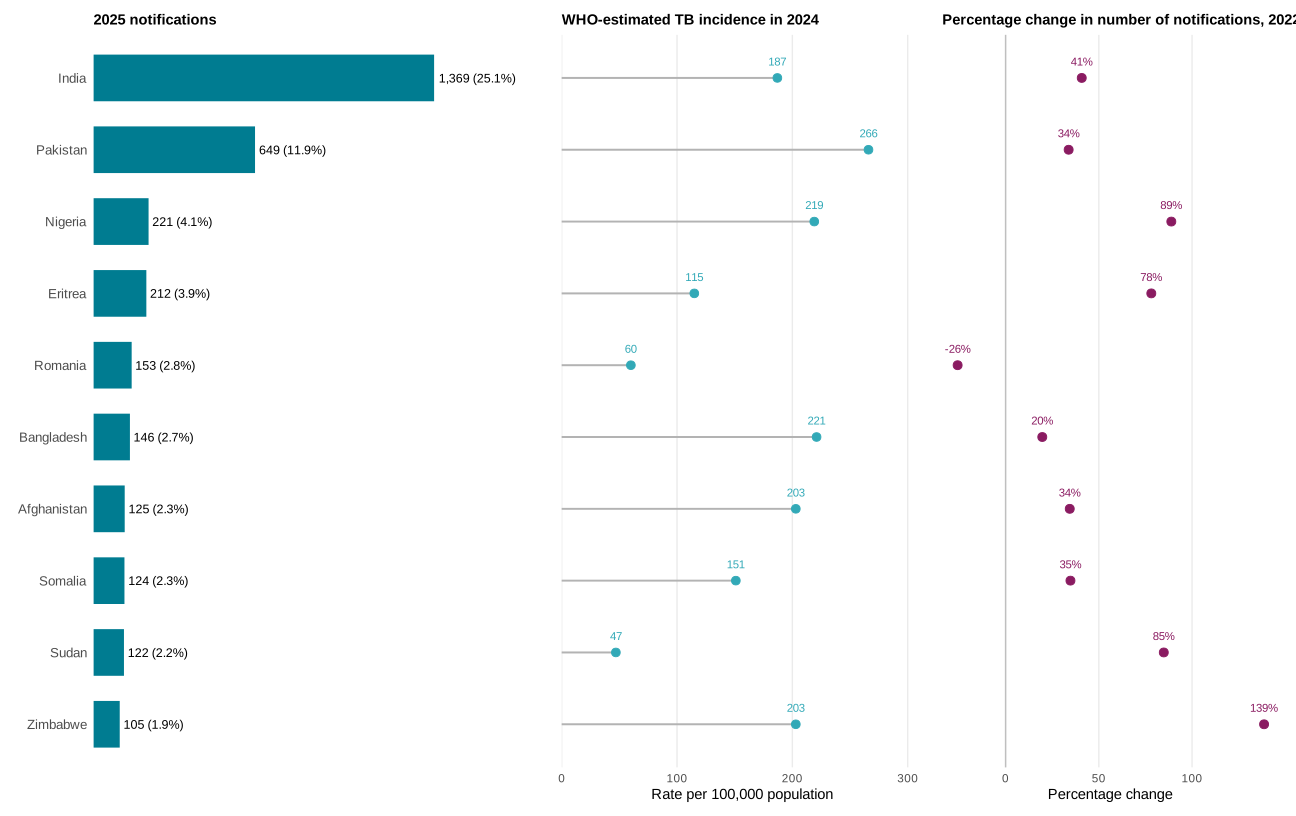
Figure 6 Panel B. Time since entry to the UK for the top 10 countries of birth, England, 2025
Notes to Figure 6:
- IQR stands for inter-quartile range (25th percentile to 75th percentiles of the distribution)
- in 2025 place of birth (UK or non-UK) and or country of birth is missing for 8 notifications in 2025
- time between entry to the UK and TB notification is calculated as whole years (only year of entry is reported to National TB Surveillance (NTBS)
- time since entry to the UK was not known for 356 people in 2025
Appendix Figure A4a shows the breakdown of time since entry to the UK for the top 5 countries of birth. The remaining countries of birth with more than 40 notifications in 2025 are shown in Appendix Figure A4b and in Supplementary Table 16.
Key characteristics of people notified in 2025 born outside of the UK from the 5 most frequent countries of birth are shown in Supplementary Table 17 and include mean age, proportion of males, pulmonary TB and proportion of recent entrants notified within 2 years of entry to the UK by site of disease.
Differences in TB notification rates between UK and non-UK born populations of the same ethnic group
TB notification rates are higher for people of all ethnic groups who were born outside the UK compared with the same ethnic groups born in the UK (Figure 7b). For people born outside the UK, those of Pakistani and Indian ethnicities had the highest rates of more than 100 per 100,000 population. For people born in the UK the highest rate was observed in those of Black-other (15.6 per 100,000) and Pakistani ethnicity (13.3 per 100,000) but note the small numbers of notifications with Black-other ethnicity recorded and therefore the low precision in this estimate (Supplementary Table 18).
Figure 7a. Number of TB notifications by place of birth and ethnicity, England, 2025
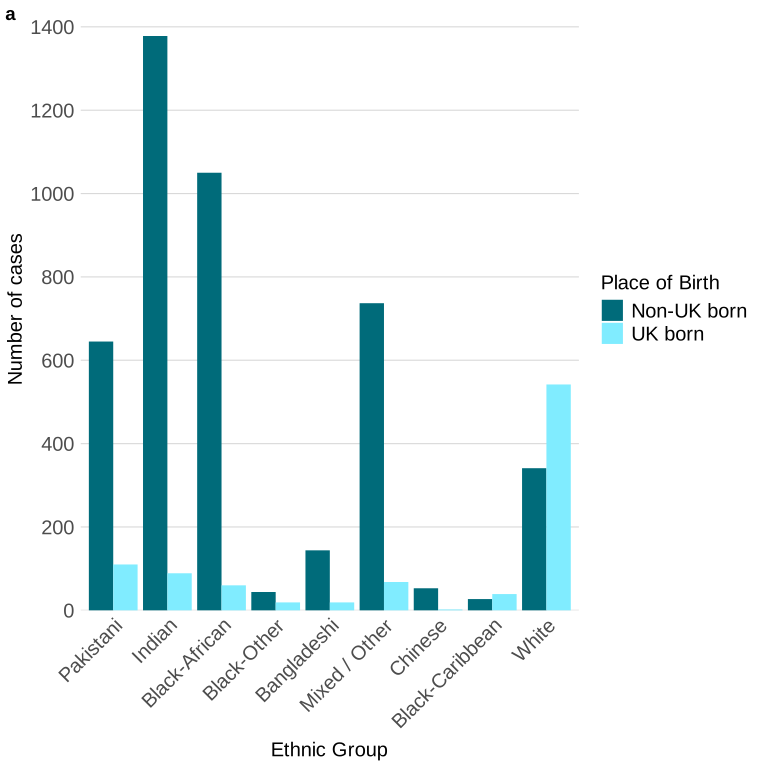
Figure 7b. TB notification rates per 100,000 population by place of birth and ethnicity, England, 2025
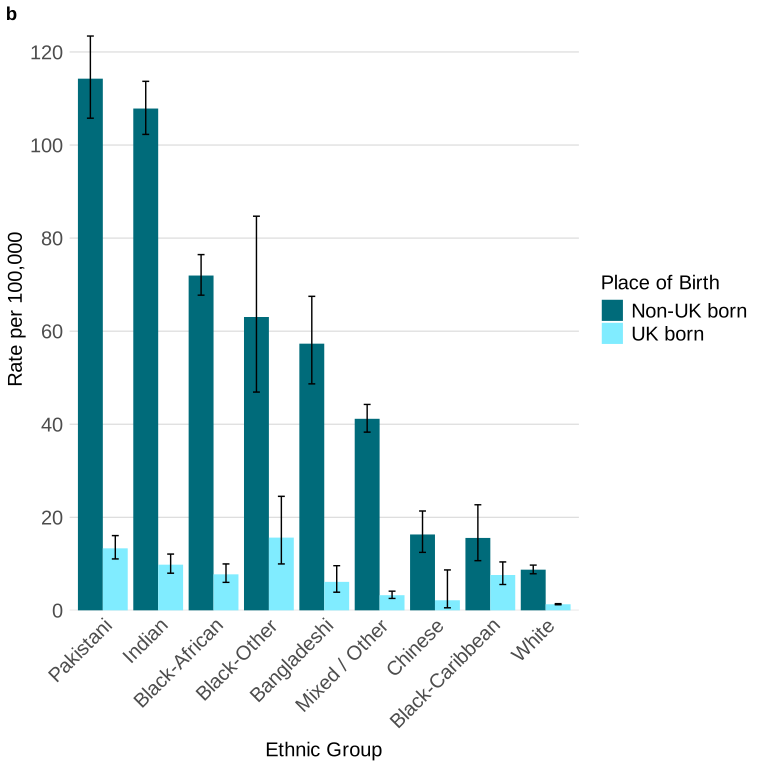
The data used in this figure can be found in Supplementary Table 18.
Changes over time in TB notifications and notification rates by ethnic groupings and place of birth
In 2025, the TB notification rate among people born outside the UK decreased to 45.6 per 100,000 population, following four consecutive annual increases since 2020. Prior to 2020, the lowest rate recorded since enhanced surveillance began in 2000 was 38.4 per 100,000 population in 2018 (Supplementary Table 9). Between 2018 and 2025 there was variation by ethnicity with notable increases in rates. The largest increases are in Pakistani (27.3%), Mixed/Other (12.2%) and Bangladeshi (7.1%). The largest decreases are in Chinese (24.8%) Black-Other(22.6%) then White (19.3%). However, the peak rates for people from India and Pakistan were observed in 2024 (see Appendix figure A5 and Supplementary Table 18).
Clinical characteristics of disease
Site of disease
The site of TB disease contributes to determining whether an individual is infectious or not, the symptoms experienced, potential complications and clinical management strategies. In 2025, just over 50% of individuals notified with TB were reported to have a pulmonary site of disease (52.6%, 2,866 out of 5,449) which is consistent with previous years (Table 3).
Table 3. TB case notifications by site of disease, England, 2025
| Type | Site of disease | Number of notifications | Percentage |
|---|---|---|---|
| Pulmonary | All pulmonary | 2,866 | 52.6 |
| Pulmonary | Miliary | 136 | 2.5 |
| Pulmonary | Laryngeal | 19 | 0.3 |
| Extra-pulmonary | All extra-pulmonary | 3,499 | 64.2 |
| Extra-pulmonary | Extra-thoracic lymph nodes | 1,276 | 23.4 |
| Extra-pulmonary | Intra-thoracic lymph nodes | 895 | 16.4 |
| Extra-pulmonary | Pleural | 427 | 7.8 |
| Extra-pulmonary | Other extra-pulmonary | 828 | 15.2 |
| Extra-pulmonary | Gastrointestinal | 329 | 6.0 |
| Extra-pulmonary | Bone – spine | 256 | 4.7 |
| Extra-pulmonary | Bone – not spine | 124 | 2.3 |
| Extra-pulmonary | Central nervous system (CNS) – meningitis | 93 | 1.7 |
| Extra-pulmonary | Genitourinary | 70 | 1.3 |
| Extra-pulmonary | Central nervous system (CNS) – other | 57 | 1.0 |
| Extra-pulmonary | Cryptic disseminated | 56 | 1.0 |
Note to Table 3: individuals may have more than one site of disease. Pulmonary disease includes those with or without disease at another site in addition to the lungs.
Risk factors for pulmonary disease
In 2025 pulmonary TB was less common in people who were born outside of the UK (49.1%) compared with people born in the UK (68.6%), which is consistent with previous years.
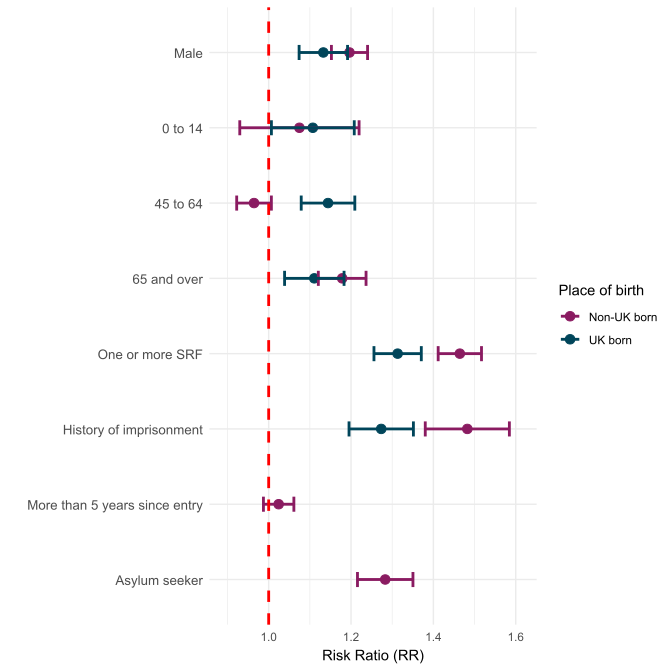
When examining the risk ratios (RRs) of factors associated with pulmonary TB stratified by place of birth (UK or non-UK) there were larger effects (increased risk of pulmonary TB) associated with having any social risk factor (SRF) or of imprisonment in people born outside of the UK, whilst the effect of age also appeared to differ. Within the non-UK born population being an asylum seeker was also associated with an increased risk of pulmonary TB (Figure 8 and Supplementary Table 19). However, although these social risk factors have a bigger effect in the non-UK born, they are less prevalent in people born outside of the UK (as can be seen in section 10 and Figure 11).
Figure 8. Risk factors for pulmonary TB disease, England, 2023 to 2025 (aggregated data, univariable analysis)
The data underlying this figure can be seen in Supplementary Table 19.
Notes to Figure 8:
- a risk ratio (or relative risk) compares the probability of an event (such as pulmonary TB) in one group compared to another, quantifying how much more or less likely the event is in one group versus another
- reference groups for the relative risks in the order they are presented are: female, aged 15 to 44 years old, no social risk factors, no history of imprisonment, less than 5 years since entry to the UK and not seeking asylum
Co-morbidities in TB
Comorbidities with conditions such as diabetes, living with human immunodeficiency virus (HIV), or chronic renal disease and a range of prescribed medications can increase susceptibility to TB by weakening immune defences. Some conditions can complicate TB diagnoses and require tailored treatment strategies. Additionally, comorbidities can often be linked to poorer outcomes including higher rates of treatment failure.
The prevalence of comorbidities recorded within NTBS for people notified in 2025 are shown in Table 4a. The most commonly reported comorbidity was diabetes (10.4%) followed by immunosuppression caused by medical treatment (7.4%). In 2025, 19.9% (1,001 out of 5,034) of people with TB were reported to have at least one comorbidity, which is similar to previous years.
Among those reporting immunosuppression (362 out of 4,904), 45.6% had other or not specified types of immunosuppression. 24.0% reported cancer or cancer treatment followed by 18.8% on biological therapies and 8.0% on steroids (Table 4b).
Table 4a. Comorbidities in individuals with TB, England 2025
| Co-morbidity | Number of people with TB | Proportion (%) | Total with data recorded |
|---|---|---|---|
| At least one comorbidity | 1,001 | 19.9 | 5,034 |
| Diabetes | 515 | 10.4 | 4,952 |
| Chronic liver disease | 62 | 1.3 | 4,876 |
| Chronic renal disease | 139 | 2.8 | 4,915 |
| Hepatitis B | 103 | 2.2 | 4,712 |
| Hepatitis C | 32 | 0.7 | 4,702 |
| Immunosuppression | 362 | 7.4 | 4,904 |
Table 4b. Causes of immunosuppression co-morbidity in people with TB, England, 2025
| Reason for immunosuppression | Number of people with TB | Proportion (percentage) | Total with data recorded |
|---|---|---|---|
| Biological therapy | 68 | 18.8 | 362 |
| Transplantation | 13 | 3.6 | 362 |
| Cancer | 87 | 24.0 | 362 |
| Steroids | 29 | 8.0 | 362 |
| Other or not known immunosuppression | 165 | 45.6 | 362 |
HIV testing and co-infection
Untreated HIV infection increases the risk of developing active TB disease and universal HIV testing is standard within TB programmes. The proportion of people being offered HIV testing is recorded in NTBS although test results were not captured until 2026. Details of how HIV status is captured for analysis of HIV co-infection presented below can be seen in the Methodology and definitions chapter of this report and has changed compared to previous years.
In 2025 93.9% (4,777 out of 5,085) of individuals with unknown HIV status were recorded as being offered an HIV test and 98.5% (4,703 out of 4,777) of these as having completed the test. Information on whether an HIV test was offered or not was missing for 218 people.
In 2025, evidence of coinfection with HIV was found in 2.0% (111 out of 5,449) of individuals with TB compared with 2.8% (152 out of 5,485) in 2024 and a peak of 3.5% in 2023 in the period 2018 to 2025 (Supplementary Table 20) .It should be noted that the prevalence of HIV co-infection is higher for most years in the current report compared with last year’s annual report likely resulting from improved methodology. However, there is also a decrease for the current reporting year compared with the previous year, likely from delayed data reporting. For example, in the previous report 83 people were identified as having HIV-co-infection in 2024 compared with 152 for 2024 in this year’s report. Further information is included in the Methodology and definitions chapter of this report.
The proportion of those with TB coinfected with HIV and hepatitis B or C remains very low at 0.1% (8 out of 5,449) in 2025. HIV and hepatitis co-infection over time is available in Supplementary Table 20 of the accompanying spreadsheet.
Cigarette smoking
Smoking is a known risk factor for TB, increasing both the risk of contracting TB as well as the severity of disease by impairing lung immune responses. In 2025, 1,030 people reported a history of smoking of whom 664 were current smokers, 13.8% of 4,818 people with data reported, which is comparable to previous years (TB in England, 2025) and slightly higher than rates observed in the general adult UK population at 10.6%.
Social risk factors, deprivation and risk of TB
Social risk factors
Some groups of people are more likely to experience discrimination, social exclusion and stigma. This can often be due to factors such as homelessness, imprisonment, mental health needs or immigration status. These groups, included in the categories of inclusion health groups, are well known to face substantial barriers to accessing healthcare, which can result in poorer health outcomes.
The national TB surveillance system collects data on 6 social characteristics, which are referred to in this report as social risk factors (SRFs). These are known to be associated with a higher risk of contracting TB, and lead to people facing barriers in access to healthcare, and poorer health outcomes. NTBS collects data on:
- alcohol misuse
- drug misuse
- homelessness
- imprisonment
- mental health needs
- asylum seeker status
The section below presents analysis on SRF for TB notifications in people aged 15 years or older from 2018 onwards, which is the period where SRF data is most complete. In 2025, 5,327 notifications were included in the analysis (Supplementary Table 21).
For further information on how SRF data is recorded, please see the methodology and definitions chapter of the 2025 annual report.
Proportions of people with TB and social risk factors
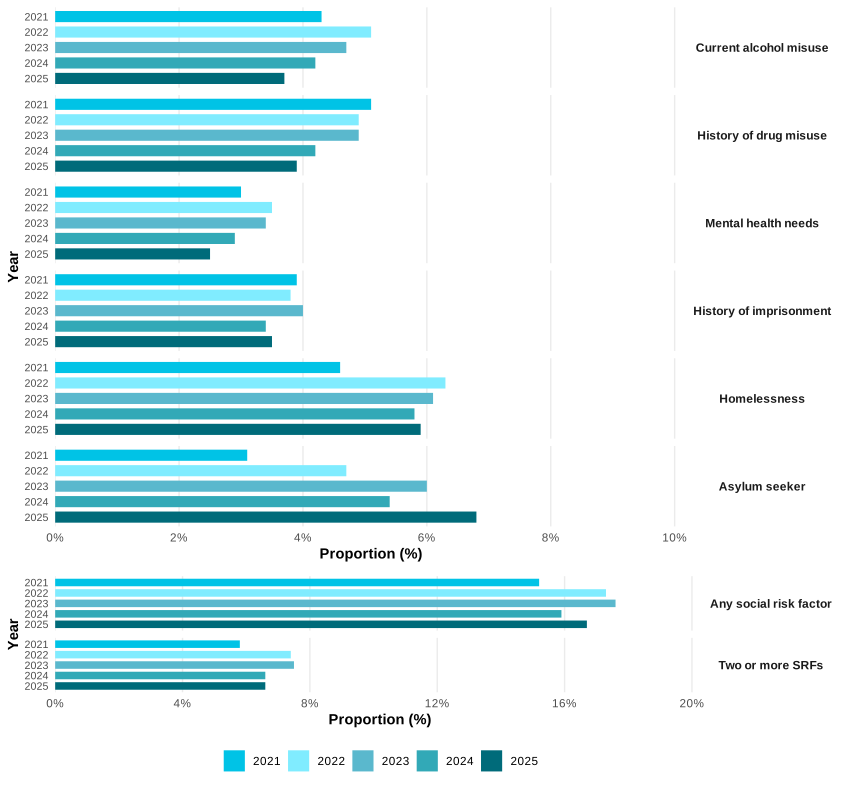
In 2025, in all people notified with TB aged 15 years or older, just over 1 in 6 (16.7%, 892 out of 5,327) were reported to have one or more SRFs. similar to previous years. Two or more SRFs were reported in 7.2% (354 out of 4,908) of notifications in 2025, with some indication of an overall upwards trend since 2018 (Figure 9 and Supplementary Table 21).
In 2025, limited to those with reported data, self-reported asylum seeker status was the most common SRF (7.4%, 364 out of 4,915) followed by current or previous homelessness (6.5%, 314 out of 4,799) and current or previous drug use (4.3%, 206 out of 4,805) (Figure 9 and Supplementary Table 21).
Figure 9. Proportions of people aged 15 or more with individual social risk factors (SRFs), England 2025
The data used in this figure can be seen in Supplementary Table 21.
Note to Figure 9: the denominator for individual SRFs is the number with reported data for that SRF. The denominator for one or more SRFs is all notifications and for 2 or more SRFs it is the number of people with data recorded for at least 2 out of the 6 SRFs collected.
The prevalence of SRFs by UKHSA region from 2018 to 2025 is shown in Supplementary Table 22. In 2025, in people notified with TB aged 15 years or older the proportion of people with one or more SRF ranged from 15.1% (93 out of 617) in the West Midlands to 18.2% (118 out of 649) in the North West (Supplementary Table 22).
Characteristics associated with having one or more social risk factors
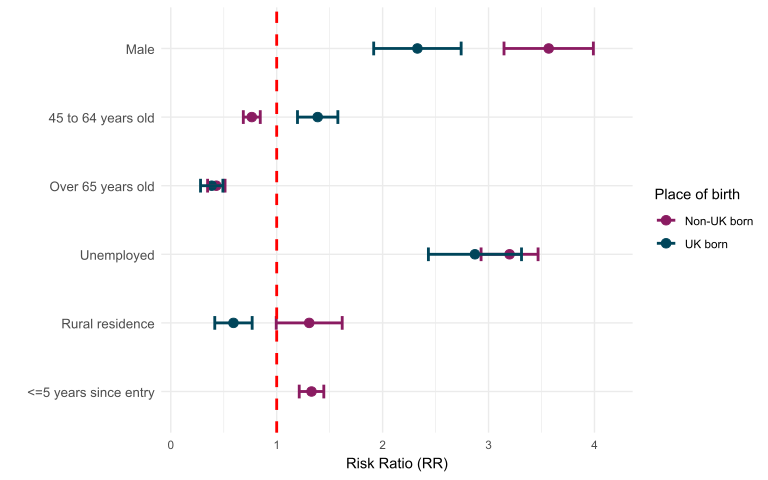
Figure 10 shows that the association of socio-demographic characteristics with the risk of having one or more SRFs presented as risk ratios differs between people born inside and outside of the UK, with people of male sex having more than triple the risk in people born outside of the UK compared with a more than doubled risk in people born in the UK. Rural compared with urban location of residence (see Methodology and definitions chapter) was also differentially associated, with a probable 30% increased risk in people born outside of the UK (RR 1.31, 95% CI 1.00 to 1.62) to a 40% decreased risk in people born in the UK (RR 0.59, 95% CI 0.42 to 0.77) Unemployment was also associated with risk of having a SRF in both groups with possible increased effect in people born outside of the UK.
Figure 10. Relative risks of factors associated with having one or more SRFs in people notified with TB between 2023 to 2025 (aggregate data), England, 2025
Data underlying this figure can be seen in Supplementary Table 23.
Notes to Figure 10:
- only people aged 15 years or older are included
- reference groups for risk ratios in the order presented are as follows: female, aged 15 to 44 years old, employed, urban residence, and more than 5 years since entry; time since entry is limited to people born outside of the UK
Prevalence of individual social risk factors by place of birth, age and ethnicity
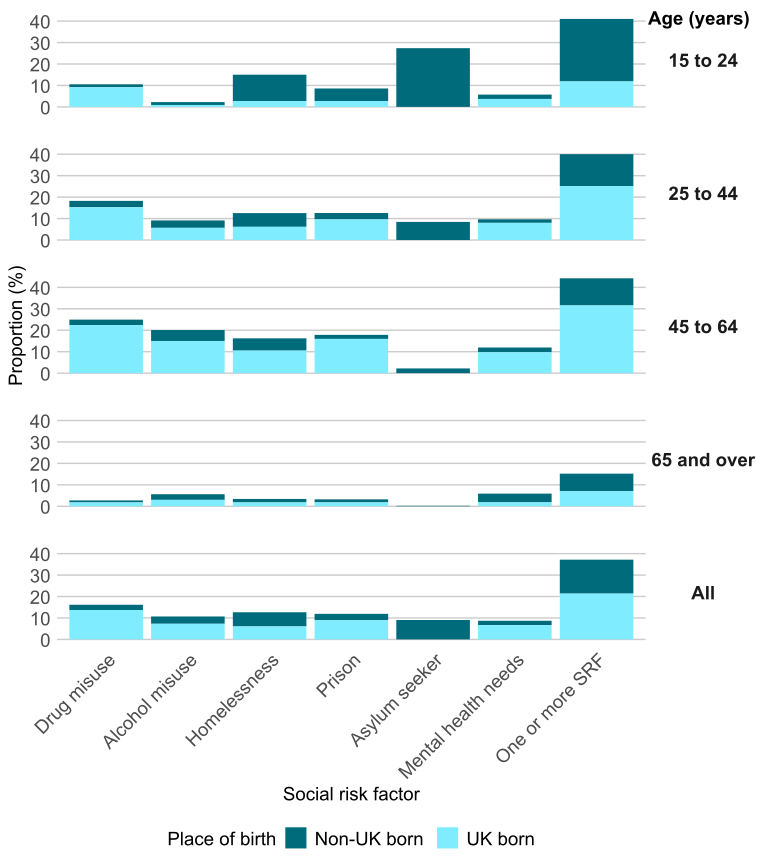
Figure 11 shows that the prevalence of different SRFs varies by place of birth (UK or non-UK) and age. In 2025, for all age groups combined, 21.4% (190 out of 890) people born in the UK and aged 15 years or more reported at least one SRF compared with 15.8% (701 out of 4,429) in people born outside of the UK. The most common SRF in people born in the UK was history of drug misuse (13.2%, 107 out of 780 with data reported) followed by prison history (8.9%, 69 out of 773) and current alcohol misuse (7.3%, 57 out of 782). In contrast, for people born outside of the UK, the most common SRF was seeking asylum (9.1%, 364 out of 4,021) followed by history of homelessness, which was similar in the two groups (6.6%, 266 out of 4,017 compared with 6.0%, 47 out of 778) (Supplementary Table 24).
When further broken down by age the prevalence of asylum seeking and homelessness in people born outside of the UK was much more common in the younger age groups, reaching 24.5% and 10.9% respectively of those aged 15 to 24 years. In contrast, drug misuse was the most frequent SRF in people born in the UK of the same age group (8.5%) but which increased with age to 19.1% in people aged 45 to 64 years. All SRFs were relatively uncommon in people aged 65 years or more, but with alcohol and mental health needs being the most common (Figure 11). This pattern of differences has remained broadly consistent over time (2018 to 2025, Supplementary Table 24).
Figure 11. Social risk factors by age and place of birth (UK-born or non-UK born), England, 2025
Data underlying this figure can be found in Supplementary Table 24.
Analysis of SRFs by ethnicity and place of birth and aggregated across years from 2019 to 2025 shows large variation (Supplementary Table 25). In people born outside the UK, those born in Sudan had the highest proportion reporting at least one SRF (57.5%, 302 out of 525) followed by Eritrea (54.6%, 550 out of 1007) and Afghanistan (42.2%, 263 out of 623) mostly due to the high proportions of people with TB from these countries seeking asylum. For people born in the UK, people with Black-Caribbean ethnicity had the highest proportion of one or more SRFs (39.7%, 129 out of 325) with history of drug misuse and prison being the most common.
TB notification rate increased with increased levels of deprivation
Deprivation is a well-known contributing factor to TB risk, by increasing likelihood of overcrowded housing, poor nutrition and poorer access to healthcare and treatment. Data for 2025 continues to show those living in deprived areas have significantly higher rates of TB notifications. People living in most deprived areas (had a rate 6.9 times higher (19.4 per 100,000 population) than those in the least deprived areas (2.8 per 100,000). This inequality in the burden of TB across deprivation groups has increased since 2019 when the difference in notification rates from the most to least deprived was 5.0 times higher (Figure 12 and Supplementary Table 26).
Figure 12. TB notification rate by deprivation decile, England, 2019 and 2025
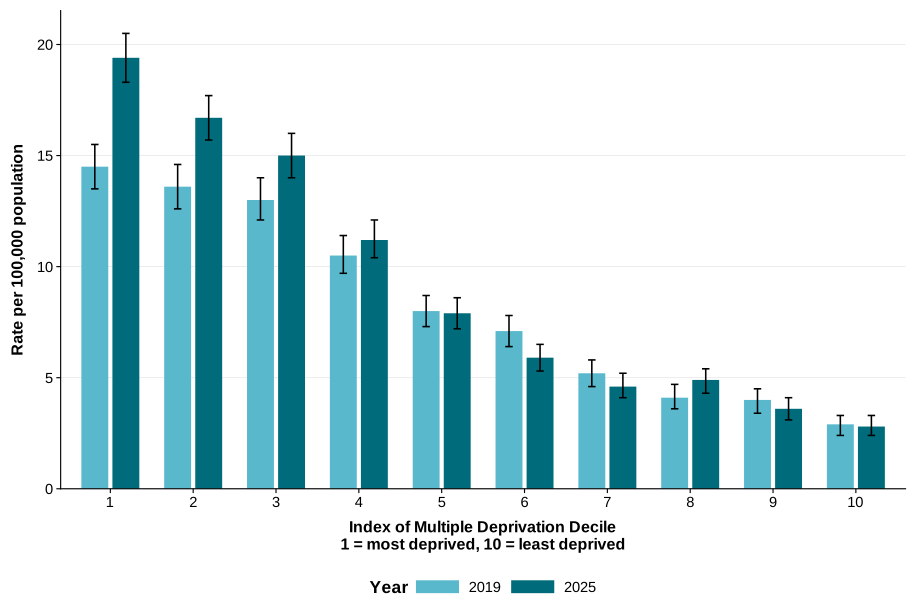
Note to Figure 12: the index of multiple deprivation (IMD) ranks small areas in England by deprivation using 7 key domains including but not limited to income, housing, employment, crime and environment. Each area is scored and ranked nationally from most to least deprived.
Data used in this figure is available in Supplementary Table 26.
Appendix
Figure A1. Required rates and excess observed TB rates to meet 90% reduction by 2035, England, 2016 to 2025
Data used in this figure is available in Supplementary Table 3 of the accompanying spreadsheet.
Figure A2a. Number of TB notifications (i) and rate (ii) by UKHSA region for London, 2011 to 2025
Fig A2a(i)
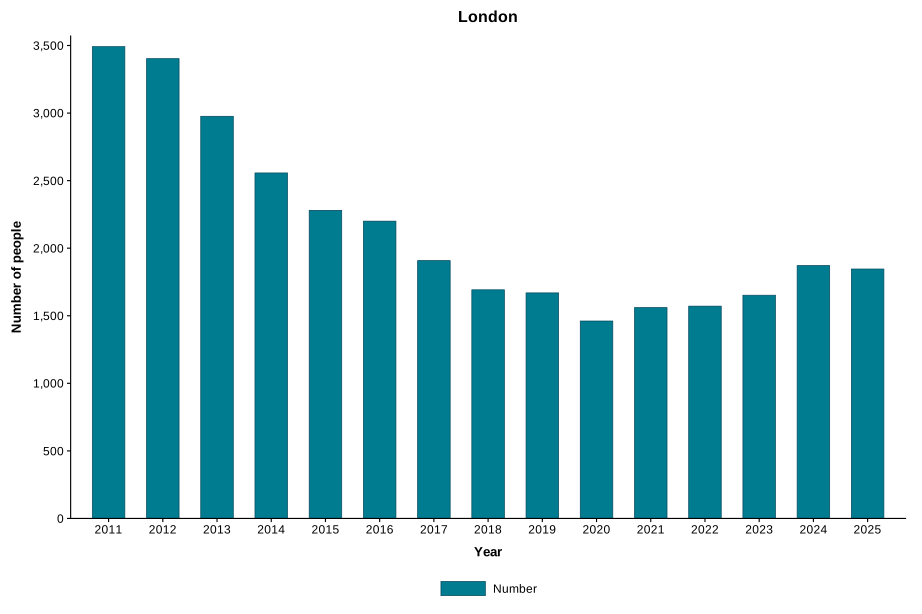
Fig A2a(ii)
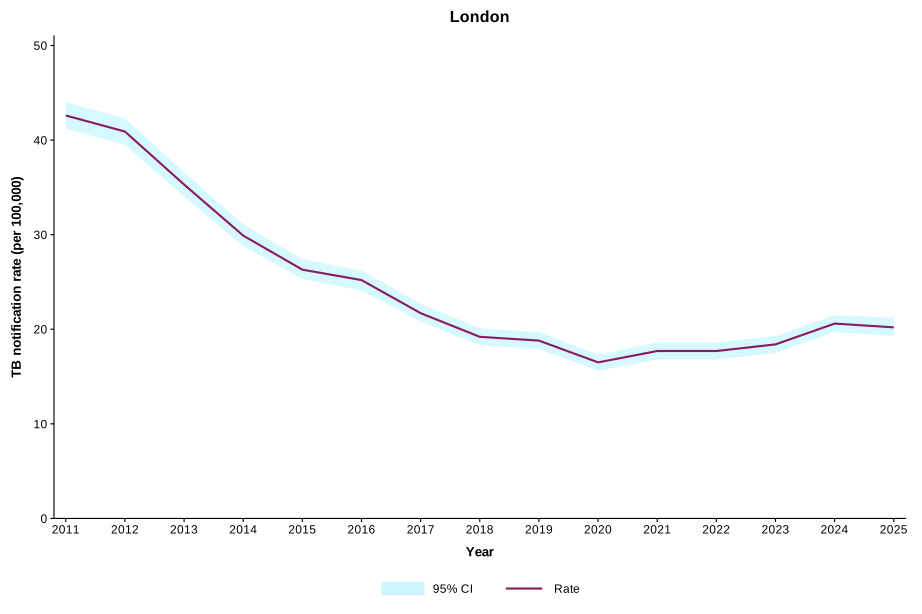
Figure A2b. Number (i) and rates (ii) of TB for West Midlands, South East, North West and East of England UKHSA regions 2012 to 2025
Fig A2b(i)
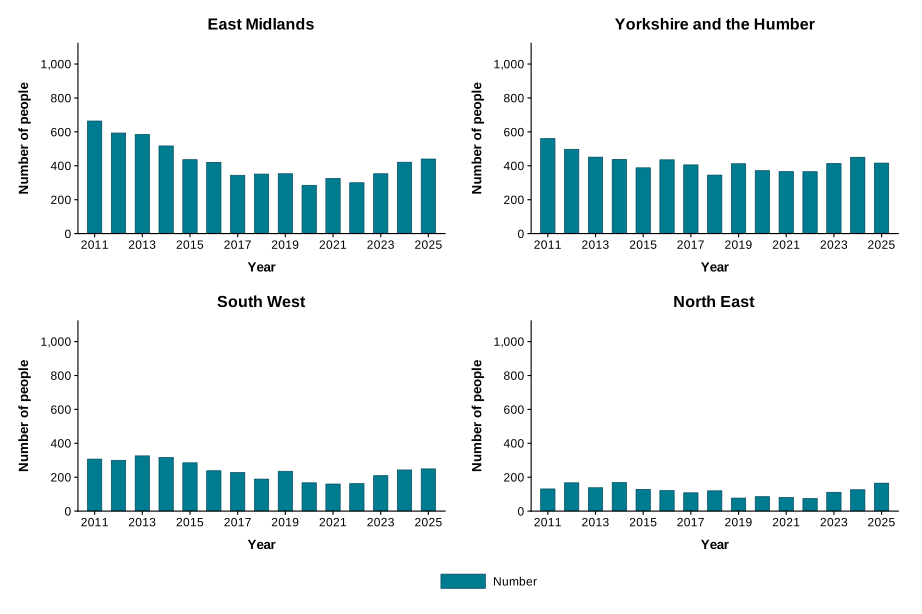
Fig A2b(ii)
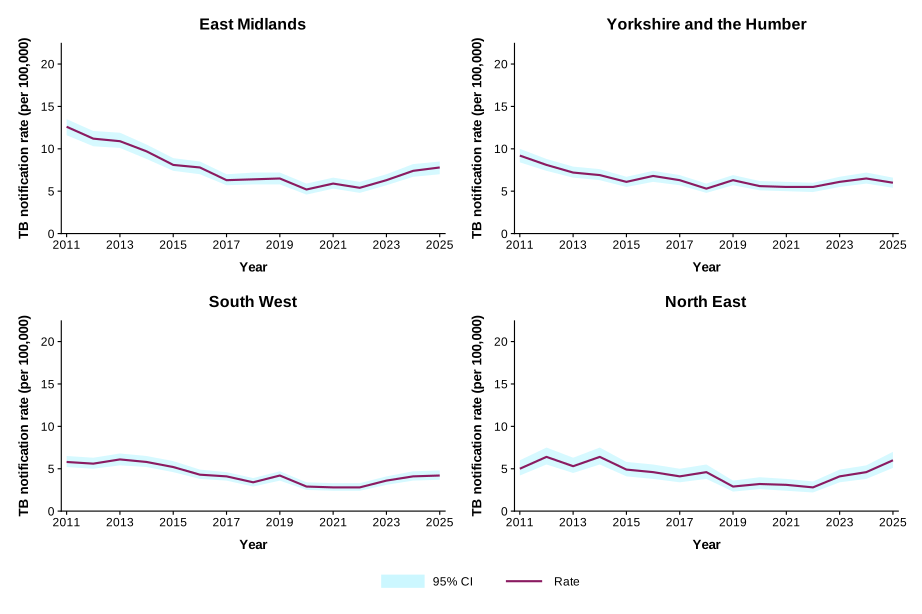
Figure A2c. Number (i) and notification rates (ii) of TB for East Midlands, Yorkshire and Humber, South West and North East UKHSA regions, 2011 to 2025
Fig A2c(i)
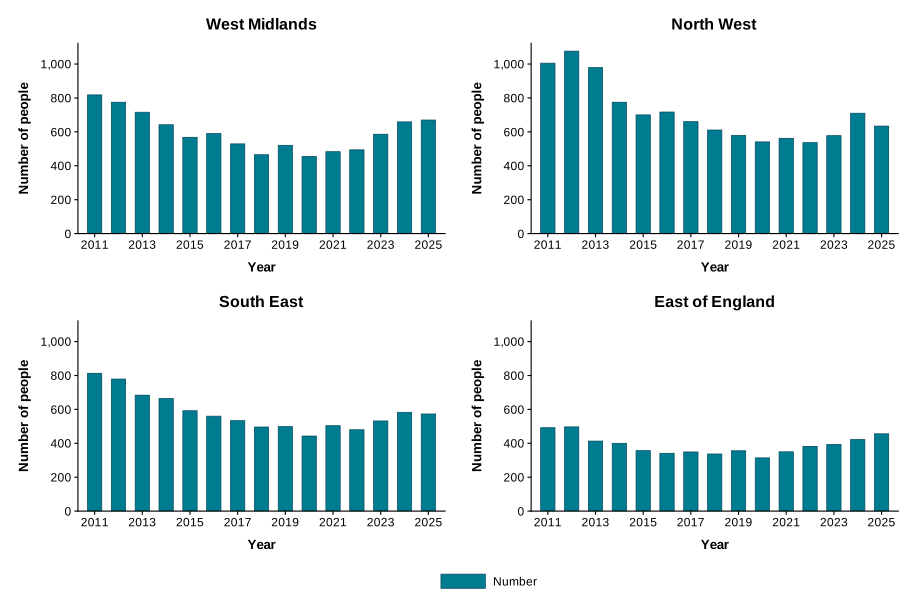
Fig A2c(ii)
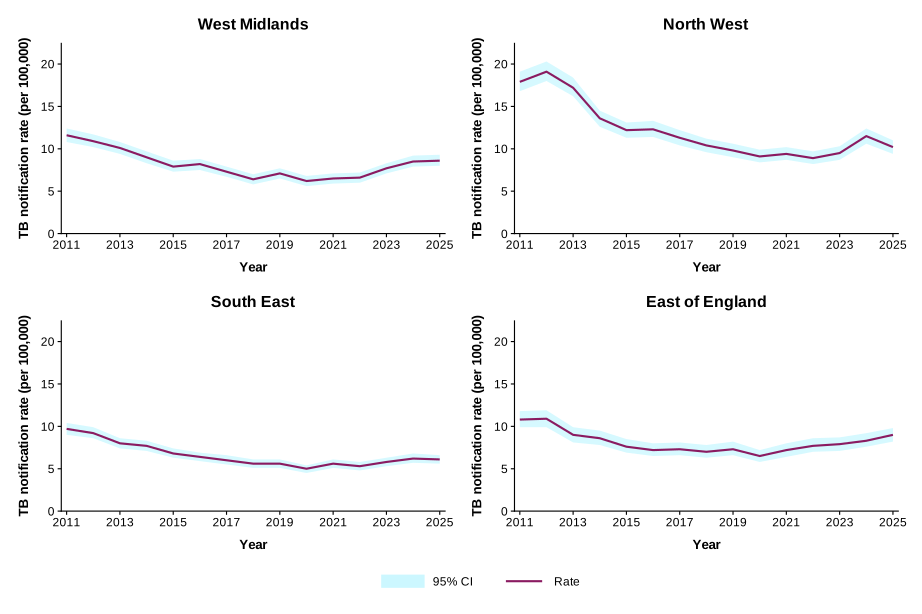
Data used in these figures is available in Supplementary Table 5 of the accompanying spreadsheet.
Figure A3a. Age and sex distributions by place of birth for UK-born people, 2025
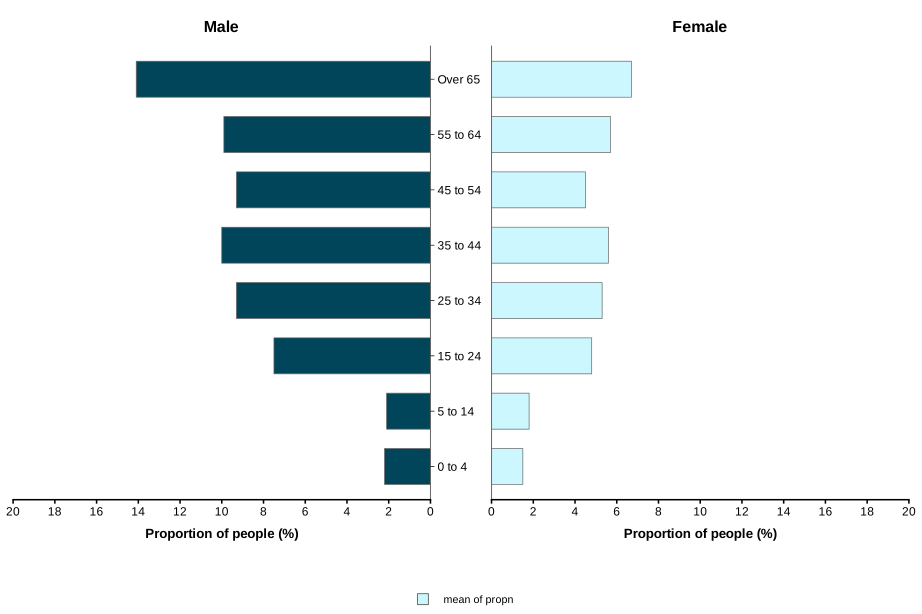
Figure A3b. Age and sex distributions by place of birth for non-UK born people, 2025
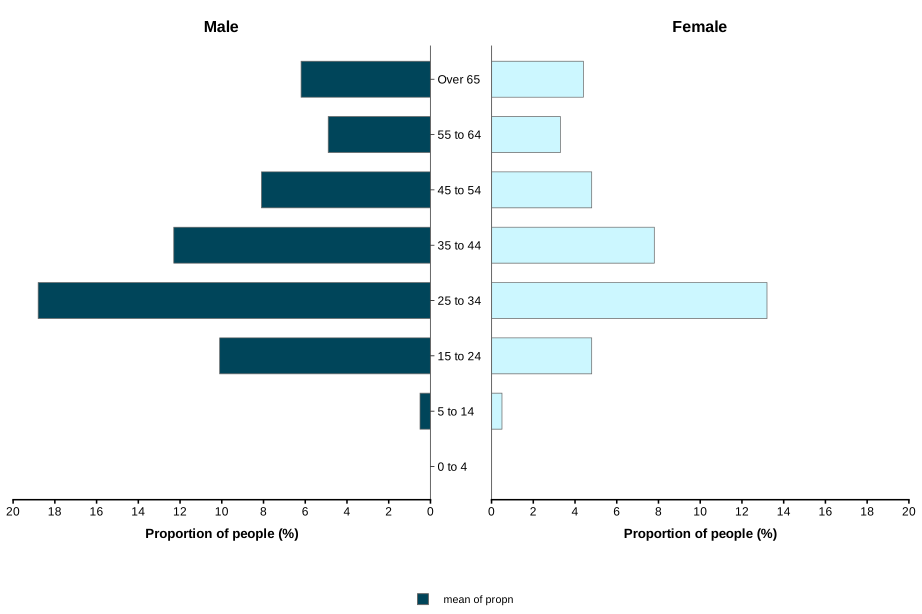
Data used in this figure is available in Supplementary Table 10 of the accompanying spreadsheet.
Figure A4a. Number of notifications by time since entry (years) to the UK for the 5 countries of birth with the highest number of notifications, 2018 to 2025 (scale varies)
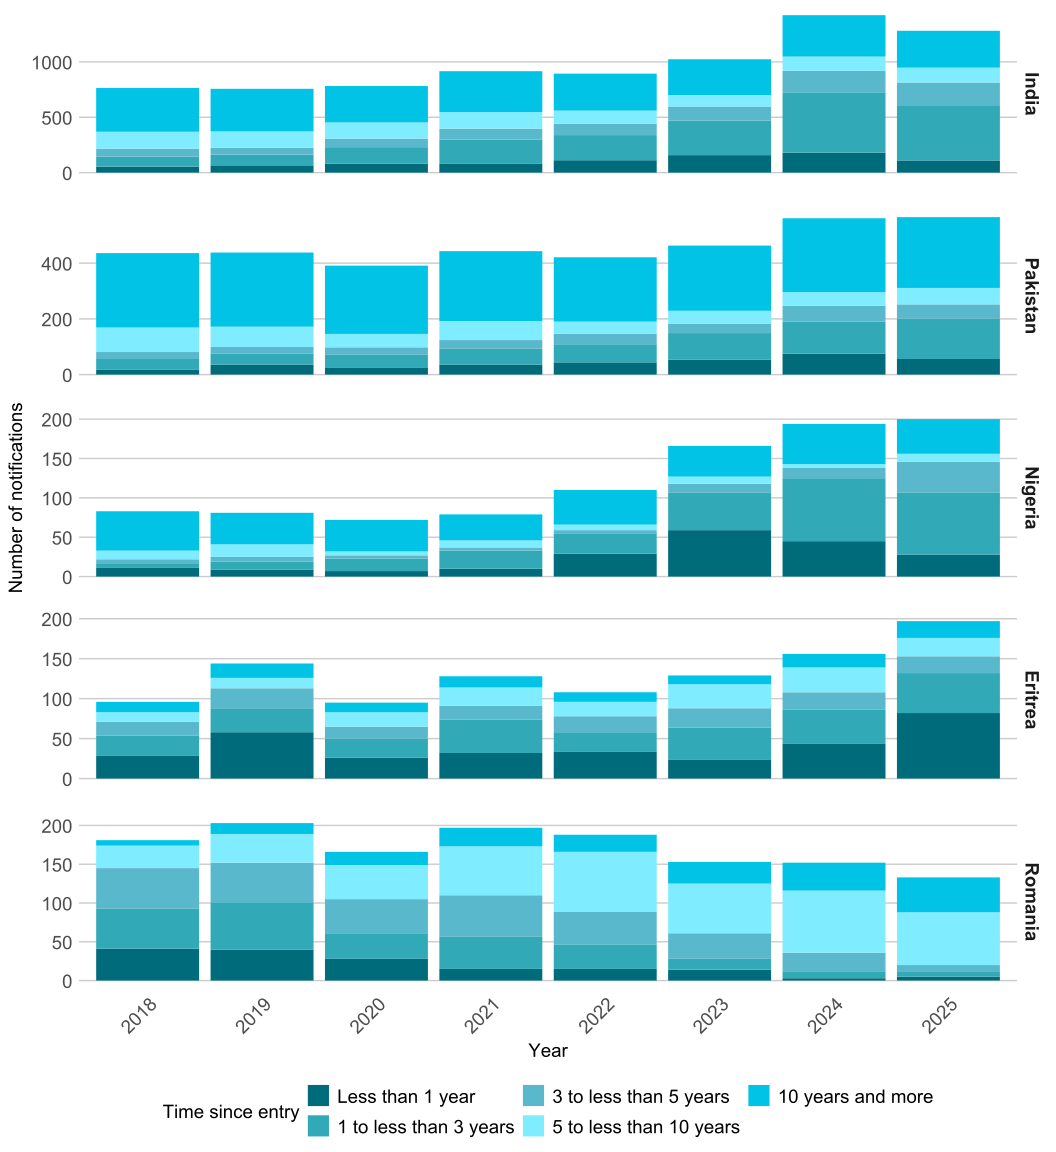
Figure A4b. Number of notifications by time since entry (years) to the UK for by country of birth, 2018 to 2025
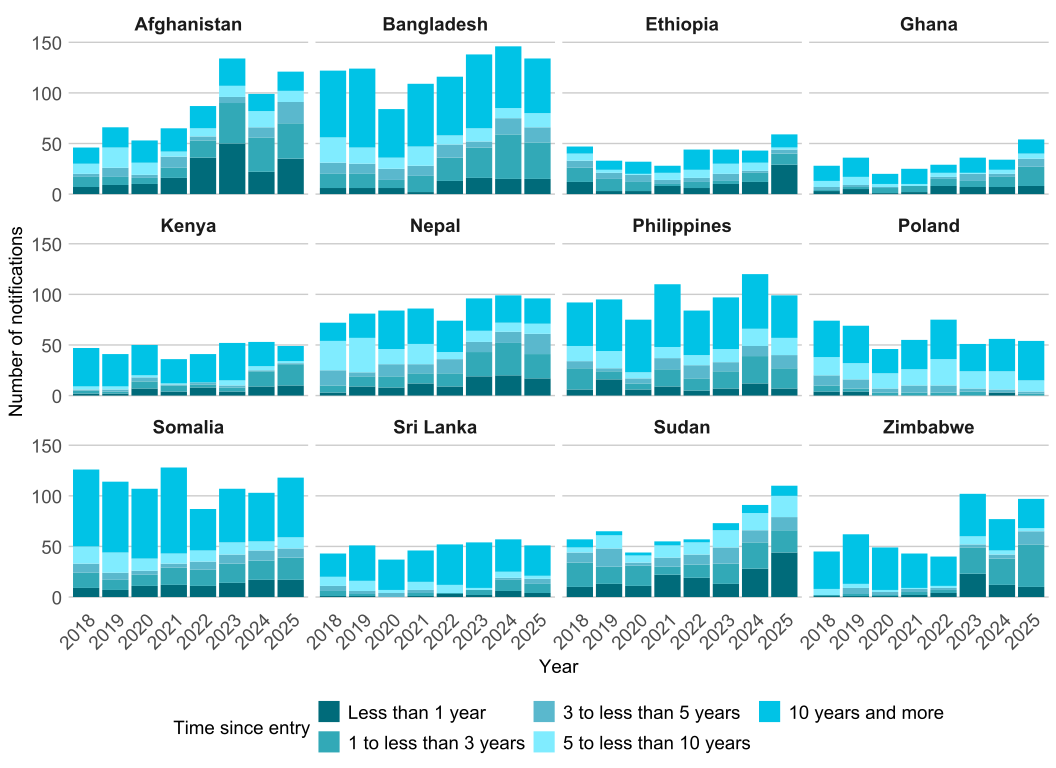
Data used in this figure is available in Supplementary Table 16 of the accompanying spreadsheet.
Figure A5. Rates of TB in UK and non-UK born by ethnic group, England, 2005 to 2025
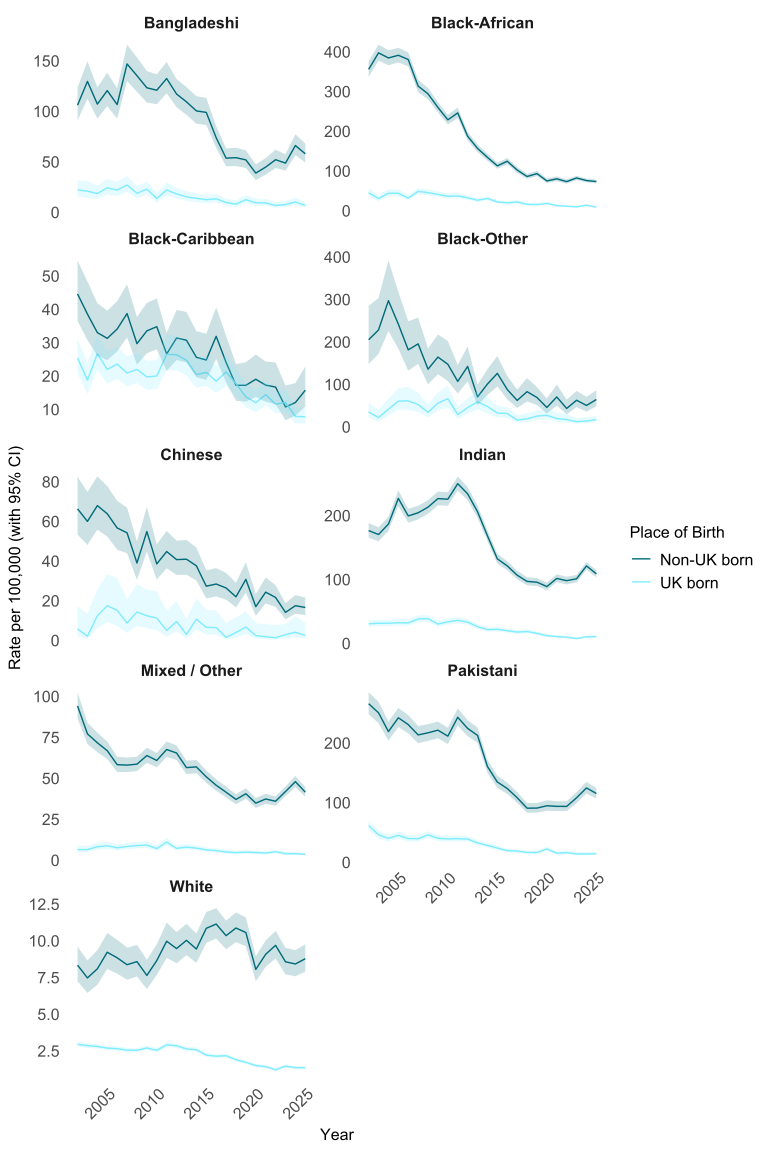
Data used in this figure is available in Supplementary Table 18 of the accompanying spreadsheet.