4. Tuberculosis treatment and outcomes, England, 2024
Updated 15 July 2026
Applies to England

© Crown copyright 2026
This publication is licensed under the terms of the Open Government Licence v3.0 except where otherwise stated. To view this licence, visit nationalarchives.gov.uk/doc/open-government-licence/version/3 or write to the Information Policy Team, The National Archives, Kew, London TW9 4DU, or email: psi@nationalarchives.gov.uk.
Where we have identified any third party copyright information you will need to obtain permission from the copyright holders concerned.
This publication is available at https://www.gov.uk/government/publications/tuberculosis-in-england-2025-report/4-tuberculosis-treatment-and-outcomes-england-2024
Main messages
In 2024:
- time between symptom onset and treatment start remained static over the past 5 years, with approximately a third of individuals with infectious tuberculosis (TB) experiencing a delay of more than 4 months before starting treatment and just under a third a delay of between 2 to 4 months
- the proportion of people receiving enhanced case management, reflecting the complexity of health and social needs, was 43.3%, similar to the previous 2 years
- observed treatment, which includes both directly observed treatment (DOT) and video observed treatment (VOT), key to supporting treatment completion in individuals with more complex needs, was offered to 14.2% of people, slightly lower than previous years but it was received in 64.7% of those, higher than 2022 and 2023
- treatment outcomes at 12 months for individuals diagnosed in 2023, expected to have completed treatment by the end of 2024, were consistent with previous years, with 84.4% completing treatment and 3.8% having died, the remainder being lost to follow-up, no outcome recorded or treatment stopped
- treatment completion was lower for individuals with social risk factors (78.0%) compared to those without (85.8%), consistent with previous years
Supplementary tables
Data relating to this chapter can be found in the 27 supplementary data tables in the accompanying spreadsheet, Tuberculosis treatment and outcomes, supplementary tables, which is available to download.
Treatment delay in people notified with pulmonary TB
Treatment delay is defined as the period from the start of symptoms (as reported by the patient) and the start of TB treatment. Diagnostic delay is the period from the start of symptoms to diagnosis and is reported in the TB diagnosis and microbiology chapter of this report. In 2024 the median period between diagnosis and starting treatment was one day (interquartile range 0 to 2 days). This has remained stable over recent years (see Supplementary Table 1 in the accompanying data set).
In this chapter we report overall treatment delay and risk factors for treatment delay.
Table 1 presents data on the proportion of people notified with pulmonary TB with delay from symptom onset to treatment start of between 2 to 4 months and more than 4 months from 2020 to 2024.
Treatment delays of up to 6 months have not reduced in the last 5 years, with nearly a third of individuals with infectious TB still experiencing a delay of more than 4 months and just under a third a delay of between 2 to 4 months in 2024.However, the proportion of people with very long delays of more than 6 months has decreased to 14.8% in 2024 from a peak of 19.3% in 2021 (see Supplementary Table 2 in the accompanying data set).
Table 1. Number and proportion of people with treatment delay notified with pulmonary TB in 2020 to 2024, England, 2024
| Year | 0 to 2 months (number) | 0 to 2 months (percentage) | 2 to 4 months (number) | 2 to 4 months (percentage) | Over 4 months (number) | Over 4 months (percentage) | Total |
|---|---|---|---|---|---|---|---|
| 2020 | 757 | 38.8 | 571 | 29.2 | 625 | 32.0 | 1,953 |
| 2021 | 742 | 37.6 | 602 | 30.5 | 632 | 32.0 | 1,976 |
| 2022 | 734 | 37.7 | 620 | 31.8 | 595 | 30.5 | 1,949 |
| 2023 | 849 | 39.7 | 649 | 30.3 | 642 | 30.0 | 2,140 |
| 2024 | 923 | 40.9 | 688 | 30.5 | 645 | 28.6 | 2,256 |
Notes to Table 1:
- delays of ‘2 to 4 months’ includes delays between 61 to 121 days, and ‘over 4 months’ includes delays from 122 to 730 days
- excludes people diagnosed with TB at post-mortem (131), those with delays over 2 years (142), and those with missing data for either start of symptoms (1,648) or treatment start date (324) or negative values (3)
- the total includes the number of people with pulmonary TB for whom time between symptom onset to treatment start was known
Factors associated with treatment delay in pulmonary TB
Further data for the proportion of people notified with pulmonary TB experiencing treatment delay is available in the accompanying data set:
- by UK Health Security Agency (UKHSA) region from 2015 to 2024 in Supplementary Table 2
- by upper tier level local authority averaged from 2022 to 2024 in Supplementary Table 3
- by place of birth (UK or non-UK born) from 2015 to 2024 in Supplementary Table 4
There is considerable variation by upper tier local authority in treatment delay. Averaged over the period 2021 to 2023, and excluding those with fewer than 5 notifications, 19 out of 139 (13.7%) upper tier local authorities had more than 45% treatment delay (4 months or more) and 11 (7.9%) had less than 15% treatment delay (range 7.1% to 85.7%). Treatment delays were higher in the UK born population in 2024 (34.2% with delay over 4 months) than those born outside the UK (27.1%).
As shown in Figure 1 below, older people had approximately a 30% increased risk of treatment delay compared with people aged 15 to 44 years and those born in the UK had a 27% increased risk. Males had a 10% decreased risk of treatment delay compared with females.
Figure 1. Predictors of treatment delays of over 4 months in people notified with pulmonary TB by risk groups, England 2022 to 2024 (aggregated data, univariable analysis)

Note to Figure 1: reference groups for RRs in the order presented in the above figure are: female, born outside of the UK, no social risk factors (SRFs) recorded, not treated for multidrug-resistant (MDR) or rifampicin-resistant (RR) TB, non-severe (TB with no known or potential central nervous system involvement) and aged 15 to 44 years old.
Data for all potential predictors tested for an association with treatment delay of 4 months or more are shown in Supplementary Table 5 of the accompanying data set.
Enhanced support including directly observed treatment (DOT) and video observed treatment (VOT) for people undergoing TB treatment
Enhanced case management (ECM)
The 2022 joint case management tool provides standardised recommendations for enhanced case management (ECM) in individuals receiving anti-TB treatment with clinical and/or social complexities. Where there are social risk factors (SRF) or multidrug or rifampicin-resistant TB (MDR or RR TB), the case may be deemed ECM level 3 and require DOT/VOT, following National Institute of Health and Care Excellence (NICE) guidelines.
- ECM level 1: people with clinical and/or social issues which impact on treatment, for example, children with TB, or those taking antiretrovirals
- ECM level 2: people with complex clinical and/or social issues which impact on treatment, for example, complex side effects or single drug resistance, which may necessitate weekly visits
- ECM level 3: people with very complex clinical and or social issues which impact on treatment, for example, SRFs or MDR or RR TB which necessitates DOT/VOT
Table 2 shows levels of ECM by year. In 2024, 2,376 people notified with TB (43.3%) were assessed as needing some level of ECM, similar to the previous 2 years
Table 2. Enhanced case management (ECM) by year, England, 2019 to 2024
| Year | Total | Any ECM (number) | Any ECM (percentage) | Level 1 (number) | Level 1 (percentage) | Level2 (number) | Level 2 (percentage) | Level 3 (number) | Level 3 (percentage) | Unknown level (number) | Unknown level (percentage) |
|---|---|---|---|---|---|---|---|---|---|---|---|
| 2019 | 4,702 | 1,301 | 27.7 | 14 | 0.3 | 11 | 0.2 | 767 | 16.3 | 509 | 10.8 |
| 2020 | 4,123 | 1,186 | 28.8 | 69 | 1.7 | 67 | 1.6 | 648 | 15.7 | 402 | 9.8 |
| 2021 | 4,395 | 1,605 | 36.5 | 441 | 10.0 | 393 | 8.9 | 639 | 14.5 | 132 | 3.0 |
| 2022 | 4,369 | 1,948 | 44.6 | 687 | 15.7 | 538 | 12.3 | 709 | 16.2 | 14 | 0.3 |
| 2023 | 4,831 | 2,235 | 46.3 | 741 | 15.3 | 640 | 13.2 | 845 | 17.5 | 9 | 0.2 |
| 2024 | 5,490 | 2,376 | 43.3 | 827 | 15.1 | 620 | 11.3 | 907 | 16.5 | 22 | 0.4 |
Proportions needing ECM are reported in the accompanying data set:
- by UKHSA region in 2024 in Supplementary Table 6
- by demographic characteristics in 2024 in Supplementary Table 7
As shown in Figure 2 below, people with social risk factors were nearly twice as likely to be identified as needing ECM (any level). From 2022 to 2024 91.7% of children aged 14 years or less were recorded as needing ECM.
Figure 2. Predictors of identified need of enhanced case management (ECM), of any level, England, notified in 2022 to 2024 (aggregated data, univariable analysis)

Note to Figure 2: reference groups for RRs in the order presented in Figure 2 are: female; not born in the UK; no SRFs recorded; less than 2 SRF factors recorded; no history of imprisonment in those with data recorded; and aged 15 to 44 years old.
Data for all potential predictors tested for an association with an identified need for ECM is shown in Supplementary Table 8 of the accompanying data set.
NTBS records if people are thought to need ECM, but not if they received that care. In contrast, the recording of whether DOT (or more recently also VOT) includes if it was offered and if was received.
Data on DOT/VOT is presented in the following supplementary tables of the accompanying data set:
- from 2015 to 2024 in Supplementary Table 9
- by demographic characteristics including age, sex, region of residence and presence of SRFs in 2024 in Supplementary Table 10
In 2024 data completeness regarding whether DOT/VOT was offered or not was 93.0%, (5,103 of 5,490 individuals), slightly less than 2022 (96.2% data completeness). In all TB notifications, DOT/VOT was recorded as offered to 14.2% (781 out of 5,490), of whom 64.7% received it.
There was regional variation in the proportion of people who were offered DOT/VOT, with the highest proportions in London (23.3%) and the West Midlands (17.0%) and the lowest in the North East (4.2%). The proportions of those who received DOT/VOT if offered were 80% or over in 3 regions (the South East, East Midlands and the North East) and lowest in London (58.6%, 251 out of 428 individuals). Of people diagnosed with RR or MDR TB 60.6% of people were offered DOT or VOT and 77.5% of those received it.
TB treatment outcomes in the non-MDR or non-RR TB cohort (without central nervous system (CNS) disease)
Treatment outcomes at 12 months and last recorded treatment outcome
Treatment outcomes are reported according to the year of notification. For people treated for non-MDR or non-RR TB, outcomes are reported for those notified up to and including 2023 as that is the latest year of notifications for whom treatment completion is expected within the 2024 data. For people treated for MDR or RR TB, outcomes are reported for those notified up to and including 2022.
(For further definitions of TB treatment cohorts, see the Methodology and definitions chapter of this report).
Mutually exclusive treatment outcome categories are shown in Table 3 below for people treated for non-MDR or non-RR TB without CNS disease notified in 2023, by 12 months since start of treatment:
- 84.4% had completed treatment
- 3.8% had died
- 2.9% were lost to follow-up
- 2.3% were still on treatment
- 1.6% had stopped treatment
Table 3. Treatment outcome at 12 months and last recorded outcome for people notified in 2023 treated for non-MDR or non-RR TB with expected treatment duration less than 12 months, England, 2024
| TB treatment outcome at 12 months (number) | TB treatment outcome at 12 months (percentage) | Last recorded TB treatment outcome (number) | Last recorded TB treatment outcome (percentage) | |
|---|---|---|---|---|
| Treatment completed | 3,551 | 84.4 | 3,697 | 87.9 |
| Died | 158 | 3.8 | 162 | 3.9 |
| Lost to follow-up | 120 | 2.9 | 126 | 3.0 |
| Still on treatment | 96 | 2.3 | 31 | 0.7 |
| Stopped | 66 | 1.6 | 73 | 1.7 |
| Not evaluated | 214 | 5.1 | 116 | 2.8 |
| Total | 4,205 | 100.0 | 4,205 | 100.0 |
Note to Table 3: excludes those with post-mortem diagnosis, those with CNS TB and those with MDR or RR TB.
Treatment completion increased to 87.9% for last recorded treatment outcome. Twelve-month TB treatment outcomes for this cohort for notifications from 2014 to 2023 are shown in Supplementary Table 11 of the accompanying data set.
Of those notified in 2023 and reported to still be on treatment at 12 months (96 people, Table 3), 66 (68.8%) subsequently completed treatment as their last recorded outcome. At the time of data close, 26 (27.0%) were still on treatment, 1 (1.0%) were lost to follow-up, and 2 (2.0%) of people had their treatment stopped and one person died (1.0%). Of those notified in 2023 and reported as not evaluated at 12 months (214), 79 (36.9%) were subsequently reported as treatment completed, 3 (1.4%) died, 6 (2.8%) were lost to follow-up, 5 (2.3%) were still on treatment, 5 (2.3%) had their treatment stopped and the rest remained as non-evaluated (116, 54.2%). Last recorded treatment outcomes for this cohort notified from 2014 to 2023 are shown in Supplementary Table 12 of the accompanying data set.
For the above cohort notified in 2023 the 12-month TB treatment completion rate is similar to the previous 10 years at 84.4% (range 84.5% to 86.4%). Treatment completion at the last recorded outcome was lower at 87.9% compared with previous 10 years (range of 89.2% to 90.5%), but this is expected to increase after more months of follow-up (see Supplementary Table 12 of the accompanying data set).
Treatment completion in those with and without a social risk factor
In 2024, 12-month TB treatment completion in people notified in 2023 treated for non-MDR or RR TB and expected to complete within 12 months with one or more SRFs was 78.0%, significantly lower than in those without a SRF (85.8%, p<0.001).
Treatment outcomes in those who did not complete treatment within 12 months
Treatment outcomes at 12 months in those who did not complete within this period are shown in Figure 3 and in Supplementary Table 11 of the accompanying data set. The proportion of those not evaluated for the 2023 cohort is expected to decrease slightly as more missing values are entered over time. The proportion of those who died within 12 months (measured from start of treatment, diagnosis or notification depending on which is the latest data point available) was 3.8%, lower than the previous high of 5.1% in those notified in 2020 (p = 0.003 ) and similar to most other years. This year there were 4 further deaths reported in the last recorded outcome (Table 3). The proportion of persons lost to follow-up slightly reduced to 2.9% in the 2023 cohort compared with 3.2% in the 2022 cohort. However, the proportion recorded as not evaluated increased in 2023 to 5.1%, the highest recorded and an increase from 3.2% seen in 2022 (p<0.001). However, as has occurred in previous years, the proportion recorded as not evaluated is expected to decrease in later reporting years with increased follow-up.
Figure 3. Breakdown of outcomes of people treated for non-MDR or non-RR TB, notified in 2014 to 2023 who did not complete treatment within 12 months and expected treatment duration less than 12 months, England, 2024

Data underlying this figure is available in Supplementary Table 11 of the accompanying data set.
Treatment outcomes by 12 months by age, sex and region
Treatment outcomes by 12 months are reported for the cohort of people treated for non-MDR or non-RR TB and without severe disease in the accompanying data set. They are reported by:
- treatment completion by age group for notifications in 2014 to 2023 in Supplementary Table 13
- treatment outcomes by age and sex for notifications in 2023 in Supplementary Table 14
- treatment outcomes by UKHSA region for notifications in 2023 in Supplementary Table 15
- proportion completed treatment by UKHSA region from 2014 to 2023 in Supplementary Table 16
Treatment completion has consistently decreased with increasing age group. For people notified in 2023 treatment completion was 92.7% in children aged 14 years or less compared with 73.9% in adults aged 65 years or more (p<0.001 for trend ). When further disaggregated by sex, a higher proportion of males notified in 2023 died before 12 months for all ages except children, with the greatest difference in adults aged more than 65 years (18.9% of males over 65 with TB died, compared to 10.3% of females aged over 65).
Treatment duration
A treatment end date was recorded for 97.6% (3,608 out of 3,697) of people notified in 2023 who were expected to complete treatment within 12 months; of these 38.8% completed within the standard 6 months and a further 33.6% in 6 to 8 months and 4.1% took more than 12 months to complete treatment. These proportions have changed little over the previous 10 years (see Supplementary Table 17 of the accompanying data set).
TB treatment outcomes for the non-MDR or non-RR TB cohort with CNS disease
Last recorded treatment outcomes in this cohort for those notified in 2023 are shown in Table 4 and for notification years from 2014 to 2023 in Supplementary Table 18 of the accompanying data set. At the last recorded outcome, 74.4% of people notified in 2023 had completed treatment, while 4.7% were still on treatment. The proportion of people with CNS TB who had died at the last recorded outcome was more than double that of those without CNS disease (10.8% compared with 3.9%).
Table 4. Last recorded treatment outcome for people notified in 2023 with non-MDR or non-RR TB with CNS disease, England, 2024
| TB treatment outcomes | Last recorded TB treatment outcome (number) | Last recorded TB treatment outcome (percentage) |
|---|---|---|
| Treatment completed | 361 | 74.4 |
| Died | 53 | 10.9 |
| Lost to follow-up | 21 | 4.3 |
| Still on treatment | 23 | 4.7 |
| Stopped | 7 | 1.4 |
| Not evaluated | 20 | 4.1 |
| Total | 485 | 100.0 |
Note to Table 4: excludes those with post-mortem diagnosis and those with MDR or RR TB.
Last recorded treatment outcome for the entire non-MDR or non-RR TB cohort
Last recorded treatment outcome for the entire non-MDR or non-RR TB cohort are shown in the accompanying data set:
- by year of notification, 2014 to 2023 in Supplementary Table 19
- by site of disease in 2023 notification year Supplementary Table 20
- by UKHSA region in 2023 notification year Supplementary Table 21
Treatment completion as the last recorded outcome for the entire non-MDR or non-RR TB cohort has not notably changed over time, with a 10-year average of 88.9%. The proportion of people who had died at their last reported outcome was 4.6% for those notified in 2023, less than the previous high of 6.0% for people notified in the peak pandemic year of 2020 and slightly less than the 10- year average.
For people notified in 2023, the proportion of people who had died was greater in those who were notified with pulmonary disease, both with other sites of disease as well (2,147 completed treatment; 6.3% died) or with only pulmonary disease (1,476 completed treatment; 6.0% died). People notified with miliary (disseminated disease and therefore included in pulmonary ) had worse outcomes (103 completed treatment,12.9% died). There were fewer deaths in people notified with extrapulmonary disease only (1,911 completed treatment; 2.5% died). However, within subgroups of extrapulmonary disease only, CNS – meningitis and CNS-other, a high proportion died (70 completed treatment, 19.6% died, 40 completed treatment, 12.2% died respectively). People notified with extrapulmonary extra-thoracic lymph node TB had the highest treatment completion and low mortality (979 completed treatment, 1.3% died).
There were variations in treatment outcomes between UKHSA regions with the lowest treatment completion in the East of England at 78.5% compared with the highest in the South West of 91.1%. The proportion of people who died was similar in all regions.
Factors affecting treatment completion at last recorded outcome in the entire non-MDR or non-RR cohort
Figure 4 presents factors associated with treatment completion at the last recorded treatment outcome for the entire non-MDR or RR cohort for people notified in 2021 to 2023 combined. In univariable analysis males, those with pulmonary disease, those born in the UK or with social risk factors, those with prison history, previous TB or CNS disease were less likely to complete treatment. The group least likely to complete treatment were older people aged 65 years or more compared with people aged 15 to 44 years, whilst children and those with treatment delay compared to those without treatment delay were more likely to complete treatment.
Figure 4. Predictors of treatment completion (last recorded outcome) for people treated for non-MDR or non-RR TB, England, notified in 2021 to 2023 (aggregated data, univariable analysis)

Notes to Figure 4
- Comparison groups for RRs are as follows: males; pulmonary TB with or without extra-pulmonary TB compared with non-pulmonary TB only; no SRFs recorded; no history of imprisonment in those with data recorded; no previous diagnosis in those with data recorded; CNS disease includes those with TB meningitis, spinal, miliary or cryptic TB in which CNS involvement cannot be excluded compared to all other sites of disease; people aged 15 to 44 years, less than 2 months’ treatment delay in those with treatment start date recorded.
- People treated for MDR TB or RR TB and post-mortem diagnosis are excluded.
Data underlying this analysis is presented in Supplementary Table 22 of the accompanying data set.
All deaths for the entire non-MDR or non-RR TB cohort
For people notified in 2023 in the non-MDR or non-RR TB cohort there were an additional 32 deaths in people who were diagnosed with TB post-mortem and are not included in the treatment outcome figures above. When these people are included, the proportion of all people notified with TB that died increased to 5.2% out of 4,722 people.
Out of 215 deaths of people in this cohort notified in 2023, TB was reported to have caused or contributed to death for 47.9%, was incidental to death for 22.8%, was unknown in 19.1% and missing in the remaining 10.2%. These proportions have not notably changed over time (see Supplementary Table 23 of the accompanying data set). For the 32 deaths that were in people diagnosed post-mortem, it was missing for all if TB was the cause of death.
Time to death in the entire non-MDR or non-RR TB cohort
Out of 215 people who died who were not diagnosed post-mortem, 196 (91.1%) had a known treatment start date, of whom, 108 (50.2%) were reported to have died within 60 days of starting treatment.
Factors affecting risk of death at last recorded outcome in the entire non-MDR or non-RR cohort
Figure 5 shows factors associated with death as the last reported TB treatment outcome adjusted for the effect of age for people notified in 2021 to 2023. Independent of age, males, and people with pulmonary disease, those with SRFs and comorbidities had an increased risk of dying. The largest effects were for the relatively rare conditions of current alcohol misuse (affecting 4.5% of the analytical cohort; adjusted RR 3.86, 95% CI 3.12 to 4.78) and those with comorbid chronic liver disease (affecting 1.4% of the analytical cohort; adjusted RR 3.83, 95% CI 3.04 to 4.83). Pulmonary TB, affecting 54.0% of the notified individuals, was associated with a double risk of death (adjusted RR 2.24; 95% CI 1.90 to 2.63) and of similar magnitude to risk associated with having severe CNS TB disease.
Figure 5. Factors associated death for entire non-MDR or RR cohort, England, 2021 to 2023 (aggregated data) adjusted for age
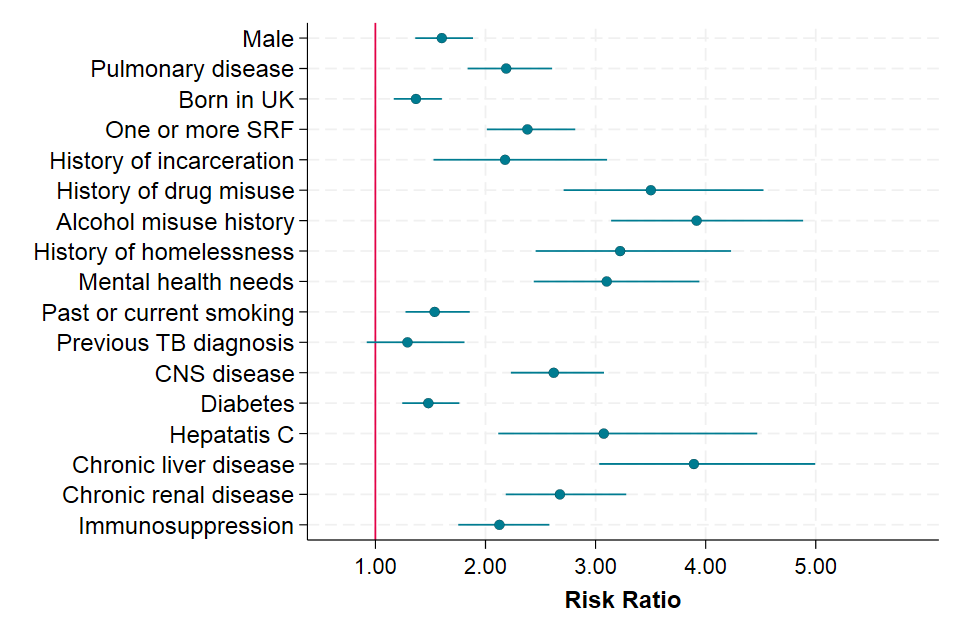
Notes to Figure 5
Note 1. Comparison groups for RRs in the order presented as follows: females; non-pulmonary TB; born outside of the UK; no SRFs recorded, prison drug, alcohol, homelessness or mental health needs identified in those with data recorded; no history of smoking in those with data recorded; no previous TB diagnosis; CNS disease includes those with meningitis, spinal, miliary or cryptic TB in which CNS involvement cannot be excluded compared to all other sites of disease; no diabetes, hepatitis, chronic liver or chronic renal disease or immunosuppression in those with data recorded.
Note 2. People treated for MDR and RR TB and TB diagnosed at post-mortem are excluded. Data underlying this analysis, including factors not shown here are presented in Supplementary Table 24 of the accompanying data set.
TB treatment outcomes in the drug resistant (MDR or RR TB) cohort
TB outcomes for the MDR or RR cohort are reported at 24 months, so the most recent complete data is for people notified in 2022. The 2022 cohort comprised 66 people treated for MDR or RR TB. 58 of these were culture-confirmed MDR or RR TB at diagnosis, of whom 5 had pre-extensively drug-resistant (pre-XDR) TB (see Table 13 in the ‘TB Diagnosis, microbiology and drug resistance in England’ data set).
Treatment outcome at 24 months and last recorded outcome for persons treated for drug-resistant TB notified in 2022 are shown in Table 5 and for notification years 2014 to 2022 in Figure 6 and Supplementary Tables 25 and Supplementary Table 26 in the accompanying data set. A total of 51 people notified in 2022 completed treatment within 24 months. A further 4 people completed treatment after 24 months, bringing overall treatment completion for people notified in 2022 to 83.3%. Although overall treatment completion for people with MDR or RR TB has remained similar from 2014 to 2022, there has been an increase in treatment completion within 24 months, from 77.8% in 2013 to 83.3% in 2022 reflecting improved drug regimens (see Supplementary Table 26 in the accompanying data set).
Table 5. Treatment outcome at 24 months and last recorded outcome for people treated for MDR or RR TB notified in 2022, England, 2024
| TB treatment outcome | TB treatment outcome at 24 months (number) | TB treatment outcome at 24 months (percentage) | Last recorded TB treatment outcome (number) | Last recorded TB treatment outcome (percentage) |
|---|---|---|---|---|
| Treatment completed | 51 | 77.3 | 55 | 83.3 |
| Died | 1 | 1.5 | 1 | 1.5 |
| Lost to follow-up | 6 | 9.1 | 6 | 9.1 |
| Still on treatment | 3 | 4.5 | 2 | 3.0 |
| Stopped | 2 | 3.0 | 2 | 3.0 |
| Not evaluated | 3 | 4.5 | 0 | 0.0 |
| Total | 66 | 100.0 | 66 | 100.0 |
Note to Table 5: this table excludes people diagnosed post-mortem.
Figure 6. Proportion of people treated for MDR or RR TB with treatment completion at 24 months or last recorded outcome notified in 2013 to 2022, England 2024

Data underlying this figure is shown in Supplementary Tables 25 and 26 in the accompanying data set.
Treatment outcomes at 24 months for people with MDR or RR TB notified from 2013 to 2022 and who did not complete treatment are shown in Figure 7 below and in Supplementary Table 25 of the accompanying data set.
Figure 7. Breakdown of outcomes of people treated for MDR or RR TB, notified in 2013 to 2022 who did not complete treatment within 24 months, England, 2024

Data underlying this figure is available in Supplementary Table 25 in the accompanying data set.
For people notified in 2022 who completed treatment, time to completion was known for all 55 in the cohort (see Supplementary Table 27 of the accompanying data set).
Deaths in the MDR or RR TB cohort
In 2023, there were no post-mortem diagnoses and there was only one death in this cohort for people notified in 2022.