On the use of LFA tests in contact tracing: preliminary findings, 15 November 2020
Updated 13 May 2022

© Crown copyright 2022
This publication is licensed under the terms of the Open Government Licence v3.0 except where otherwise stated. To view this licence, visit nationalarchives.gov.uk/doc/open-government-licence/version/3 or write to the Information Policy Team, The National Archives, Kew, London TW9 4DU, or email: psi@nationalarchives.gov.uk.
Where we have identified any third party copyright information you will need to obtain permission from the copyright holders concerned.
This publication is available at https://www.gov.uk/government/publications/tti-modelling-group-on-the-use-of-lateral-flow-antigen-tests-in-contact-tracing-preliminary-findings-15-november-2020/on-the-use-of-lfa-tests-in-contact-tracing-preliminary-findings-15-november-2020
Elizabeth Fearon, Martyn Fyles, TTI Modelling Group
15 November 2020.
Rationale
We compare 2 policies for the efficacy of Test, Trace and Isolate (TTI):
1. Status quo: isolation of symptomatic individuals for 10 days post symptom onset and quarantine of 14 days for within-household contacts and tracing of contacts with 14 day post last exposure for outside of household contacts.
2. Daily Lateral Flow Assay (LFA) testing of all contacts with no quarantine for up to 14 days of negative tests; 10 days self-isolation for contacts testing positive. Contact tracing is initiated on a positive test result.
If contacts of a confirmed case do not quarantine and instead test regularly, there is a risk that they will transmit infection if their infection is not picked up by testing. On the other hand, the current system of only testing contacts who become symptomatic will miss contacts who are asymptomatic or do not report symptoms; thus the risk might be offset in gains via identifying more index cases for tracing. We use a household structured branching process model of infection and contact tracing to investigate.
Main points
-
Daily LFA testing of traced contacts may offer an improvement over the current contact tracing strategy.
-
These are preliminary results. A full sensitivity analysis has not been completed and many of the parameters have significant uncertainty. In particular, we were not able to have uncertainty in the test sensitivity curves.
-
To make the strategies comparable for this analysis, we model uptake and adherence to self-isolation and quarantine (status quo policy) and daily LFA testing of 100 per cent. This is not a realistic assumption in practice.
Assumptions about the proposed daily LFAT testing of contacts policy
- If an individual has symptoms, and is not being LFA tested, then they must isolate and request a PCR test.
- When an individual tests positive (through either LFA or PCR), an individual initiates contact tracing for their recent contacts. Their household members begin LFA testing if they haven’t already.
- When an individual is traced, they begin LFA testing.
- While an individual is being LFA tested, they do not have to quarantine.
- If an individual in a household where there has already been a confirmed case tests positive on an LFA test, the other individuals in the household only continue to get LFA tested until the time of the earliest recognised household symptom or LFA test plus the duration of LFA testing (14 days).
- If an individual is being LFA tested, then they do not get PCR tested.
Tracing rules for LFA testing of contacts
Previously, when an individual tested positive through a PCR test, they would list contacts that occurred 2 days prior to symptom onset and 7 days post symptom onset. With the new LFA tests, these criteria do not necessarily make sense. Some individuals will test positive prior to symptom onset, and asymptomatics who do not have a symptom onset will also test positive.
We adopt the following assumed rules for contact tracing.
- If an individual tests positive through a PCR test:
- contacts occuring 2 days prior to and 7 days post symptom onset are traced;
- this is the current policy.
- If an individual tests positive through a LFA test:
- contacts that occurred in the 5 days prior to receiving the positive test result are traced;
- increasing the number of days prior to receiving the positive test result could be beneficial as this would increase backwards tracing.
Model of test sensitivity
- We assume that the LFA test sensitivity curve is the same shape as the PCR test sensitivity curve [footnote 1].
- When self administered by self-trained members of the public, LFA tests correctly identified 57.5 per cent (95 per cent CI: 52.3 to 62.6 per cent) of cases that were identified by PCR tests [footnote 2]. We rescale the curve so that this relationship holds true at all time points.
- We assume that the test sensitivity curve is the same for asymptomatic infections.
Figure 1: Our assumed test sensitivity probabilities over time since infected.
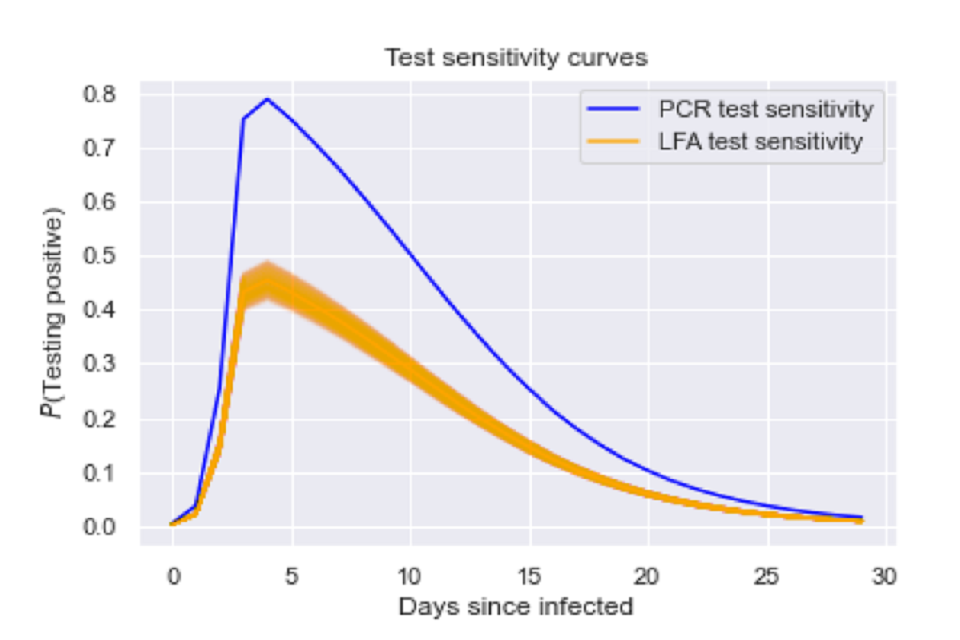
Graph of probability of testing positive from 0 to 30 days since infected. Two lines are seen, peaking at approximately 4 days since infection. A blue line maps PCR test sensitivity, orange maps LFA test sensitivity
Graph of probability of testing positive from 0 to 30 days since infected. Two lines are seen, peaking at approximately 4 days since infection. A blue line maps PCR test sensitivity, orange maps LFA test sensitivity.
Results
We simulate the 2 strategies for 1000 simulations. Contact tracing delays, success probabilities and social distancing were kept constant across all simulations.
Scenario 1 - High levels of asymptomatic transmission
We assume that 30 per cent of cases are asymptomatic, and that asymptomatic infections are just as infectious as symptomatic infections.
Figure 2: The posterior distribution of growth rates for a scenario with high levels of asymptomatic transmission.
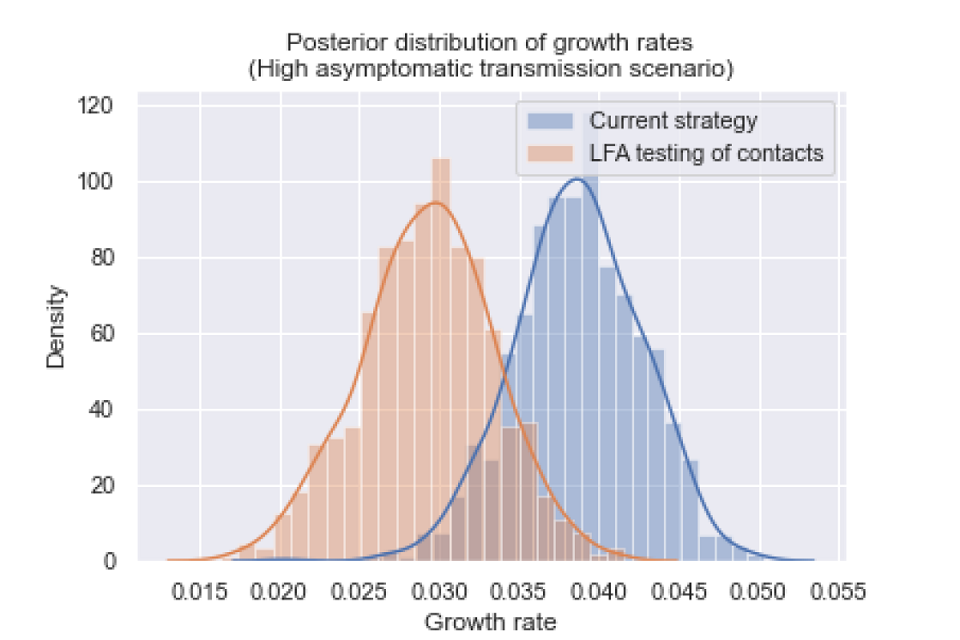
Graph plotting density against growth rate. Curves are mapped onto two data sets, highlighting differences of growth rate distribution between scenarios. Orange data shows LFA testing of contacts scenario. Current strategy is blue.
The posterior distributions of growth rates are statistically different (p value less than 0.001), and the growth rate was reduced by 0.009 (95 per cent CI: 0.001, 0.018).
Scenario 2 - Low levels of asymptomatic transmission
We assume that 20 per cent of cases are asymptomatic, and that asymptomatic infections are 35 per cent as infectious as symptomatic infections.
Figure 3: The posterior distribution of growth rates for a scenario with low levels of asymptomatic transmission.
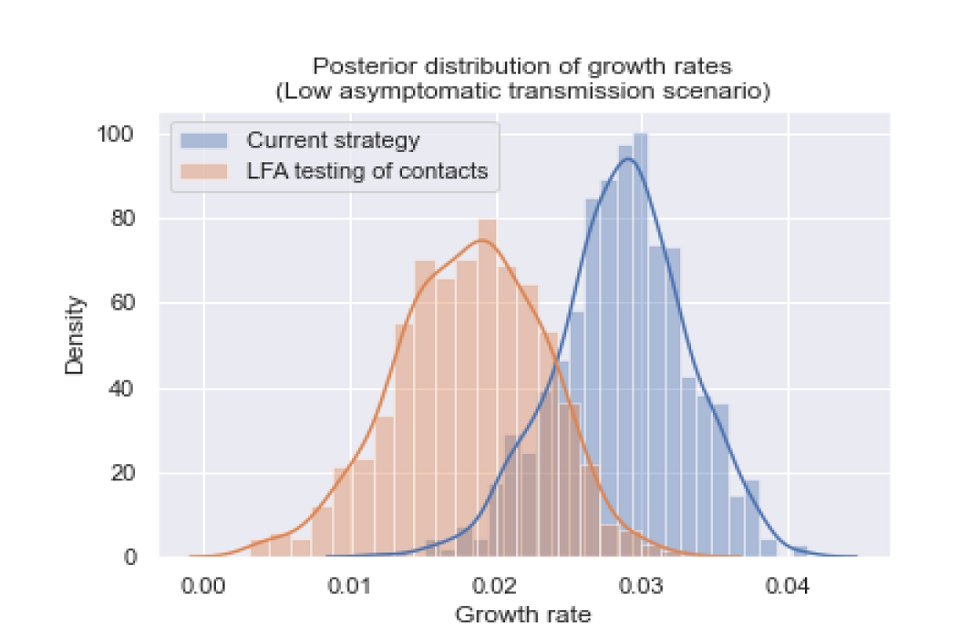
Graph plotting density against growth rate. Curves are mapped onto two data sets, highlighting differences of growth rate distribution between scenarios. Orange data shows LFA testing of contacts scenario. Current strategy is blue.
The posterior distributions of growth rates are statistically different (p value less than 0.001), and the growth rate was reduced by 0.0104 (95 per cent CI: 0.001, 0.021).
Conclusions
We conclude that LFA testing of traced contacts could offer an improvement over the current contact tracing strategy. In both scenarios, introducing lateral flow testing of contacts reduced the growth rate by approximately 0.01.
This is a preliminary and rapid analysis, and sensitivity analyses have not yet been performed. There are uncertainties in assumptions about infection, testing, uptake and adherence that are not reflected in these findings.
Model of infection and TTI
We model a branching process of infection on individuals (‘nodes’) structured into households, with the contact tracing process modelled as a ‘superinfection’ along the tree generated by the infection branching process [footnote 3]. The model increments along discrete time-steps of one day, progressing both the infection transmission and the tracing processes. Each day, nodes make outside and within household contacts parameterised using the Polymod study [footnote 4], stratified by household size, distributed as per the UK population in 2018. To reflect changes in behaviour and physical distancing policies, we scale the proportion of outside-household contacts made. The distribution of secondary cases is modeled as an overdispersed negative binomial distribution. Infection parameters are as Table 1.
We do not model repeat contacts. The model does not reflect any population immunity. We compare the proposed daily LFA testing of contact policy described above to the status quo policy: untraced symptomatic individuals report their infection after a symptom reporting delay and a given proportion (defined by the infection reporting probability) seek a PCR test. Contact tracing is modelled with a set of testing delays, tracing delays and a tracing success probability informed by literature and statistics reported by TTI over the recent months. Self-isolation of self-reported cases lasts 10 days from symptom onset and contacts of a case quarantine for 14 days either from symptom onset of the first household case for within-household contacts, or 14 days post-infection date, assumed to be last exposure, for contacts of non-household cases.
For each of these scenarios we include higher and lower estimates of the proportion of infections that remain asymptomatic throughout their infection and the relative infectivity of asymptomatic to symptomatic infections [footnote 5].
Table 1: Parameter values.
| Parameter | Values |
|---|---|
| Growth Rate (pre-interventions or contact reductions). | 0.22 per day (doubling time around 3 days) [footnote 6] |
| Incubation period. | Gamma (shape equal to 3.019, scale equal to 1.6 days) [footnote 7]. |
| Generation time | Weibull (mean equal to 5, var equal to 1.9< sup >2< / sup > days) [footnote 8]. |
| Household Size Distribution. | (1: 0.29, 2: 0.35, 3: 0.15, 4: 0.14, 5: 0.05, 6: 0.02) |
| Household secondary attack rate. | 25 per cent [footnote 9] [footnote 10]. |
| Overdispersion of secondary cases distribution. | 0.32 |
| Proportion asymptomatic. | Low: 0.2, High: 0.3 [footnote 5] |
| Relative infectivity of asymptomatics. | Low: 0.35, As symptomatic: 1 [footnote 5] |
| Number of social contacts per day. | Polymod (within and outside household proportions, by household size). [footnote 4] |
| Reduction in global contacts per day due to physical distancing. | 60 per cent |
| Onset to isolation and PCR test booking among untraced symptomatic individuals. | Gamma (mean equal to 2.62, standard deviation equal to 2.38) [footnote 6]. Data from Singapore. |
| PCR testing delay (test to result and tracing). | Specimen to report delay, exponential distribution, mean 1.5 days. |
| Contact tracing delay. | Exponential distribution mean 1.5 days. |
| Probability of successfully tracing a contact. | 0.7 |
| Probability than an untraced symptomatic infected individual reports their symptoms and seeks a test. | 0.5 |
| Probability that individuals take up and adhere to 10 days self-isolation and 14 days quarantine in the status quo policy model.* | 1 |
| Probability that individuals take up daily testing if traced as a contact, adhere to the full 13 day testing period if test-negative and list contacts for tracing if test-positive.* | 1 |
*These parameters are not intended to be realistic, but are used for comparability purposes given the lack of data as to uptake and adherence to daily LFA testing. Evidence suggests that leaving the house during isolation is common [footnote 11].
Acknowledgements
This work was funded by the UKRI NIHR COVID-19 Rapid Response Rolling Call grant MR/V028618/1. The TTI Modelling Group includes Elizabeth Fearon, Thomas House, Lorenzo Pellis, Ian Hall, Martyn Fyles, Caroline Jay, Peter Crowther, Helena B Stage, Rajenki Das, Graham Medley, Petra Klepac, Deirdre Hollingsworth, Emma L Davis, Tim CD Lucas, Tom Wingfield, Lucy Yardley, Li Pi, Joshua Blake.
References
-
Hellewell J, Russell T, The SAFER Investigators and Field Study Team, The Crick COVID-19 Consortium, CMMID COVID-19 working group, Beale R et al. Estimating effectiveness of frequent PCR testing at different intervals for detection of SARS-CoV-2 infections. Preprint. 2020. ↩
-
Preliminary report from the Joint PHE Porton Down & University of Oxford SARS-CoV-2 test development and validation cell: Rapid evaluation of Lateral Flow Viral Antigen detection devices (LFDs) for mass community testing. November 13, 2020. (accessed 15 November, 2020). ↩
-
Using a household structured branching process to analyse contact tracing in the SARS-CoV-2 pandemic. Fyles M, Fearon E et al 2020. Submitted to RS Phil Trans B. 2020. (Considered at SPI-M 3 June 2020). ↩
-
Mossong J, Hens N, Jit M, Beutels P, Aurenen K, Mikolajczyk R et al. et al. Social Contacts and Mixing Patterns Relevant to the Spread of Infectious Diseases. PLoS Med. 5, e74 (2008). ↩ ↩2
-
Buitrago-Garcia D, Egly-Gani D, Counotte MJ, Hossmann S, Imeri H, Ipekci AM, et al. Occurrence and transmission potential of asymptomatic and presymptomatic SARS-CoV-2 infections: A living systematic review and meta-analysis. PLOS Medicine. 17 September 2020 (9) ↩ ↩2 ↩3
-
Pellis L, Scarabel F, Stage HB, Overton CE, Chappell LHK, Lythgoe KA et al. Challenges in control of Covid-19: short doubling time and long delay to effect of interventions. 2020. Preprint arXiv:2004.00117 Q-Bio. ↩ ↩2
-
Overton CE, Stage HB, Ahmad S, Curran-Sebastian J, Dark P, Das R et al. Using statistics and mathematical modelling to understand infectious disease outbreaks: COVID-19 as an example. Infect. Dis. Model. 5, 409–441 (2020). ↩
-
Ferretti L, Wymant C, Kendall M, Zhao L, Nurtay A, Abeler-Dorner L et al. Quantifying SARS-CoV-2 transmission suggests epidemic control with digital contact tracing. Science 368, (2020). ↩
-
Madewell ZJ,Yang Y, Longini IM Jr, Halloran ME, Dean NE. Household transmission of SARS-CoV-2: a systematic review and meta-analysis of secondary attack rate. 2020. medRXiv Preprint doi: 10.1101/2020.07.29.20164590 ↩
-
Lopez Bernal J, Panagiotopoulos N, Byers C, Garcia Vilaplana T, Boddington N, Zhang X et al. Transmission dynamics of COVID-19 in household and community settings in the United Kingdom. 2020. medRXiv Preprint doi: 10.1101/2020.08.19.20177188doi ↩
-
West LE et al. Adherence to the test, trace and isolate system: results from a time series of 21 nationally representative surveys in the UK (the COVID-19 Rapid Survey of Adherence to Interventions and Responses [CORSAIR] study). ↩