Trends in fire false alarms and fire false alarm policies
Published 24 November 2022
Applies to England

© Crown copyright 2022
This publication is licensed under the terms of the Open Government Licence v3.0 except where otherwise stated. To view this licence, visit nationalarchives.gov.uk/doc/open-government-licence/version/3 or write to the Information Policy Team, The National Archives, Kew, London TW9 4DU, or email: psi@nationalarchives.gov.uk.
Where we have identified any third party copyright information you will need to obtain permission from the copyright holders concerned.
This publication is available at https://www.gov.uk/government/publications/trends-in-fire-false-alarms-and-fire-false-alarm-policies/trends-in-fire-false-alarms-and-fire-false-alarm-policies
Acknowledgements
With special thanks to the fire and rescue services who took the time to complete the fire false alarm policy survey, the National Fire Chiefs Council, and in particular Paul McCourt and Mark Hardingham for their assistance in designing and promoting the research. With thanks also to Christos Byron and Rowena Hill for peer reviewing the final report.
Molly Watts (author) would also like to thank Alix Bartlett, Anna Richardson, Colleen Wall and Victoria Dalton for their input and support throughout the report drafting.
Icons obtained from www.flaticon.com and made by: Good ware, Freepik, geotatah, Pixel perfect, Smashicons, and Kiranshastry have been used throughout this report.
Executive summary
Introduction and background
Fire false alarms make up the largest proportion of incident types attended by fire and rescue services (FRSs) in England, at 40% in the year ending 31 March 2018 (full data available in Fire statistics data tables ). Attendance at fire false alarm and fire incidents have declined over the long term, but fire false alarms to a lesser extent. This research explored trends in fire false alarms from the years ending 31 March 2000 to 2018 and assessed the extent to which fire false alarm policies put in place by FRSs have contributed to the long-term decline in the number of fire false alarms attended.
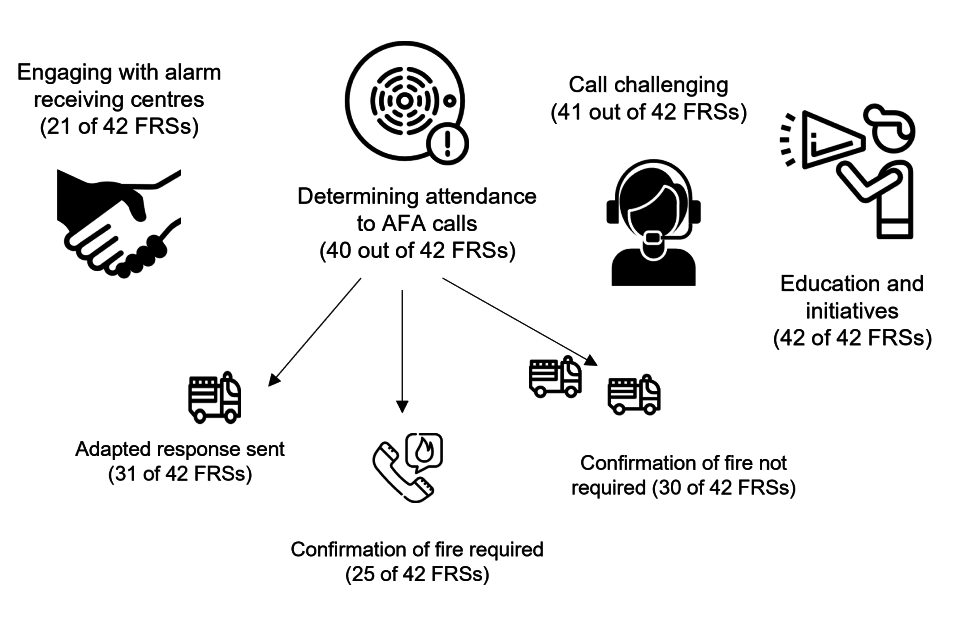
While the way in which fire false alarm policies are implemented across FRSs varies, they can be broadly categorised as engaging with alarm receiving centres (ARCs), determining attendance to automatic fire alarm (AFA) calls, call challenging 999 calls, and engaging with the community and businesses through education and initiatives.
Research aims
- describe the long-term trends in fire false alarms, going beyond the current Home Office statistical publications by looking at incidents by reason, origin (whether the fire false alarm originated from an AFA or not), location, resource expended and variation across FRSs
- better understand the range of policies in place by FRSs and how their application differs across FRSs
- examine differences in fire false alarm incident attendance by FRS and the relationship with the type of policies FRSs have in place
The research
Using data collected from the Incident Recording System (IRS) and data from a survey completed by FRSs on their fire false alarm policies, this research covered the following:
- a detailed description of historic trends in fire false alarms by FRS, type of fire false alarm, location and resource involved
- an overview of the fire false alarm policies used by FRSs from the years ending March 2000 to 2018, and how these policies differed across FRSs, and over time
- a mixed model analysis of policies and fire false alarm attendance to explore whether attendance to fire false alarm incidents differed as policies varied
Findings
Historic trends in fire false alarms
There has been a long-term downwards trend in fire false alarms, which from the year ending March 2010 onwards have largely been due to declines in AFA fire false alarms. While all FRSs have seen long-term declines in fire false alarms, there is considerable variation across FRSs in the number and rates of fire false alarms they currently attend.
Reductions in fire false alarm incidents have coincided with fewer vehicles sent per fire false alarm incident, but more time spent at each fire false alarm incident.
Reductions in fire false alarm calls from properties where people sleep, office properties, and public properties have contributed to the historic downwards trend. However, office and public properties, along with schools, still account for the highest rates of fire false alarm incidents.
FRS fire false alarm policies
The number of FRSs with policies targeting fire false alarms has been increasing since the year ending March 2000. Education and initiatives are the most common policy type and engaging with ARCs the least. There is large variation in how exactly FRSs interpret and apply policies, for example the types of calls they challenge, how they carry out education and initiatives, and the types of responses they send to AFA calls from different locations.
Policies and fire false alarm attendance
FRSs attend fewer fire false alarms when they use policies determining attendance to AFA calls and call challenging, and when not accounting for other factors such as whether the FRS is rural or urban, and the presence of other policies.
The relationship between education and initiatives and fire false alarms, and between policies and resource in terms of vehicles sent to fire false alarms, did not reach statistical significance. However, this could be an indication of lack of data, or large variation in how policies are used, rather than of the policies themselves not working.
Conclusions
There is large variation in how many fire false alarms FRSs attend, despite most services currently having one of the four broad policy types in place. This may in part be explained by differences in the exact application of these policies by FRSs; for example, some services might have a policy, but not use it, or two services that have the same policy might apply them in very different ways. Differences in how services operationalise policies might also help explain why some findings did not reach statistical significance.
Findings that did reach statistical significance suggest policies generally work as expected, and so there is reasonable evidence that these policies achieve their intention. FRSs should consider the findings in this report and make use of other sources, such as National Fire Chiefs Council (NFCC) guidance, when thinking about using policies to reduce fire false alarms.
1. Introduction
Fire false alarms are incidents attended by fire and rescue services (FRSs) which, at the time of call, are believed to be a fire. However, on arrival there is either no fire, or there is a controlled fire such as a bonfire. Attendance at fire false alarm and fire incidents have shown long-term declines, but fire false alarms to a lesser extent. Fire false alarms have also consistently been the largest category of incidents attended by FRSs, making up 40% of incidents attended in the year ending March 31 2018, compared with 31% fire and 29% non-fire incidents. Data in this report is consistent with data received in the Home Office’s Incident Recording System (IRS) 1 by August 2018.
Notes:
- The IRS allows FRSs to complete an incident form for every incident attended, be it a fire, a false alarm or a non-fire incident (also known as a Special Service). The online IRS was introduced in April 2009. Previously, paper forms were submitted by FRSs and an element of sampling was involved in the data compilation process.
Despite reductions in the number of fire false alarms, both the National Fire Chiefs Council (NFCC) and Her Majesty’s Inspectorate of Constabulary and Fire & Rescue Services (HMICFRS) identified the potential for further action. The Chief Fire Officers’ Association’s 2014 ‘CFOA Guidance for the Reduction of False Alarms & Unwanted Fire Signals’ states that “It remains clear that there is still the need for significant improved action associated with the management of false alarms. HMICFRS’s report State of Fire and Rescue: The Annual Assessment of Fire and Rescue Services in England 2019 notes that “False alarms continue to be the biggest demand services face”.
Although it is impossible to know if an attended call is a false alarm until arrival at the scene, FRSs employ a range of different approaches to attempt to reduce the number of fire false alarm incidents attended. Some policies that FRSs commonly employ to attempt to reduce fire false alarm incident attendance are outlined below:
Common policies used by FRSs to reduce fire false alarm attendance Automatic fire alarm (AFA) calls are generated by an alarm operating and a person or mechanism routinely calling the local FRS as part of a standing arrangement. FRSs can send different operational responses upon receiving an AFA call. The response sent typically depends on the type of property and time of day.
The following are common responses:
No confirmation of fire required. A response is immediately sent to the incident, as if it were a confirmed fire.
Adapted response. A response is immediately sent to the incident, but with fewer or different vehicles than would be sent to a confirmed fire.
Confirmation of fire required. A response is only sent to the incident if a call to 999 is made, or if multiple alarms actuate in the same property (a ‘double knock’).
Engaging with alarm receiving centres (ARCs). ARCs receive notification that an AFA has been actuated in a building and notifies the FRS of this activation. FRSs can engage in various ways with ARCs with the aim of reducing the number of false activations they produce.
Call challenging. Filtering procedures can be put in place for control staff to follow upon receipt of a 999 call in an attempt to confirm a fire has occurred. Questions will differ depending on whether the call originates from an AFA, is suspected to be a hoax call or is suspected to be a good intent call.
Education and initiatives. Engaging with and offering education to local businesses and the community about fire false alarms and the reasons for reducing them. This could be face to face, or through published information and materials. Education and initiatives might also include monetary fines or non-attendance, following frequent fire false alarms.
There is a lack of comprehensive information both about the types of fire false alarm polices FRSs in England have in place, and the extent to which these policies have the intended impact of reducing attendance to fire false alarm incidents.
This research aims to address these evidence gaps, in particular to:
- describe the historic trends in fire false alarms, going beyond the current Home Office statistical publications, by looking at incidents by reason for call, origin of call (whether or not the fire false alarm originated from an AFA), location, resource expended and variation across FRSs
- better understand the range of policies in place by FRSs and how their application differs across FRSs
- examine differences in fire false alarm incident attendance and the relationship with the type of policies FRSs have in place
2. Research Design
The research consisted of three parts:
- a detailed description of historic trends in fire false alarms by FRS, type of fire false alarm, location and resource involved, in the years ending 31 March 2000 to 2018, using data collected from the IRS
- a description of FRS policies; a survey was conducted to capture information on fire false alarm policies in place by FRSs between the years ending March 2000 and 2018, which was used to inform how these policies changed over time
- analysis of whether fire false alarm incident attendance differed when policies were in place; this used survey data on FRS fire false alarm policies combined with IRS data for the same time period to identify change over time
2.1 Incident Recording System (IRS)
This research used fire false alarm incident data in the years ending 31 March 2000 to 2018. In the years ending March 2000 to 2009, the data was collected using ‘Fire Data Report 1’ paper forms; in the years ending March 2010 to 2018, data was collected using the electronic IRS.
The introduction of the electronic IRS meant more detailed information was collected which resulted in the discontinuity of some detailed trends pre-dating the year ending March 2010. For example, until that year, there was no data on whether fire false alarm incidents originated from AFAs. While the change in data collection affected the level of detail available, it is unlikely to have caused large changes in historic trends due to the consistent principles which were applied to recording and inputting the high-level false alarm data.
2.2 Survey
An online survey of all FRSs in England captured information on fire false alarm policies in place by FRSs. The survey was drafted with assistance from the NFCC ‘Protection and Business Safety’ committee and piloted with three FRSs to check the survey was understood as intended.
Following the pilot, a letter was sent by the NFCC on behalf of the Home Office to all fire chiefs in England asking for a single point of contact from each FRS to complete the survey. Instructions and survey links were sent to each single point of contact provided. All 45 FRSs in England were asked to participate in the study. In total, 43 FRSs provided a single point of contact and 42 of these completed the survey. For a full list of FRSs who provided data see Appendix A.
The survey asked questions about the four main policy types described in section 1 above, including:
- whether or not the FRS currently had each fire false alarm policy in place
- details about the policy, for example the type of fire false alarm it was designed to target, or whether different policies applied to different property types
- whether the presence of policies changed over time
- what information sources and resources the FRS used when developing policies
For examples of questions asked in the survey, and the survey in full, see Appendix B.
This research was carried out in accordance with Government Social Research Unit’s 2011 ethical guidance, GSR Professional Guidance - Ethical Assurance for Social Research in Government . To mitigate burden on FRSs, a month was given to complete the survey with extensions provided if requested, and only questions necessary for analyses were included in the final survey. Data collection and storage was carried out in line with Home Office data security and GDPR protocols.
2.3 Analysis
2.3.1 Historic trends in fire false alarms
To understand what types of fire false alarms have contributed to overall reductions, descriptive analysis was conducted looking at how types and locations of fire false alarms have changed over time.
In addition to frequency of false alarms, rates of false alarms by property type were calculated using building count estimates using Ordnance Survey® AddressBase® . For details on these data and how property types were defined, see Appendix C.
2.3.2 Fire false alarm policies
To gain a better understanding of the policies in place by FRSs, data from the survey was analysed by calculating how many FRSs had each of the four policy types in place over time. This gave a descriptive overview of the kinds of policies FRSs used to reduce fire false alarm incident attendance over time.
2.3.3 Relationship between policies and fire false alarms attendance
The relationship between the presence of false alarm policies and attendance at false alarm incidents was explored using linear mixed models (LMM) conducted in the programming language R. LMM was considered to be appropriate because the data set contained many ‘unknown’ values, captured multiple time points, and contained repeated multiple values from each FRS.
The LMMs were used to look at trends in fire false alarms, specifically how these trends varied as the policies in place differed. This was done by:
- comparing fire false alarm incident attendance between FRSs that had a policy and those that did not
- comparing fire false alarm incident attendance in years when an FRS had a policy against years they did not (See Appendix D.5 for details of the multiple years for which data were included for each FRS: note that time series was not included in analyses)
The LMMs produced estimates of the different policies’ impact on fire false alarm incidents. The model controlled for factors other than fire false alarm policies which might influence fire false alarm attendance, for example whether the FRS is rural or urban. The inclusion of these other variables in the model meant it produced estimates of how much fire false alarms differed with policies while accounting for these factors. The survey only asked FRSs about their current engagement with ARCs, and so this policy was not included in the models.
In addition, ‘standard deviation’ for each model was calculated. This showed the variance found in the impact of different policies on fire false alarms across FRSs. The larger the standard deviation for each policy in the model, the more variability in fire false alarm attendance across FRSs. For models looking at vehicles sent to fire false alarms, this gave an indication of the range of vehicle numbers deployed across FRSs.
2.3.3.1 How attendance was measured
Attendance was measured as either the number of fire false alarm incidents attended or the number of vehicles deployed to false alarm incidents (counting any type of vehicle that can be sent to an incident believed to be a fire, including pumping appliances fleet cars, aerial appliances etc.). Some policies, for example those sending adapted responses to incidents, cannot be expected to reduce the number of incidents attended, but should influence the overall number of vehicles sent to false alarm incidents. Conversely, policies designed to reduce attendance to incidents, such as call challenging, should both reduce the number of incidents attended and, by default, also the number of vehicles sent to incidents. Therefore, whether the analyses looked at incidents or vehicles depended on the intention of the policy.
2.4 Limitations
The following limitations should be considered when reading the report.
The research observed differences in number of fire false alarms as FRS policies differed. However, it is difficult to establish cause and effect, or to control for other factors which may influence fire false alarm incident attendance, and so it cannot be concluded that any observed differences in fire false alarms were entirely due to FRS policies.
As all FRSs had at least one policy type in place at some point in the years ending 31 March 2000 to 2018, it was not possible to look at whether fire false alarms would have declined in the absence of any policies. It is possible fire false alarms would have declined without any policies, however there was no control group to confirm or disprove this.
FRSs do not necessarily use the policies they have in place consistently. This may mean that analyses underestimated the effects of some policies, as they were recorded as present, but not used in practice.
Any errors made during completion of the survey or the IRS data, such as differences in the interpretation of questions, will have reduced the quality of data. Therefore, the extent to which conclusions are valid depends on how accurately the surveys were answered and incidents were recorded.
3. Historic trends in fire false alarms
This chapter provides an overview of historic trends in fire false alarms using data from the IRS (see Appendix E for full data tables). It firstly describes the overall trend in fire false alarms, including by fire false alarm type. It then looks at the resource sent to fire false alarms, fire false alarms by location, and how fire false alarm incident attendance differs across FRSs. Finally, possible contributors to historic and future trends in fire false alarms are considered.
Fire false alarms have consistently been the largest category of incident attended by FRSs, at 42% in the year ending March 2000 when data first became available, and 40% in the year ending March 2018. Historically, fire false alarms have been on a long-term downwards trend, declining by 42% between the years ending 31 March 2000 and 2018 from 388,200 to 225,600 (2018 was the most up-to-date full financial year available at the time of analysis). However, more recently, this trend appears to have plateaued with some small fluctuations observed in recent years, with an increase of 4% between the years ending March 2016 and 2017, and by 1% between years ending March 2017 and 2018. This chapter explores where, specifically, these changes have occurred.
3.1 Fire false alarms by FRS
At an individual level, all FRSs have shown long-term declines in their fire false alarm attendance from years ending March 2002 to 2018 (for data table see FIRE0102) but currently show considerable variation in both the number of fire false alarms attended, and rates of fire false alarms attended per 100,000 population, as shown in Figure 1 and Figure 2.
Looking at rates of fire false alarms, as well as number of fire false alarms, takes into account that larger FRSs are likely to attend more fire false alarms due to more people living in these areas.
Figure 1: Number of fire false alarms by FRS, year ending 31 March 2018
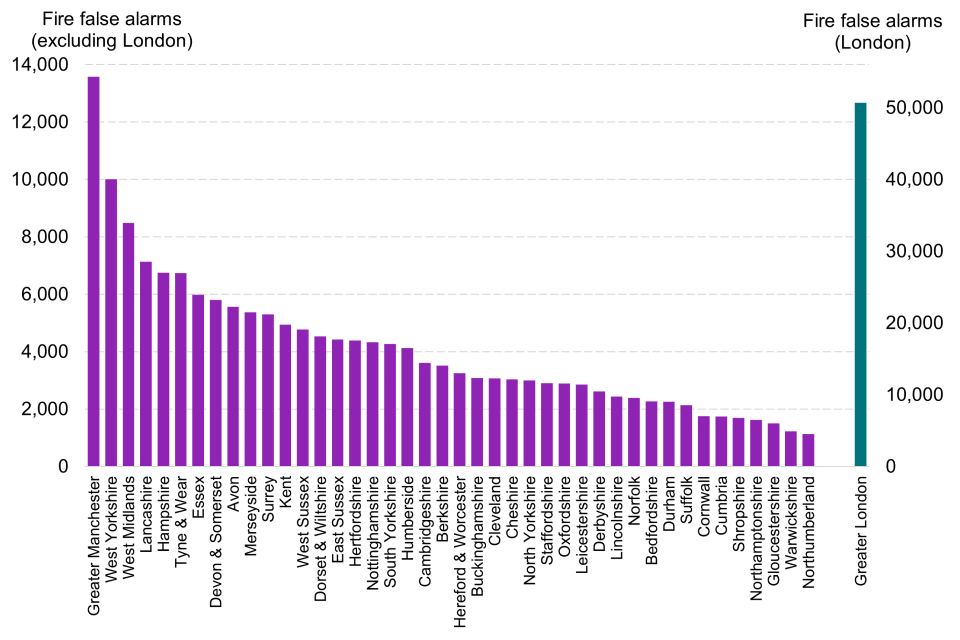
As seen in Figure 1, Greater London attended the most fire false alarms of any FRS in the year ending March 2018 with around 50,700, with Greater Manchester having the second highest number, and Northumberland the least with 1,100. In Figure 1, London is shown on a separate axis due to scales, so the number of fire false alarms attended by other FRSs can be made clear.
In Figure 2, population is also accounted for and the FRSs are split into rural and urban classification.
Figure 2: Rates of fire false alarms per 100,000 of FRS population, by rural/urban classification, year ending 31 March 2018

When accounting for population, Tyne and Wear had the largest number of fire false alarms relative to population in the year ending March 2018, at around 600 fire false alarms per 100,000 population. This compares with Warwickshire, at around 200 fire false alarms per 100,000 population, the lowest number of fire false alarms relative to population. West Sussex had the highest rate in significantly rural FRSs and Cambridgeshire had the highest rate in predominantly rural FRSs.
However, it is important to note that while some of this variation may be accounted for by different policies put in place by FRSs (discussed in Chapter 4.4) there are also likely to be local factors which influence fire false alarms attendance. These could include building type or population characteristics. As shown in Figure 2, FRSs classified as urban tend to attend a slightly higher rate of fire false alarms relative to population.
3.1.1 Fire false alarms by origins of call and reason for call
It is also possible to look at fire false alarms by their origin of call and reason for call.
Origin of call refers to whether the call reporting a potential fire was generated by an AFA system, or not. AFA calls are those initiated by an alarm operating and a person or mechanism routinely calling the local FRS as part of a standing arrangement, for example from an alarm receiving centre. All other calls not falling under this category are categorised as ‘not due to an AFA’.
Reason for call refers to the cause of the fire false alarm, which can be due to human behaviour (good intent or malicious) or due to apparatus. ‘Good intent’ are calls made in good faith in the belief that there really was a fire incident. ‘Malicious’ are those calls made with the intention of getting the FRS to attend a non-existent incident, including deliberate and suspected malicious intentions. ‘Due to apparatus’ fire false alarms are incidents initiated by fire alarm and fire-fighting equipment operating. The two categories are not mutually exclusive, as shown in Table 1.
Table 1: Examples of fire false alarms by reason for, and origin of, call
| Reason for call |
Origin Due to an AFA |
Origin Not due to an AFA |
|---|---|---|
| Good Intent | A customer in a shop sees what they believe to be smoke and breaks the glass of a fire call point | Someone calls 999 after seeing smoke in their neighbour’s garden, which turns out to be a barbeque |
| Malicious | Someone breaks the glass of a fire call point despite knowing there is no fire | Someone prank calls 999 to report a fire |
| Apparatus | An aerosol spray activates a smoke alarm linked to an AFA system | Dust trapped in a smoke alarm sets the alarm off, someone hears and calls 999 |
3.1.1.1 Origin of call
The largest category of fire false alarms, by origin of call, has consistently been AFA fire false alarms, which in the year ending March 2018 made up 60% of all fire false alarms (135,500) compared to 40% non-AFA fire false alarms (90,100).
Figure 3: AFA and non-AFA fire false alarms, England, years ending 31 March 2000 to 2018
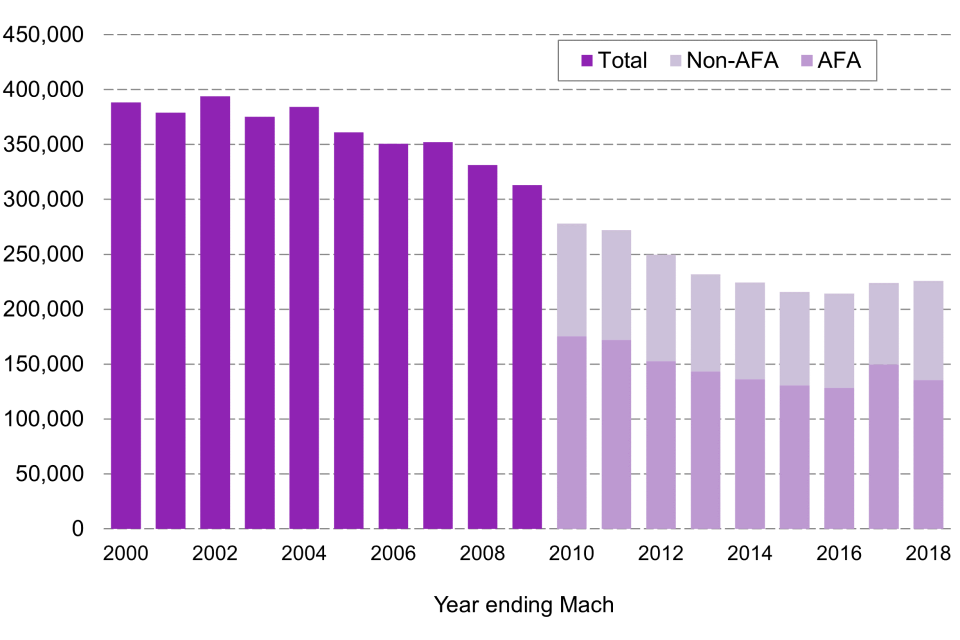
AFA fire false alarms have shown the largest declines. Since the year ending March 2010 (when detailed data were first collected) AFA fire false alarms have declined by 23% (down by 40,100) and non-AFA fire false alarms by 12% (down by 12,100). Recently the number of both incident types have fluctuated, as shown in Figure 3. As the larger category with the greater reduction over time, AFA fire false alarms accounted for the majority (77%) of the reduction in total fire false alarms since the year ending March 2010 (19%). This could either mean there is greater scope for declines in this type of fire false alarm as they are more easily reduced, or that reductions here could soon ‘bottom out’. If all FRSs were already using policies determining attendance to AFA calls, call challenging AFA calls, and targeting AFA fire false alarms through education and initiatives, then AFA fire false alarms might be at their lowest. However, variation in policies targeting AFA fire false alarms (discussed in Chapter 4) suggest this is not the case, and therefore there is likely still scope for reductions in AFA fire false alarms.
3.1.1.2 Reason for call
When looking at fire false alarms by reason for call, fire false alarms due to apparatus have consistently made up the greatest proportion of total fire false alarms and malicious calls the smallest, (67% and 3% respectively in the year ending March 2018) as shown in Figure 4.
Figure 4: Fire false alarms by reason for call, England, years ending 31 March 2000 to 2018
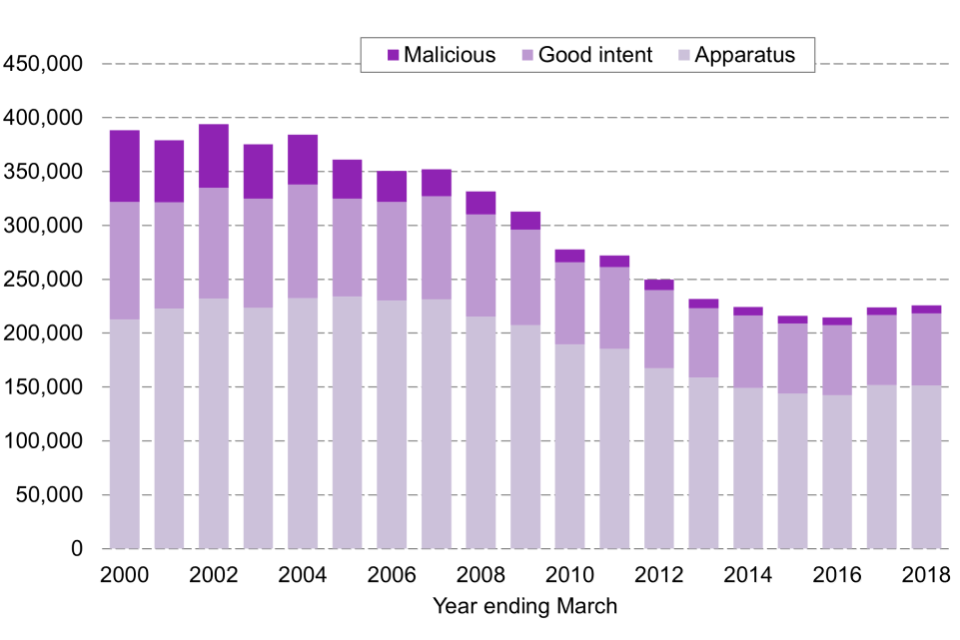
Malicious fire false alarms have shown the greatest proportional long-term decline from around 66,500 (17% of fire false alarms) in the year ending March 2000 to around 7,300 (3% of fire false alarms) in the year ending 2018, an overall decline of 89%.
Fire false alarms due to apparatus have shown a reduction of 29% (61,100) since the year ending March 2000. Although this is a smaller proportional decline compared to malicious fire false alarms, the volume of fire false alarms due to apparatus means that they made the largest impact on the overall decline (as shown in Figure 4).
Good intent fire false alarms have declined by 39% (42,220) since the year ending March 2000. Despite this long-term decline, good intent fire false alarms showed a small increase (2%; 1,600) between the years ending March 2017 and 2018, 97% of which was driven by an increase in fire false alarms attended in dwellings, care homes and other sleeping properties. This increase coincided with the Grenfell Tower fire, which may in part explain the increase in calls to report potential dwelling fires.
When combining origin of call and reason for call there is overlap between the two categories – generally speaking, fire false alarms which are due to apparatus are generated from an AFA. In the year ending March 2018, 81% of apparatus fire false alarms originated from AFA calls, and 90% of AFA fire false alarms were due to apparatus. Together, AFA fire false alarms due to apparatus made up over half (54%) of all fire false alarms in the year ending March 2018. Good intent fire false alarms tended not to originate from AFA calls, and the majority of malicious fire false alarms did not originate from an AFA call. In the year ending March 2018, 85% of good intent fire false alarms were non-AFA calls, with only 7% of AFA calls being good intent; and 58% of malicious fire false alarms were non-AFA calls, with only 2% of AFA calls being malicious.
3.2 Fire false alarms by property type or location
Using data from the IRS and Ordnance Survey® property data 1 it is possible to analyse the number of attended fire false alarm incidents by location or property type (see Table 2), and the rates of attended fire false alarm incidents per 1,000 of that property type (see Table 3).
Notes:
- Data collected using the IRS involves firefighters recording details of an incident after attending. This means data could be subject to some level of interpretation by the attending firefighter, around how to define a property or location type. Property counts are based on best available data. For definitions of property types, information about potential differences and errors, see Appendix C.
Fire false alarms in outdoor locations are included in Table 2 but not Table 3, as it is not possible to calculate rates of fire false alarms in outdoor locations. Some categories, for example heritage buildings, and ‘other’ properties are difficult to match between IRS property categories and AddressBase® categories, and so have not been included in these calculations. Therefore, some totals in the tables may not match.
Table 2: Number of fire false alarms by location/property type, England, year ending 31 March 2018
| Property type/location | All fire false alarms | AFA fire false alarms | Non-AFA fire false alarms |
|---|---|---|---|
| Public (Commercial, licensed and public properties) |
25,520 | 21,876 | 3,644 |
| Sleeping (Dwellings, care homes and other sleeping properties) |
132,673 | 81,572 | 51,101 |
| High risk and industrial | 10,032 | 8,875 | 1,157 |
| Office | 12,432 | 11,187 | 1,245 |
| Schools and educational (non-residential) |
11,130 | 10,441 | 689 |
| Places of worship | 632 | 459 | 173 |
| Outdoor locations | 24,682 | 146 | 24,536 |
Table 3: Rates of fire false alarms per 1,000 property type, England, year ending 31 March 2018
| Property type/location | All fire false alarms | AFA fire false alarms | Non-AFA fire false alarms |
|---|---|---|---|
| Public (Commercial, licensed and public properties) |
32 | 28 | 5 |
| Sleeping (Dwellings, care homes and other sleeping properties) |
7 | 4 | 3 |
| High risk and industrial | 17 | 15 | 2 |
| Office | 66 | 59 | 7 |
| Schools and educational (non-residential) | 232 | 218 | 14 |
| Places of worship | 17 | 12 | 5 |
Considering both incident numbers and rates gives a more comprehensive view of which properties or locations are generating fire false alarms. The volume of fire false alarms produced by a property type will be due to its prevalence and characteristics.
Prevalence: how many buildings there are, of that property type, in England.
Characteristics: the property type’s use, occupants, likelihood of having an AFA system and so on.
Property types might produce a high number of fire false alarms due to there being a large number of these properties, and because of the characteristics of the properties. Property types might produce a high rate of fire false alarms because of specific characteristics of that property type, regardless of its prevalence. Both number and rate should be considered when aiming to understand how fire false alarms differ by property type.
The highest number of fire false alarm incidents attended were at properties where people sleep. This was over half (59%) of total fire false alarms in the year ending March 2018. However, when accounting for building numbers, sleeping properties have the lowest rate of false alarm incidents (7 per 1,000 properties).
This suggests that sleeping properties generated a large volume of fire false alarm incidents due to high prevalence of this property type in England. This implies that policies aiming to reduce fire false alarms in sleeping properties will need to have an impact on a large number of them to influence overall fire false alarm attendance. Declines in fire false alarms at sleeping properties accounted for 32% of the overall decline in fire false alarms between the years ending March 2011 and 2018, demonstrating that reductions in the large volume of fire false alarms that sleeping properties produce has potential to impact overall attendance.
School and education properties (excluding residential schools or halls of residence) had the highest rate of fire false alarms, at around 200 per 1,000 properties in the year ending March 2018. This compares with the 5% of total fire false alarms they accounted for in the same year, meaning they have a disproportionately high rate of fire false alarms.
Schools and education properties also had the highest proportion of AFA to non-AFA fire false alarms at 94% (around 10,400). This compares with sleeping properties where 61% (81,600) were AFA fire false alarms.
Office properties and public properties had the second and third highest rates of fire false alarms respectively. In the year ending March 2018, there were 66 fire false alarms per 1,000 office properties, accounting for 6% of total fire false alarms. For public properties, this rate was 32 fire false alarms per 1,000 properties, accounting for 11% of total fire false alarms.
Declines in public and office properties were the second and third largest contributors to the overall declines in fire false alarms between the years ending March 2011 and 2018 at 21% and 15% respectively.
The implication of these findings is that property types differ in how they contribute to overall fire false alarm attendance. Some properties produced a relatively low rate of fire false alarms, but due to there being many of these properties, generated a high volume overall. In contrast, some produced a relatively low number of fire false alarms, but due to there being few of these properties, generated a high rate of fire false alarms.
It is possible that variation in fire false alarms attended by FRSs is in part influenced by differences in local property stock. FRSs may consider these findings, along with information about local property composition, to determine the likely drivers of their fire false alarm attendance. This could help inform understanding of fire false alarm attendance and, by extension, how to address and target fire false alarm attendance.
3.3 Resource sent to fire false alarms
It is also useful to consider whether the resource spent on fire false alarm incidents has changed over time. For full data on time spent at incidents and vehicles sent to incidents, see Appendix E. Resource sent to fire false alarms has been measured in two ways:
- total time spent at fire false alarms (measured from the time the first vehicle mobilised reaches the incident to the time the last vehicle has left)
- number of vehicles sent to fire false alarms
3.3.1 Time spent at fire false alarms
In England a fire false alarm occurred every two minutes on average in the year ending March 2018. Looking at total time spent at fire false alarms, FRSs spent a total of around 63,000 hours at fire false alarms in that year. This is a reduction of 12% compared to the year ending March 2010, when FRSs spent a total of around 72,000 hours attending fire false alarms. This compares to a decline of 19% (around 52,200) in fire false alarm incidents over the same period. Changes in time spent at fire false alarms indicates, as would be expected, that the long-term decline in fire false alarms has been reflected in the resource used.
When looking at average time spent at fire false alarms there has been a small increase over time with some year-on-year fluctuations. In the year ending March 2010, FRSs spent a median time of 13 minutes and 38 seconds at a fire false alarm. In the year ending March 2016, median time spent peaked at 15 minutes and 10 seconds, before decreasing to 14 minutes and 55 seconds in the year ending March 2018.
3.3.2 Vehicles sent to fire false alarms
Resource in terms of total vehicles sent to fire false alarms has declined. In the year ending March 2010, FRSs sent 427,000 vehicles to fire false alarm incidents, decreasing by 22% to 332,000 vehicles in the year ending March 2018. Over the same period, fire false alarm incidents declined by 19% (around 52,200). As with time spent at incidents, changes in vehicles sent to incidents indicates that the long-term decline in fire false alarms has been reflected in resource.
The decline in vehicles per false alarm from the years ending March 2000 to 2018 will be very small. This will, in part, be because there is limited scope for reduction, as there will be at least one vehicle attending a fire false alarm (and operational discretion may determine more vehicles be sent).
Where it might not always be possible to reduce the number of fire false alarms, it is worth considering where small reductions in vehicles sent to fire false alarms can free up resource overall, and to reduce potential road risk posed by the driving of blue light vehicles. (Source: A guide to reducing the number of false alarms from fire-detection and fire-alarm systems )
Looking at vehicles per fire false alarm, in the year ending March 2010, FRSs sent 154 vehicles per 100 fire false alarms. Over five years, that figure decreased by 6% to 144 vehicles per 100 fire false alarms. Over the following three years, the number gradually increased by 2% to 147 per 100 fire false alarms in the year ending March 2018. Despite this slight increase, there has been an overall decline of 4% compared to the year ending March 2010.
Figure 5: Resource sent to fire false alarms, England, years ending 31 March 2000 to 2018

There is, therefore, a mixed picture when looking at historic trends in resource sent to fire false alarms, where average time at fire false alarm incidents has increased, vehicles sent have decreased slightly, with fluctuations observed in both (as shown in Figure 5).
3.4 Contributors to trends in fire false alarms
In addition to policy changes made by FRSs (discussed in section 4.4, this section sets out some other factors that may have contributed to the historic trends described above. The following factors are a mix of those which may have previously impacted trends, and those which may continue to impact trends in the future.
Time spent at the scene educating those responsible for the fire false alarm, increasing overall time spent at fire false alarms.
Declines in malicious fire false alarms as it became more difficult to make anonymous hoax calls due to reductions in the number of public telephone boxes, and better call tracing.
Declines in fire false alarms caused by malicious or accidental activation of manual call points (‘break glass in the occurrence of fire’ boxes in public places) due to the introduction of protective plastic covers.
Reductions in fire false alarms caused by the false activation of smoke detectors due to advances in smoke detection systems, and old systems being replaced.
Increases in fire false alarms caused by ageing smoke detectors.
Increases in good intent fire false alarms due to increasing public awareness of fire safety, for example following high profile fires and incidents.
Further research would need to be undertaken to understand and quantify the actual contribution of the factors mentioned above and explore what other factors may influence trends in fire false alarms in the future. To begin to understand what may have contributed to the downwards trend in fire false alarms, the following chapters describe FRS policies and explore their relationship with fire false alarm attendance.
4. Fire and rescue service fire false alarm policies
This chapter describes policies used by FRSs to attempt to reduce fire false alarms. This is based on information collected in a survey about the policies each FRS had in place covering the years ending 31 March 2000 to 2018. Detailed information can be found in Appendix F, and a summary of the policies the FRSs (of the 42 who responded to the survey) had in place in the year ending March 2018 is presented in Figure 6. For descriptions of the policies FRSs frequently use, see ‘Common policies used by FRSs to reduce fire false alarm attendance’. in Chapter 1.
Figure 6: Summary of policies in place by FRSs in the year ending 31 March 2018
4.1 Types of policies used by FRSs
Not all FRSs held records dating back to the year ending March 2000: the number holding information about their historic policies varied (see Appendix F for details). The proportion of FRSs with each policy type in place has therefore been calculated by removing the FRSs where no information was available for that year. Therefore, this may underestimate the number of policies in place, particularly in earlier years, as some FRSs may have had policies but did not record them at that time.
The number of FRSs reporting having policies has gradually increased over time. In the year ending March 2000, 3% of FRSs (1 out of 29 who had records for that year1) reported having policies determining attendance to AFA calls, 9% (3 out of 33) reported having call challenging and 36% (15 of 42) reported offering education and initiatives.
Education and initiatives have consistently been the most common policy type, followed by call challenging and then policies determining attendance to AFA calls, as shown in Figure 7, which is a bar chart displaying the percentage of FRSs using different policies between 1999/00 and 2017/18.
Notes:
- Number of FRSs reporting the presence of policies refers to the total number of FRSs stating they either had this policy in place or did not. Those without this information available have not been included. Meanwhile, policies in regards to FRS relationships with alarm receiving centres were asked about in 2017/18 only.
Figure 7: Policies by percentage of FRSs reporting using them, years ending 31 March 2000 to 2018 [*]
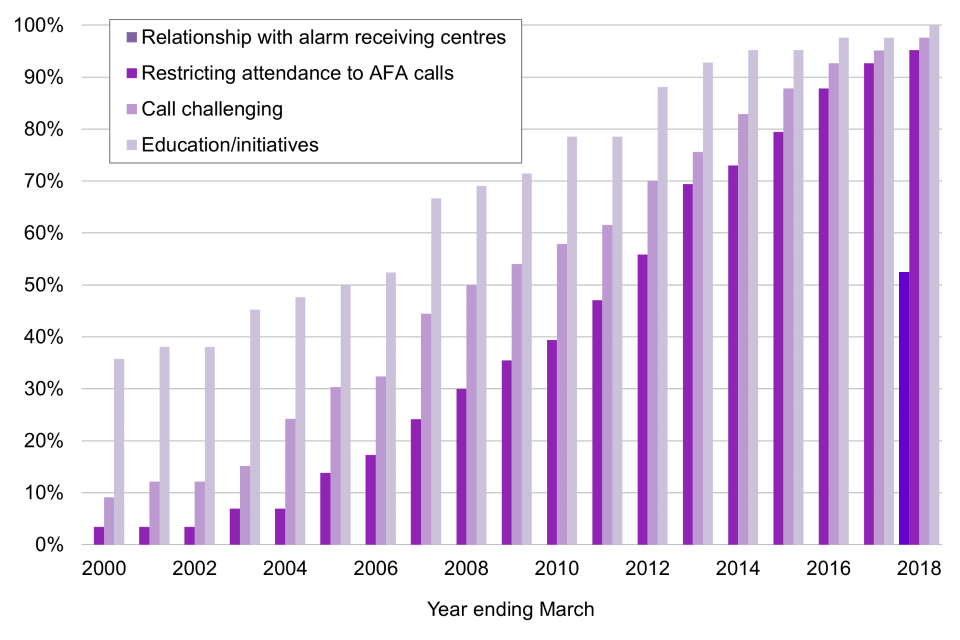
[*] Percentage of those who recorded either having these, or not having these, policies in place that year.
4.2 How do FRSs determine attendance to AFA calls?
When determining attendance to AFA calls, FRSs have options in the types of response they can send. The responses include requiring confirmation of fire to attend, not requiring confirmation of fire to attend and sending an adapted response (see Chapter 1 for definitions), and these are not mutually exclusive.
The response an FRS sends depends on the type of property and the time of day. The survey asked FRSs which response(s) they sent to each type of property (out of a possible 13 types) but, for simplicity, did not ask at which time of day FRSs would send each response.
This section uses information collected from the survey to look at how FRSs currently and have previously used these response types when determining attendance to AFA calls.
4.2.1 Type of response sent to AFA calls
When an FRS is referred to as sending one of the three responses, this means that there is at least one type of property type to which they will send that response type. Over time, the proportion of FRSs sending each type of response to AFA calls has increased (as shown in Figure 8, a clustered column chart showing the responses to AFA calls by percentage of FRSs sending that response). Responses are not mutually exclusive – one property type can receive multiple types of responses, depending on time of day.
The number of FRSs reporting sending an adapted response to AFA calls (a response is immediately sent to the incident, but with fewer or different vehicles than would be sent to a confirmed fire) has increased. In the year ending March 2000, one FRS (of the 29 providing data that year) reported sending an adapted response to at least one property type. This increased over time to 74% of FRSs (31 of the 42 providing data that year) in the year ending March 2018, making this the second most common response type to AFA calls.
Figure 8: Responses to AFA calls by percentage of FRSs sending that response [*]
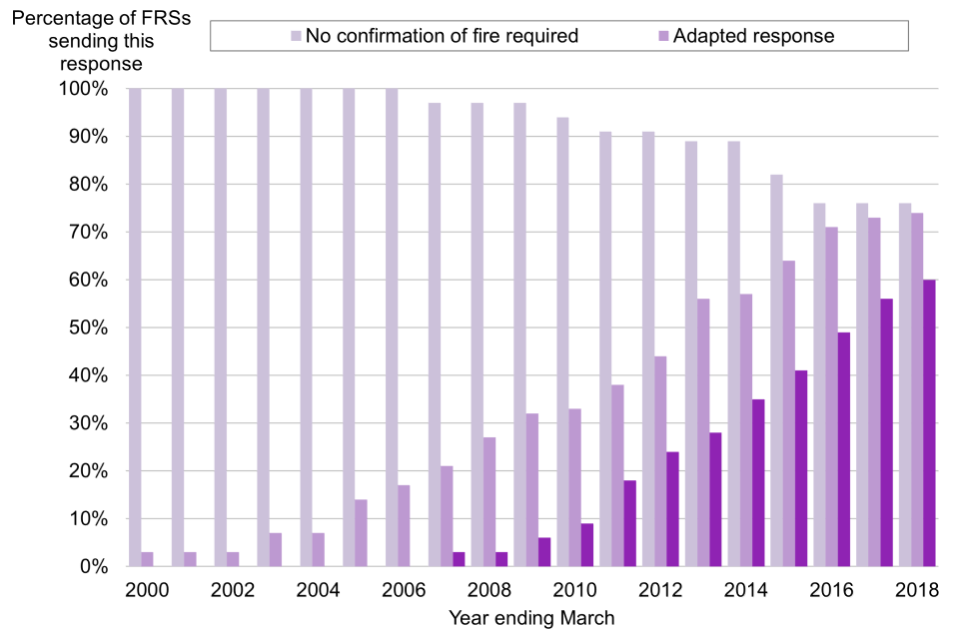
[*] Percentage of those who reported either using, or not using, that policy that year.
The number of FRSs requiring confirmation of fire to attend an incident has also increased – from no FRSs in the year ending March 2000 to 60% of FRSs (25 of the 42 providing data) in the year ending March 2018. This may reflect a move by FRSs to reduce potential resource sent to fire false alarms, to a greater extent than can be achieved by sending an adapted response.
In the year ending March 2018, 76% of FRSs (32 of the 42 providing data) did not require confirmation of fire to attend AFA calls, compared to all FRSs in the year ending March 2000 (29 of 29 providing data). Proportionally, the number of FRSs who did not require confirmation of fire to attend AFA calls has changed. However, the number of FRSs reporting having or not having this policy type has also changed, and therefore this does not necessarily reflect a decline in FRSs responding to AFA calls in this way.
The greater implementation of policies over time suggest increasing FRS effort to reduce fire false alarm attendance by targeting AFA calls, a frequent cause of fire false alarms. This move has meant that, as of 31 March 2018, the proportion of FRSs sending each type of response is relatively similar (as shown in Figure 8). Yet, as identified in Chapter 3, there are still large differences in the number of fire false alarms attended by FRSs. It is therefore worth considering how FRSs differ in the specific ways in which they interpret and employ the broad policy types, as this might help explain differences in fire false alarm attendance.
4.2.2 Response to AFA calls by property type
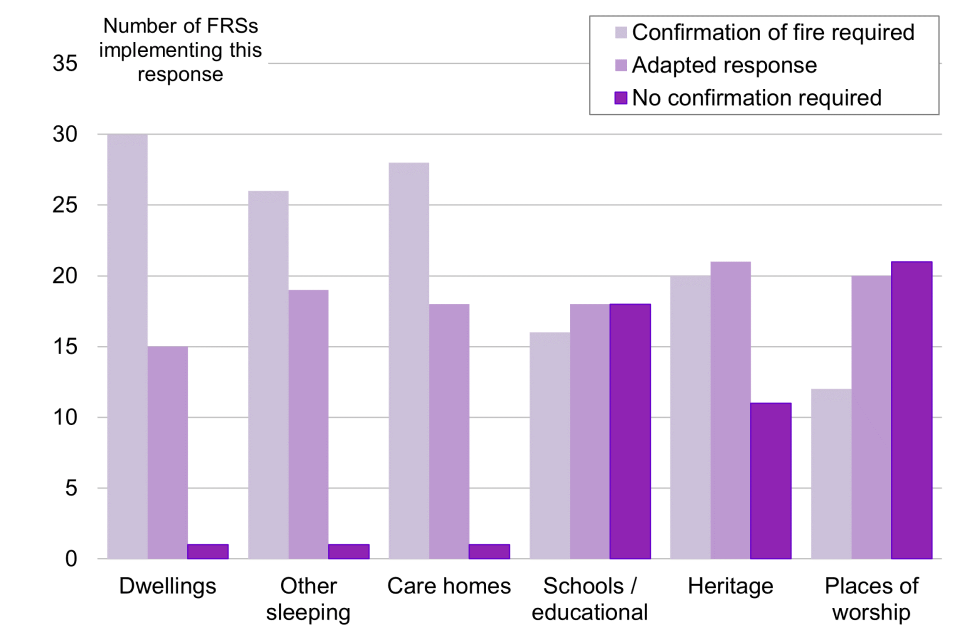
When employing policies determining attendance to AFA calls, FRSs can choose to vary response depending on property type (as shown in section 3.2). Responses are not mutually exclusive – one property type can receive multiple types of responses, depending on time of day. Variation in responses by property type could help explain why fire false alarm attendance differs across FRSs, despite most having a policy in place which determines attendance to AFA calls. Figure 9 shows that, in the year ending March 2018, ‘no confirmation required’ was the most common response for properties in which people sleep (dwellings, care homes and other sleeping properties) and properties considered by the individual FRS as ‘high risk’ (property types considered ‘high risk’ may differ). For all other property types, either an ‘adapted response’ or ‘confirmation of fire required’ were the most common responses, although schools/educational establishments showed a more mixed picture.
Figure 9: FRSs sending each responses type to AFA calls, year ending 31 March 2018
4.3 How do FRSs differ in the policies they have in place?
It appears very few FRSs do not currently have in place call challenging policies, education and initiatives, and policies determining attendance to AFA calls. Yet, as shown in Chapter 3, there is still large variations in the number and rates of fire false alarm incidents attended by different FRSs. This could, in part, be due to differences in how exactly FRSs apply the broad policy types. There is inevitably variation in how FRSs operationalise the four policy types – for example, while multiple FRSs might use education and initiatives, the exact content of education materials will vary.
While the previous sections discussed policy use over time, the following section looks at how FRSs differ in their application of policies, which may help to explain variation in fire false alarm attendance.
4.3.1 Call challenging
Of those 41 FRSs which had call challenging policies in place in the year ending March 2018, the majority (30 or 73%) used call challenging procedures to target all types of fire false alarms – good intent, AFA and malicious. FRSs seem to adopt a similar approach in terms of the types of fire false alarms they target using call challenging (only one did not challenge AFA calls). However, there is likely to be variation in the exact nature of call challenging procedures.
4.3.2 Engaging with alarm receiving centres
To reduce fire false alarms, FRSs might work with ARCs towards reducing fire false alarm incidents. Approaches may vary but, as an example, can include encouraging good practice, or identifying centres that produce low numbers of false alarms. Of the 21 FRSs who reported engaging with ARCs, nine reported giving ‘trusted’ ARCs a direct (non-999) number to report the actuation of an AFA. Only one reported encouraging premises using AFA systems to choose these ‘trusted’ ARCs.
4.3.3 Education and initiatives
In the year ending March 2018, all 42 FRSs had education and initiatives in place. Of these, over half (24; 57%) targeted all good intent, malicious and AFA fire false alarms. Of the remaining FRSs, most (16 of 18; 89%) targeted malicious and AFA fire false alarms. As with call challenging policies, there appears to be consistency across FRSs in terms of the types of fire false alarms targeted by education and initiatives.
There is, however, variation in how specifically FRSs approach education and initiatives. Figure 10, presents, for each of the 42 FRSs, which type of education and initiatives they used in the year ending March 2018 using dots to correspond with the initiatives they offer, and shows the large variety in types and number of education and initiatives applied. For example, while the majority of FRSs (39 of 42; 93%) provide information and materials about AFA fire false alarms, relatively few (10 of 42; 24%) use monetary fines as a deterrent for frequent AFA fire false alarms.
Figure 10: How education and initiatives vary across FRSs, year ending 31 March 2018 [*]
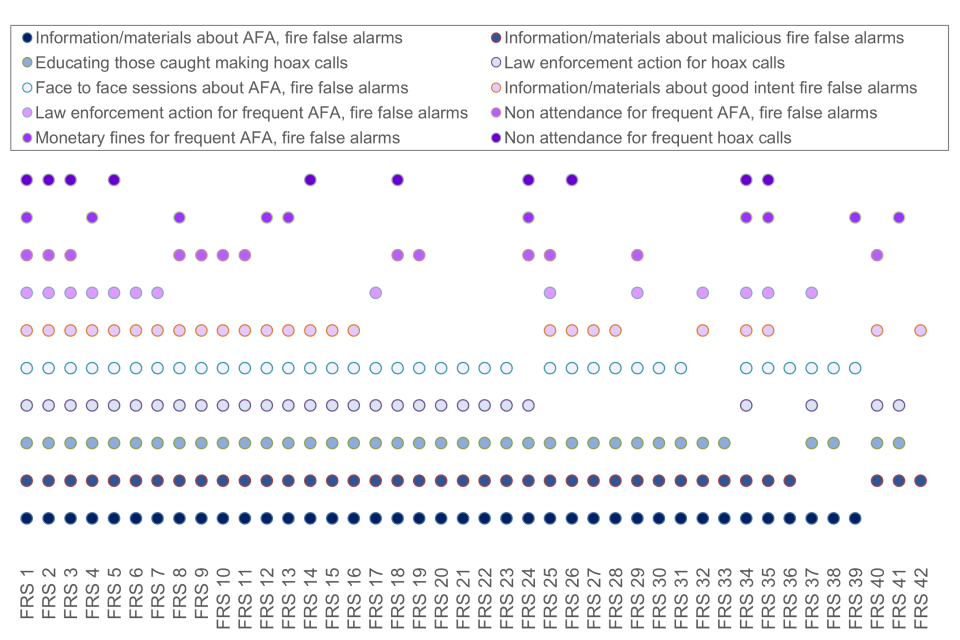
[*] Variation across the 42 FRSs who had education and initiatives in place in the year ending March 2018. 2. Not all FRSs wanted their information to be shared so names have not been included. 3. FRSs are numbered in no particular order.
4.3.4 Determining attendance to AFA calls
Those FRSs with policies determining attendance to AFA calls in place varied in terms of how, specifically, they responded to AFA calls. Figure 11 shows, for each of the 42 FRSs, which types of responses were being sent to AFA calls in the year ending March 2018.
Figure 11: Responses sent to AFA calls by FRSs, year ending 31 March 2018 [*,**]
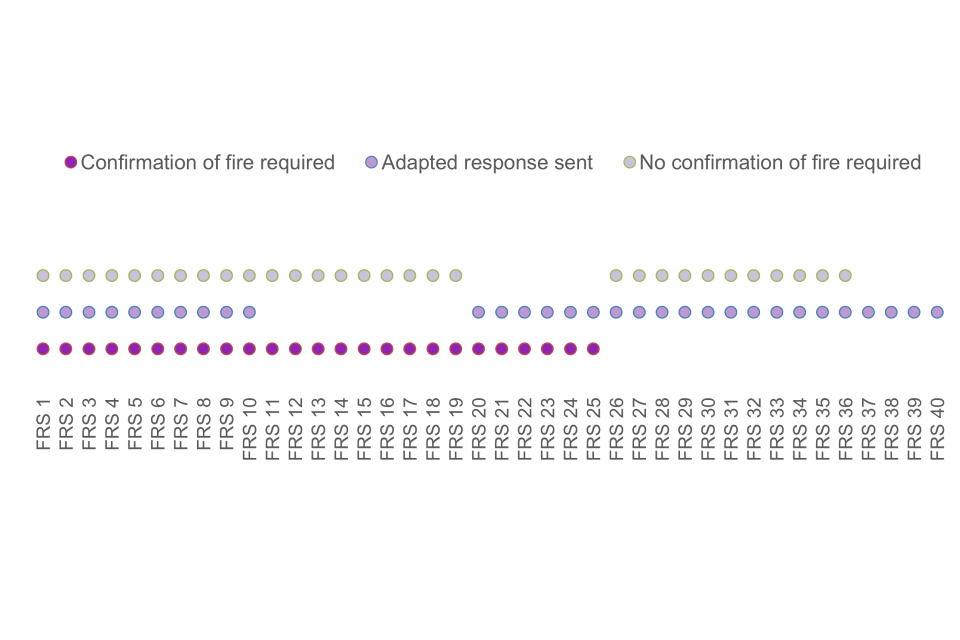
[*] Variation across the 42 FRSs who reported on policies determining attendance to automatic fire alarm calls in place in the year ending March 2018. Not all FRSs wanted their information to be shared, and so names have not been included. FRSs are numbered in no particular order.
[**] Of the 42 FRSs, 40 would either send an adapted response, or require confirmation of fire, to attend an automatic fire alarm call and so were considered to ‘determine attendance to automatic fire alarm calls’. Two FRSs did not require confirmation of fire to attend, and had no other determining attendance policies in place, represented in Figure 11. These two FRSs are not captured in Figure 6.
Some FRSs (4 of 40) would only ever send an adapted response to an AFA call, but none would only ever require confirmation of fire to attend. The majority of FRSs (26 of 40) sent a combination of two of the response types, and a quarter (10 of 40) sent all three response types, to AFA calls. The variation is due to the how the policies are applied, for example by property or alarm type, so despite similar policies in place between FRSs there will likely be a difference in the types and numbers of fire false alarms attended.
This chapter has discussed the various policies used by FRSs in an attempt to reduce their fire false alarm attendance Chapter 5 explores the effect of these policies by describing the findings from analyses investigating the relationship between policies and attendance to fire false alarm incidents.
4.4 Policy development and changes
When developing policies, FRSs reported using a range of sources of information to inform the final policy. The most frequently reported sources of information were Chief Fire Officer Association (CFOA) guidance and Integrated Risk Management Plans (IRMPs). Other sources included public consultations, NFCC guidance and legal advice. In some cases, FRSs reported receiving a challenge when developing or introducing policies, such as from property owners or members of the public. For a full table of sources used by FRSs when developing polices and challenges received, see Appendix F.
Once introduced by an FRS, policies were generally kept in place. This was true for all policy types, and there were very few cases of a policy being introduced and then removed. The exception to this was how, specifically, FRSs determined attendance to AFA calls. The types of responses – confirmation of fire required, no confirmation of fire required and adapted response sent – and the number of property types FRSs sent each response type to were frequently changed by FRSs year on year. This perhaps reflects FRSs reviewing and adapting their policies determining attendance to AFA calls, and the responses they send to different properties. It is also possible that while overall ‘types’ of policies – such as call challenging – were consistently used by FRSs, the exact method by which they were carried out was reviewed and changed.
The survey did not capture enough detail to understand change in policy application; however, at an FRS level, recording detailed information on policy application over time should be possible. Recording policies in this way would mean FRSs are able to evaluate policies and resulting performance in terms of fire false alarm attendance. This could happen on an ongoing basis and could help contribute to good practice and effective reduction in fire false alarms.
5. Does fire false alarm attendance differ when policies are present?
This chapter describes the findings from the LMM analysis which explored the relationship between the presence of false alarm policies, the number of false alarm incidents attended, and the number of vehicles sent to false alarm incidents, over time. The outcome tested in each model depended on whether the policies in question could be expected to influence incident or vehicle numbers (as shown in Table 4).
Findings are presented by policy type including discussion on how findings varied by FRS and possible reasons for findings. For a description of the analysis see Appendix D. For a full table of outputs from analyses, see Appendix G.
Table 4: Variables chosen to use in analysis
| Determining attendance to AFA calls | ||||||
|---|---|---|---|---|---|---|
| Education and initiatives | Call challenging | No confirmation of fire required to determine attendance | Confirmation of fire required to determine attendance | Adapted response sent | Overall policy to determine attendance | |
| Incidents | YES | YES | YES | YES | no | YES |
| Vehicles | no | no | no | no | no | YES |
5.1 Are policies determining attendance to AFA calls associated with differences in fire false alarm attendance?
FRSs use a range of policy-based operational responses when they receive an AFA call to determine attendance. The response sent depends on the type of property and time of day. For a reminder of the different response types that FRSs can send, see ‘Common policies used by FRSs to reduce fire false alarm attendance’ in Chapter 1.
5.1.1 Incident attendance
The relationship between AFA attendance policies and the number of fire false alarm incidents attended was explored by testing the number of incidents attended if FRSs have an AFA attendance policy in place, and if the number changed depending on the number of property types (out of a possible 13) that FRSs would apply an attendance policy to.
Fire false alarm incident attendance was lower when a policy determining attendance to AFA calls was in place, as shown in Table 5 below. In this case, there were, on average, 2,191 fewer fire false alarms each year compared to the average number of fire false alarms attended by FRSs. This difference was statistically significant. However, when other variables which might also contribute towards a change in fire false alarm attendance were controlled for in the model, such as additional policies, the difference was smaller and did not reach statistical significance. For all variables – including control variables – included in each model, see Appendix G.1.
Table 5: Determining attendance to AFA calls and differences in fire false alarms
| Control variables | Difference [*] | Incidents/ vehicles |
t score | p value | ||
|---|---|---|---|---|---|---|
| Model 1 | A policy determining attendance to AFA calls was in place | No controls | -2,191 | Fire false alarms | 13.68 | 0.046 [**] |
| With controls | -1,305 | Fire false alarms | -6.544 | 0.097 | ||
| Model 2 | A policy determining attendance to AFA calls was in place | No controls | -595 |
AFA fire false alarms |
-3.674 | 0.169 |
| With controls | -233 |
AFA fire false alarms |
-1.131 | 0.461 | ||
| Model 4 | For every additional property type where confirmation of fire is required | No controls | -71 |
AFA fire false alarms |
-2.767 | 0.221 |
| With controls | -36 |
AFA fire false alarms |
-1.246 | 0.431 | ||
| Model 6 | For every additional property type where confirmation of fire is required | No controls | +61 |
AFA fire false alarms |
3.053 | 0.202 |
| With controls | +45 |
AFA fire false alarms |
2.128 | 0.28 |
[*] Averaged estimated difference, compared to average fire false alarm attendance [**] Indicates statistical significance at the .05 level
5.1.2 Vehicles sent
Analysis was conducted to test whether having a policy determining attendance to AFA calls resulted in fewer vehicles attending AFA fire false alarms. Table 6 outlines the estimated difference in the number of vehicles attending AFA calls as a result of policies in place. While the model estimates that there was marginally less vehicle resource used when policies were present, this difference did not reach a statistically significant level. This means that any effects observed in the models could have been due to chance and a correlation cannot be established between these policies and the effect on vehicle resource applied to AFA calls.
Table 6: Determining attendance to AFA calls and differences in vehicles attending
| Control variables | Difference [*] | Incidents/ vehicles |
t score | p value | ||
|---|---|---|---|---|---|---|
| Model 3 | A policy determining attendance to AFA calls was in place | No controls | -0.098 | Vehicles per AFA fire false alarm | -4.938 | 0.127 |
| With controls | -0.101 | Vehicles per AFA fire false alarm | -4.312 | 0.145 | ||
| Model 5 | For every additional property type where an adapted response is sent | No controls | -0.013 | Vehicles per AFA fire false alarm | -6.215 | 0.102 |
| With controls | -0.248 | Vehicles per AFA fire false alarm | -2.148 | 0.165 |
[*] Averaged estimated difference, compared to average fire false alarm attendance [**] Indicates statistical significance at the .05 level
5.2 Are call challenging policies associated with differences in fire false alarm attendance?
Call challenging policies involve FRS control staff asking questions upon receipt of a 999 call, in an attempt to establish whether a fire has occurred. Call challenging policies can work in several ways including asking an ARC if they have received confirmation of fire, asking a good intent caller for more details on the indications of fire, and by informing potential malicious callers that hoax calls will be reported to the police.
When call challenging FRSs may choose to ‘err on the side of caution’, in particular with good intent calls, so is not necessarily obvious whether challenging policies will lead to fire false alarm reductions. Therefore, analyses were used to test whether this policy type is associated with differences in fire false alarm incident attendance. When FRSs had an overall call challenging policy in place, they attended – compared to the average number of fire false alarms attended – on average 3,396 fewer fire false alarms, as shown in Table 7. This finding reached statistical significance when not considering other factors that might influence fire false alarm attendance, such as the presence of other polices. Therefore, there is reasonable evidence this type of policy works as intended.
When call challenging policies were looked at in terms of the specific type of fire false alarms they target, their relationship with fire false alarms did not reach statistical significance. It is unclear why this might be; however, this means when call challenging policies were present, any observed reductions in malicious, good intent or AFA fire false alarms cannot be treated with confidence as they could be due to chance.
Table 7: Call challenging polices and differences in fire false alarms
| Control variables | Difference [*] | Incidents/ vehicles |
t score | p value | ||
|---|---|---|---|---|---|---|
| Model 1 | A call challenging policy was in place | No controls | -3,396 | Fire false alarms | -14.337 | 0.044 |
| With controls | -1,017 | Fire false alarms | -4. 471 | 0.14 | ||
| Model 2 | A call challenging policy targeting AFA incidents was in place | No controls | -595 |
AFA fire false alarms |
-3.674 | 0.169 |
| With controls | -161 |
AFA fire false alarms |
-0.373 | 0.773 | ||
| Model 7 | A call challenging policy targeting malicious calls was in place | No controls | -75 | Malicious fire false alarms |
-3.919 | 0.159 |
| With controls | +55 | Malicious fire false alarms |
1.247 | 0.43 | ||
| Model 8 | A call challenging policy targeting good intent incidents was in place | No controls | -51 | Good intent fire false alarms |
-1.13 | 0.461 |
| With controls | -80 | Good intent fire false alarms |
-0.739 | 0.595 |
[*] Averaged estimated difference, compared to average fire false alarm attendance [**] Indicates statistical significance at the .05 level
5.3 Are education and initiatives associated with differences in fire false alarm attendance?
Education and initiatives involve FRS staff engaging with members of the public, businesses and individuals responsible for building management, with the aim of reducing fire false alarm attendance. This could involve anything from talks at schools about the negative impact of malicious calls, to firefighters discussing how a property could reduce its fire false alarms with its owner, following attendance at a fire false alarm incident.
Whether differences in fire false alarm incident attendance would occur with education and initiative policies is arguably less certain than policies determining attendance to AFA calls, given communications regarding fire false alarms might be part of wider fire safety messaging.
Table 8 shows that while the model estimated some reduction in fire false alarms when certain education and initiatives were used, this did not reach a threshold to confirm a statistically significant relationship. This was true when looking at education and initiatives and total fire false alarms, and when looking at education and initiatives and the malicious, good intent or AFA fire false alarms at which they were targeted. Therefore, any reductions in these fire false alarms observed when education and initiatives were used might be due to chance.
It is unclear why findings did not reach statistical significance. It is possible that education and initiatives are interpreted and implemented very differently by FRSs, which would make identifying a relationship difficult. This possibility is described below, when considering variation in fire false alarm policies.
Table 8: Education and initiatives and differences in fire false alarms
| Control variables | Difference [*] | Incidents/ vehicles |
t score | p value | ||
|---|---|---|---|---|---|---|
| Model 1 | Education and initiatives were in place | No controls | -2,893 | Fire false alarms | -11.378 | 0.0456 |
| With controls | -1,300 | Fire false alarms | -5. 573 | 0.113 | ||
| Model 2 | Education and initiatives targeting AFA incidents were in place | No controls | -661 |
AFA fire false alarms |
-3.9 | 0.16 |
| With controls | -535 |
AFA fire false alarms |
-2.112 | 0.282 | ||
| Model 7 | Education and initiatives targeting malicious incidents were in place | No controls | -70 | Malicious fire false alarms |
-3.445 | 0.18 |
| With controls | -27 | Malicious fire false alarms |
0.857 | 0.549 | ||
| Model 8 | Education and initiatives targeting good intent incidents were in place | No controls | -2 | Good intent fire false alarms |
-0.032 | 0.98 |
| With controls | +92 | Good intent fire false alarms |
1.022 | 0.493 |
[*] Averaged estimated difference, compared to average fire false alarm attendance [**] Indicates statistical significance at the .05 level
5.4 FRSs and variation in fire false alarms
Analyses looked at how differences in fire false alarm attendance when different policies are in place varied between FRSs. This section will explain levels of variation between FRSs. ‘Standard deviation’ (see Table 9) is the average difference in fire false alarms attended by FRSs, compared to the average number of fire false alarm incidents. The larger the standard deviation, the more variability in fire false alarm attendance across FRSs.
This section discusses how an FRS’s local characteristics might underpin the application of fire false alarm policies. For full outputs see Appendix G.3 and for more information about how variation was measured, see Chapter 2.3.3.
Various polices determining attendance to AFA calls, call challenging policies targeting any type of fire false alarm, and education and initiatives targeting any type of fire false alarms have been used by FRSs. When policy types targeting fire false alarms were in place, reductions in fire false alarm incidents were estimated to vary by around 7,400, depending on the FRS (as shown in Table 9). There was also variation in reductions in fire false alarm incidents attended when looking at fire false alarms by type. Differences in fire false alarms when policies were present varied by about: 200 incidents when policies targeting malicious fire false alarms were present; 1,400 incidents when policies targeting good intent fire false alarms were present; and 3,800 incidents when policies targeting AFA fire false alarms were present, depending on the FRS (as shown in Table 9).
While it is important to note that the size of this variation will in part be due to large differences in the number of fire false alarms attended by FRSs (as described in Chapter 3), it still demonstrates that the reductions in fire false alarms associated with policies are not necessarily ‘fixed’. Instead, characteristics of the FRS or the way in which policies are applied lead to variation in their impact on fire false alarm attendance.
When policy types adapting the number of vehicles sent to AFA calls were in place, reductions in vehicles sent were estimated to vary by about 0.3 vehicles per AFA fire false alarm incident, depending on the FRS (as shown in Table 9). This small level of variation is likely to reflect the fact that relatively few vehicles tend to be sent to incidents, which means there is less scope for large differences across FRSs.
Table 9: Variation in fire false alarms due to differences in FRSs
| Type of fire false alarm | Standard deviation |
|---|---|
| Number of fire false alarms incidents (Model 1) |
7,367 fire false alarm incidents |
| Number of malicious fire false alarm incidents (Model 7) |
220 malicious fire false alarm incidents |
| Number of good intent fire false alarm incidents (Model 8) |
1,424 good intent fire false alarm incidents |
| Number of AFA fire false alarm incidents (Model 2) |
3,759 AFA fire false alarm incidents |
| Vehicles deployed per AFA fire false alarm (Model 3) |
0.297 vehicles per AFA fire false alarm |
Given the levels of local variation, it is important for FRSs to individually consider whether or how to use policies to reduce fire false alarms – what works well for one FRS might work differently for another. FRSs may wish to consider local characteristics, such as property stock or types of fire false alarms frequently attended, when developing existing policies or introducing new policies to try to decide what policy types will work best locally. FRSs should also consider monitoring their own fire false alarm attendance when using a new or existing policy to evaluate what works locally.
5.5 Discussion of statistical significance
There are many reasons why findings may not reach statistical significance. Despite this, both call challenging policies and polices determining attendance to AFA calls were both statistically significantly associated with fewer fire false alarms, when not controlling for other factors such as the presence of other policies. Possible reasons for why policies were not always statistically significantly associated with fewer fire false alarms are explored in this section.
5.5.1 Variation in policies
One possible explanation for lack of statistical significance is variation in how FRSs apply policies. While the survey, and therefore analysis, captured whether specific policy types were in place they did not go into specific detail about how these polices are carried out, or how consistently. If how one FRS applies a policy is different from another, but they are recorded as the same policy in the survey and therefore analysis, this could mask any true relationship and lead to lack of statistical significance.
Alternatively, there might be inconsistencies in the frequency with which FRSs use different policies. For example, some FRSs might have a policy ‘in place’ meaning they are able to use it, but do not use this policy consistently or often, for example charging properties for repeated fire false alarms.
Any variation in how FRSs interpret and operationalise a policy is also likely to mean variation in the relationship that policy has with fire false alarms. This variation makes it harder for analysis to pick up on any ‘true’ relationship between policies and fire false alarms. Further, if policies are recorded as in place but not used, analysis will underestimate the relationship the policy has with fire false alarms when it is used. If this is the case, it might partly explain why findings did not reach statistical significance.
5.5.2 Characteristics of the data
Another possible explanation of why education and initiatives, as well as call challenging policies and policies determining attendance to AFA calls, did not reach statistical significance is lack of data. While analysis looked at 42 FRSs over a 20-year period, detailed data about fire false alarms by type was not available until the year ending 31 March 2010, and therefore there was limited data available when looking at polices which targeted malicious, good intent or AFA fire false alarms. This explanation would help explain why, for example, policies determining attendance to AFA calls were statistically significantly associated with total fire false alarms but not AFA fire false alarms.
Finally, while LMMs can be run with missing data, another explanation for lack of statistically significant results could be missing values. For example, some FRSs did not hold detailed historic records of policies dating back to the year ending March 2000, in particular about polices determining attendance to AFA calls. This meant they were not able to conclusively say whether a policy was in place. This would again lead to lack of data available for analysis to pick up on any ‘true’ relationship between policies and fire false alarm incident attendance.
As FRS policy records grow and data quality improves, there is potential for future work to repeat the analysis with more robust data.
6. Conclusion
This report has presented findings from research investigating fire false alarms. The research looked at historic trends in fire false alarms, described the policies put in place by fire and rescue services (FRSs) to reduce fire false alarms, and considered their contribution towards declines in fire false alarms.
The IRS data shows that long-term downwards trends have been largely driven by declines in fire false alarms due to apparatus, originating from automatic fire alarm (AFA) systems. However, these types of incidents still make up the largest proportion of fire false alarms, meaning there may still be scope for further sizable reductions here.
Considering type of property, the highest rates of fire false alarms are from school and education properties, offices and public properties; and the highest volume is sleeping properties. It may be useful for FRSs to consider their policies for attendance to these properties, and how they engage with property managers to educate them on fire false alarm management. The policy used will depend on local knowledge and assessment of risk.
When FRSs used policies determining attendance to AFA calls and call challenging, they attended fewer fire false alarms, when not accounting for other factors such as the presence of other policies. As such, there is reasonable evidence that these policies do what they are intended to do. Education, initiatives and policies targeting specific types of fire false alarms did not have statistically significant relationship with fire false alarms. However, large variations existed across FRSs in how the number of fire false alarms attended differed as policies differed, demonstrating how local characteristics can impact fire false alarm incident attendance, and potentially policy application.
Lack of statistical significance may in part be due to the relatively small number of cases available for analysis, and the variation that exists within how FRSs operationalise different policies. For example, some services might have a policy, but not use it, or two services that have the same policy might apply them in very different ways. Differences in how FRSs operationalise policies might also help explain variation in the numbers and rates of fire false alarm incidents across FRSs, despite most services currently having one of the four broad policy types in place.
When deciding how to reduce fire false alarms, FRSs should: make best use of National Fire Chiefs Council (NFCC) guidance; learn from FRSs who have successfully reduced fire false alarm attendance; and review, revise and test alternative approaches to policies within their local context. Ongoing work by NFCC to develop ‘good practice’ will help to address which policies FRSs should use, and how they can use them most effectively and consistently.
These findings should be useful for FRSs to consider when evaluating existing policies targeting fire false alarms, or when deciding whether and how to introduce policies in the future.
Appendix A. Fire and rescue services which answered the survey
| Fire and rescue service | Rural or urban [*] | Fire and rescue service | Rural or urban [*] |
|---|---|---|---|
| Avon | Urban | Humberside | Significantly rural |
| Bedfordshire | Significantly rural | Kent | Significantly rural |
| Berkshire | Urban | Lancashire | Urban |
| Buckinghamshire | Significantly rural | Leicestershire | Significantly rural |
| Cambridgeshire | Predominantly rural | Lincolnshire | Predominantly rural |
| Cheshire | Significantly rural | Merseyside | Urban |
| Cleveland | Urban | Norfolk | Predominantly rural |
| Cornwall | Predominantly rural | North Yorkshire | Predominantly rural |
| Cumbria | Predominantly rural | Northumberland | Predominantly rural |
| Derbyshire | Significantly rural | Nottinghamshire | Urban |
| Devon and Somerset | Predominantly rural | Oxfordshire | Predominantly rural |
| Dorset and Wiltshire | Significantly rural | Shropshire | Predominantly rural |
| Durham and Darlington | Predominantly rural | South Yorkshire | Urban |
| East Sussex | Significantly rural | Staffordshire | Significantly rural |
| Essex | Significantly rural | Suffolk | Predominantly rural |
| Gloucestershire | Significantly rural | Surrey | Urban |
| Greater London | Urban | Tyne and Wear | Urban |
| Greater Manchester | Urban | Warwickshire | Significantly rural |
| Hampshire | Urban | West Midlands | Urban |
| Hereford and Worcester | Significantly rural | West Sussex | Significantly rural |
[*] As defined by the Department for Environment, Food and Rural Affair Classification Documents.
Appendix B. Fire false alarm policy survey
Overall, the survey asked questions on:
FRSs’ engagement with ARCs: for example, ‘Have you ever given alarm receiving centres (excluding telecare centres) a direct (non-999) number to report automatic fire alarms (AFAs) to your fire and rescue service?’
Policies determining attendance to AFA calls: by type of building (for example care homes and offices) and type of response (confirmation of fire required, adapted response, no confirmation of fire required) where FRSs could select multiple responses per property type.
Call challenging procedures: for example, ‘Are you aware we may give the police your telephone number if this is not a genuine call?’
Education and initiatives: for example, ‘Does your FRS currently, or has it previously, provided any information/materials aiming to educate users of AFAs about fire false alarms?’
B.1 The full survey
Some questions were only asked following a specific answer to the previous question.
1. Relationship with alarm receiving centres
1.1 Does your FRS have agreements with and/or produce guidance for alarm receiving centres regarding their standards/procedures?’
(If 1.1 = yes)
1.2 ‘In which (financial) year did you establish these agreements with, or guidance for, alarm receiving centres regarding their procedures/standards?’
1.3 ‘Has the nature of the agreements with, or guidance for, alarm receiving centres changed since being established?’
1.4 ‘Have you ever given alarm receiving centres (excluding telecare centres) a direct (non-999) number to report automatic fire alarms to your fire and rescue service?’
1.5 ‘Does your FRS encourage premises using automatic fire alarm systems to choose alarm receiving centres (excluding telecare centres) you trust (those with whom you have an agreement, those known to follow your guidance, or those known to you for producing relatively few unwanted fire signals)?’
1.6a ‘How does your FRS treat automatic fire alarm calls from alarm receiving centres (excluding telecare centres) you trust (those with whom you have an agreement, those known to follow your guidance, or those known to you for producing relatively few unwanted fire signals)?’
1.6b ‘How does your FRS treat automatic fire alarm calls from alarm receiving centres (excluding telecare centres) with whom you do not have an agreement, those not known to follow your guidance, or those not known to you for producing relatively few unwanted fire signals?’
(If 1.1 = no)
1.6 ‘How does your FRS treat automatic fire alarm calls from alarm receiving centres (excluding telecare centres)?’
2. Attendance to automatic fire alarm calls
2.1 ‘Does your FRS currently implement policies which effect attendance to automatic fire alarm calls, depending on the type of building the call originates from?’
(If 2.1 = yes)
2.2 ‘From which (financial) year did you implement your current policy?’
2.3 ‘For each building type, please indicate how you respond to an automatic fire alarm call received from that building. Please select at least one option for each building type.’
Call to 999 and/or double knock required; adapted response; full response.
Dwellings; sleeping risk; care homes with sleeping risk; schools; heritage sites; places of worship/religious buildings; high risk sites; office buildings; commercial buildings; public buildings; licensed premises; industrial premises; when building type is unknown.
2.4 ‘Prior to your current policy, had you ever implemented policies effecting attendance to automatic fire alarm calls, depending on the type of premises the call originates from?’
2.5 ‘Have you ever implemented policies effecting attendance to automatic fire alarm calls, depending on the type of premises the call originates from?’
(If 2.5 = yes)
2.6 ‘Do you have information about any of your previous policies readily available?’
(If 2.6 = yes)
2.7 ‘From which (financial) year did you implement this policy?’
2.8 ‘To which (financial) year did you implement this policy?’
2.9 ‘For each building type, please indicate how you respond to an automatic fire alarm call received from that building. Please select at least one option for each building type.’
Call to 999 and/or double knock required; adapted response; full response.
Dwellings; sleeping risk; care homes with sleeping risk; schools; heritage sites; places of worship/religious buildings; high risk sites; office buildings; commercial buildings; public buildings; licensed premises; industrial premises; when building type is unknown.
2.10 ‘Was this the first Automatic Fire Alarm Attendance policy you implemented?’
2.11 ‘Do you have information about any of your previous policies readily available?’
(If 2.10 and 2.11 = yes, questions 2.7 – 2.11 repeated)
3. Call challenging
3. ‘Does your FRS currently, or has it previously, implemented call challenging to identify good intention fire false alarm calls?’
(If 3.1 = yes)
3.1a ‘In which (financial) year was this policy first implemented?’
3.1b ‘Has the implementation of this policy changed over time?’
3.1c ‘Please indicate the years in which this policy was, and was not, implemented.’
3.2 ‘Does your FRS currently, or has it previously, implemented call challenging to identify fire false alarm calls from premises with automatic fire alarms installed (excluding calls directly from alarm receiving centres)?’
(If 3.2 = yes)
3.2a ‘In which (financial) year was this policy first implemented?’
3.2b ‘Has the implementation of this policy changed over time?’
3.2c ‘Please indicate the years in which this policy was, and was not, implemented.’
3.3 ‘Does your FRS currently, or has it previously, implemented call challenging to identify malicious/hoax fire false alarm calls?’
(If 3.3 = yes)
3.3a ‘In which (financial) year was this policy first implemented?’
3.3b ‘Has the implementation of this policy changed over time?’
3.3c ‘Please indicate the years in which this policy was, and was not, implemented.’
4. Education/initiatives – automatic fire alarm, fire false alarms
4.1 ‘Does your FRS currently, or has it previously, provided any information/materials aiming to educate users of automatic fire alarms about fire false alarms?’
(If 4.1 = yes)
4.1a ‘Has your fire and rescue service found evidence of any impact of these activities? If yes, please explain.’
4.1b ‘In which (financial) year was this policy first implemented?’
4.1c ‘Has the implementation of this policy changed over time?’
4.1d ‘Please indicate the years in which this policy was, and was not, implemented.’
4.2 ‘Does your FRS currently undertake, or has it previously undertaken, face-to-face sessions with automatic fire alarm users to offer advice about reducing fire false alarms?’
(If 4.2 = yes)
4.2a ‘Has your fire and rescue service found any of these activities particularly impactful?’
4.2b ‘In which (financial) year was this policy first implemented?’
4.2c ‘Has the implementation of this policy changed over time?’
4.2d ‘Please indicate the years in which this policy was, and was not, implemented.’
4.3 ‘Does your FRS currently, or has it previously imposed monetary fines, including cost recovery, on premises responsible for fire false alarms resulting from automatic fire alarms?’
(If 4.3 = yes)
4.3a ‘In which (financial) year was this policy first implemented?’
4.3b ‘Has the implementation of this policy changed over time?’
4.3c ‘Please indicate the years in which this policy was, and was not, implemented.’
4.4 ‘Does your FRS currently implement, or has it previously implemented, a ‘strike’ policy, whereby multiple fire false alarm incidents would result in suspending attendance to unconfirmed automatic fire alarm calls generated by that premises?’
(If 4.4 = yes)
4.4a ‘In which (financial) year was this policy first implemented?’
4.4b ‘Has the implementation of this policy changed over time?’
4.4c ‘Please indicate the years in which this policy was, and was not, implemented.’
4.5 ‘Does your FRS currently, or has it previously, implemented any policies which imposed law enforcement action against premises responsible for multiple fire false alarms resulting from automatic fire alarms?’
(If 4.5 = yes)
4.5a ‘In which (financial) year was this policy first implemented?’
4.5b ‘Has the implementation of this policy changed over time?’
4.5c ‘Please indicate the years in which this policy was, and was not, implemented.’
5. Education/initiatives – Malicious and good intent fire false alarms
5.1 ‘Does your FRS currently, or has it previously, provided any information/materials aiming to educate the public about good intention call fire false alarms?’
(If 5.1 = yes)
5.1a ‘In which (financial) year was this policy first implemented?’
5.1b ‘Has the implementation of this policy changed over time?’
5.1c ‘Please indicate the years in which this policy was, and was not, implemented.’
5.2 ‘Does your FRS currently, or has it previously, provided any information/materials aiming to educate the public about malicious and hoax call fire false alarms?’
(If 5.2 = yes)
5.2a ‘In which (financial) year was this policy first implemented?’
5.2b ‘Has the implementation of this policy changed over time?’
5.2c ‘Please indicate the years in which this policy was, and was not, implemented.’
5.3 ‘Does your FRS currently, or has it previously, provided any information/materials aiming to educate individuals caught making malicious or hoax calls?’
(If 5.3 = yes)
5.3a ‘In which (financial) year was this policy first implemented?’
5.3b ‘Has the implementation of this policy changed over time?’
5.3c ‘Please indicate the years in which this policy was, and was not, implemented.’
5.4 ‘Does your FRS, or has it previously, implemented a ‘strike’ policy, whereby multiple fire false alarm incidents would result in suspending attendance to the source of the malicious/hoax call?’
(If 5.4 = yes)
5.4a ‘In which (financial) year was this policy first implemented?’
5.4b ‘Has the implementation of this policy changed over time?’
5.4c ‘Please indicate the years in which this policy was, and was not, implemented.’
5.5 ‘Does your FRS currently, or has it previously, implemented policies punishing individuals caught making malicious or hoax fire false alarm calls?’
(If 5.5 = yes)
5.5a ‘In which (financial) year was this policy first implemented?’
5.5b ‘Has the implementation of this policy changed over time?’
5.5c ‘Please indicate the years in which this policy was, and was not, implemented.’
6. Additional questions
6.1 ‘Please explain below any unusual events which caused fluctuations in false alarms, and in which year(s) they occurred.’
6.2 ‘Did any of the following resources inform the development of any current or previous policies your fire and rescue service have implemented?’
Public consultation; Integrated Risk Management Plan; National Fire Chief’s Council guidance; Chief Fire Officers Association guidance; Legal advice; None of the above; Other (please specify).
6.3 ‘Have you received any challenges to policies you have implemented in order to reduce fire false alarm attendance? If yes, please briefly explain.’
Appendix C. Fire false alarms by property type
C.1 Categorising property types
Three different categorisations of property types were required for this research:
- for fire false alarm incidents by property type from the IRS data
- for Ordnance Survey® (OS®) counts, to calculate rates of fire false alarms by property type
- for the policy survey, to look at responses to AFA calls by type of response and property type
Table 10 shows how these properties are mapped onto each other.
Table 10: Categorisation of different property and location types
| Report categories (grouped) | Survey property types | Examples of IRS property types | Examples of (OS®) property types |
|---|---|---|---|
| Commercial/ licensed/public | Commercial, licensed, public | Art gallery, cinema, night club, hairdresser, gym, museum, police station | Animal/bird/marine sanctuary, library, public house/night club/bar |
| Dwelling/care home/other sleeping | Dwelling, care home, other sleeping | Hostel, hospital, bungalow, caravan, retirement home | Houses of multiple occupancy, sheltered accommodation, prison |
| High risk/ industrial | High risk, industrial | Factory, petrol station, warehouse, gas works, oil refinery, farming sheds | Aircraft works, brewery, chemical works, flour mill, oil refining, distillery |
| Offices | Offices | Law courts, purpose-built office, health centre, call centre, dentist | Film studio, job centre, law court, dentist, general practice surgery/clinic |
| School/education | Schools and other education buildings | College/university, secondary school, preschool/nursery | Secondary school, higher education, infant school, junior school, college |
| Places of worship | Places of worship | Mosque, church/chapel, synagogue, cathedral, temple | Abbey, cathedral, church, chapel, mosque, gurdwara, stupa, temple |
| Heritage buildings | Heritage buildings | National Trust stately home, castle, heritage centre | Not included in rates |
C.1.1 Property types in the survey
Survey property types were used to get an idea of the number of properties being sent different response types. Property categories listed in the survey were based on those frequently mentioned in online resources, such as FRS websites, when discussing their pre-determined attendance to AFA calls. These categories were then agreed with the relevant NFCC leads. It is important to remember there might still be differences in how FRSs categorise or interpret property types. For example, a doctor’s surgery may be considered an office by one FRS but a public property by another. As a result, analyses looked not at how attendance to fire false alarms varied by specific property types, but by how many different categories each response type was sent to.
C.1.2 Property types in analysis and the report
For consistency across the research report, IRS and Ordnance Survey® (OS®) property categories were matched to those used in the survey. This included re-categorising fire false alarm data from the IRS, where property type was listed as ‘other’, using the free text comments.
C.1.2.1 Ordnance Survey®
To calculate the building numbers the following data from OS® was used. Topographic Identifiers (TOID®) from AddressBase® Premium (which are used to reference all mappable features) were linked with Building Heights Attribute and AddressBase® Premium classifications to calculate the number of buildings for these property types there were in England in the year ending 31 March 2018. It is important to note:
- around 10% of buildings are likely to be misrepresented in the OS® data due to outdated classifications or complex building structures requiring multiple TOID® references
- some buildings may be counted in multiple categories due to mixed commercial and domestic use properties; for example, a newsagent on the ground floor of an apartment block, so it is not possible to sum the categories
- vehicles, outdoor structures (such as statues) and ‘unknown’ categories in the IRS and AddressBase® have been excluded for this analysis
Appendix D. Detailed analyses
D.1 Incident data
Data cuts were taken using data from the IRS dating from years ending March 31 2010, when the online IRS was introduced, to 2018, the latest complete year of data that was available when analyses began. Historic data from years ending March 2000 to 2009 were taken from published Home Office data tables.
D.2 Survey data
FRSs’ responses to the survey were sense checked and if necessary, follow-up questions were sent out and survey answers adjusted. All survey responses and fire false alarm data were combined into a single database. For each FRS, 19 years of data were recorded, covering years ending 31 March 2000 to 2018. This provided the basis for the analysis of the effect of FRS policies on fire false alarm attendance. When information about a policy was unknown, it was coded as ‘NA’ in the data set for that particular year.
Of the FRSs that provided data, 13 were classified as being ‘predominantly rural’, 16 as ‘significantly rural’ and 15 as ‘urban’, as defined by the Department for Environment, Food and Rural Affairs (DEFRA).
D.3 Model selection
Mixed models are useful in analysing data sets which contain longitudinal data or which contain missing values. The fire false alarm and policy data was longitudinal, dating from years ending 31 March 2000 to 2018, and contained missing values where FRSs did not have information on their policies readily available. The data set also contained multiple data points from each FRS, making it repeatedly measured. Mixed models are frequently used for repeated measure data sets, as the analysis accounts for there being more similarity between data points from the same respondents as different respondents. Therefore, it was decided a LMM was the most appropriate method of analysing the data. When running a mixed model, variables are divided into fixed effects, control variables, random effects and the observed outcome variable.
Fixed effects: can be thought of as the predictor or independent variables. These are the variables thought to be predicting the outcome variable – for example, the policy in place.
Control variables: are thought to influence the outcome variable, but the effect is not of particular interest. These variables are run as fixed effects in the model in order for their influence to be controlled for in the analysis – for example, FRS type.
Random effects: those effects which will cause random variability across the sample. Often these are group or individual effects – for example, FRS ID.
Outcome variable: can be thought of as the dependent variable. This is the observed outcome, thought to be predicted by the fixed effects – for example, number of fire false alarms attended.
D.4 Suitability of the model
Linear mixed models (LMMs) make the assumption that residual errors (the difference between the predicted and observed values) are normally distributed. To test if the residual errors of the data set were normally distributed, quantile-quantile (Q-Q) plots were created in R. These plots predicted against actual values – if they show a linear relationship, there can be more certainty that the assumptions of the model will not be violated.
Q-Q plots from models with fire false alarms, AFA fire false alarms and vehicles sent to fire false alarms, show positive correlations between the increase of sample quartiles and theoretical quartiles.
The plots were then compared to examples of normally distributed Q-Q plots and decided to show an acceptable level of normal distribution. Most data fell along the linear relationship line, with the data showing both left and heavy right tails. To account for this, it was noted in the main report than findings are likely to not apply to the most ‘extreme’ cases of fire false alarm attendance. That is, those FRSs who attend an unusually high or low number of fire false alarms.
Besides Q-Q plots, a ‘1.96 standard deviation test’ was carried out on the data set. This test says that, in a normal distribution, when you find the average and standard deviation of the data, 95% of the data should fall in the average +/-1.96 standard deviations. This test was performed using both the mean as an average, and the mode. The mean revealed 98% of data fell within this range, and the mode revealed 94% of data fell within this range. Overall, this was deemed to be close enough to normal distribution for the model to be run.
D.5 Model analysis
Multiple models were run to address all research questions. Fixed effects and outcome variables included in each model depended on the question being addressed, although the outcome variable was always either fire false alarms attended (total or by type) or vehicles sent to fire false alarms. Missing values were inputted as ‘NA’ which is recognised by R as meaning data not available. Time was not included as a fixed effect. The years in which data were recorded and included in analyses were consistent across all FRSs, meaning there was no need for time to be added as a control.
D.5.1 Policies as fixed effects
Models were run with policies as ‘fixed effects’ and were either categorical or continuous, as shown in Table 11 and Table 12 below.
Table 11: Categorical fixed effects
| Fixed effect | Categories |
|---|---|
| FRS rural/urban classification | Urban, Significantly rural, Predominantly rural |
| A policy determining attendance to AFA incidents was in place | Yes, No |
| A call challenging policy was in place | Yes, No |
| A call challenging policy targeting malicious calls was in place | Yes, No |
| A call challenging policy targeting AFA calls was in place | Yes, No |
| A call challenging policy targeting good intent calls was in place | Yes, No |
| Education and initiatives were in place | Yes, No |
| Education and initiatives targeting malicious incidents were in place | Yes, No |
| Education and initiatives targeting AFA incidents were in place | Yes, No |
| Education and initiatives targeting good intent incidents were in place | Yes, No |
Table 12: Continuous fixed effect
| Fixed effect | Levels |
|
Adapted response (‘For every additional property type where an adapted response is sent.’) |
1 to 13 Where the number represents the total number of property types that FRS will, at some time during the day, send an adapted response following an AFA call. |
|
No confirmation of fire required (‘For every additional property type where no confirmation of fire is required.’) |
1 to 13 Where the number represents the total number of property types that FRS will, at some time during the day, send a response without confirmation of fire following an AFA call. |
|
Confirmation of fire required (‘For every additional property type where confirmation of fire is required.’) |
1 to 13 Where the number represents the total number of property types that FRS will, at some time during the day, only send a response with confirmation of fire following an AFA call. |
D.5.2 Choosing the outcome variable
When a policy could only influence vehicles sent to incidents through its effect on incident attendance, only incident attendance was looked at. When a policy could influence vehicle attendance but not incident attendance, only vehicle attendance was looked at. For example, the only way in which education and initiatives can influence vehicle attendance is by reducing incident attendance, and so when analysing education and initiatives, only incidents were looked at. Whereas policies determining attendance to AFA calls can both directly influence vehicles through reduced attendance, and incidents through requiring confirmation of fire. When analysing policies determining attendance to AFA calls, both incidents and vehicles were looked at.
D.5.2.1 Types of fire false alarm incidents
Home Office published statistics include the category of ‘apparatus’ fire false alarms, and do not distinguish between automatic and non-AFA calls. For the policy analysis, the apparatus category was removed, and a distinction was made between automatic and non-AFA calls. This was important when considering certain policy types. When analysing the effect of a policy on a specific type of fire false alarm, fire false alarms were divided into:
- AFA, fire false alarms
- malicious (non-AFA) fire false alarms
- good intent (non-AFA) fire false alarms
The sum of these three categories equated to the total number of fire false alarms attended.
D.5.3 Control variables
All models included FRS as a random effect, and rural/urban classification as a control fixed effect, to account for any variance these effects might cause which the model might otherwise assume is due to the fixed effects. Models also included other policies as factors to account for any effect they may have on the outcome variable, regardless of whether those policy types were designed to influence that specific outcome variable or not. This means the outputs of the models give a conservative estimate of the ‘main’ factor’s effect on the outcome variable. All analyses included each FRS’s rural/urban classification (as defined by DEFRA) as a variable, to help control for the influence that population density might have on fire false alarm analysis.
D.5.4 Mapping fire false alarm attendance onto policies
Two sets of analyses were run, one where the outcome variables were observed in the same year as FRS policies (the fixed effects) and one where the outcome variables were observed the year following FRS policies. This was to account for policies were new that year and whether they would influence fire false alarm attendance that year depended on how late on in the year the policy was introduced. Results were similar, and so only the results from the same year analyses have been reported in the main report.
D.5.5 Follow-up analysis
A final model which merged FRSs with the same combination of policies in place, for each year, was run to see if variation in fire false alarm attendance across FRSs was in part responsible for a lack of statistical significance across the policy types. The model revealed that removing FRS variation by combining data did not increase statistical significance, and therefore it is not FRS variation causing results to not reach statistical significance.
Appendix E. Fire false alarm data tables
The data in these tables are consistent with data received in the IRS by August 2018. There may be some small discrepancies between data shown here and data published in quarterly statistics. This is because quarterly statistics are constantly being updated, and also due to data collected for some FRSs in year ending 31 March 2010 having known issues, due to this being the year the online IRS was introduced.
E.1 Fire false alarms by type table
Table 13 shows the number of fire false alarms attended by FRSs in England for each year, by reason for fire false alarm, from years ending March 2000 to 2018. It uses both historic data from years ending March 2000 to 2009, and data from the online IRS from year ending March 2010 onwards. Table 14 shows the number of fire false alarms attended by origin of call from the year ending March 2010, when more detailed data on fire false alarms first became available with the introduction of the online IRS, to year ending March 2018. Finally, Table 15 shows the number of fire false alarms attended by reason for fire false alarm, and origin of call, for years ending March 2000 to 2018.
Table 13: Fire false alarms by reason, England, years ending 31 March 2000 to 2018
| Year ending 31 March | Fire false alarms due to apparatus | Good intent fire false alarms | Malicious fire false alarms | Total fire false alarms |
|---|---|---|---|---|
| 2000 | 212,631 | 109,101 | 66,486 | 388,218 |
| 2001 | 222,799 | 98,493 | 57,709 | 379,001 |
| 2002 | 232,044 | 102,955 | 58,853 | 393,852 |
| 2003 | 223,316 | 101,538 | 50,499 | 375,353 |
| 2004 | 232,650 | 105,029 | 46,403 | 384,082 |
| 2005 | 233,922 | 90,822 | 26,253 | 360,997 |
| 2006 | 230,104 | 91,816 | 28,686 | 350,606 |
| 2007 | 231,387 | 95,473 | 25,276 | 352,136 |
| 2008 | 215,224 | 94,898 | 21,356 | 331,478 |
| 2009 | 207,454 | 88,470 | 16,990 | 312,914 |
| 2010 | 189,347 | 76,369 | 12,132 | 277,848 |
| 2011 | 185,531 | 75,792 | 10,853 | 272,176 |
| 2012 | 167,550 | 72,314 | 9,617 | 224,117 |
| 2013 | 158,659 | 64,308 | 8,800 | 231,767 |
| 2014 | 149,113 | 67,388 | 7,616 | 224,117 |
| 2015 | 143,709 | 65,332 | 6,812 | 215,853 |
| 2016 | 142,417 | 65,013 | 6,943 | 214,373 |
| 2017 | 151,690 | 65,252 | 6,954 | 223,896 |
| 2018 | 151,487 | 66,881 | 7,257 | 225,625 |
Table 14: Fire false alarms by origin of call, England, years ending 31 March 2010 to 2018
| Year ending 31 March | AFA, fire false alarms | Non-AFA, fire false alarms | Total fire false alarms |
|---|---|---|---|
| 2010 | 175,595 | 102,253 | 277,848 |
| 2011 | 172,287 | 99,889 | 272,176 |
| 2012 | 152,891 | 96,590 | 249,481 |
| 2013 | 143,378 | 88,389 | 231,767 |
| 2014 | 136,445 | 97,672 | 224,117 |
| 2015 | 130,646 | 85,207 | 215,853 |
| 2016 | 128,598 | 85,775 | 214,373 |
| 2017 | 149,794 | 74,102 | 223,896 |
| 2018 | 135,520 | 90,105 | 225,625 |
Table 15: Fire false alarms by reason and origin of call, England, years ending 31 March 2010 to 2018
| Year ending 31 March | AFA fire false alarms | Non-AFA fire false alarms | ||||
|---|---|---|---|---|---|---|
| Apparatus | Good intent | Malicious | Apparatus | Good intent | Malicious | |
| 2010 | 158,404 | 13,935 | 3,256 | 30,943 | 62,434 | 8,876 |
| 2011 | 155,051 | 14,321 | 2,915 | 30,480 | 61,471 | 7,938 |
| 2012 | 155,791 | 11,701 | 2,399 | 28,759 | 60,613 | 7,218 |
| 2013 | 130,109 | 9,934 | 3,335 | 28,550 | 54,374 | 5,465 |
| 2014 | 123,160 | 10,274 | 3,011 | 25,953 | 57,114 | 4,605 |
| 2015 | 117,586 | 10,401 | 2,659 | 26,123 | 54,931 | 4,153 |
| 2016 | 115,382 | 10,421 | 2,795 | 27,035 | 54,592 | 4,148 |
| 2017 | 136,404 | 10,362 | 3,028 | 15,286 | 54,890 | 3,926 |
| 2018 | 122,580 | 9,863 | 3,077 | 28,907 | 57,018 | 4,180 |
E.2 Time spent at fire false alarms table
Time spent at incidents was calculated by subtracting the time the first vehicle mobilised to attend a fire false alarm incident, from the time the last vehicle left the fire false alarm incident. Only fire false alarm incidents where time spent attending was between one minute and one hour were included in these analyses, to avoid erroneous data or exceptional incidents from skewing the averages. This is because these are likely, in the main, to be erroneous. One example could be incidents that occur across a clock change between Greenwich Mean Time and British Summer Time.
Table 16: Time spent at fire false alarms, England, years ending 31 March 2010 to 2018
| Year ending 31 March | Total time spent at fire false alarms incidents* | Number of fire false alarm incidents included in analysis | Median time spent at fire false alarms |
|---|---|---|---|
| 2010 | 72,155 hours | 254,319 | 14 minutes, 38 seconds |
| 2011 | 70,134 hours | 251,430 | 13 minutes, 24 seconds |
| 2012 | 63,464 hours | 229,534 | 13 minutes, 12 seconds |
| 2013 | 60,278 hours | 211,902 | 13 minutes, 40 seconds |
| 2014 | 58,347 hours | 203,717 | 13 minutes, 41 seconds |
| 2015 | 59,229 hours | 192,551 | 15 minutes, 4 seconds |
| 2016 | 60,060 hours | 194,938 | 15 minutes, 10 seconds |
| 2017 | 62,875 hours | 207,179 | 14 minutes, 58 seconds |
| 2018 | 63,271 hours | 209,254 | 14 minutes, 55 seconds |
| * Rounded to the nearest hour |
E.3 Vehicles sent to fire false alarms table
The data in Table 17 shows the total number of vehicles sent to fire false alarms since data became available in the year ending March 2010 until 2018.
Table 17: Vehicles sent to fire false alarms, England, years ending 31 March 2010 to 2018
| Year ending 31 March | Total number of fire false alarm incidents | Total vehicles sent to fire false alarms | Average number of vehicles per fire false incident | Vehicles per 100 fire false alarm incidents |
|---|---|---|---|---|
| 2010 | 277,848 | 426,950 | 1.54 | 154 |
| 2011 | 272,176 | 412,718 | 1.52 | 152 |
| 2012 | 249,481 | 372,946 | 1.49 | 149 |
| 2013 | 231,767 | 345,922 | 1.49 | 149 |
| 2014 | 224,117 | 326,921 | 1.46 | 146 |
| 2015 | 215,853 | 310,453 | 1.44 | 144 |
| 2016 | 214,373 | 312,053 | 1.46 | 146 |
| 2017 | 223,896 | 325,991 | 1.46 | 146 |
| 2018 | 225,625 | 331,646 | 1.47 | 147 |
E.4 Fire false alarms, and rates of fire false alarms by property types
Table 18 to Table 20 show fire false alarms by property type, using IRS data re-categorised to broadly match the categories included in the survey. Table 21 shows the number of each property type in England, using ordnance data re-categorised to broadly match the categories included in the survey. Finally, Table 22 to Table 24 show rates of fire false alarms by property type, using IRS data and OS® data re-categorised to broadly match the categories included in the survey. All tables show data from years ending March 2013, when good quality OS® data became available, to 2018. Some property types are included in Table 18 to Table 20 but not in Table 22 to Table 24 – this is due to some survey categories (such as heritage sites) not being an OS® category. Thus, these have been excluded from calculating rates.
E.4.1 Fire false alarms by property type
Table 18: Total fire false alarms by property type, England, years ending 31 March 2013 to 2018
| Property type |
YE 2013 | YE 2014 | YE 2015 | YE 2016 | YE 2017 | YE 2018 |
|---|---|---|---|---|---|---|
| Commercial/ licensed/public |
28,766 | 26,468 | 24,595 | 26,269 | 25,520 | |
| Dwelling/care home/sleeping | 130,198 | 124,878 | 122,515 | 123,824 | 128,939 | 132,673 |
| Empty/derelict/ construction |
254 | 258 | 237 | 209 | 257 | 266 |
| Heritage | 120 | 114 | 142 | 102 | 90 | 80 |
| High risk/industrial | 12,363 | 11,003 | 10,372 | 9,808 | 10,472 | 10,032 |
| Office | 15,418 | 14,263 | 13,200 | 12,675 | 12,981 | 12,432 |
| Other | 1,412 | 1,290 | 1,216 | 1,213 | 1,224 | 1,264 |
| Outdoors | 23,194 | 26,613 | 24,855 | 23,921 | 24,418 | 24,682 |
| School | 12,241 | 11,632 | 10,932 | 10,539 | 11,385 | 11,130 |
| Transport | 7,168 | 7,021 | 6,949 | 6,928 | 7,284 | 6,906 |
| Places of worship | 633 | 577 | 589 | 559 | 577 | 632 |
Table 19: AFA, fire false alarms by property type, England, years ending 31 March 2013 to 2018
| Property type | YE 2013 | YE 2014 | YE 2015 | YE 2016 | YE 2017 | YE 2018 |
|---|---|---|---|---|---|---|
| Commercial/ licensed/public |
24, 776 | 22,943 | 21,392 | 21,058 | 22,837 | 21,876 |
| Dwelling/care home/sleeping | 80,262 | 77,963 | 76,199 | 75,988 | 93,228 | 81,572 |
| Empty/derelict/ construction |
167 | 164 | 140 | 132 | 167 | 164 |
| Heritage | 113 | 112 | 142 | 102 | 87 | 85 |
| High risk/industrial | 11,204 | 9,950 | 9,307 | 8,756 | 9,393 | 8,875 |
| Office | 14,157 | 13,154 | 12,094 | 11,489 | 12,065 | 11,187 |
| Other | 615 | 617 | 570 | 611 | 661 | 687 |
| Outdoors | 135 | 136 | 117 | 136 | 139 | 146 |
| School | 11,483 | 10,942 | 10,231 | 9,886 | 10,766 | 10,441 |
| Transport | 41 | 30 | 30 | 29 | 27 | 28 |
| Places of worship | 425 | 434 | 424 | 411 | 424 | 459 |
Table 20: Non-AFA, fire false alarms by property type, England, years ending 31 March 2013 to 2018
| Property type | YE 2013 | YE 2014 | YE 2015 | YE 2016 | YE 2017 | YE 2018 |
|---|---|---|---|---|---|---|
| Commercial/ licensed/public |
3,990 | 3,525 | 3,454 | 3,537 | 3,432 | 3,644 |
| Dwelling/care home/sleeping | 49,936 | 46,915 | 46,316 | 47,836 | 35,711 | 51,101 |
| Empty/derelict/ construction |
87 | 94 | 97 | 77 | 90 | 102 |
| Heritage | 7 | 2 | - | - | 3 | 3 |
| High risk/industrial | 1,159 | 1,053 | 1,065 | 1,052 | 1,079 | 1,157 |
| Office | 1,261 | 1,109 | 1,106 | 1,186 | 916 | 1,245 |
| Other | 797 | 673 | 646 | 602 | 563 | 577 |
| Outdoors | 23,059 | 26,477 | 24,738 | 23,785 | 24,279 | 24,536 |
| School | 758 | 690 | 701 | 653 | 619 | 689 |
| Transport | 7,127 | 6,991 | 6,919 | 6,899 | 7,257 | 6,878 |
| Places of worship | 208 | 143 | 165 | 148 | 153 | 173 |
E.4.2 Ordnance Survey® property counts
Table 21: Property counts, England, years ending 31 March 2013 to 2018
| Property type | YE 2013 |
YE 2014 |
YE 2015 |
YE 2016 |
YE 2017 |
YE 2018 |
|---|---|---|---|---|---|---|
| Commercial/ licensed/public |
597,188 | 642,572 | 695,750 | 742,698 | 767,362 | 793,654 |
| Dwelling/care home/sleeping | 19,160,594 | 19,322,213 | 19,475,923 | 19,614,962 | 19,759,655 | 19,907,954 |
| High risk/industrial | 438,312 | 482,711 | 516,752 | 554,297 | 573,112 | 590,153 |
| Office | 132,501 | 145,573 | 159,778 | 173,042 | 180,520 | 188,269 |
| School | 37,042 | 39,854 | 42,723 | 45,363 | 46,785 | 47,883 |
| Places of worship | 32,116 | 33,437 | 34,638 | 35,829 | 36,642 | 37,241 |
E.4.3 Rates of fire false alarms by property type
Following tables show rates of fire false alarms per 1,000 buildings by property type, using Table 18 to Table 21. The first table shows rates for total fire false alarms, the second AFA incidents, and the third non-AFA incidents.
Table 22: Rates of total fire false alarms per 1,000 buildings by property type, England, years ending 31 March 2013 to 2018
| Property type | YE 2013 | YE 2014 | YE 2015 | YE 2016 | YE 2017 | YE 2018 |
|---|---|---|---|---|---|---|
| Commercial/ licensed/public |
48 | 41 | 36 | 33 | 34 | 32 |
| Dwelling/care home/sleeping | 7 | 6 | 6 | 6 | 7 | 7 |
| High risk/industrial | 28 | 23 | 20 | 18 | 18 | 17 |
| Office | 116 | 98 | 83 | 73 | 72 | 66 |
| School | 330 | 292 | 256 | 232 | 311 | 232 |
| Places of worship | 20 | 17 | 17 | 16 | 12 | 17 |
Table 23: Rates of AFA, fire false alarms per 1,000 buildings by property type, England, years ending 31 March 2013 to 2018
| Property type | YE 2013 | YE 2014 | YE 2015 | YE 2016 | YE 2017 | YE 2018 |
|---|---|---|---|---|---|---|
| Commercial/ licensed/public |
41 | 36 | 31 | 28 | 30 | 28 |
| Dwelling/care home/sleeping | 4 | 4 | 4 | 4 | 5 | 4 |
| High risk/industrial | 26 | 21 | 18 | 16 | 16 | 15 |
| Office | 107 | 90 | 76 | 66 | 67 | 59 |
| School | 310 | 275 | 239 | 218 | 294 | 218 |
| Places of worship | 13 | 13 | 12 | 11 | 9 | 12 |
Table 24: Rates of non-AFA, fire false alarms per 1,000 buildings by property type, England, years ending 2013 to 2018
| Property type | YE 2013 | YE 2014 | YE 2015 | YE 2016 | YE 2017 | YE 2018 |
|---|---|---|---|---|---|---|
| Commercial/ licensed/public |
7 | 5 | 5 | 5 | 4 | 5 |
| Dwelling/care home/sleeping | 3 | 2 | 2 | 2 | 2 | 3 |
| High risk/industrial | 3 | 2 | 2 | 2 | 2 | 2 |
| Office | 10 | 8 | 7 | 7 | 5 | 7 |
| School | 20 | 17 | 16 | 14 | 17 | 14 |
| Places of worship | 6 | 4 | 5 | 4 | 3 | 5 |
Appendix F. FRS fire false alarm policies
F.1 Policy types used by FRSs
The following tables show the proportion of FRSs which had each policy type in place between years ending 31 March 2000 and 2018. Table 25 presents the proportion of FRSs with policies determining attendance to AFA calls in place, Table 26 the proportion of FRSs with call challenging policies in place, and Table 27 the proportion of FRSs with education and initiatives in place. For each, the proportion of FRSs with a policy in place has been calculated using the total number of FRSs who recorded having, or not having, a policy present.
Table 25: Policies determining attendance to AFA calls, England, years ending 31 March 2000 to 2018
| Year ending March 31 | Policy present | Policy not present | Total known | % present of known |
|---|---|---|---|---|
| 2000 | 1 | 28 | 29 | 3% |
| 2001 | 1 | 28 | 29 | 3% |
| 2002 | 1 | 28 | 29 | 3% |
| 2003 | 2 | 27 | 29 | 7% |
| 2004 | 2 | 27 | 29 | 7% |
| 2005 | 4 | 25 | 29 | 14% |
| 2006 | 5 | 24 | 29 | 17% |
| 2007 | 7 | 22 | 29 | 24% |
| 2008 | 9 | 21 | 30 | 30% |
| 2009 | 11 | 20 | 31 | 35% |
| 2010 | 13 | 20 | 33 | 39% |
| 2011 | 16 | 18 | 34 | 47% |
| 2012 | 19 | 15 | 34 | 56% |
| 2013 | 25 | 11 | 36 | 69% |
| 2014 | 27 | 10 | 37 | 73% |
| 2015 | 31 | 8 | 39 | 79% |
| 2016 | 36 | 5 | 41 | 88% |
| 2017 | 38 | 3 | 41 | 93% |
| 2018 | 40 | 2 | 42 | 95% |
Table 26: Call challenging policies, England, years ending 31 March 2000 to 2018
| Year ending March 31 | Policy present | Policy not present | Total known | % present of known |
|---|---|---|---|---|
| 2000 | 3 | 30 | 33 | 9% |
| 2001 | 4 | 29 | 33 | 12% |
| 2002 | 4 | 29 | 33 | 12% |
| 2003 | 5 | 28 | 33 | 15% |
| 2004 | 8 | 25 | 33 | 24% |
| 2005 | 10 | 23 | 33 | 30% |
| 2006 | 11 | 23 | 34 | 32% |
| 2007 | 16 | 20 | 36 | 44% |
| 2008 | 18 | 18 | 36 | 50% |
| 2009 | 20 | 17 | 37 | 54% |
| 2010 | 22 | 16 | 38 | 58% |
| 2011 | 24 | 15 | 39 | 62% |
| 2012 | 28 | 12 | 40 | 70% |
| 2013 | 31 | 10 | 41 | 76% |
| 2014 | 34 | 7 | 41 | 83% |
| 2015 | 36 | 5 | 41 | 88% |
| 2016 | 38 | 3 | 41 | 93% |
| 2017 | 39 | 2 | 41 | 95% |
| 2018 | 41 | 1 | 42 | 98% |
Table 27: Education and initiatives, England, years ending 31 March 2000 to 2018
| Year ending March 31 | Policy present | Policy not present | Total known | % present of known |
|---|---|---|---|---|
| 2000 | 15 | 27 | 42 | 36% |
| 2001 | 16 | 26 | 42 | 38% |
| 2002 | 16 | 26 | 42 | 38% |
| 2003 | 19 | 23 | 42 | 45% |
| 2004 | 20 | 22 | 42 | 48% |
| 2005 | 21 | 21 | 42 | 50% |
| 2006 | 22 | 20 | 42 | 52% |
| 2007 | 28 | 14 | 42 | 67% |
| 2008 | 29 | 13 | 42 | 69% |
| 2009 | 30 | 12 | 42 | 71% |
| 2010 | 33 | 9 | 42 | 79% |
| 2011 | 33 | 9 | 42 | 79% |
| 2012 | 37 | 5 | 42 | 88% |
| 2013 | 39 | 3 | 42 | 93% |
| 2014 | 40 | 2 | 42 | 95% |
| 2015 | 40 | 2 | 42 | 95% |
| 2016 | 41 | 1 | 42 | 98% |
| 2017 | 41 | 1 | 42 | 98% |
| 2018 | 42 | 0 | 42 | 100% |
F.2 How FRSs used each policy type
Table 28 presents the number of FRSs which sent each type of response, when determining attendance to AFA calls, between years ending March 2000 to 2018. Table 29 shows which type of fire false alarms FRSs targeted using call challenging in the year ending March 2018. In the same year, Table 30 to Table 39 show the different ways FRSs reported carrying out education and initiatives.
F.2.1 Determining attendance to AFA calls
Table 28 shows the number of FRSs which used each type of responses when determining attendance to AFA calls, between the years ending March 2000 and 2018.
Table 28: How FRSs determine attendance to AFA calls
| Year ending 31 March | Total known | FRSs requiring confirmation of fire | % | FRSs sending adapted response | % | FRSs not requiring confirmation of fire | % |
|---|---|---|---|---|---|---|---|
| 2000 | 29 | 0 | 0% | 1 | 3% | 29 | 100% |
| 2001 | 29 | 0 | 0% | 1 | 3% | 29 | 100% |
| 2002 | 29 | 0 | 0% | 1 | 3% | 29 | 100% |
| 2003 | 29 | 0 | 0% | 2 | 7% | 29 | 100% |
| 2004 | 29 | 0 | 0% | 2 | 7% | 29 | 100% |
| 2005 | 29 | 0 | 0% | 4 | 14% | 29 | 100% |
| 2006 | 29 | 0 | 0% | 5 | 17% | 29 | 100% |
| 2007 | 29 | 1 | 3% | 6 | 21% | 28 | 97% |
| 2008 | 30 | 1 | 3% | 8 | 27% | 29 | 97% |
| 2009 | 31 | 2 | 6% | 10 | 32% | 30 | 97% |
| 2010 | 33 | 3 | 9% | 11 | 33% | 31 | 94% |
| 2011 | 34 | 6 | 18% | 13 | 38% | 31 | 91% |
| 2012 | 34 | 8 | 24% | 15 | 44% | 31 | 91% |
| 2013 | 36 | 10 | 28% | 20 | 56% | 32 | 89% |
| 2014 | 37 | 13 | 35% | 21 | 57% | 33 | 89% |
| 2015 | 39 | 16 | 41% | 25 | 64% | 32 | 82% |
| 2016 | 41 | 20 | 49% | 29 | 71% | 31 | 76% |
| 2017 | 41 | 23 | 56% | 30 | 73% | 31 | 76% |
| 2018 | 42 | 25 | 60% | 31 | 74% | 32 | 76% |
F.2.2 Call challenging policies
Table 29 shows the number of FRSs who have targeted each type of fire false alarm calls (good intent, AFA and malicious) using call challenging policies, between the years ending 31 March 2000 to 2018.
Table 29: How FRSs used call challenging policies
| Year ending 31 March | Good intent calls - FRSs | % | (Total known) | AFA calls - FRSs | % | (Total known) | Malicious calls - FRSs | % | (Total known) |
|---|---|---|---|---|---|---|---|---|---|
| 2000 | 1 | 3% | (33) | 0 | 0% | (34) | 3 | 9% | (32) |
| 2001 | 1 | 3% | (33) | 0 | 0% | (34) | 4 | 12% | (33) |
| 2002 | 1 | 3% | (33) | 0 | 0% | (34) | 4 | 12% | (33) |
| 2003 | 2 | 6% | (33) | 1 | 3% | (34) | 5 | 15% | (33) |
| 2004 | 2 | 6% | (33) | 2 | 6% | (34) | 8 | 24% | (33) |
| 2005 | 4 | 12% | (33) | 3 | 9% | (34) | 9 | 27% | (33) |
| 2006 | 4 | 12% | (33) | 3 | 9% | (34) | 10 | 29% | (34) |
| 2007 | 7 | 20% | (35) | 8 | 22% | (36) | 15 | 42% | (36) |
| 2008 | 11 | 31% | (35) | 12 | 33% | (36) | 15 | 42% | (36) |
| 2009 | 11 | 31% | (35) | 13 | 35% | (37) | 16 | 43% | (37) |
| 2010 | 13 | 36% | (36) | 16 | 42% | (38) | 18 | 47% | (38) |
| 2011 | 17 | 44% | (39) | 20 | 50% | (40) | 18 | 47% | (38) |
| 2012 | 20 | 50% | (40) | 24 | 59% | (41) | 21 | 54% | (39) |
| 2013 | 25 | 61% | (41) | 29 | 71% | (41) | 25 | 63% | (40) |
| 2014 | 28 | 68% | (41) | 32 | 78% | (41) | 28 | 68% | (41) |
| 2015 | 28 | 68% | (41) | 34 | 83% | (41) | 29 | 71% | (41) |
| 2016 | 32 | 78% | (41) | 35 | 85% | (41) | 31 | 76% | (41) |
| 2017 | 33 | 80% | (41) | 37 | 90% | (41) | 32 | 78% | (41) |
| 2018 | 36 | 86% | (42) | 39 | 93% | (42) | 34 | 81% | (42) |
F.2.3 Education and initiatives
Table 30 to Table 39 present the number of FRSs who took different approaches to education and initiatives, from years ending 31 March 2000 to 2018.
Table 30: Providing information/materials about AFA incidents
| Year ending 31 March | Total known | FRSs | % |
|---|---|---|---|
| 2000 | 33 | 3 | 9% |
| 2001 | 33 | 3 | 9% |
| 2002 | 33 | 3 | 9% |
| 2003 | 33 | 4 | 12% |
| 2004 | 33 | 5 | 15% |
| 2005 | 34 | 6 | 18% |
| 2006 | 34 | 8 | 24% |
| 2007 | 35 | 13 | 37% |
| 2008 | 36 | 14 | 39% |
| 2009 | 36 | 15 | 42% |
| 2010 | 38 | 17 | 45% |
| 2011 | 39 | 20 | 51% |
| 2012 | 40 | 24 | 60% |
| 2013 | 40 | 29 | 73% |
| 2014 | 40 | 33 | 83% |
| 2015 | 40 | 36 | 90% |
| 2016 | 40 | 39 | 98% |
| 2017 | 41 | 38 | 93% |
| 2018 | 41 | 39 | 93% |
Table 31: Using face-to-face sessions about AFA incidents
| Year ending 31 March | Total known | FRSs | % |
|---|---|---|---|
| 2000 | 33 | 4 | 12% |
| 2001 | 33 | 4 | 12% |
| 2002 | 33 | 4 | 12% |
| 2003 | 33 | 5 | 15% |
| 2004 | 33 | 5 | 15% |
| 2005 | 34 | 7 | 21% |
| 2006 | 24 | 8 | 24% |
| 2007 | 35 | 12 | 34% |
| 2008 | 36 | 14 | 39% |
| 2009 | 36 | 15 | 42% |
| 2010 | 38 | 16 | 42% |
| 2011 | 39 | 19 | 49% |
| 2012 | 40 | 23 | 58% |
| 2013 | 40 | 27 | 68% |
| 2014 | 40 | 30 | 75% |
| 2015 | 40 | 33 | 83% |
| 2016 | 40 | 35 | 88% |
| 2017 | 41 | 36 | 88% |
| 2018 | 42 | 36 | 86% |
Table 32: Monetary fines for frequent AFA incidents
| Year ending 31 March | Total known | FRSs | % |
|---|---|---|---|
| 2000 | 33 | 1 | 3% |
| 2001 | 33 | 1 | 3% |
| 2002 | 33 | 1 | 3% |
| 2003 | 33 | 1 | 3% |
| 2004 | 33 | 1 | 3% |
| 2005 | 34 | 1 | 3% |
| 2006 | 34 | 1 | 3% |
| 2007 | 35 | 2 | 6% |
| 2008 | 36 | 2 | 6% |
| 2009 | 36 | 2 | 6% |
| 2010 | 38 | 2 | 5% |
| 2011 | 39 | 2 | 5% |
| 2012 | 40 | 2 | 5% |
| 2013 | 40 | 2 | 5% |
| 2014 | 40 | 5 | 13% |
| 2015 | 40 | 8 | 20% |
| 2016 | 40 | 8 | 20% |
| 2017 | 41 | 8 | 20% |
| 2018 | 42 | 10 | 24% |
Table 33: Non-attendance for frequent AFA incidents
| Year ending 31 March | Total known | FRSs | % |
|---|---|---|---|
| 2000 | 33 | 1 | 3% |
| 2001 | 33 | 1 | 3% |
| 2002 | 33 | 1 | 3% |
| 2003 | 33 | 1 | 3% |
| 2004 | 33 | 1 | 3% |
| 2005 | 34 | 2 | 6% |
| 2006 | 34 | 2 | 6% |
| 2007 | 35 | 5 | 14% |
| 2008 | 26 | 6 | 17% |
| 2009 | 36 | 7 | 19% |
| 2010 | 38 | 7 | 18% |
| 2011 | 39 | 8 | 21% |
| 2012 | 40 | 9 | 23% |
| 2013 | 40 | 10 | 25% |
| 2014 | 40 | 12 | 30% |
| 2015 | 40 | 13 | 33% |
| 2016 | 40 | 12 | 33% |
| 2017 | 41 | 13 | 32% |
| 2018 | 42 | 13 | 315 |
Table 34: Law enforcement action for frequent AFA incidents
| Year ending 31 March | Total known | FRSs | % |
|---|---|---|---|
| 2000 | 33 | 0 | 0% |
| 2001 | 33 | 0 | 0% |
| 2002 | 33 | 0 | 0% |
| 2003 | 33 | 0 | 0% |
| 2004 | 33 | 0 | 0% |
| 2005 | 34 | 1 | 3% |
| 2006 | 34 | 1 | 3% |
| 2007 | 35 | 8 | 23% |
| 2008 | 36 | 9 | 25% |
| 2009 | 36 | 10 | 28% |
| 2010 | 38 | 10 | 26% |
| 2011 | 39 | 10 | 26% |
| 2012 | 40 | 10 | 25% |
| 2013 | 40 | 11 | 28% |
| 2014 | 40 | 11 | 28% |
| 2015 | 40 | 12 | 30% |
| 2016 | 40 | 12 | 30% |
| 2017 | 41 | 12 | 29% |
| 2018 | 42 | 14 | 33% |
Table 35: Providing information/materials about good intent incidents
| Year ending 31 March | Total known | FRSs | % |
|---|---|---|---|
| 2000 | 33 | 3 | 9% |
| 2001 | 33 | 3 | 9% |
| 2002 | 33 | 3 | 9% |
| 2003 | 33 | 4 | 12% |
| 2004 | 33 | 4 | 12% |
| 2005 | 33 | 4 | 12% |
| 2006 | 33 | 4 | 12% |
| 2007 | 35 | 7 | 20% |
| 2008 | 36 | 8 | 22% |
| 2009 | 36 | 9 | 25% |
| 2010 | 38 | 11 | 29% |
| 2011 | 39 | 13 | 33% |
| 2012 | 40 | 16 | 40% |
| 2013 | 40 | 17 | 43% |
| 2014 | 40 | 20 | 50% |
| 2015 | 40 | 22 | 55% |
| 2016 | 40 | 22 | 55% |
| 2017 | 41 | 24 | 59% |
| 2018 | 42 | 25 | 60% |
Table 36: Providing information/materials about malicious incidents
| Year ending 31 March | Total known | FRSs | % |
|---|---|---|---|
| 2000 | 33 | 11 | 33% |
| 2001 | 33 | 11 | 33% |
| 2002 | 33 | 13 | 39% |
| 2003 | 33 | 16 | 48% |
| 2004 | 33 | 18 | 55% |
| 2005 | 34 | 20 | 59% |
| 2006 | 34 | 21 | 62% |
| 2007 | 35 | 24 | 69% |
| 2008 | 36 | 25 | 69% |
| 2009 | 36 | 26 | 72% |
| 2010 | 38 | 29 | 76% |
| 2011 | 39 | 29 | 74% |
| 2012 | 40 | 32 | 80% |
| 2013 | 40 | 34 | 85% |
| 2014 | 40 | 35 | 88% |
| 2015 | 40 | 36 | 90% |
| 2016 | 40 | 37 | 93% |
| 2017 | 41 | 38 | 93% |
| 2018 | 42 | 39 | 93% |
Table 37: Educating those making hoax calls
| Year ending 31 March | Total known | FRSs | % |
|---|---|---|---|
| 2000 | 33 | 12 | 36% |
| 2001 | 33 | 13 | 39% |
| 2002 | 33 | 13 | 39% |
| 2003 | 33 | 15 | 45% |
| 2004 | 33 | 15 | 45% |
| 2005 | 34 | 16 | 47% |
| 2006 | 34 | 17 | 50% |
| 2007 | 35 | 22 | 63% |
| 2008 | 36 | 23 | 64% |
| 2009 | 36 | 24 | 67% |
| 2010 | 38 | 27 | 71% |
| 2011 | 39 | 27 | 69% |
| 2012 | 40 | 30 | 75% |
| 2013 | 40 | 32 | 80% |
| 2014 | 40 | 33 | 83% |
| 2015 | 40 | 34 | 85% |
| 2016 | 40 | 35 | 88% |
| 2017 | 41 | 37 | 90% |
| 2018 | 42 | 37 | 88% |
Table 38: Non-attendance for frequent malicious incidents
| Year ending 31 March | Total known | FRSs | % |
|---|---|---|---|
| 2000 | 33 | 1 | 33% |
| 2001 | 33 | 1 | 33% |
| 2002 | 33 | 1 | 33% |
| 2003 | 33 | 2 | 6% |
| 2004 | 33 | 2 | 6% |
| 2005 | 34 | 3 | 9% |
| 2006 | 34 | 3 | 9% |
| 2007 | 35 | 5 | 14% |
| 2008 | 36 | 5 | 14% |
| 2009 | 36 | 5 | 14% |
| 2010 | 38 | 6 | 16% |
| 2011 | 39 | 6 | 15% |
| 2012 | 40 | 6 | 15% |
| 2013 | 40 | 6 | 15% |
| 2014 | 40 | 8 | 20% |
| 2015 | 40 | 9 | 23% |
| 2016 | 40 | 10 | 25% |
| 2017 | 41 | 10 | 24% |
| 2018 | 42 | 10 | 24% |
Table 39: Law enforcement action for frequent malicious incidents
| Year ending 31 March | Total known | FRSs | % |
|---|---|---|---|
| 2000 | 33 | 8 | 24% |
| 2001 | 33 | 9 | 27% |
| 2002 | 33 | 9 | 27% |
| 2003 | 33 | 11 | 33% |
| 2004 | 33 | 11 | 33% |
| 2005 | 34 | 12 | 35% |
| 2006 | 34 | 14 | 41% |
| 2007 | 35 | 17 | 49% |
| 2008 | 36 | 18 | 50% |
| 2009 | 36 | 18 | 50% |
| 2010 | 38 | 18 | 47% |
| 2011 | 39 | 19 | 49% |
| 2012 | 40 | 21 | 53% |
| 2013 | 40 | 25 | 63% |
| 2014 | 40 | 25 | 63% |
| 2015 | 40 | 25 | 63% |
| 2016 | 40 | 26 | 65% |
| 2017 | 41 | 28 | 68% |
| 2018 | 42 | 28 | 67% |
F.3 How FRSs develop policies
As part of the survey, FRSs were asked which sources of information and/or processes they used when developing policies to target fire false alarms. The survey also included a question on whether FRSs received challenge when developing fire false alarm policies. Types of challenges mentioned by FRSs included queries from members of the public and concerns from affected businesses owners. Table 40 presents the number and proportion of FRSs who reported using each source when developing their fire false alarm policies, and the number and proportion of FRSs who reported receiving challenge for new fire false alarm policies.
Table 40: Sources used, and challenge received, during policy development
| Source | FRSs reported as using this source | Proportion |
|---|---|---|
| Chief Fire Officers Association Guidance | 35 | 83% |
| Integrated risk management plan | 33 | 79% |
| Public consultation | 21 | 50% |
| National Fire Chief’s Council guidance | 21 | 50% |
| Legal advice | 19 | 45% |
| Other | 7 | 17% |
| Challenge received when developing policy or when introducing a new policy | ||
| Yes | 18 | 43% |
| No | 24 | 57% |