Trend Deck 2021: Health
Published 28 June 2021

© Crown copyright 2021
This publication is licensed under the terms of the Open Government Licence v3.0 except where otherwise stated. To view this licence, visit nationalarchives.gov.uk/doc/open-government-licence/version/3 or write to the Information Policy Team, The National Archives, Kew, London TW9 4DU, or email: psi@nationalarchives.gov.uk.
Where we have identified any third party copyright information you will need to obtain permission from the copyright holders concerned.
This publication is available at https://www.gov.uk/government/publications/trend-deck-2021-health/trend-deck-2021-health
1. Improvements in overall global health
The Global Burden of Diseases, Injuries, and Risk Factors Study 2019 estimates incidence, prevalence, mortality, years of life lost (YLLs), years lived with disability (YLDs), and disability-adjusted life-years (DALYs) due to 369 diseases and injuries, in 204 countries and territories from 1990 to 2019.
Between 1990 and 2019, the number of global DALYs remained almost constant, but once the effects of population growth and ageing were removed by converting counts to age-standardised rates, there were clear improvements in overall health. Decreases in age-standardised DALY rates have accelerated over the past decade in countries at the lower end of the Socio-demographic Index (SDI) range, while improvements have started to stagnate or even reverse in countries with a higher SDI.
Global DALYs and age-standardised DALY rates, 1990 to 2019. Shaded sections indicate 95% uncertainty intervals. DALY=disability-adjusted life-year.
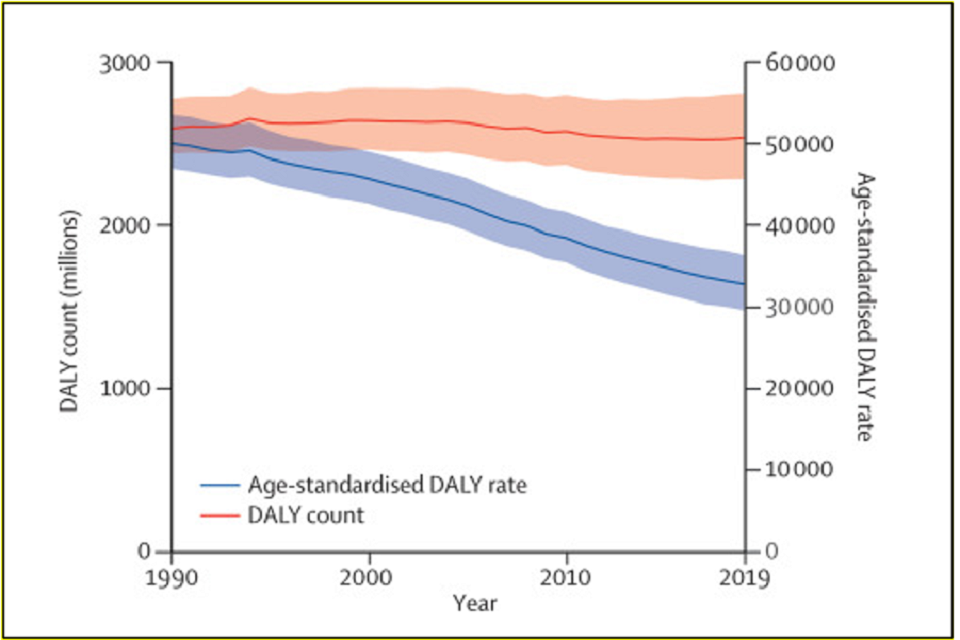
Line graph of disability adjusted life years in millions over the time period 1990 to 2019. The red line refers to the disability adjusted life years count, the blueline age-standardised disability adjusted life years rate.
Source:
- Global burden of 369 diseases and injuries in 204 countries and territories, 1990–2019: a systematic analysis for the Global Burden of Disease Study 2019. The Lancet, Oct 17, 2020 Volume 396 Number 10258 p1129-1306 Copyright © 1969, Elsevier.
2. Noncommunicable diseases cause 71% of global deaths
Noncommunicable diseases (NCDs) kill 41 million people each year, equivalent to 71% of all deaths globally. Each year, more than 15 million people die from a NCD between the ages of 30 and 69 years; 85% of these ‘premature’ deaths occur in low and middle-income countries. As populations age, total noncommunicable diseases deaths are projected to rise to 52 million in 2030.
The global prevention and treatment for NCDs have been severely disrupted by coronavirus (COVID-19). Almost two-thirds (63%) of the countries surveyed by the World Health Organization have partially or completely disrupted rehabilitation services, even though rehabilitation is key to a healthy recovery following severe illness from COVID-19.
Deaths due to noncommunicable diseases: age-standardised death rate (per 100,000 population) both sexes, 2015
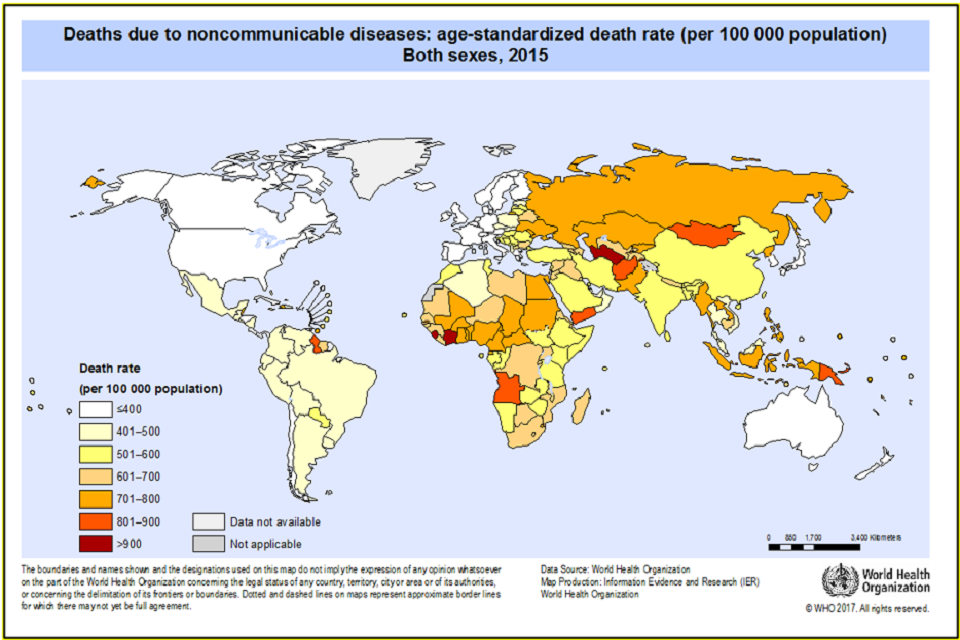
World map of death rate per 100,000 population for 2015.
Source:
- Rapid assessment of service delivery for NCDs during the COVID-19 pandemic, World Health Organization; (May 2020) Licence: CC BY-NC-SA 3.0 IGO.
- Noncommunicable diseases factsheet, World Health Organization; (2021) Licence: CC BY-NC-SA 3.0 IGO.
- Premature NCD deaths, Global Health Observatory, World Health Organization.
3. Increasing potential for personalised medicine using genomics
By combining and analysing information about our genome with other clinical and diagnostic information, patterns can be identified that can help to determine our individual risk of developing disease; detect illness earlier and determine the most effective interventions to help improve our health. New possibilities are now emerging as we bring together novel approaches, such as whole genome sequencing, data and informatics, and wearable technology. It is the interconnections between these innovations that makes it possible to move to an era of truly personalised care.
UK Biobank is a national and international resource which aims to improve the prevention, diagnosis, and treatment of a wide range of serious and life-threatening illnesses. It has 500,000 volunteer participants.
UK Biobank measurements
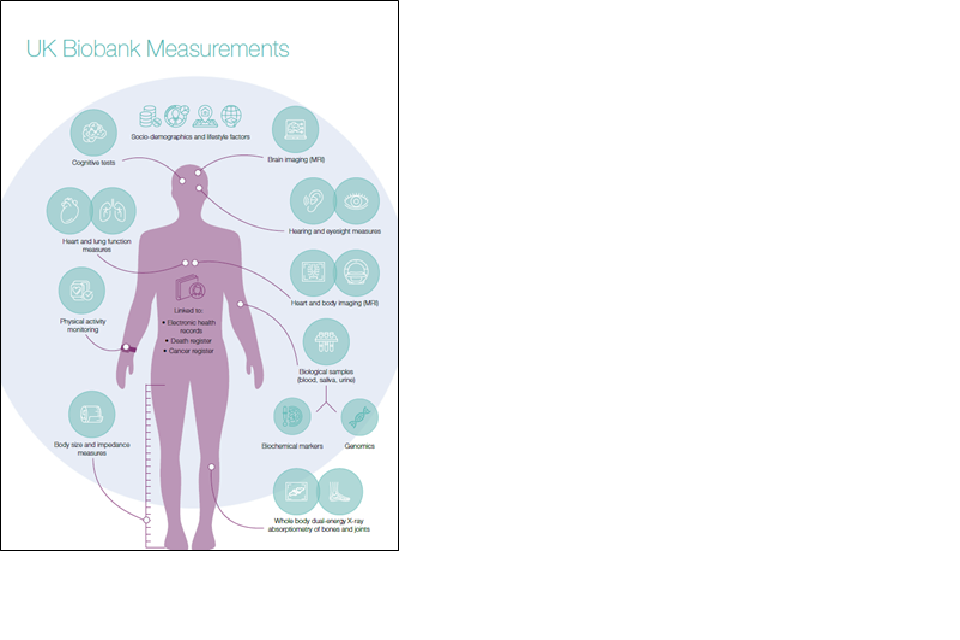
: Image of human body with linked clinical and diagnostic information, set within a pale blue circle of socio-demographics and lifestyle factors.
Sources:
- Personalised Medicine, NHS.
- Genome UK the future of healthcare, HM Government, 2020.
4. Long term drug-related hospital admissions in England have risen
The number of hospital admissions with a primary diagnosis of drug-related mental and behavioural disorders fell from 7,376 in 2018 to 2019 to 7,027 in 2019 to 2020. This has decreased by 18% from the previous highest recorded admissions in 2015 to 2016 (8,621). However, these admissions are still 21% higher than 10 years ago – in 2009 to 2010 they totalled 5,809. Drug-related hospital admissions are five times more likely in the most deprived areas.
Key facts for 2019 and 2020 which is the latest year of available data for hospital admissions
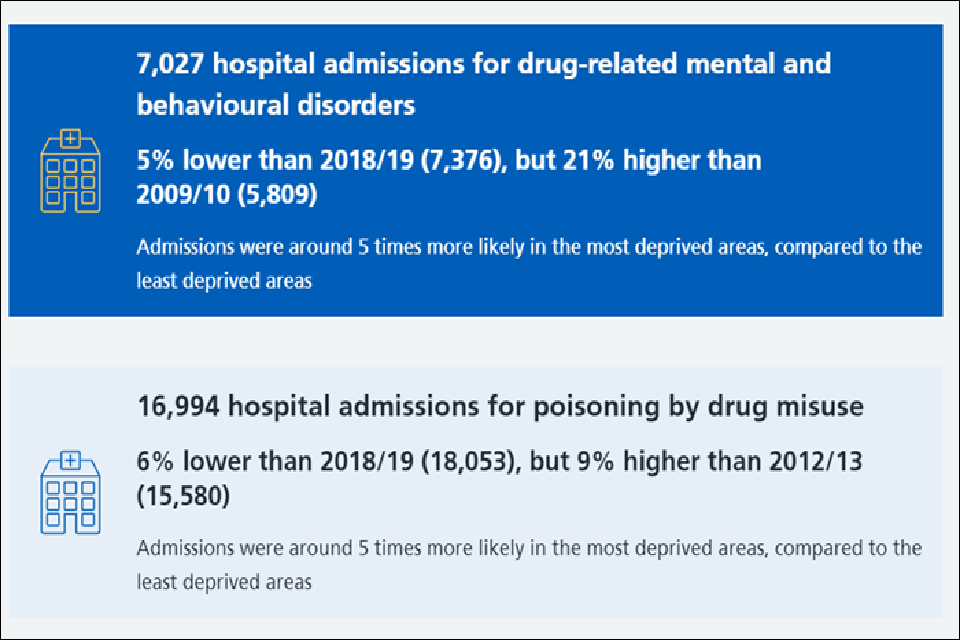
Infographic showing, in the dark blue box hospital, admissions for drug related mental and behavioural disorders. The light blue box has data for hospital admissions for poisoning by drug misuse.
Source:
- Statistics on Drug Misuse, England 2020, NHS Digital.
5. Increasing levels of obesity in the UK adult population
The majority of adults in England in 2018 were overweight or obese (63%). Obesity prevalence increased steeply between 1993 and 2000, with a slower rate of increase thereafter. In 2018, the proportion of adults who were obese was 28%.
In 2017, the UK had the tenth highest adult obesity levels in Organisation for Economic Co-operation and Development (OECD) countries. Using 2017 data, the UK reported obesity levels were 26% of the population. This is 14 percentage points lower than the USA which reports the highest adult obesity level.
Obesity prevalence in the UK compared with other Organisation for Economic Co-operation and Development (OECD) countries
Comparisons are based on data for adults aged 15 and over, or closest available. Data is for 2017 or nearest available year. Only countries with measured data are included here.
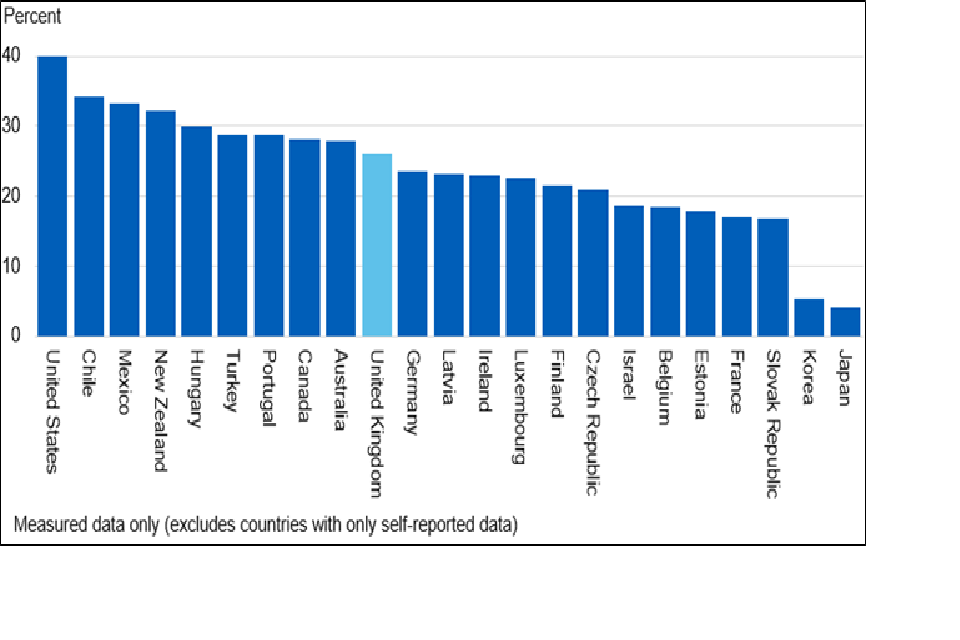
Bar graph of percentage of the population who are obese for 23 countries. The UK is shown as the lighter blue bar.
Source:
6. Decrease in UK mortality rates for all cancers
Since the early 1970s, mortality rates for all cancers combined decreased by a sixth (17%) in the UK. Rates in females have decreased by more than a tenth (12%), and rates in males have decreased by around a quarter (26%). Mortality rates for all cancers combined are projected to fall by 15% in the UK between 2014 and 2035, to 280 deaths per 100,000 people by 2035.
There are differences in UK countries. All cancers combined mortality rates (European age-standardised rates) for persons are significantly higher than the UK average in Scotland and Wales, significantly lower than the UK average in England and similar to the UK average in Northern Ireland.
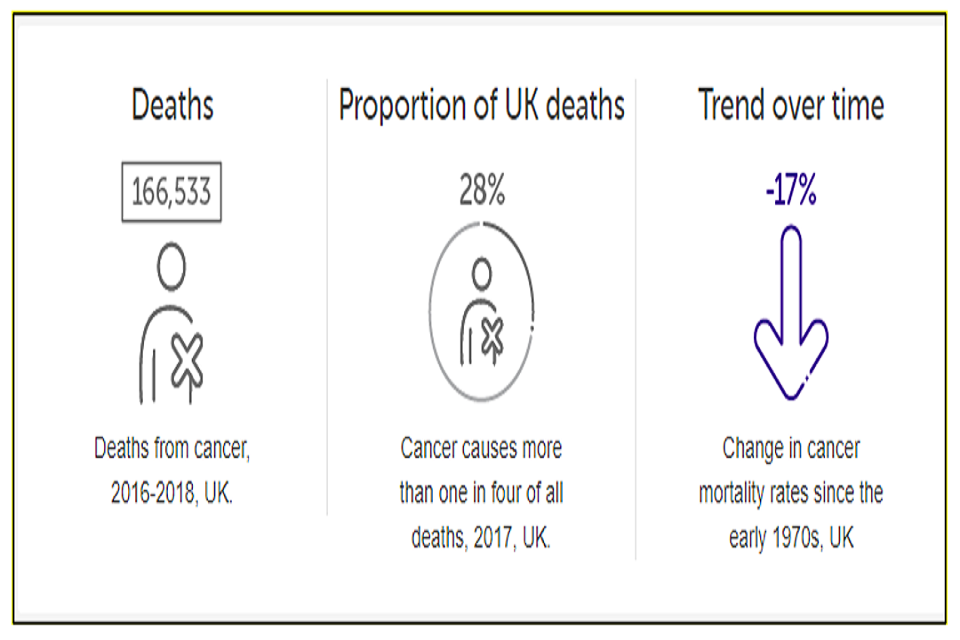
Infographic of deaths, proportion of deaths and trend over time for UK cancer rates.
Source:
- Cancer Research UK, Accessed April 2021
7. Long-term decrease in death rates from heart and cardiovascular disease in England
Since 1961, the death rate from heart and circulatory diseases has declined by more than three quarters in England. There are around 7.6 million people living with heart and circulatory diseases in the UK - an ageing and growing population and improved survival rates from heart and circulatory events could see these numbers rise still further. As people are living longer, death rates have decreased more quickly than actual numbers of deaths.
Heart and circulatory diseases cause more than a quarter (27%) of all deaths in the UK. Healthcare costs relating to heart and circulatory diseases are estimated at £9 billion each year.
Death rates from heart and circulatory diseases (CVD), UK, 1969 to 2018
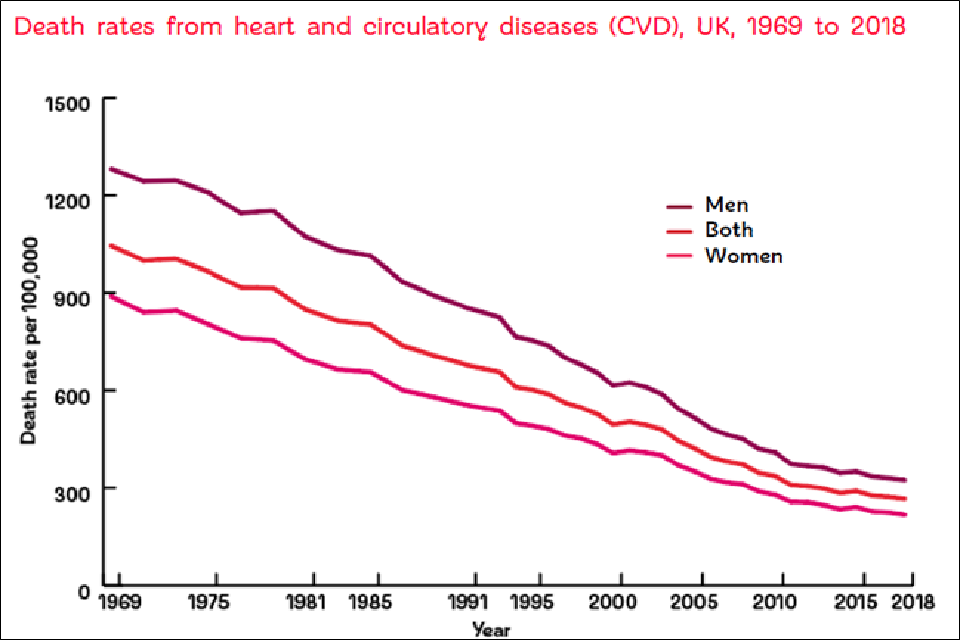
Line graph of death rates per 100,000 from 0 to 1,500 over the time period 1969 to 2018. The pink line is for women only, red line for men and women and purple line for men only.
Source:
8. Decline in cigarette smoking in the UK but vaping is increasing
In 2019, the proportion of current smokers in the UK was 14.1%, which equates to around 6.9 million in the population. This figure represents a significant reduction since 2018, when 14.7% smoked, and continues the trend in falling smoking prevalence since 2011.
In Great Britain, 5.7% of respondents to the Annual Population Survey in 2019 said they currently used an e-cigarette, which equates to nearly 3 million adults in the population. This proportion is significantly higher than that observed in 2014, when data collection began, when only 3.7% vaped.
Proportion of the population who were current vapers, Great Britain, 2014 to 2019
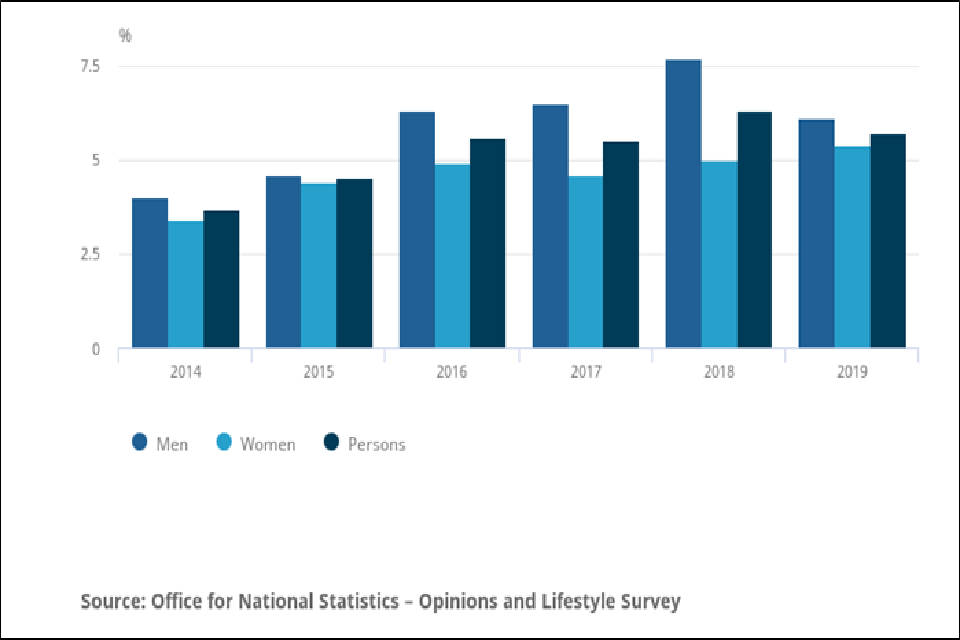
Bar graph of population percentage from 0 to 7.5 over the time period 2014 to 2019. Mid blue bars represent men, light blue bars women and dark blue bars persons.
Source:
- Adult smoking habits in the UK: 2019, Office for National Statistics.
9. Rapid increase in the prevalence of dementia worldwide
Alzheimer’s Society research suggests there are currently nearly 36 million people with dementia in the world and as many as 28 million do not have a diagnosis. By 2050 it is projected there will be 115 million people with dementia worldwide, 71% of whom will live in developing countries.
The Alzheimer’s Society work projects that the number of older people with dementia in the UK will increase by 80%, from almost 885,000 in 2019 to around 1.6 million in 2040. It could reach one million in the year 2024. The prevalence rate of dementia in the UK is projected to reach 8.8% in 2040. This is largely driven by an ageing population. The total cost of dementia care in the UK is projected to increase by 172%, from £34.7 billion in 2019 to £94.1 billion in 2040, at constant 2015 prices.
Projected prevalence of dementia in the four UK countries by severity of dementia, 2040
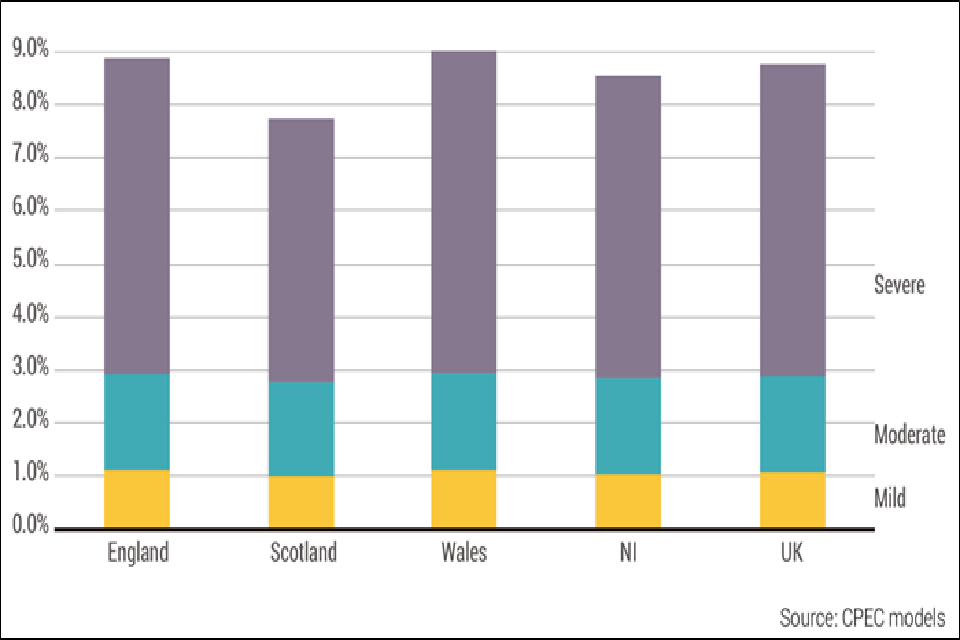
Bar graph of the prevalence rate of dementia from 0 to 9 per cent for the four UK countries and UK as a total. Yellow indicates mild dementia, green moderate dementia and purple severe dementia.
Sources:
- Alzheimer’s Society’s view on demography.
- Projections of older people with dementia and costs of dementia care in the United Kingdom, 2019-2040, Report by the Care Policy and Evaluation Centre at The London School of Economics and Political Science, November 2019, for the Alzheimer’s Society.
10. Healthy life expectancy for UK women has decreased
From 2017 to 2019 healthy life expectancy (HLE) at birth in the UK for males was 62.9 years, showing no significant change from 2014 to 2016. However, HLE for females showed a decrease from 63.7 years in 2014 to 2016 to 63.3 years in 2017 to 2019, although this is still higher than for males.
Female HLE in 2017 to 2019 was almost five months shorter than in 2014 to 2016, and the lowest it has been since the time series began in 2009 to 2011. In 2009 to 2011 there was a difference of 1.1 years between male and female HLE at birth, in 2017 to 2019 this narrowed to 0.4 years.
Female HLE in 2017 to 2019 was almost five months shorter than in 2014 to 2016, and the lowest it has been since the time series began in 2009 to 2011
Healthy life expectancy, UK, 2014 to 2016, 2017 to 2019
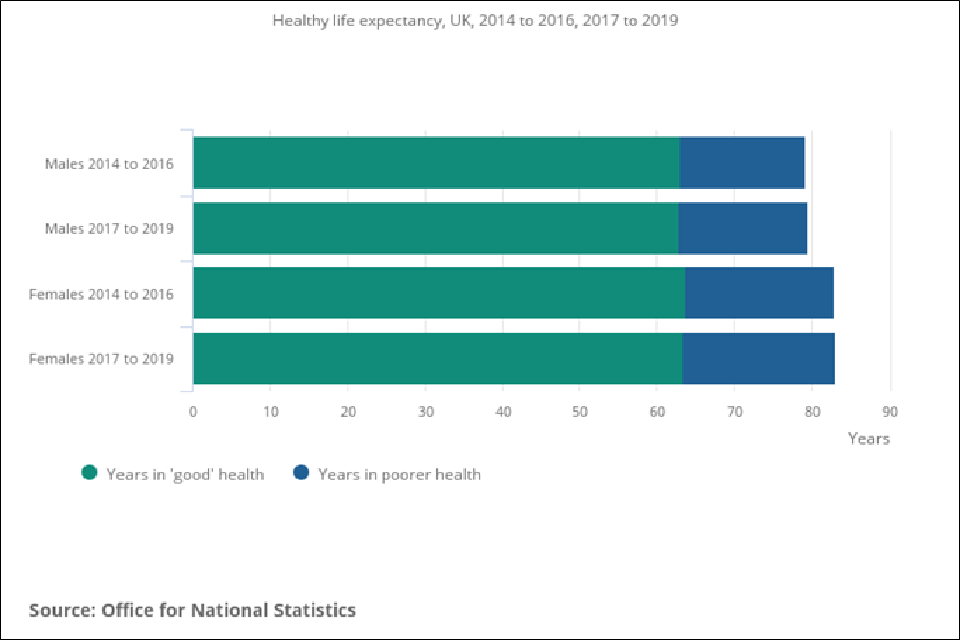
Bar chart of healthy life expectancy from 0 to 90 years. Green bars show years spent in good health and blue bars years in poor health.
Source:
- Health state life expectancies, UK: 2017 to 2019, Office for National Statistics.
11. 6% of adults in England continue to feel lonely often or always
Loneliness can be defined as an individual’s negative perception of the quality or quantity of their social relationships. It is possible to be lonely whilst being part of a large social network or in a relationship.
In the England Community Life Survey 2019 and 2020, 6% of respondents said they felt lonely often/always. This is the same as in 2017 and 2018 and 2018 and 2019. Loneliness is higher for women, 16 to 24 year olds, those with a limiting long-term illness or disability or living in a deprived or rural area.
How often respondents to the Community Life Survey feel lonely, 2019 and 2020
The 95% confidence intervals are indicated by error bars on the charts. They show the range that we are 95% confident the true value for the population falls between.
Bar chart of percentage of adults with a common mental health disorder over the four time periods - 1993, 2000, 2007 and 2014.
Source:
- Wellbeing and Loneliness - Community Life Survey 2019/20, Department for Digital, Culture, Media and Sport, July 2020.
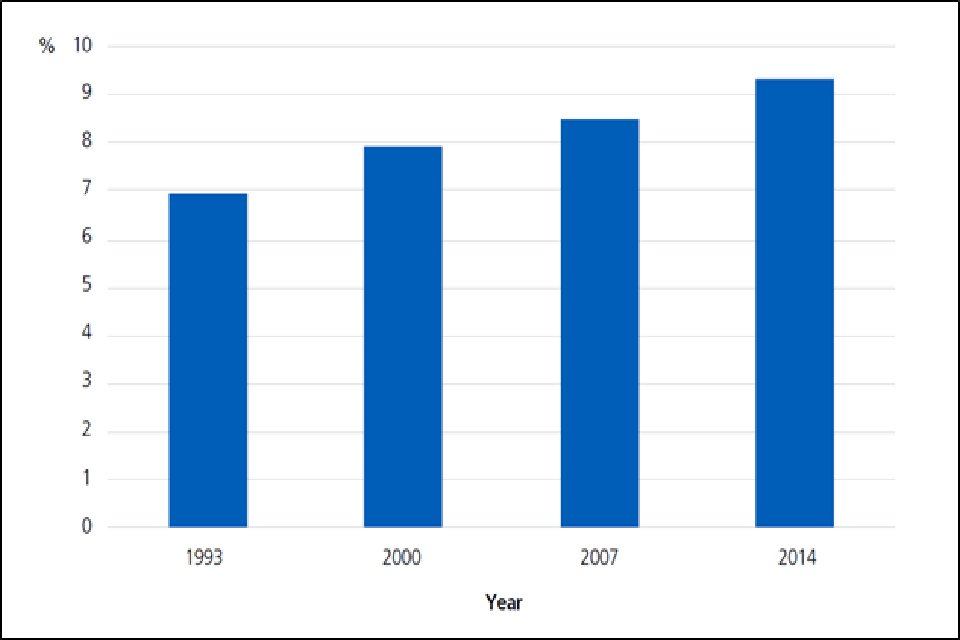
12. Increase in common mental health disorders in adults in England
Overall, around one in six adults (17%) surveyed in England met the criteria for a common mental disorder (CMD) in 2014. This figure has increased from one in four (24%) since the last survey was carried out in 2007. Women were more likely than men to have reported CMD symptoms. One in five women (19%) had reported symptoms, compared with one in eight men (12%). Women were also more likely than men to report severe symptoms of CMD – 10% of women surveyed reported severe symptoms compared to 6% of men.
39% of adults aged 16 to 74 with conditions such as anxiety or depression, surveyed in England, via the Adult Psychiatric Morbidity Survey, were accessing mental health treatment in 2014.
Severe CMD symptoms in past week (CIS-R score 18+), 1993 to 2014, Base: adults aged 16 to 64
Bar chart of percentage of adults with a common mental health disorder over the four time periods - 1993, 2000, 2007 and 2014.
- The common mental disorders (CMD) included in this series were depression, generalised anxiety disorder (GAD), panic disorder, phobias, obsessive compulsive disorder (OCD), and CMD not otherwise specified (CMD-NOS). Many people meet the criteria for more than one CMD.
- CIS-R Score: A score of 12 or more indicated symptoms warranting clinical recognition, a score of 18 or more is considered severe and requiring intervention.
Source:
- Adult Psychiatric Morbidity Survey: Survey of Mental Health and Wellbeing, England, 2014, NHS Digital
13. Visits to green spaces in towns and cities in England have increased but quality urban green space is declining
Greener environments are associated with better mental health and well-being outcomes including reduced levels of depression, anxiety, and fatigue, and enhanced quality of life for both children and adults. Valuations show £2.1 billion per year could be saved in health costs if everyone in England had good access to green space, due to increased physical activity in those spaces.
As urban areas expand or become denser, the amount of good quality green space is declining. The Committee on Climate Change found that the total proportion of urban green space in England declined by 8 percentage points between 2001 and 2018, from 63% to 55%.
Estimated annual visits to natural environment, total and by type of place visited (billions, 2009 and 2010 to 2018 and 2019). The total number of visits to green spaces in towns and cities almost doubled in the ten years to 2018 and 2019
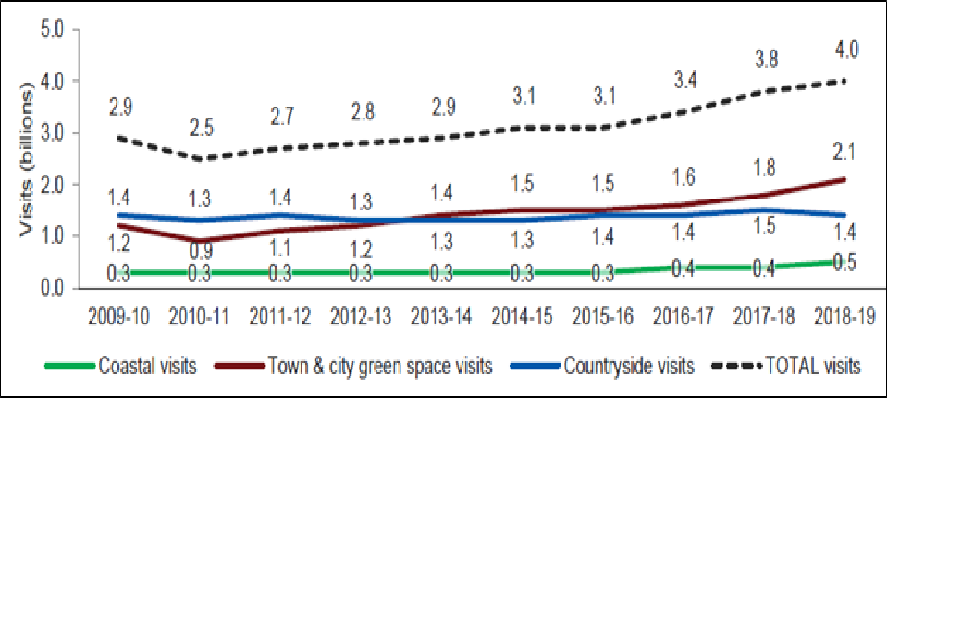
Line graph of visits in billions over the time period from 2009 to 2010 to 2018 to 2019. The green line represents coastal visits, red line town and city green space visits, blue line countryside visits and hashed line total visits.
Sources:
- Improving access to greenspace A new review for 2020, Public Health England.
- Monitor of Engagement with the Natural Environment, The national survey on people and the natural environment, Headline report 2019.
14. Global spread of significant and new emerging infections
Many (60 to 80%) emerging infections are derived from an animal source. Infections have been emerging for thousands of years as humans have had more and more interactions with animals and their environment. Factors involved in emergence include microbial adaptation, ecological changes, human demographics and behaviour, international travel and public health infrastructure.
Global map of significant and new emerging infections in humans: to spread to new areas since 1998
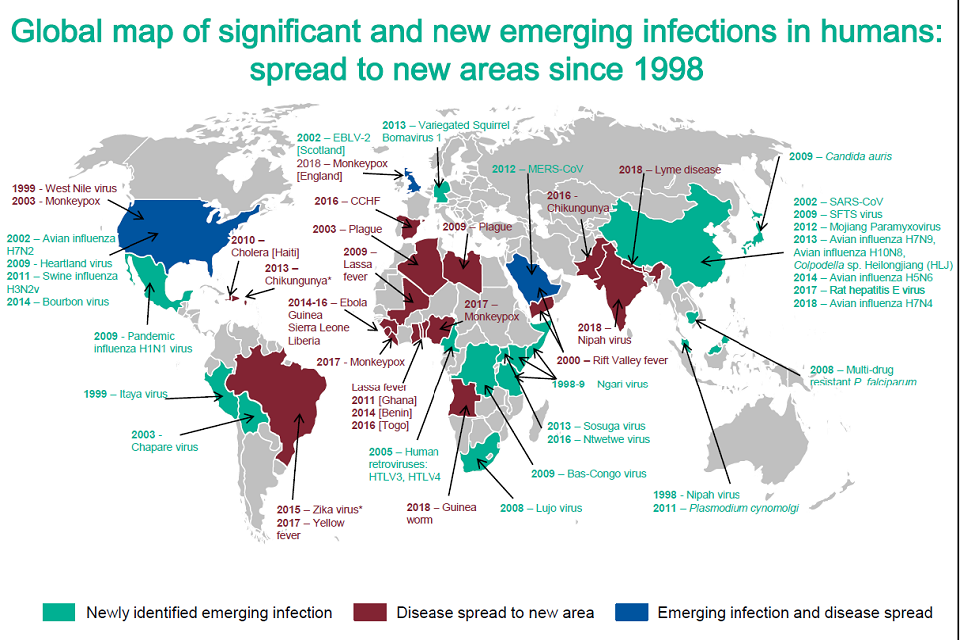
Global map of significant and new emerging infections in humans; spread to new areas since 1998.
Major infections causing epidemics and pandemics since 2000 include severe acute respiratory syndrome (SARS), ‘a ‘swine flu’ pandemic (H1N1), avian influenza infections (H5N1 and H79N), a widespread pandemic-like extension of Ebola over five African countries, Middle Eastern Respiratory Syndrome (MES-CoV) and a cholera outbreak in Haiti. The World Health Organization (WHO) declared coronavirus (COVID-19) a pandemic on 11 March 2020.
Sources:
- Emerging infections: how and why they arise. Public Health England, February 2019.
- Influenza (Avian and other zoonotic) World Health Organization factsheet; (2018) Licence: CC BY-NC-SA 3.0 IGO.