Wellbeing and Loneliness - Community Life Survey 2019/20
Published 14 July 2020

© Crown copyright 2020
This publication is licensed under the terms of the Open Government Licence v3.0 except where otherwise stated. To view this licence, visit nationalarchives.gov.uk/doc/open-government-licence/version/3 or write to the Information Policy Team, The National Archives, Kew, London TW9 4DU, or email: psi@nationalarchives.gov.uk.
Where we have identified any third party copyright information you will need to obtain permission from the copyright holders concerned.
This publication is available at https://www.gov.uk/government/statistics/community-life-survey-201920-wellbeing-and-loneliness/wellbeing-and-loneliness-community-life-survey-201920
The Community Life Survey is a household self-completion survey (online or paper) of adults aged 16+ in England. This chapter summarises results related to wellbeing and loneliness from the 2019/20 survey, which ran from April 2019 to March 2020.
Differences between groups are only reported on in this publication where they are statistically significant i.e. where we can be confident that the differences seen in our sampled respondents reflect the population [footnote 1].
1. Harmonisation
The Community Life Survey uses the Government Statistical Service (GSS) harmonised principle for the four personal measures of wellbeing and indicators of loneliness. The estimates presented here are therefore comparable with other surveys which use this principle.
2. Wellbeing
Two questions were used where respondents were asked about overall wellbeing, and these questions measure responses on a scale from 0 (not at all) to 10 (completely).
- Overall, how satisfied are you with your life nowadays? (referred to as life satisfaction)
- Overall, to what extent do you feel that the things you do in your life are worthwhile? (referred to as self-worth)
The mean scores for life satisfaction and self-worth remained the same in 2019/20 compared to 2018/19. Out of 10, the average scores for life satisfaction and self-worth were 7.0 and 7.3 respectively.
Figure 2.1 Time series for life satisfaction and self-worth, 2013/14 – 2019/20
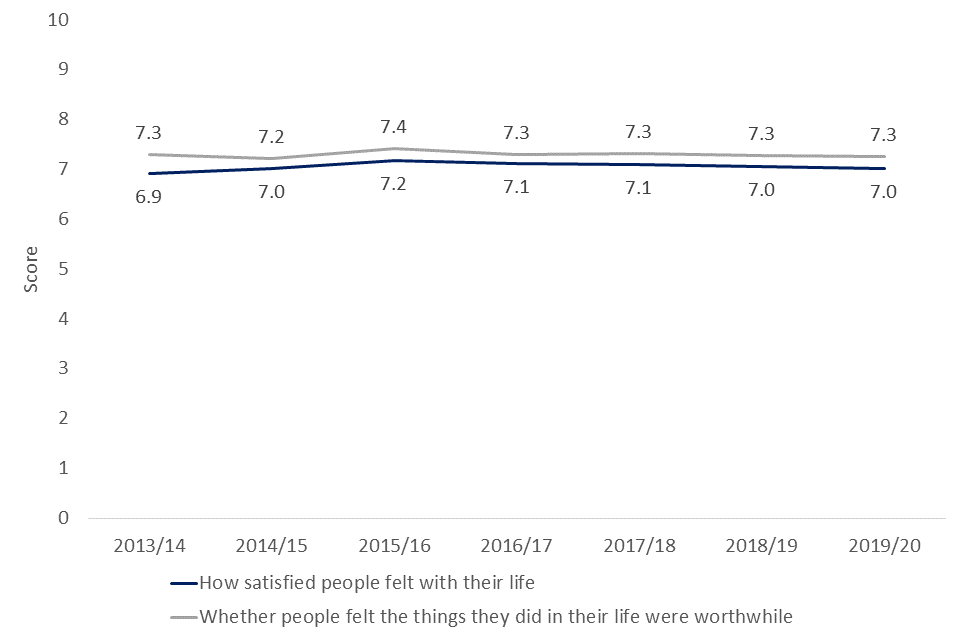
Line graph showing how satisfied respondents felt with their life, and whether respondents felt the things they did in their life were worthwhile, 2013/14 to 2019/20
Two questions were used which ask about how a respondent felt yesterday, and these questions also measure responses on a scale from 0 (not at all) to 10 (completely).
- Overall, how happy did you feel yesterday? (referred to as happiness)
- On a scale where 0 is “not at all anxious” and 10 is “completely anxious”, overall, how anxious did you feel yesterday? (referred to as anxiety)
Levels of happiness have remained consistent since 2013/14, with a mean score in 2019/20 of 7.0. The mean score for anxiety was 3.7 in 2019/20. This represents a statistically significant increase from 3.5 in 2018/19.
Figure 2.2 Time series for feeling happy and anxious, 2013/14 – 2019/20
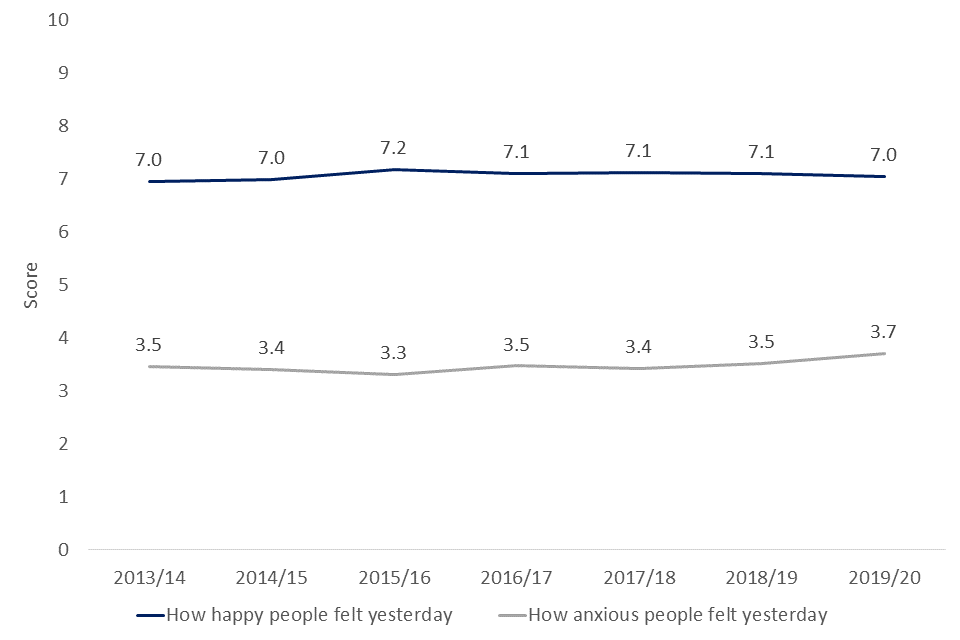
Line graph showing how happy and how anxious respondents felt yesterday. From 2013/14 to 2019/20, a stable trend is seen. An increase in anxiety is seen from 2018/19 to 2019/20.
3. Loneliness
GSS harmonised questions on different aspects of loneliness were included in the 2019/20 survey.
These are:
- How often do you feel lonely?
- How often do you feel that you lack companionship?
- How often do you feel left out?
- How often do you feel isolated from others?
Overall:
- 6% of respondents said they feel lonely often or always. This is the same as in 2017/18 and 2018/19.
- In 2019/20, 21% of respondents said they never feel lonely, similar to 2018/19 and 2013/14 (23%).
- 11% of respondents reported feeling that they lacked companionship often or always.
- 10% reported feeling left out often or always.
- 11% reported feeling isolated from others often or always.
- In addition, 4% of respondents reported the answer ‘often/always’ to all four questions, indicating the experience of multiple aspects of loneliness.
Figure 2.3 How often respondents feel lonely, 2019/20
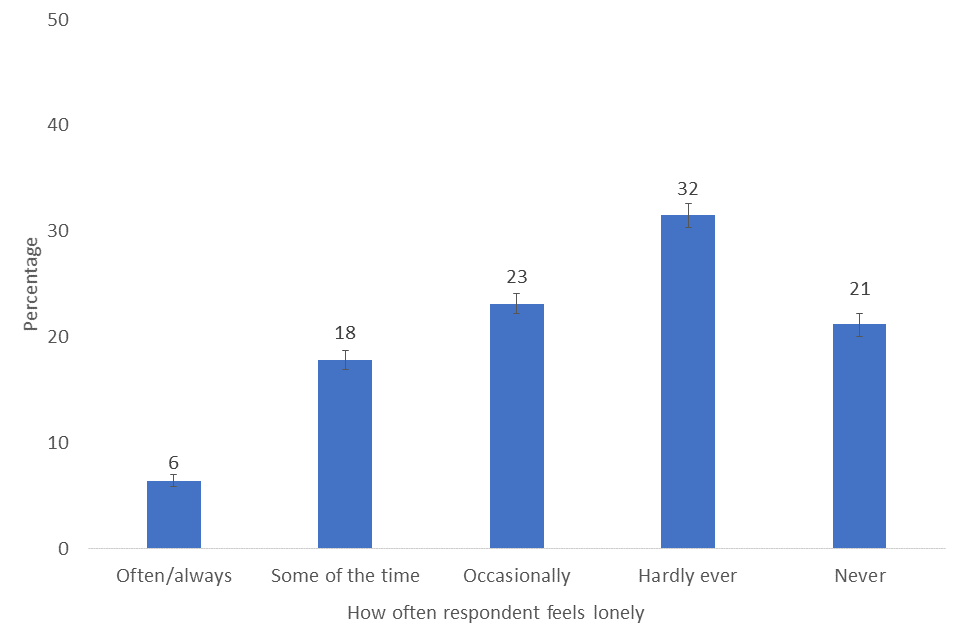
Bar chart showing the popularity of responses for how often a respondent feels lonely, 2019/20
- Men were more likely to say that they never felt lonely than women (25% compared with 18%).
- There were differences by age group in feelings of loneliness, with people aged 16 to 24 more likely to say they feel lonely often/always (10%) than age groups of 35 years and over (4-6%). 65-74 year olds reported the lowest levels of loneliness, with 30% saying they never felt lonely, as compared to 14% of 16-24 year olds.
- People with a limiting long-term illness or disability were more likely to say they felt lonely often/always than those without (14% compared with 4%) and less likely to say they never felt lonely (14% compared with 23%).
- 20% of respondents in urban areas reported never feeling lonely, whereas in rural areas, the corresponding figure was 26%.
- Those living in the most deprived areas were more likely to feel lonely often/always than those living in the least deprived areas (9% compared with 4%).
- No significant variability was seen between the different ethnicity or region categories.
It is interesting to consider these demographic estimates alongside those in Chapter 1 of the Community Life Survey, Identity and Social Networks. Though women reported higher levels of loneliness, they were also more likely to have regular contact with family and friends across a range of communication methods, and more likely to agree that they have support networks.
People with a long-term limiting illness or disability were less likely to feel they had support networks to rely on when they needed them, and this may be related to their increased feelings of loneliness. Our estimates show that 16-24 year olds report the highest levels of loneliness, though also report having robust support networks. While there were some differences in methods of communication between age groups, it is unclear whether this is related to the differences in experiences of loneliness between age groups.
Figure 2 How often respondents feel lonely, by age group, 2019/20
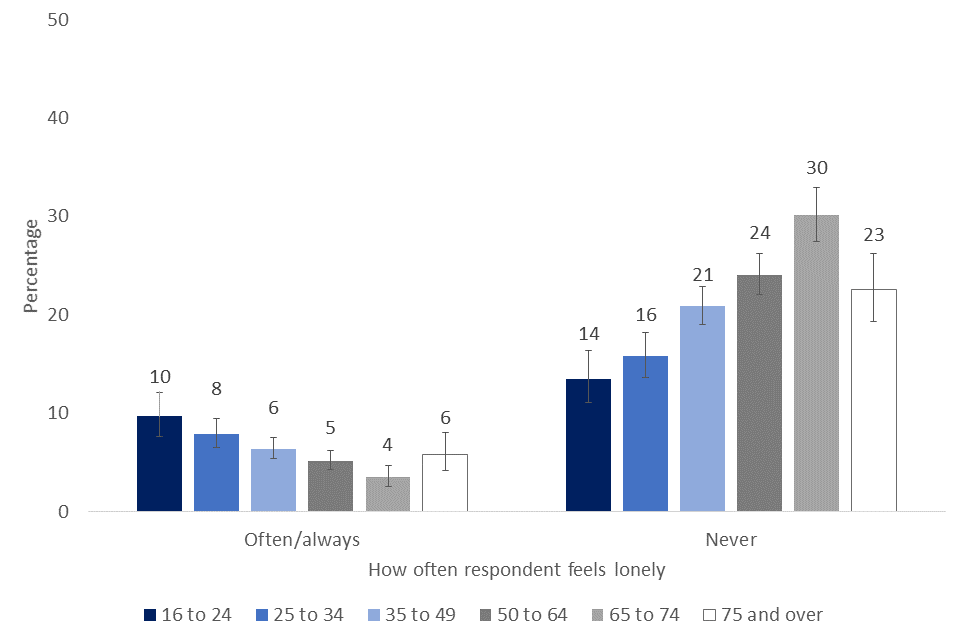
Bar chart showing the popularity of responses for how often a respondent feels lonely by age, 2019/20
Figure 2.5 How often respondents feel lonely by limiting long-term illness/disability (LLTI/Disability), 2019/20
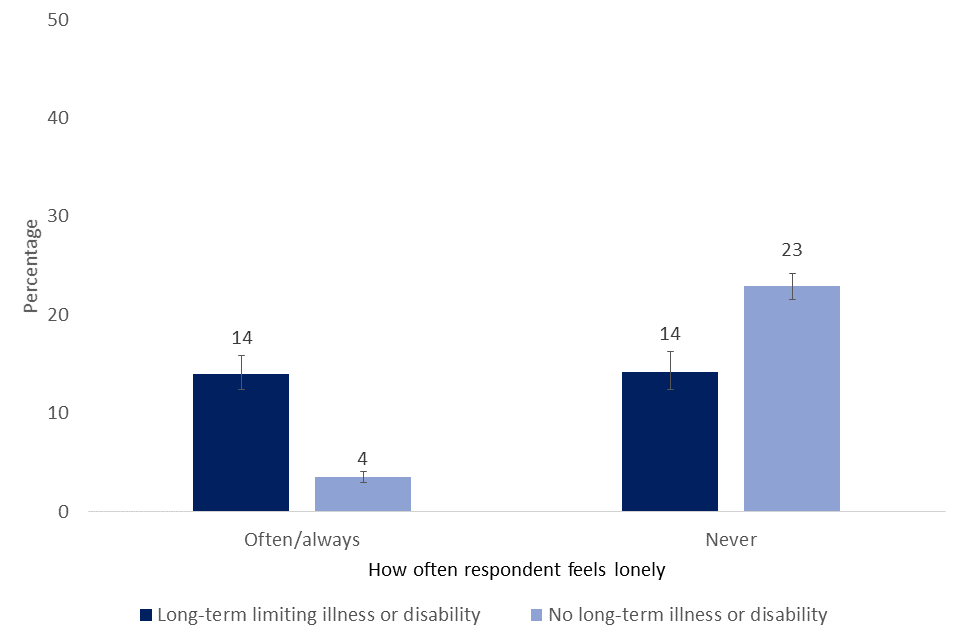
Bar chart showing that the popularity of responses for how often a respondent feels lonely by long-term limiting illness or disability
-
The 95% confidence intervals are indicated by error bars on the charts. They show the range that we are 95% confident the true value for the population falls between. When there is no overlap between the error bars for two or more groups, we can be more confident that the differences between groups represent true differences between these groups in the population. ↩