TFMS: Consensus statement on mass testing, 27 August 2020
Updated 26 October 2021

© Crown copyright 2021
This publication is licensed under the terms of the Open Government Licence v3.0 except where otherwise stated. To view this licence, visit nationalarchives.gov.uk/doc/open-government-licence/version/3 or write to the Information Policy Team, The National Archives, Kew, London TW9 4DU, or email: psi@nationalarchives.gov.uk.
Where we have identified any third party copyright information you will need to obtain permission from the copyright holders concerned.
This publication is available at https://www.gov.uk/government/publications/tfms-consensus-statement-on-mass-testing-27-august-2020/tfms-consensus-statement-on-mass-testing-27-august-2020
Multidisciplinary Task and Finish Group on Mass Testing Consensus Statement for SAGE
Date: 31 August 2020
1. This consensus statement presents the findings and recommendations of the SAGE Task and Finish Group on Mass Screening (TFMS). The TFMS is a multidisciplinary group established to examine, from technological, epidemiological, and behavioural perspectives, the benefits and challenges of mass testing for SARS-CoV-2.
2. TFMS adopts the terminology ‘mass testing’, or ‘population-level case detection’ (PCD), which refers to regular and or large-scale testing of whole populations defined by area or sector regardless of whether or not they have symptoms. Mass testing is a distinct strategy and set of technologies to NHS Test and Trace (NHSTT). Rather than testing self-reported, symptomatic individuals, mass testing involves pro-active asymptomatic testing of a defined group; either through universal provision of accessible testing to that group or as a requirement before entering a particular setting.
Key Recommendations
3. Mass testing is a different strategy for finding infectious people from contact tracing, however any mass testing system should be a carefully designed counterpart to the NHSTT contact tracing system. It will be important that the two systems are complementary and linked-up and that all infectious people found through mass testing are reported to NHSTT.
4. Clear and specific aims for any mass testing programme should be defined, ensuring those objectives include achieving equitable outcomes. Mass testing is primarily a tool for control of infection: to lower R in the general population (by reducing the average infectious period); to reduce the risk of larger outbreaks in areas known to be of concern; or to increase access to venues and settings by reducing the probability that anyone present is infectious.
5. Testing should be driven by public health considerations and priorities. Priority groups for mass testing to reduce transmission should be identified according to their likely contribution to reducing R and outbreak risks, and improving health, social and economic outcomes including reducing inequalities. Mass testing is most likely to be beneficial and feasible in cluster outbreak scenarios and well-defined higher risk settings (for example health and social care settings, higher risk occupations such as food production facilities, and universities), where it can help detect and prevent large outbreaks early, and compliance can be measured and moderated.
6. Establishing a new mass testing programme must be undertaken with a view to the entire end-to-end system - testing technology is only one component. The effectiveness of a mass testing programme will depend on the proportion tested, frequency of testing, ability of a test to identify true positives and negatives, speed of results and subsequent adherence to isolation. From highly accessible fast turn-around testing to structured financial and other support (particularly for most disadvantaged groups), a system-wide capability must be built.
7. The cheaper, faster tests that will be useful for mass testing are likely to have lower ability to identify true positives (lower sensitivity) and true negatives (lower specificity) than the tests currently used in NHSTT. Problems of low sensitivity would be decreased by very frequent testing. In populations with low prevalence of infection, mass testing that lacks extremely high specificity would result in many individuals receiving false positive results. In such circumstances, rapid follow-up confirmatory testing will be needed to determine whether individuals should continue to self-isolate – it is important to rapidly isolate infectious individuals, but efforts will be needed to quickly release false positives.
8. Careful consideration should be given to ensure that any mass testing programme provides additional benefit over investing equivalent resources into improving (i) the speed and coverage of NHSTT for symptomatic cases (the proportion of individuals who report Covid-consistent symptoms in England who go on to request a test through NHSTT could be as low as 10% [footnote 1] ) and (ii) the rate of self-isolation and quarantine for those that test positive (currently estimated to be less than 20 per cent fully adherent [footnote 2] ). This is relevant as targeting testing to those with high prior probabilities of infection (for example people with symptoms or contact with known case) has a much larger per-test impact on reducing transmission. There is, therefore, a delicate balance to be struck between investing to engage more symptomatic individuals with NHSTT and building alternative methods to reach out to find those who would not seek testing spontaneously.
9. The use of testing as a point-of-entry requirement for particular settings and events, for example sporting and cultural events, could play a role in allowing the resumption of such activities with reduced risk of transmission. Such applications of testing would require superb organisation and logistics with rapid, highly-sensitive tests. This is also separate from the national strategy to reduce R, for which such testing would have only minimal effect.
10. A further application could be to provide reassurance in sensitive settings where detection of one or two infectious individuals could be followed up by local but broad testing (for example of all pupils in the class or all team members in the workplace).
Overarching considerations
11. The population prevalence of infection and relevant test performance have critical implications for effectiveness and risks of mass testing. Mass testing could enable earlier detection of infection clusters, but it is essential to consider the implications of both false positives and false negatives. In a population with very low prevalence twice weekly tests with 99 per cent specificity – and 10 day isolation if positive - would lead to ~3 per cent in isolation at any given time (as 1 per cent isolated every 3.5 days) and 41 per cent of the population receiving a false positive over 6 months (such as the probability of getting at least one false positive in 52 tests). This example highlights the importance of follow-up confirmatory testing in low prevalence settings, addressed in Annex B. Finding the right combination of tests is not trivial and will require careful pilot studies.
12. Under mass testing, a larger proportion of positive results will be false positive than in symptomatic testing, even when using the same test, as infection prevalence is much lower in asymptomatic populations. The response to positive tests will therefore require careful consideration, including (i) whether rapid follow-up confirmatory testing is used to avoid prolonged isolation of large numbers of false positives, (ii) whether individual isolation requires household quarantine, (iii) how to communicate to the public the nature of mass testing and lower-confidence test results to avoid potential undermining of public perception and confidence in testing (iv) the possible impacts on individuals (loss of earnings) and groups (closure of schools), and (v) how to define outbreaks when including asymptomatic tests.
13. Effective mass testing will require high rates of testing and self-isolation. Current rates of (i) symptom identification, (ii) test requests, and (iii) subsequent self-isolation are estimated to be very low (see paragraph 8), with none likely exceeding 30 per cent. This presents a critical barrier to any effective mass testing strategy. This will require engagement built on trust, shared goals and perceived fairness. Messaging must be co-produced with target communities and include transparent rationales and benefits of testing, allayment of privacy concerns, and specified support for positive cases.
14. How any test is offered is a major predictor of uptake rates. Two key considerations for mass testing are: (i) Accessibility of testing – rates are increased by multiple low-friction points for access, for example walk-in centres. It might prove useful to have mobile laboratories for taking tests and instrumentation to communities that need them. Tests self-administered at home can increase accessibility but depend upon distribution and effective communication. (ii) Access that is dependent on testing – (for example requiring testing as pre-condition for entry to a workplace, university or event) has unknown effects on discouragement and equity.
15. Mass testing can only lead to decreased transmission if individuals with a positive test rapidly undertake effective isolation. This needs to become a universal response to receipt of a positive test result and may need structured financial and social support both to promote self-isolation and mitigate impacts on inequalities. This should include (i) proactive provision of information and social and clinical support, (ii) sufficient supplies of food, (iii) employment protection, (iv) financial assistance and (v) accommodation where necessary. See supporting TFMS Behavioural Paper for summary of evidence regarding structured support to improve adherence to self-isolation and quarantine guidelines.
16. Mass testing requires a systems view. Testing is a complex end-to-end process, and the test instrument or assay is only one part of the testing system; the performance of the entire system must be evaluated. For example, an instrument that can run 10,000 tests per hour still requires 10,000 samples to be taken, transported to the laboratory when not in situ, labelled and recorded with patient metadata, subsamples or extracts prepared from 10,000 primary samples, tests run, and the results captured and fed into NHSTT. The system turn-around time and system costs are always greater than the instrument or assay turn-around time and cost. Successfully deploying and scaling mass testing will therefore require a system-wide capability management view.
Testing technologies
17. When a test is performed on a sample the amount of signal produced is proportional to the amount of virus in that sample. Those amounts will be spread over a continuum. When a test is implemented, a decision must be made about where to set the “detection threshold” level that a signal must cross in order to be called a positive test result. The performance of tests is described by their sensitivity (their probability of detecting a true positive, such as a sample taken from an infected person), and their specificity (their probability of detecting a true negative, such as a sample taken from a healthy, uninfected person). The sensitivity and specificity of a test are influenced by both the test technology, and the detection threshold chosen. Choosing the detection threshold for a test is always a compromise between sensitivity and specificity – see Annex A for a full explanation.
18. Comparative performance of relevant testing technologies.
| Technology | Time | Sensitivity | Specificity |
|---|---|---|---|
| RT-PCR [footnote 3] | 2 to 24 hours | Differs between laboratories - Lighthouse Labs testing suggests sensitivity of over 99 per cent | Differs between laboratories - Lighthouse Labs testing suggests sensitivity of over 99 per cent |
| Endpoint RT-PCR [no peer reviewed data] | under 24 hours | 86.8 per cent to 91.3 per cent * | 98.6 per cent to 100 per cent * |
| LamPORE [no peer reviewed data] | 90 minutes | 98.7 per cent * | 99.7 per cent * |
| Direct RT-LAMP [no peer reviewed data] | 30 minutes | 67 per cent * | 97 per cent * |
| RNA Extraction followed by RT-LAMP [footnote 4] | 30 to 120 minutes | 97 per cent | 99 per cent |
| Lateral Flow antigen tests [Reliable performance data not yet available as full validation is on-going] | around 10 minutes | Currently not known. Could be in order of 50 to 70 per cent, but estimates are evolving and full validation is on-going. | Currently not known. Estimates are evolving and full validation is on-going. |
Table 1. Comparative performance of relevant testing technologies. The performance estimates are analytical rather than operational sensitivities and specificities – they represent ideal circumstances. Except where references are given, sensitivity and specificity values are drawn from unpublished internal reports (marked by asterisks); they should be treated as wholly preliminary until large-scale validations have been performed. Timescale estimates are taken from an NHSTT testing update (10th August). For offsite laboratories, estimated include the logistics chain, hence larger ranges.
19. It is well known that widespread use of a test with imperfect specificity in a population with low prevalence will generate more false positives than true positives. For example, suppose one were to test 100,000 people of whom 200 were infected and 99,800 were not infected. A test with 80 per cent sensitivity and 96 per cent specificity would find 160 true positives and 3,992 false positives. The situation can be rectified with follow-up, confirmatory testing of the 4,152 with a positive first test using a different second test that has very high specificity (perhaps at greater expense or slower turnaround). If those 4,152 individuals were re-tested with a test with 99 per cent specificity the number of false positives would fall to just 40 – see Annex B for detailed illustrative examples. This calculation relies on the strong assumption that the two tests have independent errors.
20. Choosing the right tests from the available technologies is an essential step in building a viable mass testing system. Those tests need to have the right properties for the specified objective (for example fast and highly sensitive to allow access to a sporting or cultural event). Objectives that require combined tests should use technologies that, as far as possible, ensure independent errors so that a confirmatory test has a good chance of revealing errors in a first test. A panel of reference samples of known status will need to be developed to continuously quality assure any mass testing service. For example, if a private sector lab were delivering a screening service for a sporting or cultural event, they would routinely need to be tested using a panel of reference samples.
Illustrative scenarios for Mass Testing | Population Case Detection (PCD)
1. Reactive PCD in communities with increasing prevalence (for example city-wide outbreak)
Epidemiological Considerations
- Increases the number of infected people being isolated.
- Comparison with alternative interventions, for example disruption from having large numbers of infected people in isolation after a positive test in a reactive PCD programme vs reintroduction of NPIs including an entire city in ‘lockdown’.
- Effectiveness and efficiency will be influenced by: i. proportion tested ii. representativeness of testing of the community iii. speed of results iv. sensitivity of test (to maximise number of infectious individuals detected) v. specificity of test (to minimise false positives) vi. linkage with contact tracing vii. adherence to isolation or quarantine.
- Need to consider the prevalence at which the introduction and cessation of PCD would be triggered. This trigger level should take account of known and estimable test characteristics (sensitivity and specificity) in order to guard against biased estimates of infection level (such as potential false alarms) in situations of low prevalence.
Behavioural Considerations
- Impacts to be anticipated - Many communities experiencing rising rates of infection are characterised by high levels of deprivation, multiple ethnicities, and high-density housing. In these circumstances reactive PCDs, and their associated burdens, may be perceived as targeting those communities. Mitigation measures include engaging local community leaders in co-production of guidance and communications explaining the rationale for mass testing and how community members can support each other [footnote 5].
- Testing rates - Local guidance should be taken on where multiple testing points are best located and who should be staffing these.
- Engagement - It will be particularly important for local teams to identify multiple community leaders and co-create messages that cross cultural and language barriers. Messages should emphasise financial and other support available for those who might be asked to self-isolate or quarantine.
- Self-Isolation or quarantine - In areas of high deprivation, provision of financial support to avoid income loss for those requested to self-isolate or quarantine will be vital particularly for those who are low paid working in the formal or informal economies.
- Provision of accommodation for those without facilities to self-isolate or quarantine may be important, however preliminary SPI-M work suggests any beneficial impact on transmission is likely to be modest. For those with caring responsibilities other options will need to be considered.
2. Regular PCD in at-high risk well-defined populations (for example healthcare or care homes)
Epidemiological Considerations
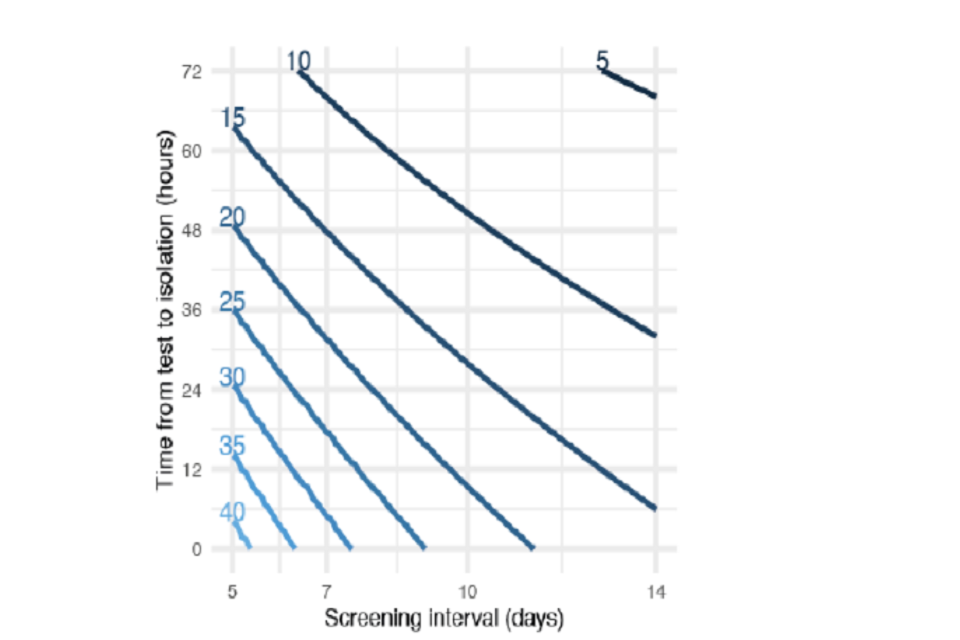
Figure 1 shows the reduction in transmission of infection from a target group (which could be a high-risk group e.g. health care workers) achieved by testing with different frequency and time until return of test results.
Figure 1 shows the reduction in transmission of infection from a target group (which could be a high-risk group for example health care workers) achieved by testing with different frequency and time until return of test results [footnote 6].
- May help in preventing outbreaks and resulting severe outcomes.
- Would need to have frequent testing and fast results to be confident of early detection of a large proportion of infectious individuals.
- If it became practical to provide daily tests with near-instant results and near-perfect sensitivity, then those with access to such tests could reduce their contribution to onward transmission by around 80 per cent. Confirmatory secondary testing would be likely to be necessary.
- As above, need to consider the prevalence at which the introduction and cessation of PCD would be triggered.
Behavioural Considerations:
- Self-isolation or quarantine - Financial support to avoid income loss is particularly important for those on low pay who are working in health care and in particular the care sector with many reports of those working in this sector either avoiding testing or ignoring results given financial hardship that would follow from not attending work. As an example, the Scottish Government has introduced a Social Care Staff Support Fund to ensure that social care workers receive their expected income (normal pay) when a worker’s ability to work has been, restricted for a reason relating to coronavirus [footnote 7].
3. Regular PCD in at-lower-risk well-defined populations (for example school, a large workplace, ships)
Epidemiological Considerations
- Overall benefit will depend on aim (for example reduce ongoing transmission or prevent new outbreaks) as well as background prevalence and what action a positive result will trigger (for example isolation of positives).
- As above, need frequent testing and fast results to be confident of detecting infections or outbreaks early. For testing to inform control measures, frequency and turnaround speed could offset reduced sensitivity [footnote 8].
- Large numbers may be required to isolate incorrectly unless test specificity is extremely high. Follow-up, confirmatory testing could reduce this number.
- The additional benefit of pooled testing may be limited as samples would still need to be collected at the individual-level, and if individual-level actions are required (for example feedback of results, isolation of positives) a positive result in a pooled sample would mean retesting to identify the positive individuals within the pool.
Behavioural Considerations
- Impacts to be anticipated - the effectiveness of follow-up confirmatory testing at reducing the large numbers required to isolate will require easily accessible tests with rapid results.
4. One-off test before or after short duration at-risk activity (for example pre-event passports, post-event mitigation)
Epidemiological Considerations
- Could reduce risk of activities that otherwise cannot be resumed.
- Issues will be organisation or logistics. Needs to be close in time to event with rapid test results.
- Low sensitivity may offset reduction in risk from testing but will depend on background prevalence (for example higher prevalence means lower confidence that an individual will not develop infectiousness between test and event). Low specificity raises issue about what to do with large numbers of false positives.
Behavioural Considerations
- Impacts to be anticipated - Gaming to get a “test negative” result. If a test-negative result is a requirement for entry to a venue or activity, a range of strategies to “game” the system may emerge including false verification of test results. Systems of ticketing and test verification need to anticipate this including automatic refunds on tickets for those testing positive.
- False reassurance from a “test-negative” result. Those receiving a test-negative result - whether true or false - may engage in behaviours that increase the risk of transmission during or after the event including reducing hand hygiene, not wearing face coverings and not maintaining physical distance from others. This might be mitigated by pre-test communication about the meaning and implications of test-negative as well as test-positive results.
5. One-off test before long duration activity (for example test at start of university term)
Epidemiological Considerations
- May not provide much benefit in preventing outbreaks, even with high sensitivity, given potential for repeated introductions (for example students going to and from home during term).
- May have some impact on containment especially if university is located in an area of low prevalence and incoming students are arriving from areas of much higher prevalence. This would be equivalent to using testing to release from quarantine — otherwise quarantine pre- or post-arrival could be as effective, as long as could ensure compliance.
Behavioural Considerations
- Impacts to be anticipated - High rates of infection will be detected in one-off mass testing in communities such as a university with implications for teaching and payment for accommodation [footnote 2].
Annex A
The compromise between test sensitivity and specificity
A nasopharyngeal swab sample taken from someone who has very recently been infected by SARS-CoV-2 will not yet contain any virus. Over time, as the virus replicates, the amount of virus in their swab samples will increase. It peaks a few days after the onset of symptoms, and decreases as the person recovers. The virus is often detected for several weeks after the person stops showing symptoms, while their body clears the remaining virus. This does not always mean the person is still infectious. An idealised, illustrative example of the amount of virus in samples is shown in Figure 1. If the person is sampled early during infection the swabs will be weak positive samples, as they contain very little virus. At the onset of symptoms they will be strong positive samples, as they contain a large amount of virus.
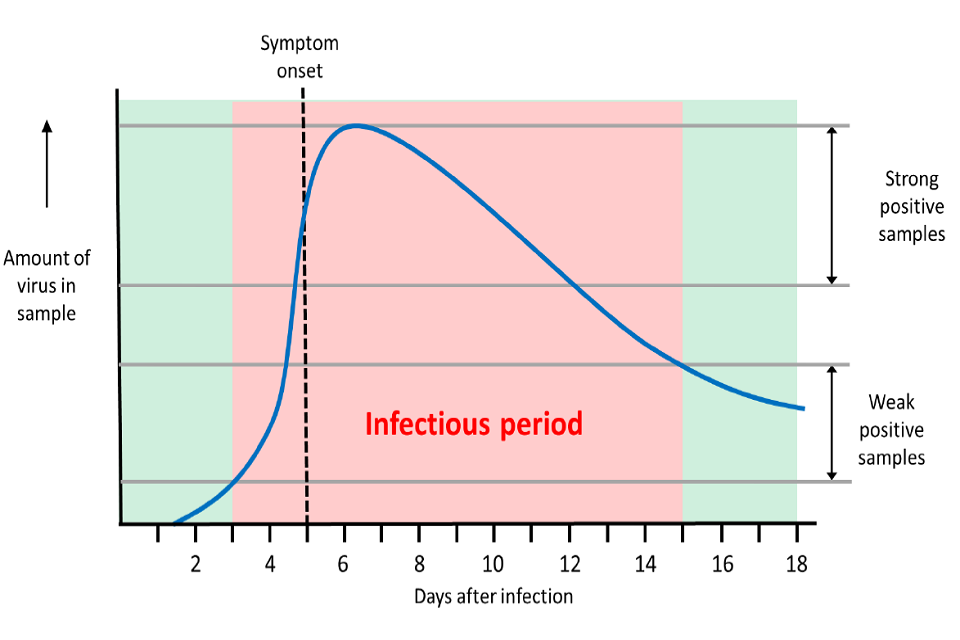
Amount of virus in samples taken during SARS-CoV-2 infection. The blue curve shows an illustrative example of the amount of virus found in swabs taken during infection, from infection at day 0 leading to symptom onset at day 5, and an assumed infectious period of two days prior to infection until ten days after infection
Figure 1. Amount of virus in samples taken during SARS-CoV-2 infection. The blue curve shows an illustrative example of the amount of virus found in swabs taken during infection, from infection at day 0 leading to symptom onset at day 5, and an assumed infectious period of two days prior to infection until ten days after infection (adapted from Kucirka et al., 2020). [footnote 9]
When these swab samples are tested, the amount of signal they produce in a test is proportional to the amount of virus in the swab sample. Strong positive samples will give a strong signal, weak samples will give a weak signal. Different types of test use different types of signal – the signal may be the detection of a PCR product, or luminescence, or colour change. True negative samples (for example water, buffer or a sample taken from an uninfected person) can also give a very low signal. When a test is implemented, a decision must be made about where to set the threshold level that a signal must cross in order to be called a positive test result.
The performance of tests is described by their sensitivity (their probability of detecting a true positive, such as a sample taken from an infected person), and their specificity (their probability of detecting a true negative, such as a sample taken from a healthy, uninfected person). The sensitivity and specificity of a test are influenced by both the test technology, and the detection threshold chosen (often referred to as the ‘limit of detection’). Figure 2 shows a simplified example.
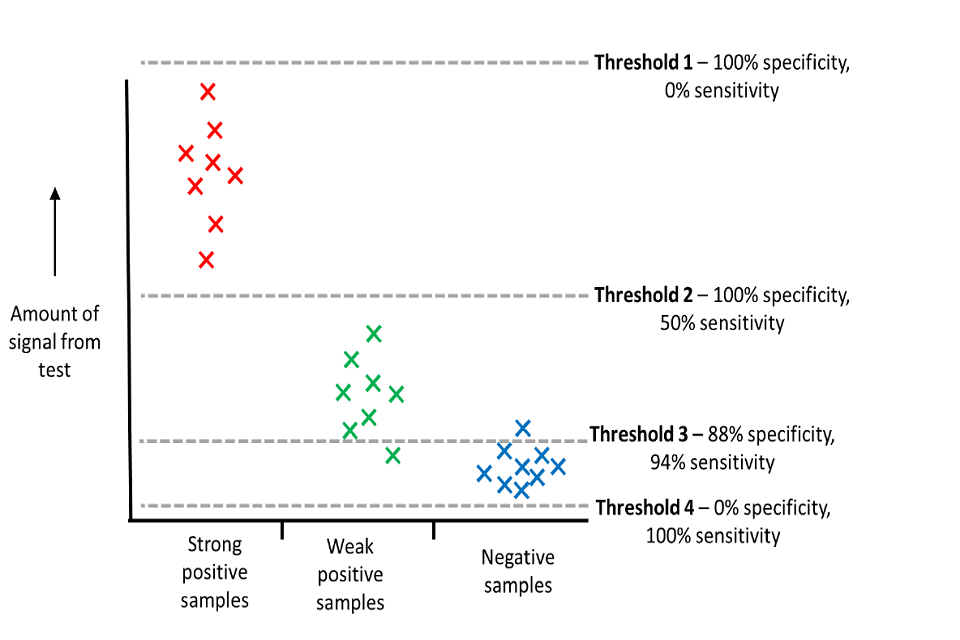
Setting detection thresholds for tests. Strong positive samples (red) produce more signal in a test than weak positive samples (green), which in turn produce more signal than negative samples (blue). The performance of a test is decided by where the detection threshold is set.
Figure 2. Setting detection thresholds for tests. Strong positive samples (red) produce more signal in a test than weak positive samples (green), which in turn produce more signal than negative samples (blue). The performance of a test is decided by where the detection threshold is set.
Four examples of detection thresholds are shown in shown in Figure 2:
- Threshold 1 shows a detection threshold that is set higher than any sample ever reaches. This would be of no practical use, as it would never detect any positive samples, so has a sensitivity of 0 per cent. However, it would always identify all negative samples as negative, so would show 100 per cent specificity.
- Threshold 2 shows a lower detection threshold that detects all 8 strong positive samples. It does not detect the 8 weak positive samples. This threshold gives a 50 per cent sensitivity (8/16). It does not detect any of the negative samples, so it still shows 100 per cent specificity.
- Threshold 3 shows a much lower detection threshold that detects all 8 strong positive samples, and 7 out of 8 of the weak positive samples. One of the weak positive samples gives a false negative result, as it falls below the threshold. The sensitivity is 94 per cent (15/16). However, the test also detects one of the 8 negative samples, giving a false positive with this sample. It shows 88 per cent specificity (7/8).
- Threshold 4 shows a detection threshold that all samples (even negative samples) will exceed. Similarly to threshold 1, this would be of no practical use, as it would never report any negative samples correctly, so has a specificity of 0 per cent. However, it would always identify all positive samples as positive, so would show 100 per cent sensitivity.
Choosing the threshold for a test is always a compromise between sensitivity and specificity, as shown in the simplified example in Figure 2. In this example, the best threshold to choose would be threshold 3, as this is the compromise that would detect most true positives (high sensitivity) while producing relatively few false positives (high specificity). Samples that test close to this threshold will give sporadic results if repeated – they may sometimes fall above or below the threshold because of variation in sampling or processing. Repeating these samples in multiple tests allows a consensus result to be generated, reducing the chance of false negatives.
Annex B
Testing for SAR-CoV-2 infection in populations with low prevalence, [footnote 10] with interactive tool:
Note these calculations assume that the first and second tests have independent errors. This is not always true, even if the tests use different technologies.
Tables: Expected results of scenarios for testing a population of 100,000 people: optimistic and less optimistic test performance at estimated prevalence of 1 in 2000 (scenarios 1 and 2) or 1 in 500 (scenarios 3 and 4)
Scenario 1
Test performance optimistic First test sens 80 per cent, spec 99 per cent Second test sens 99.9 per cent, spec 99.9 per cent Prevalence 1 in 2000
| ——- | Testing strategy | —– |
| ——- | 1 test | 2 test |
| Repeat tests added (n) | — | 1040 |
| Total tests (cumulative n) | 100,000 | 101,040 |
| True + (n) | 40 | 40 |
| False - (n) | 10 | 10 |
| False + (n) | 1000 | 1 |
| True - (n) | 98,951 | 99,949 |
| PPV: true +/all test + ( per cent) | 4 per cent | 98 per cent |
| NPV: true -/all test - ( per cent) | 100 per cent | 100 per cent |
| Overall accuracy ( per cent) | 99 per cent | 100 per cent |
Scenario 2:
Test performance less optimistic: First test sens 80 per cent, spec 96 per cent Second test sens 99 per cent, spec 99 per cent Prevalence 1 in 2000
| —— | Testing strategy | —- |
| —- | 1 test | 2 test |
| Repeat tests added (n) | —- | 4038 |
| Total tests (cumulative n) | 100,000 | 104,038 |
| True + (n) | 40 | 40 |
| False - (n) | 10 | 10 |
| False + (n) | 3998 | 40 |
| True - (n) | 95,952 | 99,910 |
| PPV: true +/all test + ( per cent) | 1 per cent | 50 per cent |
| NPV: true -/all test - ( per cent) | 100 per cent | 100 per cent |
| Overall accuracy ( per cent) | 96 per cent | 100 per cent |
Scenario 3:
Test performance optimistic First test sens 80 per cent, spec 99 per cent Second test sens 99.9 per cent, spec 99.9 per cent Prevalence 1 in 500
| ———– | Testing strategy | ———- |
| ———- | 1 test | 2 test |
| Repeat tests added (n) | —– | 1158 |
| Total tests (cumulative n) | 100,000 | 101,158 |
| True + (n) | 160 | 160 |
| False - (n) | 40 | 40 |
| False + (n) | 998 | 1 |
| True - (n) | 98,802 | 99,799 |
| PPV: true +/all test + ( per cent) | 14 per cent | 99 per cent |
| NPV: true -/all test - ( per cent) | 100 per cent | 100 per cent |
| Overall accuracy ( per cent) | 99 per cent | 100 per cent |
Scenarios 4:
Test performance less optimistic: First test sens 80 per cent, spec 96 per cent Second test sens 99 per cent, spec 99 per cent
Prevalence 1 in 500
| ————– | Testing strategy | —— |
| ——– | 1 test | 2 test |
| Repeat tests added (n) | —— | 4152 |
| Total tests (cumulative n) | 100,000 | 104,152 |
| True + (n) | 160 | 158 |
| False - (n) | 40 | 42 |
| False + (n) | 3992 | 40 |
| True - (n) | 95,808 | 99,760 |
| PPV: true +/all test + ( per cent) | 4 per cent | 80 per cent |
| NPV: true -/all test - ( per cent) | 100 per cent | 100 per cent |
| Overall accuracy ( per cent) | 96 per cent | 100 per cent |
-
Smith LE, Mottershaw AL, Egan M, Waller J, Marteau TM, Rubin GJ. The impact of believing you have had COVID-19 on behaviour: Cross-sectional survey. medRxiv. 2020. https://www.medrxiv.org/content/10.1101/2020.04.30.20086223v1 ↩
-
Lighthouse Laboratory EQA performance and https://www.eurosurveillance.org/content/10.2807/1560-7917.ES.2020.25.27.2001223#htmlfulltext ↩
-
Fowler et al. (2020). A reverse-transcription loop-mediated isothermal amplification (RT-LAMP) assay for the rapid detection of SARS-CoV-2 within nasopharyngeal and oropharyngeal swabs at Hampshire Hospitals NHS Foundation Trust. medRxiv, pre-print. doi: https://doi.org/10.1101/2020.06.30.20142935 ↩
-
SPI-B Consensus Statement on Local Interventions. Presented to SAGE 30 July 2020. https://assets.publishing.service.gov.uk/government/uploads/system/uploads/attachmentdata/file/909383/s0659-spi-b-consensus-statement-local-interventions-290720-sage-49.pdf ↩
-
Grassly et al. Lancet Infect Dis, 2020. https://doi.org/10.1016/S1473-3099(20)30630-7 ↩
-
https://www.gov.scot/publications/coronavirus-covid-19-social-care-staff-support-fund-guidance/pages/fund-criteria/ ↩
-
Larremore et al, 2020, MedRxiv ↩
-
Kucirka et al. (2020). Variation in False-Negative Rate of Reverse Transcriptase Polymerase Chain Reaction–Based SARS-CoV-2 Tests by Time Since Exposure. Annals of Internal Medicine, https://doi.org/10.7326/M20-1495 ↩
-
Sudlow et al. (2020) Testing for coronavirus (SARS-CoV-2) infection in populations with low infection prevalence: the largely ignored problem of false positives and the value of repeat testing. medRxiv, pre-print, doi: https://doi.org/10.1101/2020.08.19.2017813 (for interactive tool – see Ref 11 below) ↩