Survey of Separated Parents
Published 14 July 2022

© Crown copyright 2022
This publication is licensed under the terms of the Open Government Licence v3.0 except where otherwise stated. To view this licence, visit nationalarchives.gov.uk/doc/open-government-licence/version/3 or write to the Information Policy Team, The National Archives, Kew, London TW9 4DU, or email: psi@nationalarchives.gov.uk.
Where we have identified any third party copyright information you will need to obtain permission from the copyright holders concerned.
This publication is available at https://www.gov.uk/government/publications/survey-of-separated-parents/survey-of-separated-parents
DWP ad hoc research report no. 1015
A report of research carried out by Ipsos MORI on behalf of the Department for Work and Pensions. This work was carried out in accordance with the requirements of the international quality standard for Market Research, ISO 20252, and with the Ipsos MORI Terms and Conditions
Crown copyright 2022.
You may re-use this information (not including logos) free of charge in any format or medium, under the terms of the Open Government Licence
Or write to:
Information Policy Team
The National Archives
Kew
London
TW9 4DU
Email: psi@nationalarchives.gov.uk
This document/publication is also available on our GOV.UK website
If you would like to know more about DWP research, email: socialresearch@dwp.gov.uk
First published July 2022
ISBN 978-1-78659-399-3
Views expressed in this report are not necessarily those of the Department for Work and Pensions or any other government department.
Executive summary
Ipsos MORI and DWP undertook a survey of 2,489 non-matched separated parents, to explore how they made provisions for childcare and support. The sample comprised 1,555 parents with care (PWCs) and 934 non-resident parents (NRPs). Parents were non-matched, meaning they were not once a part of the same couple. The survey findings have been weighted to be representative of the full population of separated parents, by age, gender and parent type (PWC or NRP).
Insights into arrangements for child support and care
Most parents had arrangements for financial support, though there were differences in reporting between PWCs and NRPs. Most of these arrangements were informal.
Affordability and the quality of parental relationships were key barriers to having arrangements for financial support. Parents with more amicable relationships and less conflict were more likely to have arrangements that worked for them, typically through a family-based arrangement (FBA).
The Child Maintenance Service (CMS)
This service is available to parents who have not been able to reach private arrangements about how their child’s living costs will be paid. A quarter of parents had used the CMS to make financial support arrangements. CMS use was common among parents with complex circumstances and financial constraints.
Complying with financial agreements
NRPs were largely compliant with upholding financial agreements and paying all or most of the money that was agreed or calculated. Among those who did not provide all of the money, affordability was a key contributor to non-compliance, and particularly affected parents from low-income households.
Parental conflict, relationships and parental care
Parents that did not have any contact with the other parent of their child had the most complex circumstances and strained relationships.
Among parents who did have contact with each other, conflict was a barrier to being able to make child maintenance arrangements. Parents with low conflict were more likely to make joint decisions on important childcare matters, and to have FBAs.
Support for separated families
PWCs were more likely to benefit from receiving financial and non-financial support from family members, however, the majority of NRPs reported they received no support at all from their extended families.
Impact of separation
Parents with higher household incomes were more likely to report that they were better able to support their child financially, following their separation. Over half of parents had accessed at least one type of benefit as a result of their separation. This was more common among PWCs and parents that used the CMS.
Conclusions
Given that income and affordability were key factors in parents’ decision-making about arrangements for support, both NRPs and PWCs expressed a desire for support to help the NRP to achieve financial security and stability.
Conflict was a key factor in determining the quality of parental relationships, and how often the NRP saw their child. It might be possible that supporting parents to resolve or minimise conflict could help more parents to reach FBAs. However, the CMS is performing an important role for parents who may otherwise be without any financial arrangement.
Acknowledgements
This research was commissioned by the Department for Work and Pensions. The authors would like to thank Eleanor Doyle and Erin Watkins who have provided the key point of contact and support.
Authors
Krishna Dabhi, Ipsos MORI
Tarini Anand, Ipsos MORI
Trinh Tu, Ipsos MORI
Glossary
| Term | Definition |
|---|---|
| Both | The NRP provides both financial support and non-financial care |
| Child maintenance online calculator | A free tool provided by the Child Maintenance Service (on GOV.UK) that allows parents to work out an amount of child maintenance for their child(ren). It factors in things like overnight stays. This tool is available to everybody, not just CMS users |
| Child Maintenance Options service | A free service that provides impartial information and support to help separated parents make decisions about their Child Maintenance arrangements. After using the Child Maintenance Options Service some parents make private arrangements, and others go on to use the CMS for their arrangements. The Child Maintenance Options service is the first point of contact for anyone looking to use the CMS |
| Child Maintenance Service | A support service provided by DWP for parents who have not been able to make a private arrangement about how their child’s living costs will be paid |
| CMS users | Financial support has been arranged via the Child Maintenance Service. Money is either collected by the CMS (Collect and Pay), or paid directly between the NRP and the PWC (Direct Pay) |
| Conflict | Parents were asked four questions about how often discussions on important matters about their child resulted in negative outcomes. Their responses were scored from 1-5, where ‘Always’ was given a score of 1, and ‘Never’ was given a score of 5. High conflict is the top third of all scores, Medium is the middle third, and Low is the bottom third (this could also mean there was no conflict) |
| Enforcement measures by the Child Maintenance Service | Without a court order, the CMS has a range of powers to collect arears. These include: * Deduction from Earnings Order: An employer deducts payment for arrears direct from the Paying Parent’s salary * Deduction Order: a lump sum or regular deductions are made from bank accounts * Collection of Assets: money can be taken from a deceased paying parent’s estate With a court order, the CMS can: * force the sale of a paying parent’s property * Disqualify paying parent from driving * Hold a paying parent’s passport * Impose a prison sentence on the paying parent |
| Family Based Arrangement | Financial arrangements that are made or agreed privately |
| Family court | This support is used if the parents want a court to make a decision or have concerns about domestic abuse or child abuse. Most people must attend a Mediation Information and Assessment Meeting before going to court |
| Financial arrangement | The NRP provides financial support for the child, for example via monthly payments or paying for goods and services |
| Lawyer or solicitor | Lawyers can provide advice to parents about their options when deciding their child maintenance arrangement. It could progress to the court, but it does not have to |
| Local mediator / Arbitration / Relationship support | Independent professionals who support families through their separation. They are alternatives to going to court. Most people are required to attend a Mediation Information and Assessment Meeting before going to court |
| Non-financial arrangement | The NRP provides non-financial care, for example overnight stays or school pick-ups |
| Non-resident parent | Parents who are not the main carer |
| Not working or economically inactive | Individuals who were not working, self-employed or looking for work. This includes those who were looking after the home, retired, permanently sick or disabled, students and full-time carers |
| Parent with care | Parents who have the main day-to-day care of their child(ren) |
| Separated parent | Individuals who are parents of children under the age of 16 (or under 20 if in education or training) and are no longer in a relationship (or never have been in a relationship) with the other parent of their child |
| Support from a charity or public organisation e.g. Citizen’s Advice, Gingerbread | Independent organisations that provide advice and support to separating and separated parents |
1. Introduction
This report presents findings from a survey of separated parents undertaken on behalf of the Department for Work and Pensions (DWP). The research was commissioned to explore the nature of child maintenance arrangements that separated parents have, and to understand the effectiveness of these arrangements.
1.1. Research objectives
The DWP’s Outcome Delivery Plan 2021/22 reflects DWP’s vision to improve people’s quality of life through a wide range of services which support financial resilience throughout the lifetime of its customers – from the Child Maintenance Service to working-age benefits to the State Pension. Priorities for child maintenance sit underneath Priority Outcome 3: Address poverty through enabling progression in the workforce and increasing financial resilience. DWP publish experimental statistics which estimate that in 2020, 56% of separated families had some form of child maintenance agreement[footnote 1] . This is based on a PWC perspective only. Findings on arrangement prevalence differ in this report and this may be due to different samples as well as different definitions of an arrangement.
There is limited information about the experiences, opinions and support needs of separated parents when it comes to making child maintenance arrangements, particularly for those outside of the CMS. There is also very little research from the perspective of the non-resident parent to explore the type of support that they are able to provide and potential barriers in playing a greater role in the care of their child.
Ipsos MORI was commissioned to undertake a survey to bridge this evidence gap, to enable DWP to support more of these families to set up effective private child maintenance arrangements. Specifically, the principal aims of the research were to understand:
- What maintenance arrangements are used, and what factors influence separated parents’ choice of arrangements?
- How effective are different arrangements for different groups of parents?
- How can separated parents be supported to reach a Family Based Arrangement (FBA)?
- What other factors influence a good quality child maintenance arrangement?
1.2. Summary of the methodology
The focus of the research was on non-matched separated parents who:
- Had children under the age of 16 (or under 20 if in education or training); * Were no longer in a relationship or never had been in a relationship with the other parent of their child.
The research involved telephone and online interviews with 2,489 separated parents (including 1,555 parents with care (PWCs) and 934 non-resident parents (NRPs) to obtain a representative view. Participants were sampled from three DWP sources, including separated parents who took part in the DWP Family Resources survey and agreed to be contacted for further research, and from DWP records of Child Maintenance Service users and Universal Credit claimants. In addition, Ipsos MORI screened for eligible separated parents to take part in the survey using our random probability Knowledge Panel.
The survey findings from all four sources were combined and weighted to be representative of the full population of separated parents by age, gender and type of parent (PWC or NRP)
The research fieldwork took place between 19 February to 23 March 2021. Further details can be found in the Technical Annexe.
1.3. Interpreting the findings
This report presents weighted findings and provides comments on changes or differences that are statistically significant. Reporting on small base sizes (less than 100 individuals) are noted. Where figures do not sum to 100%, this is either due to rounding or because survey participants were able to select more than one answer.
The responses of PWCs and NRPs are generally reported separately to highlight the different perspectives of the two groups of parents. In producing aggregated figures, the response of each individual NRP is assigned a larger weight to ensure that the weighted populations of PWCs and NRPs are similar in size.
2. Insights into arrangements for child support and care
Overview of arrangements and their effectiveness
This section provides a snapshot of the survey population’s care arrangements and an overview of their effectiveness. Detailed analysis is provided in the remainder of this chapter.
Defining arrangements
In the survey, both PWCs and NRPs were asked about the ways in which the NRP provided care for their child. Parents were able to select one of four options: only financial support, only non-financial care, both financial and non-financial care, or none of these. In the analysis, all parents who selected either only financial support or both financial and non-financial care were defined as having financial arrangements. On the other hand, all parents who selected either only non-financial care or both financial and non-financial care were defined as having non-financial arrangements, as demonstrated in Figure 1 below:
Figure 1: Arrangements in place
| Arrangement | Total | PWCs | NRPs |
|---|---|---|---|
| Only financial | 24% | 25% | 23% |
| Both | 40% | 24% | 58% |
| Only non-financial | 10% | 13% | 6% |
| No arrangements | 26% | 38% | 13% |
As Figure 1 demonstrates, more parents (40%) had arrangements for both types of care, while 24% had arrangements for financial support only, and 10% had arrangements for non-financial care only; a quarter of parents (26%) did not have any arrangements. NRPs were more likely to report providing care than PWCs were to report receiving it.
Financial arrangements
Among the two-third (64%) of parents that had arrangements for financial support, most (60%) had FBAs while a quarter (27%) had used the CMS to make these arrangements. PWCs were more likely than NRPs to report using the CMS; this is demonstrated in Figure 2 below:
Figure 2: Arrangements for financial support – this figure is made up of 3 charts
Parents with financial support arrangements
| Parents with financial support arrangements | Percentage |
|---|---|
| Only financial support | 24% |
| Both financial and non-financial | 40% |
| Total | 64% |
Proportion that had used CMS
| Proportion that had used CMS | Percentage |
|---|---|
| Overall | 27% |
| PWCs | 35% |
| NRPs | 22% |
Proportion that had an FBA
| Proportion that had an FBA | Percentage |
|---|---|
| Overall | 60% |
| PWCs | 56% |
| NRPs | 62% |
Satisfaction with arrangements
Among parents that had arrangements (financial and/or non-financial), the following groups were more likely to be satisfied with their current arrangements:
- Parents with arrangements for both types of support
- Parents with FBAs for financial support; and
- PWCs
On the other hand:
- Parents with arrangements for financial support only
- CMS users
- NRPs
were more likely to say they would like to have alternative arrangements; this is demonstrated in Figure 3 below:
Figure 3: Parents that want alternative arrangements
| Parents | Financial arrangement | Proportion that would like alternative arrangements |
|---|---|---|
| All parents | Financial only | 42% |
| All parents | Non-financial | 37% |
| All parents | Both types | 29% |
| All parents | CMS users | 50% |
| All parents | FBA | 26% |
| PWC | Financial only | 32% |
| PWC | Non-financial | 32% |
| PWC | Both types | 25% |
| PWC | CMS users | 37% |
| PWC | FBA | 24% |
| NRP | Financial only | 53% |
| NRP | Non-financial | 48% |
| NRP | Both types | 31% |
| NRP | CMS users | 62% |
| NRP | FBA | 27% |
Parents without arrangements
A quarter of parents (26%) reported not having any arrangements for support; PWCs (38%) were more likely than NRPs (13%) to say this. Among those without arrangements, nearly half (47%) would not like to have arrangements, but 38% would. This is demonstrated in Figure 4 below:
Figure 4: Parents without arrangements
| Parents | Did not have support arrangements – % | would like to have an arrangement – % | would not like to have an arrangement – % |
|---|---|---|---|
| Overall | 26% | 38% | 47% |
| PWCs | 38% | 35% | 52% |
| NRPs | 13% | 49% | 29% |
This chapter explores the types of child maintenance arrangements that separated parents had, and how effective these were. This chapter also explores what separated parents would ideally want their arrangement to look like, and the support needs of parents without arrangements.
2.1. Types of child maintenance agreements
The survey explored the types of support arrangements that separated parents had in place, either verbally or in writing, even if these arrangements were not upheld in practice.
Most separated parents had financial arrangements. Two-thirds of parents (64%) reported that the non-resident parent (NRP) provided financial support for their child. This included regular payments (such as on a monthly basis) or by paying for goods and services that the child needed. In comparison, half of parents (50%) reported having arrangements for non-financial care, such as overnight stays or school pick-ups. A quarter of parents (26%) did not have arrangements for support.
There were stark differences in reporting between the two types of parent, with NRPs more likely to report that they provided support. Eight in ten NRPs (81%) reported that they provided financial support, but less than half of parents with care (PWCs) (48%) reported that they received this from the NRP. Similarly, two-thirds of NRPs (64%) reported that they provided non-financial care but, again, less than half of PWCs (37%) who reported that they received this from the NRP. These arrangements are typically informal (or agreed verbally), which may explain some of these differences in reporting. However, it is also likely that parents were considering different things when answering the question. Some parents (4%) were only considering arrangements that were upheld when answering the question about whether arrangements are in place, meaning the proportion of parents with arrangements may be slightly higher than reported by parents.
Some of these differences may also be explained by a higher proportion of PWCs who:
- had never been in a relationship with the other parent (6% compared to 3% of NRPs)
- had a child with SEND (26% compared to 17% of NRPs), or
- were not working or economically inactive (26% of PWCs and 17% of NRPs)
These characteristics were correlated with the types of arrangement that parents had.
Figure 5: Arrangements in place, by parent type
| Arrangement | PWC | NRP |
|---|---|---|
| Both | 24% | 58% |
| Only financial support | 25% | 23% |
| Only non-financial care | 13% | 6% |
| None of these | 38% | 13% |
| Overall who say NRP provides financial support (either on its own or along with non-financial care) | 48% | 81% |
| Overall who say NRP provides non-financial care (either on its own or along with financial support) | 37% | 64% |
Base: All PWCs (1,555 and NRPs (934)
Overall, a quarter of parents reported having arrangements for financial support only, and 10% reported having arrangements for non-financial care only. However, having arrangements for both types was more common (40%). Again, there were differences in reporting between the two types of parent; 58% of NRPs and 24% of PWCs reported having arrangements for both types of support. Having arrangement for both types was common among parents who:
- reported that the NRP had frequent contact with their child (67% of those who saw their child more than once a week compared to 4% that never saw their child)
- had low levels of conflict (see the glossary for the definition of conflict) (58% compared to 39% with high conflict)
- had less complex circumstances, for example, when the child did not have SEND (44% compared to 31% that did).
These findings suggest that the quality of parental relationships is key to having arrangements for both types of care.
2.2. Financial support arrangements
2.2.1. The characteristics of parents with financial agreements
Two-thirds of separated parents (64%) had arrangements for financial care. As described in the previous section, this was higher among parents that had amicable relationships and those with less complex circumstances. NRPs were also more likely to provide financial support if they had frequent contact with their child. For example, 78% of parents who reported that the NRP saw their child more than once a week provided/received financial support, compared to 39% that never saw their child. Arrangements for financial support also increased if the parents had been in a relationship for longer prior to separation, or had been separated for longer periods of time. For example, two-thirds (66%) of parents that had been separated for five years or more had financial arrangements, compared to 57% who had been separated for less than a year, possibly because recently-separated NRPs were still finding their feet and therefore less able to afford financial payments (see section 2.2.5).
Income - and therefore affordability - was also a key contributor to having financial arrangements. Parents from higher income households were more likely to report having arrangements for financial support, as shown in Figure 6 below. Similarly, parents that were working or self-employed (70%) or furloughed (80%) were more likely than parents that were not working and inactive (50%) to have financial arrangements. These findings indicate that some parents on lower income may not be providing financial support because they lack the financial means.
Figure 6: Whether the NRP provides financial support, by total household income
D1. Provide financial support PWCs: In what ways, if at all, does the NRP provide care for your child? NRPs: In what ways, if at all, do you provide care for your child?
| Income | Percentage |
|---|---|
| Less than £10k | 52% |
| £10k to <£20k | 57% |
| £20k to <£30k | 69% |
| £30k to <£50k | 76% |
| £50k + | 81% |
Base: All separated parents with a total household income of less than £10,000 (430), between £10,000 - £19,999 (658), between £20,000 - £29,999 (398), between £30,000 - £49,999 (318 or £50,00 and higher (272)
2.2.2. Arranging financial support
Overall, the majority of parents (60%) with financial arrangements agreed these privately via a Family Based Arrangement (FBA). This included 51% of parents who had verbal agreements and nine percent who had written agreements, suggesting that arrangements were typically informal. NRPs (11%) were more likely than PWCs (5%) to report having a written agreement.
More parents with amicable relationships had FBAs. Three-quarters of parents with low levels of conflict (75%) had arranged their financial support privately, compared to half (52%) of parents with high conflict. Similarly, three-quarters (74%) of parents that reported the NRP saw their child more than once a week had an FBA, compared to 26% that never saw their child. This again highlights that the quality of parental relationships was important for having private arrangements.
The Child Maintenance Service (CMS) is available to parents who have not been able to reach a private arrangement for their child’s living costs. A quarter of parents with financial arrangements (27%) reported using the Child Maintenance Service (CMS) to make their arrangement. Overall, nine percent of parents with financial arrangements used CMS Collect and Pay (where money is collected by the CMS) and 18% used CMS Direct Pay (where money is paid directly by the NRP to the PWC). Use of the CMS is usually initiated by the PWC, and consequently PWCs were more likely than NRPs to report using the CMS, as shown in Figure 7 below. The CMS was most commonly used in situations where the NRP had no contact with their child (60% used the CMS, compared to 13% who said the NRP saw their child more than once a week).
Figure 7: How financial support is arranged, by parent type. The survey did not capture what “other” answers included
D4. How is the financial support between you and the other parent arranged?
| Financial support arrangement | PWC | NRP |
|---|---|---|
| CMS - money is collected by the CMS | 12% | 7% |
| CMS - money is paid directly | 23% | 15% |
| CMS - unspecified | 1% | 1% |
| Through a court order | 2% | 3% |
| Arranged privately - verbal | 51% | 51% |
| Arranged privately - written | 5% | 11% |
| Other | 5% | 11% |
| Don’t know | 2% | 1% |
Base: PWCs (803) and NRPs (799) who provide/receive financial support
Decision-making around private financial arrangements
The survey explored how parents calculated the amount of financial support that the NRP provided. Affordability was at the forefront when it came to making decisions. Half of separated parents (47%) with FBAs reported that they considered what was affordable when calculating the amount of financial support. It was a bigger concern:
- for parents that were not working or were economically inactive (for example, in training or looking after the household). Over half (58%) of parents that were not working or were economically inactive cited affordability, compared to 44% who were working or self-employed.
- when the NRP had re-partnered (54% compared to 44% where both parents had re-partnered or 40% when the PWC had), reflecting potential changes in their financial obligations.
Figure 8: How parents calculate the amount of financial support that the NRP provides. Top answers shown only
D1. PWCs: How did you calculate the amount of financial support that the NRP provides? NRPS: How did you calculate the amount of financial support that you provide?
| How support was calculated | PWC | NRP |
|---|---|---|
| Considered what was affordable | 50% | 45% |
| Used online CMS calculator | 27% | 38% |
| Looked at child’s outgoing and expenses | 21% | 22% |
| Considered PWC’s income | 13% | 18% |
| Considered number of overnight stays | 9% | 12% |
| We agreed on the amount | 3% | 5% |
| Ad hoc payments / when required | 2% | 3% |
| Split 50:50 | 3% | 1% |
Base: PWCs (388) and NRPs (318) with private arrangements for financial support
A third of parents (34%) had used the online calculator on the CMS website to calculate the amount of financial support provided. NRPs (38%) were more likely than PWCs (27%) to report using this. However, they were equally likely to cite other factors that were taken into account when calculating the amount of financial support they would provide/receive, such as looking at the child’s outgoing and expenses (22% of NRPs and 21% of PWCs), or considering the PWC’s income and affordability (18% of NRPs and 13% of PWCs).
2.2.3. Types of financial support
The survey also explored what types of financial support the NRP provided. Among those with private arrangements for financial support (FBAs), ongoing monthly payments was a key component of what the NRP provided. Three-quarters of NRPs (77%) and two-thirds of PWCs (68%) reported that the NRP provided ongoing, monthly payments.
Figure 9: Financial support that the NRP provides, by parent type
D5. PWCs: What types of financial support does the NRP provide? NRPs: What types of financial support do you provide?
| Type of financial support | PWC | NRP |
|---|---|---|
| Pay ongoing monthly payments | 68% | 77% |
| Pay for goods or services | 32% | 53% |
| Pay for daily expenses | 16% | 30% |
| Pay for ongoing costs | 13% | 20% |
| Other | 11% | 11% |
Base: PWCs (388) and NRPs (318) with private arrangements for financial support
NRPs were more likely to report providing other types of financial support than PWCs were to report receiving it. For example:
- over half (53%) of NRPs said they paid for goods and services (such as school uniforms, leisure trips or meals at restaurants) compared to a third (32%) of PWCs
- three in ten (30%) NRPs said they paid for daily expenses (such as food or travel) compared to 16% of PWCs
- one in five NRPs (20%) said they paid for ongoing costs (such as rent, school tuition, medical expenses or school dinners) compared to 13% of PWCs.
Again, it is likely that some of these differences in reporting were a result of having informal agreements or considering different things when answering the question.
Across the board, parents with higher levels of household income, and parents who reported that the NRP saw their child frequently were more likely to report providing/receiving all these types of financial support. This is because household income and frequency of NRP contact are related. For example, 39% with a household income of £50,000 or more said the NRP saw their child more than once a week, compared to 30% with an income below £20,000. Similarly, 12% with a household income of £50,000 or more reported that the NRP never saw their child, compared to 32% with an income below £10,000. The findings indicate that affordability could be an important factor in decisions on financial support, with better-off NRPs more able to provide financial support as well as having greater opportunity to provide this support through regular contact with their child.
2.2.4. Support provided outside of CMS payments
Among parents using the CMS, the survey captured whether NRPs provided other types of financial support, outside of any monthly CMS payments. PWCs were more likely to report that the NRP did not provide any additional payments. In total, eight in ten PWCs (81%) and a third of NRPs (34%) said that the NRP did not provide additional payments. Again, this might be explained by differences in what parents considered (and how regularly these other payments were made) when they answered the question.
Outside of CMS payments, NRPs were more likely to report paying for:
- goods and services such as school uniforms (49% compared to 10% of PWCs),
- daily expenses such as food and travel (31% compared to 4% of PWCs),
- ongoing monthly payments (17% compared to 6% of PWCs), or
- ongoing costs such as rent (13% compared to 3% of PWCs).
Figure 10: Other types of financial support that NRPs provide, by parent type
D9. PWCs: Outside of any monthly CMS payments, with other types of financial support, if any, does the NRP provide? NRPs: Outside of any monthly CMS payments, what other types of financial support, if any, do you provide?
| Other support | PWC | NRP |
|---|---|---|
| Pay for goods or services | 10% | 49% |
| Pay for daily expenses | 4% | 31% |
| Pay ongoing monthly payments | 6% | 17% |
| Pay for ongoing costs | 3% | 13% |
| Other | 4% | 17% |
| None of these | 81% | 34% |
Base: PWCs (351) and NRPs (400) who used CMS
Again, parents who reported that the NRP saw their child frequently (which was more common among parents with higher household incomes) were more likely to report providing/receiving these other types of financial support. For example, 70% of those who said the NRP saw their child more than once a week reported they paid/received additional support, compared to 18% who never saw their child.
2.2.5. Barriers to having financial arrangements
Where NRPs were not providing financial support, this survey captured the reasons as to why this was. Often, NRPs were not providing support because parents felt they could not afford to provide it. Overall, four in ten (42%) parents who did not provide/receive financial support said that this was because the NRP could not afford it. Affordability was more commonly cited by parents who had been separated from each other for less than a year (61% compared to 39% who had been separated for longer), or those with low levels of conflict (60% compared to 33% who had high conflict[footnote 2]) suggesting a greater level of empathy among parents with more amicable relationships.
Other reasons for not providing financial support included that:
- the NRP provided other forms of support instead (22%),
- the NRP was not interested or willing to provide financial support (20%), or
- the PWC did not want to receive financial support from the NRP (13%).
These are shown in Figure 11 below:
Figure 11: Reasons that the NRP does not provide financial support
D12. PWCs: For what reasons, if any, does the NRP not provide financial support? NRPs: For what reason, if any, do you not provide financial support?
| Reasons | Percentage |
|---|---|
| NRP cannot afford to provide it | 42% |
| NRP provdes other types of support | 22% |
| NRP is not interested/willing to provide it | 20% |
| PWC does not want to receive this support from NRP | 13% |
| We have an arrangement but it is not upheld in practice | 8% |
| We were unable to reach an agreement | 5% |
| We are working on an arrangement | 3% |
| Health / mental health issues / drug / alcohol abuse | 2% |
| Other | 4% |
| Don’t know | 6% |
Base: Separated parents (242) who do not receive/provide financial support
2.2.6. About the Child Maintenance Service
Child Maintenance Options is a free service that provides impartial information and support to help separated parents make decisions about their Child Maintenance arrangements. The service includes a calculator that parents can use to work out the amount of maintenance.
After using the Child Maintenance Options Service some parents make private arrangements, and others go on to use the Child Maintenance Service (CMS) for their arrangements. CMS is available to parents who have not been able to reach a private arrangement for their child’s living costs. It includes Direct Pay (where payment is transferred between the parents themselves) and Collect and Pay (where the CMS collects the payment from the NRP).
2.2.7. Characteristics of CMS users
Of parents reporting that financial support was provided, a quarter (27%) said that this was arranged through the CMS (this equated to 17% of all separated parents). PWCs (35%) were more likely than NRPs (22%) to say this, with a larger number of NRPs reporting private arrangements.
CMS use was common to parents that had more strained relationships or complex circumstances. Use was higher among parents with high levels of conflict (34% used CMS compared to 13% with low levels of conflict) or those did not have contact with the other parent (56%). They were also likely to report that the NRP never saw their child (60% used CMS compared to 13% who saw their child more than once a week). These types of parents typically had arrangements for only financial support (42%) rather than for both types (18%).
CMS users were also more likely to have complex circumstances. For example, a third (34%) of parents of children with SEND had used the CMS (compared to 25% without) and they also came from lower-income households (24% of CMS users had an income of £30,000 or more, compared to 35% of parents with an FBA).
Together, the findings suggest that the service is providing valuable support to parents who may be unable to reach a private agreement on their own.
2.2.8. Child Maintenance Service calculations
The Child Maintenance Service calculation is based on the NRP’s income, and takes into account additional factors such as overnight care they provide for the qualifying child, and any other children living in their household or for which they provide support. Parents that had used the CMS for their arrangement were asked what elements were factored into their CMS calculation. This question was asked to find out more about what was included in their calculation, as opposed to what they thought should have been included[footnote 3]. Section 2.5.3 explores parent opinion on what should be accounted for when calculating a child maintenance amount.
Just below half of CMS users (44%) reported that the calculation factored in the cost of overnight care, and one in ten (10%) reported their arrangement factored in costs that may be incurred by the NRP to maintain contact, such as travel or accommodation costs. There were a proportion of parents who did not know what the calculation factored in; one in five (21%) did not know if overnight care costs were factored in, and a quarter (25%) did not know if costs incurred by the NRP were factored in. This indicates that some parents are not aware of how their calculation was composed.
Seven in ten (69%) who said the NRP saw their child more than once a week reported that the CMS calculation factored in the cost of overnight care, compared to 20% who said the NRP never saw their child. This indicates that the calculation is factoring in overnight care for people who see their children more regularly, which would be expected. However, these findings also suggest that some respondents may have misinterpreted the question to be about the NRP’s contribution towards overnight care; the question was not explicit that overnight care relates to costs incurred by the NRP for when the child stays overnight with them. This means that the actual proportion of CMS calculations that factor in overnight care may be lower than reported by survey respondents.
Figure 12: Elements of the CMS calculation factored in, by parent type – this figure is made up of 2 charts
D7. Did the Child Maintenance Service calculation factor in….?
Overnight care
| Response | PWC | NRP |
|---|---|---|
| Yes | 48% | 41% |
| No | 29% | 40% |
| Don’t know | 23% | 19% |
Costs incurred for NRP to maintain contact
| Response | PWC | NRP |
|---|---|---|
| Yes | 15% | 5% |
| No | 50% | 79% |
| Don’t know | 34% | 5% |
Base: PWCs (351) and NRPs (400) who used the CMS
Parents of children with SEND were less likely to report that the CMS calculation factored in overnight care (49% compared to 36% with SEND). This tallies with the findings that findings that parents of children with SEND were more likely to report that the NRP never sees their child (33% compared to 19% without SEND). This is also demonstrated when looking at ethnicity. White parents were more likely than ethnic minority parents to report that the CMS calculation factored in the cost of overnight care (46% compared to 35%). This tallied with findings that show that ethnic minority parents are more likely to report that the NRP never sees their child (30% compared to 22%).
Around two in ten parents (21%) did not know whether overnight care was factored into their calculation (23% of PWCs and 19% of NRPs). There were higher levels who reported not knowing whether overnight care was factored in among those who reported that the NRP never saw their child (28% compared to 18% who saw their child every other week or weekend). It was also high among those parents who did not have contact with one another (32%).
2.3. Non-financial support arrangements
2.3.1. The characteristics of parents with non-financial agreements
Half of parents (50%) had arrangements for non-financial care. NRPs were nearly twice as likely (64%) as PWCs (37%) to report providing/receiving non-financial care – a similar pattern to financial care. Again, this difference may be explained by the informal nature of these agreements and parents considering different things when answering the question.
As with financial support, agreements about non-financial care were common to parents with more amicable relationships. For example, 71% of parents with low levels of conflict reported that the NRP provided non-financial care, compared to 52% with high conflict. Similarly, 83% of parents who reported that the NRP saw their child more frequently (more than once a week) had arrangements for non-financial care, compared to five percent who said the NRP never saw their child. These findings reinforce the importance of good relationships between separated parents on NRPs’ ongoing contact with, and support for, their child.
Providing non-financial care was also common among parents with less complex circumstances. For example, over half of parents of children without SEND (53%) said they provided/received non-financial support, compared to 41% of parents of children with SEND. Similarly, over half of parents without long-term health conditions or disabilities (54%) had non-financial arrangements, compared to 43% with. The findings suggest that parents with more complex circumstances or vulnerabilities may require external support to make arrangements for non-financial care.
As with financial support, parents from higher income households were more likely to have arrangements for non-financial care. Two-thirds (64%) of parents with a household income of £50,000 or more had non-financial arrangements, compared to 41% below £10,000. This suggests that some parents on lower income may require support to reach non-financial agreements.
CMS users were least likely to have arrangements for non-financial care (42%) compared to parents with FBAs (73%) or those who arranged financial support via a court or in other ways (59%). Parents who uses the CMS were more likely to have high conflict and lower household income, making it more difficult for them to reach non-financial arrangements without support (since the CMS is focused on financial support).
2.3.2. Types of non-financial care
The survey explored what types of non-financial support was provided by the NRP. Among parents who had arrangements for non-financial care, the most common form was overnight stays. A similar proportion of PWCs (83%) and NRPs (79%) with non-financial arrangements reported having arrangements for overnight stays. Arrangements for overnight stays were also higher among parents of children aged 5-15 (86%) and parents that were working or self-employed (85% compared to 69% that were not working or were economically inactive).
However, parents’ views differed when it came to other types of care that NRPs provided, as shown in Figure 13 below. These types of care were more likely to be subjected to differences in recall between NRPs and PWCs compared to overnight stays, but lack of awareness of what the NRP provides may also play a part. Consequently, NRPs were more likely to report providing non face-to-face contact, daytime care, school pickups, help with homework, or general support (for example with shopping) than PWCs were to report receiving them.
Figure 13: Types of non-financial care that NRPs provide, by parent type. Top answers shown only
D2. PWCs: What types of non-financial care does the NRP provide? NRPs: What types of non-financial care do you provide
| Type of care | PWC | NRP |
|---|---|---|
| Overnight stays/care | 83% | 79% |
| Non face-to-face contact (e.g. calls) | 43% | 64% |
| Daytime care | 44% | 55% |
| School pick ups | 38% | 51% |
| Help with homework | 21% | 57% |
| General support (e.g. shopping) | 22% | 47% |
| Advice / emotional support | 1% | 2% |
| Leisure / holidays / trips | 1% | 2% |
Base: PWCs (570) and NRPs (564) who provide/receive non-financial support
As with financial care, non-financial care was also more common when the NRP had frequent contact with their child. For example, when NRPs saw their child more than once a week, parents were more likely to have arrangements for overnight stays (86% compared to 75% among those where the NRP had contact only once a week).
2.3.3. Arranging non-financial care
As described earlier, arrangements for care were typically informal and this gives rise to differences in opinions between NRPs and PWCs about what is provided or received. Over half (56%) of those who provided/received non-financial support did not have an agreement about it. NRPs (59%) were more likely than PWCs (50%) to report not having agreements about what would be provided.
Figure 14: Whether parents have agreements about non-financial care, by parent type
| Agreements | PWC | NRP |
|---|---|---|
| Yes - a verbal agreement | 37% | 26% |
| Yes - a written agreement | 9% | 9% |
| Yes - other | 3% | 3% |
| No | 50% | 59% |
| Don’t know | 1% | 2% |
Base: PWCs (570) and NRPs (564) who provide/receive non-financial support
On the other hand, PWCs were more likely to say they did have an agreement about non-financial support (49% compared to 38% of NRPs). These were usually verbal agreements (37% of PWCs and 26% of NRPs), rather than written ones (9% each). Agreements were more common when the parents had been separated for less than a year (53% compared to 41% who had been separated for longer). This suggests that agreements may not be keeping pace with changes in circumstances such as re-partnering, or as the child’s needs change overtime. Parents may require support to review their arrangements over time.
2.4. Parents without arrangements
2.4.1. The characteristics of parents without arrangements for support
A quarter of parents (26%) did not have arrangements for support. PWCs were more likely to report that they did not have arrangements for support (38% compared to 13% of NRPs), which may reflect the informal nature of some arrangements and how often (if at all) arrangements were upheld.
As described earlier, some NRPs were less willing to provide support if they were not closely involved in their child’s upbringing. This was also evident in the types of parents that did not have arrangements for support. For example, not having an arrangement was common:
- if the NRP never saw their child (60%) or saw them less often than once a fortnight (36%), compared to when the NRP saw their child more often (e.g. 6% where the NRP saw their child more than once a week).
- among parents that had never been in a relationship with each other (54%) or where the NRP had re-partnered since separating (35%).
Parents without arrangements for support also tended to have more complex circumstances. For example, parents of children with SEND (34% compared to 23% without) and those with long-term health conditions or disabilities themselves (34% compared to 22% without) were more likely to report not having an arrangement. Similarly, not having an arrangement was common among participants that were not working or were economically inactive (39% compared to 21% that were working or self-employed) and among parents with low household incomes (33% below £20,000 compared to 18% with higher incomes). This suggests that the CMS may not be fully reaching more vulnerable parents who may benefit from external support to make child maintenance arrangements.
2.4.2. Barriers to having an arrangement
The survey explored what the barriers to having arrangements were.
Relationship factors, conflict and affordability were broadly the main barriers to having an arrangement. However, there were stark differences in opinion on the reasons for not having an arrangement in place, with NRPs more likely than PWCs to cite multiple barriers. For example:
- PWCs were five times more likely (48%) than NRPs (9%) to report that the NRP was not willing to provide support,
- NRPs (39%) were three times more likely than PWCs (12%) to report that the PWC was not open to receiving support or having contact.
The findings suggest that parents who don’t see eye to eye are unlikely to reach a satisfactory arrangement among themselves.
New family formation was a key barrier to NRPs being willing to provide support. Specifically, NRPs that had re-partnered since separation were less likely to do this (55% compared to 24% when neither parent had re-partnered). Similarly, parents who had been separated from each for longer were more likely to say the NRP did not want to provide support (44% who had been separated for 5 years or more, compared to 26% who had been separated for less than a year). This suggests that changes in circumstances over time may affect NRPs’ willingness to continue offering support.
The quality of parental relationships was also a key barrier to having arrangements. Parents who had high levels of conflict were more likely to say the NRP was not willing to provide support (46% compared to 24% with low conflict or 27% with medium conflict[footnote 4]). Again, this finding indicates that parents with high conflict may require external support to help them make child maintenance arrangements.
Other barriers included:
- the NRP lacking the means to offer support (22% of PWCs and 28% of NRPs),
- not having a good relationship (18% of PWCs and 33% of NRPs), or
- the feeling that the PWC was able to manage without support (18% of PWCs and 10% of NRPs).
These are shown in Figure 15 below:
Figure 15: Barriers to having an arrangement, by parent type. Top answers shown only
D18a. PWCs: Please could you tell us why you have not arranged to receive support from the other parent of child? NRPs: Please could you tell us why you have not arranged to provide support to the other parent of your child?
| Barriers | PWC | NRP |
|---|---|---|
| NRP does not want to provide support | 48% | 9% |
| NRP does not have the means to offer support | 22% | 28% |
| We do not get on/do not have a good relationship | 18% | 33% |
| PWC does not want NRP to have contact or offer support | 12% | 39% |
| PWC can manage by themselves | 18% | 10% |
| Distance/we live too far away | 10% | 8% |
| Lack of contact | 1% | 6% |
| CMS are not following up | 2% | 2% |
| Domestic violence / abuse | 2% | 0% |
| Child doesn’t need support / is over 18 / at university | 1% | 4% |
Base: PWCs (556) and NRPs (89*) who do not have arrangements for support *Small base size
2.4.3. Parents who do not have an arrangement but would like one
A significant proportion of parents that did not have any arrangements for support, wanted to change this (38%). NRPs had a bigger appetite for making arrangements than PWCs (49% compared to 35%), as shown in Figure 16 below:
Figure 16: Whether parents without arrangements would like one, by parent type
D19. Would you like to have an arrangement in place for support with the other parent, or not?
| Response | PWC | NRP |
|---|---|---|
| Yes | 35% | 49% |
| No | 52% | 29% |
| Don’t know | 13% | 21% |
Base: PWCs (556) and NRPs (89*) who do have arrangements for support *Small base rate
Parents that did not have support arrangements, but wanted to have one, were more likely to:
- have 3 or more children (47% compared to 31% with only 1 child) suggesting a need for support on the part of the PWC;
- have been in a relationship for at least five years prior to separating (46% compared to 34% that had been in a relationship for less time or 9% who had never been in the relationship with the other parent of their child);
- have high levels of conflict (50% compared to 23% with low conflict) preventing them from reaching an agreement without external support.
However, not all parents without arrangements wanted to have one (47%). PWCs without arrangements were almost twice as likely (52%) than NRPs (29%) to say they did not want to have a support arrangement. Parents were less likely to report having an appetite to make support arrangements if the child was older (56% aged 16 or above), or if the parents did not have contact (49%).
2.4.4. Support needed to make arrangements
As described earlier, around four in ten parents (38%) that did not have any arrangements for support, wanted to change this. Parents without arrangements were generally receptive to receiving support to help them do this. Over eight in ten (83%) parents who wanted to have an arrangement said they would like support to create one. The sample sizes were too small to provide further insight into whether certain types of parent were more receptive than others.
Figure 17 below shows the types of support wanted by parents currently without an arrangement. Common areas included:
- having more support with enforcing payments (including stronger consequences for non-compliance),
- relationship support, and
- financial support.
The most common support needs were for a service that helped ensure payments were made by the NRP (31%), stronger enforcement or consequences if an arrangement was not upheld (25%), and parental relationship support (21%) or mediation (20%). Seven percent said that there was no type of support that would have helped them make care arrangements with the other parent.
Figure 17: Support that would help parents make arrangements. Top answers shown only
D20: What support, if any, would help you to have an arrangement in place for support with the other parent of your child?
| Type of support that would help | Percentage |
|---|---|
| A service which helps ensure payments are made | 31% |
| Stronger enforcement and consequences for non-compliance | 25% |
| Parental relationship support | 21% |
| A mediator | 20% |
| A CMS calculation that more accurately looks at income and savings | 20% |
| Support with legal costs | 14% |
| Parenting support for co-parenting | 13% |
| Financial/money/debt advice | 12% |
| Support from a health professional | 11% |
| Childcare support | 11% |
| Support with understanding/ explaining my child’s physical/ emotional needs | 10% |
| Support to increase my income | 7% |
| Guidance on creating a written agreement | 7% |
| Financial support / higher child maintenance | 6% |
| More / regular contact | 4% |
| Changes in legislation - legal obligations towards the other parent | 2% |
| CMS - faster support | 1% |
| CMS - make less mistakes / correct mistakes made | 1% |
| Other | 7% |
| Nothing | 7% |
Base: Separated parents (232) who would like to have an arrangement
2.5. Ideal arrangements for support
2.5.1. Satisfaction with current arrangements
More parents with arrangements were satisfied than dissatisfied with their current arrangements for support (50% compared to 30%). While there are likely to be many factors linked to dissatisfaction (including lack of contact with the other parents), the analysis showed that satisfaction varied by arrangement type; 57% of parents with arrangements for non-financial care and 60% of parents with both types of arrangement were satisfied (i.e. higher than 50% on average). As explained earlier in this report, these were more likely to be parents with FBAs (60% satisfied) who had amicable relationships and less complex circumstances. On the other hand, parents with arrangements for only financial support were most dissatisfied (42%). Nearly half (47%) of CMS users and parents who had high level levels of conflict (46%) and strained relationships, were dissatisfied.
Parents with arrangements were also asked if they wanted to have a different arrangement to the one they had, or whether they were happy with their current arrangements. Over half (55%) of parents with arrangements were happy with these. They were, again, more likely to be parents with:
- arrangements for non-financial care (60%)
- arrangements for both types of care (64%)
- FBAs (67%)
- low levels of conflict (81%).
On the other hand, over a third (36%) of parents wanted to have a different arrangement. Again, these were more likely to be parents with:
- arrangements for only financial support (42%)
- CMS arrangements (50%)
- high conflict (53%) or those who did not have contact (55%).
Together, the findings suggest that parents with FBAs are more likely to have support arrangements that work for them.
A small minority of those who had support arrangements (5%) preferred not to have an arrangement with the other parent. This was more common among parents who reported that the NRP never saw their child (11%) and among parents that did not have contact (11%) with each other. These findings suggest that parents who do not want contact with each other are less receptive to having support arrangements. It was also more common among parents with complex circumstances, including parents of children with SEND (7% compared to 4% without) and those with long-term health conditions or disabilities themselves (8% compared to 4% without).
Among those who did not want an arrangement, the most common reasons cited were:
- conflict or having a difficult relationship (34%),
- not needing support from the other parent (14%), or
- thinking that the other parent did not want to maintain contact (7%).
These are shown in Figure 18 below:
Figure 18: Reasons for not wanting a support arrangement
D16. Why do you prefer not to have an arrangement for support with the other parent?
| Reasons | PWC | NRP |
|---|---|---|
| Conflict / difficult relationship | 34% | 76% |
| I don’t need support from the other parent | 14% | 38% |
| The other parent does not want contact | 7% | 38% |
| The child/ren are older | 7% | 14% |
| I don’t want to be bound by a formal arrangement | 5% | 15% |
| Child does not want contact | 4% | 0% |
| I do not want to cause conflict | 3% | 0% |
| Lack of contact | 2% | 1% |
| Other | 12% | – |
| Don’t know | 17% | – |
Base: Parents who do not want to have an arrangement (97). Small base size.
2.5.2. What ideal arrangements look like
The survey explored what parents wanted to be different about their arrangements. Among those that wanted a different arrangement, PWCs and NRPs had different priorities of what they ideally wanted to get from a child maintenance arrangement. NRPs typically wanted more contact with their child and a bigger role in their upbringing, whilst PWCs typically wanted more co-operation, financial support, and for financial calculations to be more accurate of the NRP’s income and affordability (a significant proportion of NRPs also wanted this, though from a different perspective). CMS users were more likely than parents with an FBA to want more accuracy when it came to ensuring payments reflected the NRP’s income (50% compared to 40%). This suggests that CMS users were more likely to believe that the current calculations are unfair to them. These differences in views between PWCs and NRPs are shown in Figure 19 below:
Figure 19: What parents want to be different about their arrangement, by parent type
D15. What would you like to be different about your arrangement for support with the other parent?
| Differences wanted | PWC | NRP |
|---|---|---|
| Want NRP to see child more regularly | 54% | 76% |
| Want financial support / agreement to factor in NRP income / be more realistic | 59% | 38% |
| Want to share responsibilities equally/50:50 | 16% | 38% |
| Want an arrangement that allows me to work | 15% | 14% |
| Want full custody/care of my children | 8% | 15% |
| Want NRP to see child less regularly | 6% | 0% |
| Want more communication / collaboration | 3% | 0% |
| Want more help / communication / clarity from CMS | 1% | 1% |
Base: PWCs (293) and NRPs (383) who want different arrangements for support
2.5.3. What parents think should be factored into maintenance calculations
Parents were asked about their opinions of what should be factored in when calculating the amount of child maintenance to be paid. Most parents wanted the calculations to take into account all of the different types of costs associated with caring for a child. This included:
- 63% of PWCs and 61% of NRPs who wanted payments for regular goods and services (such as after school clubs or music lessons),
- 49% of PWCs and 65% of NRPs that wanted overnight stays,
- 45% of PWCs and 55% of NRPs that wanted day time care, and
- 35% of PWCs and 45% of NRPs that wanted school pickups and drop offs, to be taken into account.
Over one in ten overall (13%) did not want any of these factors to be considered when calculating the amount of child maintenance to be paid. Parents that had been separated for less than a year were more likely to say this (18% compared to 13% that had been separated for longer).
Figure 20: What parents think should be accounted for in a child maintenance calculation, by parent type
D8/D18b. In your opinion which, if any, of the following should be taken into account when calculating the amount of child maintenance to be paid?
| What parents would like to be accounted for | PWC | NRP |
|---|---|---|
| Payments for regular goods or services | 63% | 61% |
| Overnight stays | 49% | 65% |
| Day time care | 45% | 55% |
| School pick-ups/drop offs | 35% | 45% |
| None of these | 14% | 13% |
| Don’t know | 13% | 12% |
Base: All PWCs (1,555) and NRPs (934)
2.5.5. Barriers to having the ideal arrangement
The survey explored what prevented parents from having the arrangement they wanted. Lack of agreement and co-operation on what the arrangement should look like, was the biggest barrier to having the ideal arrangement. PWCs (53%) and NRPs (57%) were equally likely to say this was a barrier. Beyond this, parents had varied opinions on the barriers to achieving their ideal arrangement. Almost twice as many NRPs (62%) as PWCs (37%) felt that conflict was a barrier to achieving this, but more PWCs (27%) than NRPs (19%) lacked confidence in the NRPs’ ability to uphold an agreement. These are shown in Figure 21 below:
Figure 21: Barriers to having the ideal arrangement, by parent type. Top answers shown only
D17. What, if any, is preventing you from having the arrangement you would like?
| Barriers to arrangement | PWC | NRP |
|---|---|---|
| Disagreements on what the arrangement should be/lack of cooperation | 53% | 57% |
| Conflict between you and the other parent | 37% | 62% |
| Do not feel confident that the agreement would be upheld | 27% | 19% |
| Financial difficulties or debt | 16% | 20% |
| Distance / live too far away | 14% | 19% |
| Re-partnering /new family formation | 18% | 15% |
| Employment/work circumstances | 21% | 13% |
| Issues with accommodation | 6% | 11% |
| Court order | 2% | 3% |
Base: PWCs (293) and NRPs (383) who want different arrangements for support
Chapter summary
Most parents have arrangements for financial support. This typically includes regular payments or via paying for goods and services that the child needs. In comparison, half of parents have arrangements for non-financial care, such as overnight stays or school pick-ups. Most of these arrangements are informal.
Better quality parental relationships are key to having arrangements that involve both types of care. Parents with more amicable relationships and less conflict are more likely to have arrangements that work for them, typically through an FBA. On the other hand, parents with strained relationships and more conflict are more likely to not have arrangements, or to require the CMS to make arrangements.
Income (and therefore affordability) is a key factor in decision-making about the amount of financial support that the NRP would provide.
A quarter of parents do not have agreements for support. Most of these have an appetite to make arrangements, though not all parents would like to have an arrangement. Conflict is a key barrier to having their ideal arrangement.
Parents with vulnerabilities or more complex circumstances might not be receiving the support they need to make child maintenance arrangements.
Parents want the calculation to take into account the full costs associated with caring for a child. This included payments for regular goods and services (such as after school clubs or music lessons), and costs associated with overnight stays, daytime care, and school pickups and drop offs. NRPs and PWCs were equally likely to want payments for regular goods to be factored in, though NRPs were more likely to want other costs to be included in the calculation.
3. Complying with financial agreements
Overview of NRP compliance
This section provides a snapshot of the survey population’s views on whether the NRP paid all of the money that was agreed or calculated when making financial arrangements. Detailed analysis is provided in the remainder of this chapter.
NRP compliance
In the survey, both PWCs and NRPs with financial arrangements were asked whether or not the NRP paid all of the money that was agreed or calculated. Among the 64% of parents with financial arrangements, four in ten (39%) reported that the NRP did not pay all of the money that was agreed or calculated; PWCs were more likely to report this (43%) than NRPs (37%). Reporting that the NRP paid all of the money was lower among parents with FBAs than among CMS users, as demonstrated in Figure 22 below:
Figure 22: NRP compliance with financial agreements, by parent type
| Type of arrangement | PWCs | NRPs | Overall |
|---|---|---|---|
| All parents with financial arrangements | 43% | 37% | 39% |
| CMS users | 41% | 20% | 30% |
| Parents with FBAs for financial support | 44% | 39% | 41% |
| Only financial support | – | – | 24% |
| Both financial and non-financial support | – | – | 40% |
| Financial arrangements | – | – | 64% |
This chapter explores the extent to which NRPs were upholding financial agreements in practice. It also considers what support parents might need to encourage compliance.
3.1. NRP compliance
NRPs were largely compliant with upholding financial agreements. Two-thirds (65%) paid all or most of the money that was agreed or calculated. However, four in ten (39%) did not provide all of the money that was agreed. As might be expected, PWCs were more likely to report that the NRP did not pay all of the money agreed (43% compared to 37% of NRPs said the NRP paid most, some or none of the money, or that it varied too much to say), as shown in Figure 23 below:
Figure 23: NRP compliance with financial agreements, by parent type
D10. PWCs: Thinking about the amount of financial support that was calculated or agreed, would you say that the NRP generally provides? NRPs: Thinking about the amount of financial support that was calculated or agreed, would you say that you were generally provide?
| Proportion of money | PWC | NRP |
|---|---|---|
| All | 51% | 56% |
| Most | 12% | 10% |
| Some | 17% | 16% |
| None | 2% | 1% |
| It varies | 11% | 10% |
| Don’t know | 4% | 5% |
| Overall | 43% | 37% |
Base: PWCs (803) and NRPs (799) who provide/receive financial support
Parents who made their financial arrangements via a court or in another way (51%) and parents with an FBA (41%), were more likely than CMS users (30%) to report that the NRP did not pay all of the money.
There were also differences by the type of CMS support that was used. Parents who used CMS Collect & Pay (42%) were more likely to say the NRP did not provide all of the money, compared to half as many (25%) CMS Direct Pay users (note that parents using the Collect & Pay service have to have been non-compliant to use this service). These differences can be explained by the profile of these users: 52% of Collect & Pay parents did not have a relationship with one another (compared to 37% of Direct Pay), and 46% said the NRP never saw their child (compared to 28% of Direct Pay users). In comparison, Direct Pay parents were better placed financially to pay in full because they were more likely to be working (73% were working or self-employed compared to 64% of Collect & Pay users), and to have higher household income (18% had a household income of £50,000 or more compared to 12% Collect & Pay users). It is also possible that some NRPs may be substituting financial support with other forms of non-financial care. For example, parents with financial arrangements who said the NRP frequently saw their child were highly likely to also say the NRP did not pay all of the money (45% compared to 34% that never saw their child).
Finally, compliance was higher when neither parent had re-partnered since the separation (46% compared to 35% where both had re-partnered).
Lack of compliance was higher among parents that did not want to have support arrangements, rather than among parents that wanted different arrangements, suggesting that parents do not see the point of having an arrangement that is not upheld. Over half (54%) of those that preferred not to have an arrangement said the NRP did not pay all of the money. It was also high among parents who said their financial agreement was arranged via a court order or in another way (51% reported that the NRP did not pay all of the money)
3.2. Support needed to encourage compliance
Parents were asked what would encourage the NRP to comply with their financial agreements. Given the challenges around affordability, parents wanted financial support to help the NRP comply with their agreements. Over a quarter (27%) who did not pay or receive all of the money, said that job income or security would help the NRP to comply. Beyond this, parents wanted to have agreement on the amount of money that was actually needed to support their child. This implied some dissatisfaction with the fairness and accuracy of child maintenance calculations.
Other types of support that parents wanted included: having a better relationship (19%), more or better-quality contact with the child (18%), and a clearer view on how the money was being spent (18%). Only a small minority overall (2%) said that there was no support that could encourage the NRP to comply.
Again, there were differences in opinion between the two types of parent. NRPs were more likely to want support with financial aspects of compliance, such as job or income security (34% of NRPs and 18% of PWCs) or with relationship support, such as having more contact with the child (23% of NRPs and 11% of PWCs). On the other hand, PWCs were more likely to want support with reaching an agreement that more accurately reflected the cost of supporting their child (26% of PWCs and 20% of NRPs) or with formal intervention, such as via a court (15% of PWCs and 7% of NRPs), as shown in Figure 24 below:
Figure 24: Support that would help NRPs to comply with financial agreements, by parent type
D11. PWCs: What, if anything, would help the NRPs to provide the full amount of financial support? NRPs: What, if anything, would help you to provide the full amount of financial support?
| Type of support | PWC | NRP |
|---|---|---|
| Job or income security | 18% | 34% |
| Agreement on amount of money actually needed | 26% | 20% |
| A better relationship with the other parent / less conflict | 16% | 21% |
| More or better contact with your child | 11% | 23% |
| Clearer view of how the money is spent | 15% | 20% |
| Financial support or advice | 12% | 18% |
| Debt resolution | 8% | 13% |
| Formal intervention (e.g. via a court) | 15% | 7% |
| Not being on furlough | 6% | 6% |
| Being willing to pay | 4% | 3% |
| Help with health / mental health issues | 1% | 2% |
| Nothing | 2% | 3% |
| Don’t know | 22% | 19% |
Base: PWCs (344) and NRPs (250) who do not pay/receive all of the money they agreed
CMS users were four times more likely than those with FBAs to want formal intervention to aid compliance, reflecting their more difficult circumstances and higher levels of conflict. Further, three in ten (28%) parents that did not have contact with each other wanted formal intervention, indicating the extent to which some relationships had broken down.
Chapter summary
NRPs are broadly compliant when it comes to upholding financial agreements, however four in ten did not provide all of the money that was calculated or agreed. Parents from lower-income households are more likely to report that the NRP did not pay all of the money. This suggests that lack of affordability may be a factor. In addition, some NRPs may be taking into account their contribution to non-financial and discounting this from their financial commitments. For example, parents who say the NRP frequently sees their child are highly likely to also say the NRP does not pay all of the money.
There are differences between CMS Collect & Pay and Direct Pay users, with the latter group more likely to uphold their financial agreements. This reflects differences in the relationship and employment status between these two groups.
Given these challenges, parents want financial support to help the NRP comply with their agreements. There is also appetite for support with: having a better relationship, more or better-quality contact with the child, and a clearer view on how the money was being spent. However, PWCs and NRPs have different motivations.
4. Parental conflict, relationships and parental care
Previous chapters have explored how conflict can be a key factor in determining the quality of parental relationships and in parents’ ability to make arrangements for child maintenance. This chapter looks at conflict in more detail. It also considers the barriers to successful co-parenting, and the support that parents may need to successfully provide care to their children.
4.1. The characteristics of parents that do not have contact
Three in ten parents (28%) did not have any contact with the other parent of their child which, in turn, impacts their relationship with their child, discussed in section 4.3 below. For example, over half (55%) of NRPs who did not have contact with the other parent also never saw their child, compared to 7% where the parents had contact with each other.
Parents with the following characteristics were more likely not to have contact with one another:
- 51% of parents who reported that they had never been in a relationship with the other parent were no longer in contact (compared to 25% that had been in a relationship for 5 years or longer);
- 31% of parents who had been separated for 5 or more years were no longer in contact (compared to 14% who had been separated for less than one year) suggesting that arrangements may have lapsed over time due to change in circumstance or due to the child becoming more independent;
- 25% of parents who had both re-partnered since the separation were no longer in contact (compared to 8% where neither had re-partnered);
- 36% of parents of children with SEND no longer had contact (compared to 26% of those without a child with SEND);
- 34% of parents who reported long-term health conditions or disabilities were also not longer in contact with the other parent (compared to 26% without); and
- 40% of parents with financial arrangements through the CMS were no longer in contact (compared to 10% with FBAs). This was particularly true of parents that had used the Collect & Pay service (56% compared to 37% that had used Direct Pay) – a service used by more parents with no relationship or more difficult relationships.
4.2. Conflict
The survey explored levels of conflict between parents who did have contact with each other (72%). These parents were asked a series of four questions about how frequently discussions on important matters about their child resulted in negative outcomes. This included: arguments, hostility or anger, stressful or tense conversations, and differences in opinion about issues relating to upbringing, shown in Figure 25 below.
It was common for parents to have differences in opinion about issues relating to bringing up their child. Overall, 89% of parents said they had differences in opinion and 27% said this always or often happened. A similar proportion (31%) said that conversations about important matters relating to their child were always or often stressful or tense, and 22% reported that these conversations always or often ended in a hostile or angry environment or led to arguments (20%). Views were broadly similar between PWCs and NRPs.
Figure 25: How often discussions on important matters about the child resulted in negative outcomes, by parent type – this figure is made up of 4 charts
C5. When you and the other parent discuss important matters about your child, how often, if at all?
1. Does this result in an argument?
| How often | PWC | NRP |
|---|---|---|
| Never | 22% | 24% |
| Rarely | 30% | 33% |
| Sometimes | 26% | 27% |
| Often | 14% | 10% |
| Always | 8% | 8% |
2. Is the atmosphere one of hostility or anger?
| How often | PWC | NRP |
|---|---|---|
| Never | 27% | 28% |
| Rarely | 27% | 29% |
| Sometimes | 23% | 21% |
| Often | 14% | 12% |
| Always | 8% | 10% |
3. Is the conversation stressful or tense?
| How often | PWC | NRP |
|---|---|---|
| Never | 13% | 15% |
| Rarely | 24% | 24% |
| Sometimes | 30% | 32% |
| Often | 16% | 14% |
| Always | 16% | 15% |
4. Do you have differences in opinion about issues relating to bringing up your child?
| How often | PWC | NRP |
|---|---|---|
| Never | 13% | 8% |
| Rarely | 25% | 25% |
| Sometimes | 34% | 40% |
| Often | 19% | 15% |
| Always | 10% | 11% |
Base: PWCs (1,035) and NRPs (662) who have contact
Parents were allocated a score between one and five based on their answers; those who said ‘always’ were given a score of one, and those who said ‘never’ were given a score of five for each of the four statements. The combined scores for all four statements were then divided into three groups of equal size, where high conflict represented the bottom third of all scores, medium conflict was the middle third, and low conflict was the top third (which could also mean there was no conflict).
Parents with high levels of conflict had strained relationships – they did not make joint decisions on matters relating to their child, the NRP had infrequent to no contact with their child, and they were highly likely to only have arrangements for financial support, usually through the CMS (see section 4.2.1). On the other hand, parents with medium or low levels of conflict had more amicable relationships and most had made their support arrangements privately.
4.2.1. Conflict and support arrangements
Parents with high levels of conflict had strained relationships. It was common among parents with high conflict for NRPs to have less frequent contact with their child. For example, 22% saw their child less often than fortnightly and 14% said they never saw their child (compared to 2% with medium conflict and 9% with low conflict who never saw their child).
Conflict was a barrier to parents being able to make child maintenance arrangements. Parents with high levels of conflict were more likely to report that they did not have any arrangements for support with the other parent, or to have arrangements for financial support only, while those with low conflict were more likely to report having arrangements for both types, as shown in Figure 26 below:
Figure 26: Support arrangements, by conflict levels
D1. PWCs: In what ways, if at all, does the NRP provide care for your child?
| Support arrangements | Low | Medium | High | No contact |
|---|---|---|---|---|
| Financial support only | 16% | 20% | 28% | 32% |
| Non-financial care only | 13% | 13% | 13% | 2% |
| Both | 58% | 54% | 39% | 13% |
| None of these | 13% | 12% | 20% | 53% |
Base: All separated parents (2,489)
Given this, parents with high conflict were less likely to have FBAs for financial support. Around half of parents with high conflict (52%) had an FBA, while three-quarters (73%) of parents with medium or low conflict had an FBA.
On the other hand, parents with low levels of conflict had more amicable relationships. They were more likely to make joint decisions on matters relating to their child (53% compared to 16% with high conflict). This was common where neither parent had re-partnered since separating, although re-partnering was not necessarily associated with high conflict. Given this, parents with low conflict were more likely to have FBAs (74%) and to be very satisfied with their current arrangements (41% compared to 6% with high conflict).
4.2.2. Support needs
Parents who had high levels of conflict and strained relationships were more likely to have used a range of support services (see Chapter 5). For example, half of parents (50% that did not have contact with each other and 47% with high levels of conflict) had used a lawyer or solicitor, two in five (42% that did not have contact with each other and 37% with high levels of conflict) had used the Child Maintenance Options service, and around a third (39% who did not have contact with each other and 32% with high conflict) had used family courts. This highlights the importance of external support for parents who are unable to work together to reach private arrangements, but also for parents with medium to low conflict.
Figure 27: Use of support services, by conflict levels
C1. Below is a list of services and support options available to separated parents. For each, please tell us if you have used the support.
| Services | No contact | High | Medium | Low |
|---|---|---|---|---|
| Child maintenance options service | 42% | 37% | 24% | 21% |
| Child maintenance online calculator | 40% | 50% | 41% | 36% |
| Mediator / relationship support | 21% | 30% | 18% | 14% |
| Lawyer or solicitor | 50% | 47% | 32% | 26% |
| Family court | 39% | 32% | 17% | 11% |
| CMS enforcement measures | 19% | 12% | 6% | 5% |
| Charity or public organisation | 23% | 30% | 14% | 14% |
Base: Separated parents that do not have contact with each other (792), or have high conflict (572), medium conflict (602) or low conflict (563)
4.3. NRP contact with children
The survey explored the extent to which NRPs saw their child in an average week, including any overnight stays. Most often, NRPs saw their child more than once a week (32%). This included 12% of parents who reported that the NRP saw their child three times a week on average. Frequent contact (more than once a week) was common to parents with arrangements for both financial and non-financial support (53%) which was arranged via an FBA (48%). Earlier analysis in this report has shown that these parents had more amicable relationships and lower levels of conflict. However, NRPs (39%) were more likely than PWCs (25%) to say they saw their child more than once a week, indicating that some of this contact may be informal.
Another common arrangement was for the NRP to see their child every other week or weekend, mentioned by 18% of parents. There were no differences between parents that had used the CMS or had an FBA, however this approach was common among parents with medium levels of conflict (24% compared to 9% that did not have contact).
A small minority (1%) mentioned that the NRP was free to see their child whenever they wanted to. However, a quarter of parents (23%) reported that the NRP never saw their child. This was more common among parents who did not have any arrangements for support (54%), and also those who did not have contact with each other (64%), which was common among CMS users (31%). The findings suggest that conflict and parental contact can be a deciding factor in the level of contact that NRPs have with their children.
Figure 28: Frequency of NRP contact, by parent type
C1. PWCs: How often, if at all, does the NRP see your child in an average week, including overnight stays? NRPs: How often, if at all, do you see your child in an average week, including overnight stays?
| Frequency | PWC | NRP |
|---|---|---|
| 7 days (everyday) | 2% | 2% |
| 6 days | 0% | 1% |
| 5 days | 2% | 2% |
| 4 days | 2% | 5% |
| 3 days | 8% | 16% |
| 2 days | 11% | 12% |
| 1 day | 8% | 7% |
| Every other week/weekend | 17% | 19% |
| Once a month | 7% | 5% |
| Few times a year | 10% | 7% |
| Ad hoc/ when they want | 1% | 1% |
| Less often | 2% | 4% |
| Never | 29% | 17% |
Base: All PWCs (1,555) and NRPs (934)
Parents were mixed in their satisfaction with the level of contact that NRPs had with their child. Around half (48%) were happy with the level of contact the NRP had, and the same proportion were unhappy. This included 44% who wanted the NRP to have more contact. NRPs (62%) were twice as likely as PWCs (28%) to want to have more child contact. The optimal level of contact for satisfaction was among parents who said the NRP saw their child more than once a week. Half (51%) who were happy with their arrangements said this, compared to 7% who said once a week, or 22% who said fortnightly.
There were differences by how often NRPs saw their child. Half of parents who said the NRP never saw their child (50%) and two-thirds who said the NRP saw their child less often than fortnightly (64%) wanted the NRP to have more contact. This was also common among parents who had only financial arrangements (58%) and among CMS users (55%), which earlier analysis has shown is common to parents with conflict. The findings indicate that the majority of NRPs would like to have more frequent contact with their child, but conflict and poor-quality parental relationships could be a barrier to this.
4.3.1. Barriers to having more contact
Strained relationships and conflict were the main barriers to the NRP having more contact with their child. Overall, four in ten (40%) parents said that a difficult relationship with the other parent prevented the NRP from having more child contact, and a third (32%) felt the NRP did not want to have (or felt the PWC did not want the NRP to have) more child contact. Half (51%) of CMS users and parents that did not have contact felt that difficult relationships were a barrier.
NRPs were more than twice as likely as PWCs to say that a difficult relationship with the other parent was a barrier. This reiterates the need for support with resolving conflict, which was also a barrier to the NRP being able or willing to provide all of the financial support, as Figure 24 showed.
Other barriers to the NRP having more contact included:
- living too far away from each other (24%),
- time restrictions (for example because of work) (19%) and
- COVID-19 restrictions (16%).
One in ten (10%) reported that issues with accommodation prevented the NRP from having more contact. This was more common among parents with an FBA (16%) and parents who had been separated for less than one year (20%).
Figure 29: Barriers to having more NRP-child contact, by parent type. Top answers shown only
C3. PWCs: What, if anything, is preventing the NRP from having more contact with your child? NRPs: What, if anything, is preventing you from having more contact with your child?
| Reasons for not having more contact | PWC | NRP |
|---|---|---|
| Difficult relationship between you and the other parent | 20% | 50% |
| The other parent does not want contact | 43% | 26% |
| Live too far away | 24% | 24% |
| Time restrictions | 21% | 19% |
| COVID 19 | 11% | 18% |
| Financial difficulties or debt | 9% | 12% |
| Issues with accommodation | 8% | 11% |
| New family formation | 15% | 8% |
| Court orders | 2% | 12% |
| Difficult relationship with child | 8% | 6% |
| Impact on financial support | 2% | 2% |
| Child’s choice | 2% | 1% |
Base: PWCs (435) and NRPs (611) who want to have more contact
4.4. Responsibility for decision-making
The survey explored how parents made important decisions about their child. Parents were generally in agreement on who the main decision maker was. Eight in ten PWCs (79%) and over half (55%) of NRPs reported that the PWC was the main decision maker on issues relating to their child.
However, NRPs reported higher involvement than PWCs did. Twice as many NRPs (40%) as PWCs (19%) reported that they made decisions together. These differences may partly be due to slightly more PWCs than NRPs reporting that they have never been in a relationship with the NRP meaning the NRP was less likely to be involved in their child’s upbringing (see section 2.1).
Joint-decision making was a key factor in the quality of parental relationships. Parents who made decisions jointly had more amicable relationships and less conflict. Therefore, they were more likely to have arrangements for both financial and non-financial support (51% made decisions jointly, compared to 6% that did not have arrangements) and make support arrangements privately (49% of parents with an FBA made joint decisions, compared to 14% of CMS users). The findings indicate that supporting parents to resolve or minimise conflict might encourage more joint-decision-making, and therefore increase the propensity to make private arrangements.
4.5. Barriers to successful co-parenting
Different parenting styles was one of the biggest barriers to successful co-parenting, mentioned by three in ten (31%) separated parents. NRPs were more likely to report having different parenting styles (33% compared to 29% of PWCs). This was also a particular barrier for parents that had an FBA (37% compared to 28% of CMS users), reflecting the level of involvement that NRPs had in these circumstances.
A similar proportion overall (30%) reported that bad parental relationships or conflict were barriers to successful co-parenting. Again, NRPs were more likely to report this barrier (35% compared to 25% of PWCs).
A quarter of parents reported that lack of support from the other parent (25%) was a barrier. This was mentioned by more PWCs (32%) than NRPs (18%). Lack of support from the other parent was common to parents that did not have arrangements for care (35%) and also to CMS users (30% compared to 20% of those with an FBA), which were common among parents with higher levels of conflict.
Finally, 15% of parents reported that there were no barriers to successful co-parenting with the other parent of their child. As might be expected, this was common among parents with more amicable relationships, i.e. those that had arrangements for both types of care (21%), those that had an FBA (20% compared to 7% of CMS users), and those with low levels of conflict (40%).
Figure 30: Barriers to successful co-parenting, by parent type. Top answers shown only.
C6. What are the barriers, if any, to successful co-parenting with the other parent?
| Barriers | PWC | NRP |
|---|---|---|
| Different parenting styles | 29% | 33% |
| Bad relationship / conflict | 25% | 35% |
| Lack of support from the other parent | 32% | 18% |
| Lack of communication | 24% | 26% |
| Unsatisfactory contact with children | 17% | 11% |
| Financial difficulties or debt | 13% | 13% |
| Other time commitments | 10% | 15% |
| Distance | 12% | 12% |
| New family formation | 11% | 13% |
| COVID 19 | 8% | 14% |
| Domestic abuse | 15% | 4% |
| Other family members | 6% | 10% |
| None - no barriers | 15% | 15% |
Base: All PWCs (1,555) and NRPs (934)
These findings indicate that the quality of parental relationships is important for successful co-parenting. Across the board, parents who made decisions jointly were less likely to report barriers to successful co-parenting. Seven in ten (69%) parents who made joint decisions together reported that there were barriers to successful co-parenting – lower than the 87% of parents who reported they did not make joint decisions. Similarly, three in ten (29%) that made joint decisions reported that there were no barriers to successful co-parenting – considerably higher than the ten percent of parents who did not make joint decisions. Again, these findings reiterate a need to support parents to resolve or minimise conflict to encourage joint decision making, which is a key factor in being able to make private arrangements.
Chapter summary
Conflict can be a key factor in determining the quality of parental relationships and in parents’ ability to make arrangements for child maintenance. Given this, parents with high conflict were less likely to have FBAs and more likely to report that they did not have any arrangements for support with the other parent, or to have arrangements for financial support only.
Three in ten parents did not have any contact with the other parent of their child. More of these parents were CMS users than parents with FBAs, highlighting the importance of the service for parents that are unable or unwilling to reach an FBA.
Most often, NRPs see their child more than once a week. Frequent contact is common to parents with more amicable relationships and lower levels of conflict. Conflict and parental contact can be deciding factors in the level of contact that NRPs have with their children.
Joint-decision making is a key factor in the quality of parental relationships. Parents who make decisions jointly have more amicable relationships and less conflict. They are more likely to have arrangements for both financial and non-financial support.
Different parenting styles and poor-quality parental relationships or conflict are barriers to successful co-parenting. There is a need to support parents to resolve or minimise conflict to encourage joint decision making, which is a key factor in being able to make private arrangements.
5. Support for separated families
This chapter explores the support that is available to separated parents, what support parents have used, and their experiences of using these. The chapter also considers the types of parents that are not seeking support, and the barriers to accessing support services.
5.1. Support from extended family members
The survey explored the extent to which separated parents received financial and non-financial support from extended family members. Over four in ten (43%) parents reported receiving non-financial support, and a quarter (25%) reported receiving financial support. PWCs were more likely to benefit from both; 53% received non-financial support (compared to 33% for NRPs) and 34% received financial support (compared to 16% of NRPs).
Participants’ own family members were common sources of this support, especially for PWCs. Four in ten PWCs (42%) and half as many NRPs (21%) cited that they had received non-financial support (such as childcare and school pickups) to help care for their child, and a quarter (23%) of PWCs and 10% of NRPs had received financial support from their family members. It was less common to receive support from the other parent’s family or from new partners, as shown in Figure 31 below. Parents who were working (48%) were more likely to receive non-financial support from their friends and family than those who were not working or economically inactive (38%).
However, the majority of NRPs (61%) and two in five PWCs (40%) reported they received no support at all from their extended families. This was common among parents who did not have contact with the other parent (55%) and for parents of older children aged 16 or higher (61%). It was also higher for ethnic minority parents (58% compared to 49% of White parents).
Individuals who were more vulnerable were also more likely to be unsupported by family members. For example, over half (56%) of parents with a household income below £10,000 said they did not receive any support, compared to 45% of parents with a household income of £50,000 or more. Similarly, those that were looking for work (59% compared to 48% that were working or self-employed) and parents with long-term health conditions or disabilities (55% compared to 48% without) were more likely to be without support. The findings highlight an additional need for financial and non-financial support among the most vulnerable groups.
Figure 31: Access to support from family members, by parent type
F6. Which of the following types of support, if any, do you currently receive to help you care for your child?
| Type of support | PWC | NRP |
|---|---|---|
| Financial support from your new partner (or their family) | 15% | 7% |
| Financial support from your own family | 23% | 10% |
| Financial support from the other parent’s family | 3% | 2% |
| Non-financial support from your new partner (or their family) | 18% | 17% |
| Non-financial support from your own family | 42% | 21% |
| Non-financial support from the other parent’s family | 12% | 9% |
| None of these options | 40% | 61% |
Base: All PWCs (1,555) and NRPS (934)
5.2. Use of support services
The survey explored whether parents had used, not used, or not used but would have liked to use, seven different types of support services: the Child Maintenance Options service, the Child Maintenance online calculator, local mediators or arbitration support, lawyers or solicitors, family courts, enforcement measures by CMS, and support from charities and voluntary organisations, such as Citizen’s Advice or Gingerbread. This question relies on parents’ recall and some parents may not remember services that they used a long time ago.
The most commonly used services by both PWCs and NRPs were the Child Maintenance online calculator (used by 41% of PWCs and 42% of NRPs), and a lawyer or solicitor (38% of PWCs and 40% of NRPs). PWCs were also as likely to have used the Child Maintenance Options though this service was less commonly used by NRPs (38% and 24%). This is because it is typically the PWC who goes through Child Maintenance Options, while the NRP is less involved. Instead NRPs were more likely to have used family courts (23% of PWCs and 27% of NRPs), as shown in Figure 32 below. Parents were less likely to have used enforcement measures by the CMS (33% of PWCs and 13% per cent of NRPs that were also CMS users) and mediators or relationship support (17% of PWCs and 24% of NRPs).
There was some appetite for these services among parents who were non-users. One in five (18%) would have liked to use local mediators or arbitration support, and this was particularly the case for NRPs (20% compared to 16% of PWCs) and parents who either did not have contact (23%) or had high levels of conflict (24%, compared to 8% with low conflict). Earlier analysis has shown that these types of parents were more likely to be CMS users; a quarter (24%) wanted to used local mediators or arbitration support (compared to 15% with an FBA). The findings indicate that some CMS users could benefit from relationship support to help resolve conflict.
On the other hand, 16% of PWCs and nine percent of NRPs reported that they would have liked to use enforcement measures by the CMS. Appetite for this was similarly higher among CMS users (12% compared to 7% with an FBA) who had high conflict (18%) or no contact at all (19%). The findings highlight that some CMS users may have unresolvable conflict and so may require additional support to ensure that arrangements are being upheld.
Figure 32: Use of support services, by parent type
F2. Here are a list of services and support options available to separated parents. For each, please tell us if you have used the support, or did not use it but would have liked to?
| Services | Parent type | Don’t know | Neither | Not used, but would have liked to | Used |
|---|---|---|---|---|---|
| Child Maintenance Options service | PWC | 9% | 40% | 13% | 38% |
| NRP | 13% | 51% | 12% | 24% | |
| CM online calculator | PWC | 6% | 38% | 15% | 41% |
| NRP | 6% | 41% | 11% | 42% | |
| Mediator / relationship support | PWC | 5% | 61% | 16% | 17% |
| NRP | 5% | 51% | 20% | 24% | |
| Lawyer or solicitor | PWC | 4% | 47% | 11% | 38% |
| NRP | 3% | 42% | 14% | 40% | |
| Family court | PWC | 4% | 62% | 11% | 23% |
| NRP | 3% | 56% | 14% | 27% | |
| CMS enforcement measures | PWC | 6% | 62% | 16% | 16% |
| NRP | 8% | 77% | 9% | 6% | |
| Charity or public org | PWC | 5% | 57% | 14% | 24% |
| NRP | 4% | 61% | 18% | 16% |
Base: All PWCs (1,555) and NRPs (934)
5.2.1. Perceptions of the usefulness of support services
Participants who had used support were asked how useful they found it on a scale of very useful, fairly useful, somewhat useful and not at all useful. To categorise these responses, very useful and fairly useful have been grouped together (as “useful”) to represent the strength of the sentiment and the top half of the response scale, whilst somewhat useful and not at all useful have been grouped together to represent the bottom half of the scale. A full breakdown of responses by parent type is provided in Figure 33.
The support offered by charities or public organisations was most likely to be regarded as useful by those who used it. Three-quarters of PWCs (75%) and almost two-thirds of NRPs (63%) who used the service said this was useful. Parents who were happy with their support arrangements were highly likely to have found this service useful (81%).
Just over half of parents (53%) who used it reported that the Child Maintenance Options service was only somewhat or not at all useful (49% of PWCs and 59% of NRPs). This was higher among those who did not have contact with the other parent (58%) or those without support arrangements (60%) and those who wanted a different arrangement (58%), which may indicate that the service was of limited use for parents who would benefit most from having a CMS arrangement.
The majority of parents that had used relationship-related support reported that it was only somewhat or not at all useful (67% of PWCs and 64% of NRPs). This was higher among CMS users (68% compared to 54% with an FBA), parents who wanted a different support arrangement to the one they had (74%), parents that did not have contact with one another (72%) or had high levels of conflict (69%).
Figure 33: Whether support services were felt to be useful, by parent type
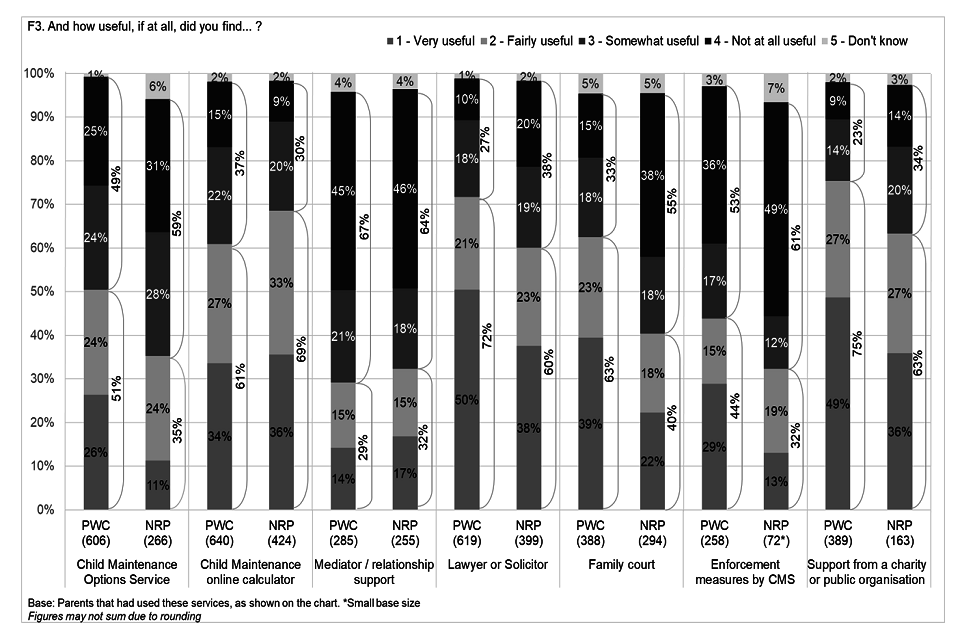
Whether support services were felt to be useful, by parent type
5.3. Use of Family Courts
Family courts are used when parents want a court to decide on a matter or they have problems in the home and require external, unbiased decision-making. A quarter of PWCs (23%) and NRPs (27%) had used family courts. As expected, use was higher among parents with strained relationships, such as those with high conflict (32% compared to 12% with low conflict) or no contact with each other (39%), and when the NRP never saw their child (36%). Use was also higher among parents with complex circumstances, including parents of children with SEND (33% compared to 22% without). Earlier analysis has shown that these characteristics were common to CMS users; 39% had used family courts, compared to 12% with an FBA.
Use of family courts was also higher among parents who did not have arrangements for support (31% compared to 21% who had arrangements for both financial and non-financial support). Four in ten (39%) CMS users had used family courts, compared to 12% with FBAs.
Most parents who used family courts (78%) did this to make decisions about how they would raise their child, including on parenting, contact and residence arrangements. CMS users (82% compared with 75% with an FBA) and those with high conflict were more likely to use family courts for this reason. A small proportion of parents who used a family court (15%) reported using family courts to make financial arrangements. Use for this purpose was higher among parents who had been separated for five or more years (19%) and parents of older children aged 16 or more (28%). This could be a result of the child having more autonomy and being more involved in the decision-making process, increasing the likelihood of disputes which cannot be settled amongst the parents themselves.
Family courts were scarcely used for public law arrangements relating to children taken into care (5%) or for arrangements relating to an adoption. Together, the findings indicate that family courts provide a valuable service to parents who cannot reach an arrangement via either an FBA or the CMS service.
Figure 34: Reasons for using family courts, by parent type
F4. For what reasons have you been to family court?
| Reasons | PWC | NRP |
|---|---|---|
| To make parenting/contact/residence arrangements | 75% | 80% |
| To make financial arrangements | 17% | 13% |
| Public law arrangements | 5% | 5% |
| To make adoption arrangements | 1% | 2% |
| Other | 20% | 11% |
| Don’t know / refused | – | 2% |
Base: PWCs (388) and NRPs (294) who use a family court
Among users, half (51%) found family courts to be useful and 45% said it was only somewhat or not at all useful. PWCs were more likely than NRPs to find family courts useful (63% compared to 40%). However, parents that did not have contact with each other (50%) and those who reported that the NRP never saw their child (52%) were highly likely to report that the service was somewhat or not at all useful. Further, parents with long-term health conditions or disabilities were also likely to report in this way (54% found it somewhat or not at all useful compared to 40% without), indicating that their circumstances and needs might not be fully taken into consideration by this service.
5.4. Reasons for not using support
Overall, three in ten parents (30%) had not used any of these seven support services, primarily because they did not need additional support (58%). This was a common response among parents with more amicable relationships (such as 75% with low conflict), which was common among parents with an FBA (72% compared to 39% of CMS users) for both financial and non-financial support (75% compared to 40% without any arrangements). NRPs and PWCs were equally likely to cite this reason.
However, one in five parents (22%) said they did not access support because they were unsure about what was available to them and where they could find this. This was a particular problem for CMS users (46% compared to 16% with an FBA) and a third (33%) of parents that wanted to have a different support arrangement. Previous analysis has shown that these types of parents were perhaps most in need of external support to make effective child maintenance arrangements.
One in six parents (17%) reported they did not access support because they did not think it would be helpful. This was a common response among parents with arrangements for financial support only (22%) and also those who wanted to have a different arrangement (25%). Further research may be required to understand the expectations of these parents, to ensure that their support needs can be met.
Another barrier was affordability. Over one in ten parents (14%) said they did not access support because they could not afford it. This was higher among CMS users (22%) and parents with high conflict (25%). As expected, affordability was a particular challenge for parents on lower income; 22% with a total household income below £10,000 stated this was the reason they did not use any support.
Finally, one in ten parents (14% of NRPs and 5% of PWCs) said they did not access any support because they felt the support would work against them, or benefit the other parent more. This was a particular problem for parents that wanted a different arrangement (19%) and also parents with higher income. The findings suggest that some parents – and NRPs in particular – may have an arrangement that does not work for them, but do not seek support over fears that they could end up in a worse-off position.
Only very small proportions of parents that did not seek support cited different barriers, such as not being digitally confident, as shown in Figure 35 below:
Figure 35: Reasons for not using support, by parent type
F5. For what reasons did you not use any support?
| Reasons | PWC | NRP |
|---|---|---|
| Did not need support | 56% | 60% |
| Was unsure where to go / what was available | 20% | 24% |
| Could not afford it | 13% | 16% |
| Did not think support would be helpful | 14% | 15% |
| Felt support would work against me / benefit the other parent | 5% | 14% |
| Lack of contact with the other parent | 2% | 1% |
| Not able to access support online | 1% | 1% |
| Afraid of consequences | 2% | 1% |
| Difficult relationship / conflict | 1% | 1% |
| Other | 4% | 2% |
| Don’t know | 6% | 4% |
Base: PWCs (433) and NRPs (257) who did not use support services
Chapter summary
Separated parents rely on non-financial support from their family members, however some vulnerable individuals in particular (i.e. from low-income households and those with disabilities or health conditions) may not be receiving the support they need from family members.
Parents were most likely to have used the Child Maintenance online calculator, a lawyer or solicitor, or the Child Maintenance Options service. Parents were least likely to have used enforcement measures by the CMS or mediators or relationship support. Among users, support offered by charities or public organisations was felt to be the most useful.
Some CMS users may benefit from relationship support to help resolve conflict and eventually reach FBAs. However, others have unresolvable conflict and may require additional support to ensure that arrangements are being upheld.
Parents with strained relationships and high conflict were likely to have used family courts. Users did this to make decisions about how they would raise their child, including on parenting, contact and residence arrangements.
The majority of parents who did not seek support say that they did not need it. However, there are barriers to accessing support (including affordability and lack of awareness).
6. Impact of separation
This chapter explores the impact that separation had on parents, in terms of their financial circumstances and ability to support their child, as well as on their and their child’s mental health and wellbeing. Note that PWCs typically have higher benefit entitlements as they are the primary caregiver for their child.
6.1. Impact on access to benefits
Nearly six in ten parents (57%) reported that they had accessed at least one type of benefit as a result of their separation, although this reduces to five in ten parents (53%) when you disregard those that only accessed child benefit. This was more common among parents that did not have contact with each other (63%) and among parents without arrangements for support (75%). Linked to this, more CMS users (59%) than parents with an FBA (43%) reported having accessed benefits since separating from the other parent. The findings highlight that there is a financial impact of separation.
PWCs were nearly three times more likely (82%) than NRPs (31%) to have reported accessing benefits as a result of separation They were:
- nearly twenty times more likely to have accessed Child Tax Credits (38% compared to 2% of NRPs);
- ten times more likely to have accessed Child Benefit (52% compared to 4% of NRP);
- twice as likely to have accessed Universal Credit (41% compared to 20% of NRPs); and
- seven times as likely to have accessed Income Support (14% compared to 2% of NRPs).
There was a difference in accessing benefits payments between PWCs and NRPs; two thirds of NRPs (65%) did not access any benefit payments since separating, compared to only 16% of PWCs. This is expected, as PWCS are typically entitled to higher benefits as the primary caregiver.
- Parents of children with SEND (69% compared to 54% without) and those with long-term health conditions or disabilities themselves (66% compared to 53% without) were more likely to have accessed benefits payments.
- At the same time, socio-economic factors (such as household income, employment status and number of children) contributed to needing benefits support (specifically, 78% of all parents with a household income below £10,000 had accessed benefits, compared to 20% with an income over £50,000; 77% of all parents that were not working and inactive had accessed benefits, compared to 48% that were working or self-employed; and 63% of all parents with 3 or more children had accessed benefits, compared to 56% with fewer children).
- There was also evidence that ethnic minority parents were more likely to report accessing benefits support after separation (64% compared to 56% of White parents).
Together, the findings suggest differential impact as the result of the separation[footnote 5] , with more vulnerable parents’ requiring financial support.
Figure 36: Access to benefits support since separation, by parent type
| Benefits | PWC | NRP |
|---|---|---|
| Child benefit | 52% | 4% |
| Universal credit | 41% | 20% |
| Child tax credit | 38% | 2% |
| Income support | 14% | 2% |
| Employment and support allowance | 5% | 5% |
| Jobseekers allowance | 4% | 5% |
| None of these | 16% | 65% |
| Don’t know / refused | 1% | 2% |
Base: All PWCs (1,555) and NRPs (934)
6.2. Impact on financial stability
Despite this, there was evidence that separation had enabled some PWCs to better support their child financially. Four in ten PWCs (41%) and three in ten NRPs (30%) reported that their ability to financial support their child had improved since separating. There were no differences in outcome by type of arrangement, or whether parents had an FBA or used the CMS. It was instead linked to income; for example, over half (55%) of parents with a household income of £50,000 or more reported this had improved, compared to 21% with a household income below £10,000, and parents that were working or self-employed reported better outcomes too (40% compared to 26% who were looking for work). Similarly, those who reported that both parents had re-partnered since separating reported better outcomes (41%) compared to those where neither had (28%), which may be a result of having a higher total household income. The findings indicate that financial stability is important for parents’ ability to support their child.
On the other hand, three in ten parents (29%) reported that their ability to financially support their child had worsened since separating. This was a common response among parents with low income households (41% below £10,000), high conflict (37%) and where neither parent had re-partnered since separation (32%). Further, parents that had long-term health conditions or disabilities were more likely to report worse financial outcomes (40% compared to 25% without), although parents of children with SEND reported better financial outcomes (41% compared to 35% without). Together, these reiterate the finding that vulnerable parents with complex circumstances became more financially strained after separating.
The findings also suggested that on average parents who were better-off financially saw their circumstances improve, while those who were worse-off financially, saw their circumstances deteriorate.
6.3. Impact on parents
The survey also explored how separation had affected parents’ mental health and wellbeing. Six in ten PWCs (59%) and four in ten NRPs (40%) felt their wellbeing had improved since the separation. This is most likely explained by less stress, tension and conflict within the family unit. Specifically, parents who had high levels of conflict went on to report better outcomes; 38% reported that their mental health and wellbeing had significantly improved.
Outcomes were linked to their relationship. Those who had been in longer relationships prior to separation were most likely to report better outcomes on their health and wellbeing (52% compared to 46% that had been in a relationship for less than a year). New family formation also played a part in this. Over half of parents (55%) that had both re-partnered (and 59% who said the NRP had re-partnered) said their mental health and wellbeing had improved.
Parents that did not have arrangements for support reported better outcomes on their health and wellbeing (54% compared to 47% that had arrangements for both financial and non-financial support), indicating that the quality of relationships (rather than support arrangements) are key to better outcomes.
Figure 37: Outcomes for parents, by parent type – this figure is made up of 3 charts
G1. Has…got better or worse since you separated from the other parent?
1. Your mental health and wellbeing
| Parent type | Don’t know | Worse | About the same | Somewhat better | Significantly better |
|---|---|---|---|---|---|
| PWC | 4% | 20% | 17% | 19% | 40% |
| NRP | 4% | 34% | 22% | 14% | 26% |
2. Your child/children’s mental health and wellbeing
| Parent type | Don’t know | Worse | About the same | Somewhat better | Significantly better |
|---|---|---|---|---|---|
| PWC | 8% | 15% | 35% | 16% | 26% |
| NRP | 21% | 25% | 39% | 10% | 5% |
3. Your ability to financially support your child
| Parent type | Don’t know | Worse | About the same | Somewhat better | Significantly better |
|---|---|---|---|---|---|
| PWC | 4% | 25% | 30% | 18% | 23% |
| NRP | 5% | 34% | 31% | 19% | 11% |
Base: All PWCs (1,555) and NRPs (934)
6.4. Impact on children
Parents were reasonably mixed in their views on whether their child’s mental health and wellbeing had improved or worsened since the separation. Three in ten (29%) reported it had got better, one in five (20%) said worse, but over a third (37%) reported that there was no change. PWCs were more likely than NRPs to report this had got better (42% compared to 15% of NRPs).
The level of NRP contact was a prominent characteristic when looking at wellbeing. Parents who reported that the NRP saw their child less frequently also reported better outcomes. For example, a third (35%) of parents who said the NRP never saw their child, reported that their child’s mental health and wellbeing had improved, compared to 22% who said the NRP saw their child more than once a week. It is possible that this was a result of having less tension within the family unit. Parents with high conflict were more likely to report worse outcomes on their child’s wellbeing (29% compared to 10% with low conflict).
Further, over a third of parents (35%) of children with SEND reported better outcomes on their child’s wellbeing (compared to 28% without). These findings indicate that while parents of children with SEND may face challenges in making efficient child maintenance arrangements, separation itself can be a positive result for some.
Chapter summary
Nearly six in ten parents (and CMS users in particular) have accessed benefits payments as a result of their separation, but PWCs are nearly three times more likely than NRPs to have started claiming benefits as a result of separation. PWCs – the primary care-givers – are at higher risk of becoming financially strained as a result of separation. They are also more likely than NRPs to want more realistic financial arrangements.
However, PWCs report better outcomes on their financial circumstances, mental health and wellbeing, and their child’s mental health and wellbeing as the result of the separation.
There is differential impact when it comes to financial stability. Parents who are better-off financially report seeing their circumstances improve, while those who are worse-off financially, see their circumstances deteriorate.
The quality of relationships (rather than support arrangements) are key to better outcomes.
Parents of children with SEND face challenges in making efficient child maintenance arrangements, but separation itself can be a positive result for children’s mental health and wellbeing.
7. Conclusions
Ipsos MORI undertook a survey to explore the support needs of separated parents, to enable DWP to help more of these families to set up effective child maintenance arrangements. The research explored the following areas:
What maintenance arrangements are used?
- Most parents have arrangements for financial support, and half have arrangements for non-financial care, such as overnight stays or school pick-ups. Most of these arrangements are informal.
- A quarter of parents do not have arrangements for support. Most of these want to make arrangements, though not all parents want one. Conflict is a key barrier.
How effective are different arrangements for different groups of parents?
- Conflict can be a key factor in determining the quality of parental relationships and in parents’ ability to make arrangements for child maintenance. Parents with more amicable relationships and less conflict are more likely to have arrangements that work for them, typically through an FBA. On the other hand, parents with strained relationships and more conflict are more likely to not have arrangements, or to use the CMS. The service is providing valuable support to parents who may be unable to reach a private agreement on their own.
What factors influence separated parents’ choice of arrangements?
- Income (and therefore affordability) is a key factor in decision-making. It is also a key reason why some NRPs cannot comply with their financial arrangements.
- Parents who jointly make decisions on matters about their child are less likely to have conflict, and more likely to have FBAs. There is a need to support parents to resolve or minimise conflict, to help them reach FBAs.
How can separated parents be better supported?
- Parents want financial support to help the NRP comply with their agreements. There is also appetite for relationship support, more or better-quality contact with the child, and a clearer view on how money is being spent.
- The majority of parents who did not use support say that they do not need it. However, there are barriers to accessing support (including affordability and lack of awareness).
- Parents with vulnerabilities or more complex circumstances might not always be receiving the support they need to make child maintenance arrangements, including from family members.
- Parents are most likely to have used the Child Maintenance online calculator, a lawyer or solicitor, or the Child Maintenance Options service. They are least likely to have used enforcement measures by the CMS or mediators or relationship support. Support offered by charities or public organisations is felt to be the most useful.
- Parents want child maintenance calculations to accurately reflect the costs associated with raising a child, and more accurately reflect NRPs’ income and savings.
Technical appendix
Ipsos MORI undertook a telephone (CATI) and online survey of 2,489 non-matched separated parents. The target population was parents who:
- Had children under the age of 16 (or under 20 if in education or training); and
- Were no longer in a relationship or never had been in a relationship with the other parent of their child.
The survey included 1,555 interviews with PWCs who had the main day-to-day care and 934 interviews with NRPs.
Parents surveyed were non-matched, meaning they were not once a part of the same couple.
Where parents had more than one child or had separated from more than one partner, they were asked to base their answers on the child with the next birthday.
Sampling
Participants were selected to take part from four different sample sources:
- Participants from the DWP Family Resources survey who agreed to be contacted for further research;
- DWP records of Child Maintenance Service users including both PWCs and NRPs;
- DWP records of Universal Credit claimants who were separated and had a child;
- Ipsos MORI’s Knowledge Panel - a random probability online panel representative of adults in the UK. Panel members were screened to identify parents who meet the eligibility criteria listed above.
Samples from DWP records were drawn using random probability methods.
Prior to fieldwork, sampled individuals were sent an advance email (or a letter in the post where an email address was not available), which provided information about the survey and gave them an opportunity to opt out of taking part in the research. Telephone matching was also undertaken for leads without a valid telephone number.
Pilot survey
Ipsos MORI conducted 30 pilot interviews with separated parents between 5 and 9 February 2021. The questionnaire worked well in the field and only minor revisions were required for the mainstage.
Mainstage survey
The research fieldwork took place between 19 February and 23 March 2021. In total, 503 individuals took part via the Ipsos MORI panel, 1,071 took part by telephone (CATI) and 915 took part online.
Interviews averaged 20 minutes. The eligibility was 78%. The table below shows the sample outcomes and response rates for the CATI and online surveys:
| Outcome | CMS | FRS | UC | Total |
|---|---|---|---|---|
| Sample size | 5,433 | 2,574 | 5,437 | 13,444 |
| Ineligible (screened out) | 60 | 159 | 336 | 555 |
| Unusable (incorrect phone/email or opted out during fieldwork) | 3,953 | 1,768 | 3,765 | 9,486 |
| Sample available for fieldwork (excluding unusable leads and ineligible) | 1,420 | 647 | 1,336 | 3,403 |
| Completed interviews | 865 | 424 | 697 | 1986 |
| Refusals | 440 | 178 | 506 | 1124 |
| Live sample | 31 | 13 | 45 | 89 |
| Abandoned interviews (including those who started the online survey but did not complete it) | 84 | 32 | 88 | 204 |
| Eligibility (complete / (complete + ineligible) | 94% | 73% | 67% | 78% |
| Valid sample (fieldwork sample x eligibility) | 1,328 | 471 | 901 | 2,660 |
| Unadjusted response rate (complete / sample) | 16% | 16% | 13% | 15% |
| Co-operation rate (complete / complete + refusal + abandoned) | 62% | 67% | 54% | 60% |
| Adjusted response rate (complete / valid sample) | 65% | 90% | 77% | 75% |
Weighting
The survey data was weighted to be representative of the population of NRPs and PWCs by age and gender based on the Family Resources Survey 2019-20. Control weights were also applied to correct for oversampling of parents from UC and CMS sources. The table below shows the weighted and unweighted sample composition for PWCs and NRPs.
| Characteristic | PWCs: Weighted | PWCs: Unweighted | NRPs: Weighted | NRPs: Unweighted |
|---|---|---|---|---|
| Aged under 30 | 19% | 14% | 9% | 10% |
| Aged 30-39 | 35% | 34% | 30% | 30% |
| Aged 40-49 | 32% | 39% | 42% | 38% |
| Aged 50+ | 14% | 14% | 19% | 22% |
| Male | 11% | 16% | 88% | 90% |
| Female | 90% | 85% | 12% | 10% |
| Both parents have re-partnered since separation | 27% | 27% | 37% | 36% |
| Neither parents have re-partnered since separation | 20% | 19% | 15% | 16% |
| Never been in a relationship | 6% | 5% | 3% | 2% |
| In a relationship for <1 year | 7% | 7% | 4% | 4% |
| In a relationship for 1 to <5 years | 26% | 25% | 27% | 28% |
| In a relationship for 5+ years | 61% | 63% | 67% | 67% |
| Separated for <1 year 11% | 11% | 9% | 10% | |
| Separated for 1 to <5 years | 35% | 34% | 36% | 35% |
| Separated for 5+ years | 53% | 55% | 56% | 56% |
| Child has SEND | 26% | 26% | 17% | 17% |
| Child does not have SEND | 71% | 71% | 78% | 77% |
| Parent has long term condition or disability | 29% | 30% | 30% | 31% |
| Parent does not have long term condition or disability | 70% | 70% | 69% | 69% |
| Working or self-employed | 61% | 61% | 66% | 66% |
| Not working or economically inactive | 26% | 26% | 17% | 16% |
| Total household income <£10k | 22% | 21% | 19% | 21% |
| £10k to <£20k | 36% | 36% | 23% | 25% |
| £20k to <£30k | 18% | 19% | 21% | 20% |
| £30k to <£50k | 14% | 14% | 19% | 18% |
| £50k+ | 11% | 11% | 18% | 17% |
Survey questionnaire
Note
These questions have been adapted so that they can be asked online or using the telephone.
Section A: Introduction
Ask all
Good morning/afternoon, my name is….. I am calling from Ipsos MORI, an independent research organisation, on behalf of the Department for Work and Pensions.
Please can I speak to [insert name from sample]?
The government wants to understand how it can better support parents who are separated and have asked Ipsos MORI to carry out a research survey on their behalf.
All except knowledge panel: We are contacting you to ask about your views and support needs… [Tailor below depending on sample].
FRS sample: because you took part in the DWP Family Resources Survey in [Insert date from sample] and gave DWP permission to contact you for further research. In this survey you indicated that you are a parent who is separated.
UC Sample: because we understand from DWP records that you may be a parent who is separated.
CMS Sample: because we understand from DWP Child Maintenance Service records that you are a parent who is separated.
The survey should take around 20-25 minutes, and findings will help to improve future support for parents [Do not show if knowledge panel like yourself].
Interviewer: If respondent insists they don’t have any children, ask soft check else continue to second screen.
Soft check
Our records show that you may have a child aged [Insert age of child from sample] [If FRS sample: when you were interviewed in [Insert year from sample]. Please can we confirm whether you have any children under the age of 16 (or under 20 if they are in education or training), even if they are not living with you?
1. Yes – have child/children 2. No – don’t have any children in that age category
Thank you and close if 2 at soft check: Thank you for taking part in this survey. We do not have any further questions for you.
Second screen – read out to all
Before we start, We I would like to reassure you that your responses will be treated in confidence. All responses to this survey will be combined when we report the findings.
Add as necessary:
You can view more information about how we will protect your data by visiting clicking here: [Add link to privacy policy]
Ask all
A1: We would really like to hear about your experiences, but you don’t have to take part and your decision to do so is completely voluntary. Whether you take part or not will not affect your dealings with the DWP or any other government agencies in any way.
You can also stop the survey at any stage without giving a reason.
If you change your mind about participating in this research, please let us know as soon as possible by contacting UK-DWP-UC@Ipsos-MORI.com and where possible, we will not process this data.
Please click ‘next’ if you are happy to continue with the survey
Are you happy to proceed with the survey on this basis?
1. Yes
2. No (Thank and close)
Section B: Screening questions
Ask all. Single code. Min 1, Max 15. Allow DK or REF. Soft check if >9
B1: How many children under the age of 16 or under 20 if in education or training, do you have, even if they are not living with you?
Please include children that you have adopted, but don’t include stepchildren.
Enter numeric
Please type in your answer in numbers
Thank and close if 0, DK or REF AT B1
Ask all. Single code
B2: Are you currently separated from the other parent of [IF B1=1: your child] [B1>1: any of your children]?
By separated, we mean no longer in a relationship or never having been in a relationship.
Do not read out
Please select one answer
1. Yes, we are separated
2. No, we are still in a relationship
3. We have never been in a relationship
4. The other parent to my child(ren) is deceased
Thank you and close if 2 or 4 at B2.
If code 2: Thank you for taking part in this survey. We do not have any further questions for you.
If code 4: We are I am sorry to bother you and will update our records, so we don’t contact you again in relation to this research. Thank you very much for your time.
IF B1>1: We would like you to focus on one of your children with your separated partner when answering the questions. If there is more than one child, please select the one who will have the next birthday. If you have twins/triplets please focus on the first born.
Can I take a first name for your child with your other partner whose birthday is next, so I can refer to them at the relevant questions You can give them any name you like.
Please type in the first name of your child, so we can flag refer to them at the relevant questions. You can give them any name you like.
Open ended. Max 15 characters. Do not allow skip or DK
Error message if tries to skip: Please enter a name or nickname. You can give them any name you like.
Ask all. Single code
B3: Do you have the main day-to-day care of [If B1=1: your child] [B1>1: Insert name]?
Add as necessary: By day-to-day care, we mean any routine parental responsibilities.
Prompt codes
Please select one answer
1. Yes – I am the main carer
2. No – the other parent is the main carer
Dummy variable. Do not show on screen
Parent
Parent with care = Code 1 AT B3
Non-resident parent = Code 2 AT B3
Section C: Co-parenting and levels of contact
Ask all. Single code
C1: Ask if PWC code 1 at B3: How often, if at all, does the other parent see [B1=1: your child] [If B1>1: Insert name of child] in an average week, including overnight stays? If it varies, please select the most common.
Ask if NRP code 2 at B3: How often, if at all, do you see [B1=1: your child] [If B1>1: Insert name of child] in an average week, including overnight stays? If it varies, please select the most common.
Prompt codes
Please select one answer
1. 7 days (everyday)
2. 6 days
3. 5 days
4. 4 days
5. 3 days
6. 2 days
7. 1 day
8. Every other week or weekend
9. Once a month
10. A few times a year
11. Less often (Specify)
12. Never
13. Don’t know
Ask all. Single code
C2: How happy or unhappy are you with the level of contact that [If PWC code 1 at B3: the other parent has] [If NRP code 2 at B3: you have] with [B1=1: your child] [If B1>1: Insert name of child]?
Prompt to codes
Please select one answer
1. Happy with current contact
2. Would prefer more contact
3. Would prefer less contact
4. Don’t know
Ask if want more contact (code E 2 at C2). Multicode ok except DK/REF
C3: What, if anything, is preventing [If PWC code 1 at B3: the other parent; If NRP code 2 at B3: you] from having more contact with [B1=1: your child] [If B1>1: Insert name of child]?
Probe fully. Prompt to codes
Please select all that apply
1. Live too far away / travel
2. Issues with accommodation (e.g. lack of space)
3. Time restrictions (e.g. due to work responsibilities)
4. Difficult relationship between you and the other parent
5. Difficult relationship with your child(ren)
6. Financial difficulties or debt
7. Court order/restrictions
8. The impact it would have on the amount of financial support provided if [If PWC code 1 at B3 you, If NRP code 2 at B3 the other parent] spent more time caring for your child overnight
9. COVID-19 / coronavirus restrictions
10. The other parent does not want contact
11. The other parent’s new partner is preventing contact
12. Other (specify)
13. Don’t know
14. Prefer not to say
Ask all. Single code
C4: When it comes to making decisions about [B1=1: your child] [If B1>1: Insert name of child], which one of the following statements apply? read out 1-3
Please select one answer
1. I am the main decision maker
2. The other parent is the main decision maker
3. We make decisions together
4. Don’t know
Ask all. Single code per statement. Randomise statements. Reverse scale 1-5
C5: When you and the other parent discuss important matters [If B1>1: about Insert name of child], how often, if at all,…?
a) does this result in an argument? b) is the atmosphere one of hostility or anger? c) is the conversation stressful or tense? d) do you have differences in opinion about issues relating to bringing up your child?
Prompt to codes
Please select one answer (Scale: 1 = always, 5 = never)
1. Always
2. Often
3. Sometimes
4. Rarely
5. Never
6. N/A - we do not have any contact
Ask all. Multicode ok 1-15
C6: What are the barriers, if any, to successful co-parenting with the other parent?
Do not read out. Probe to code: Anything else?
Please select all that apply
1. Different parenting styles
2. We have a bad relationship / conflict
3. Other time commitments (e.g. your work)
4. Financial difficulties or debt
5. Lack of support from the other parent
6. COVID-19 / coronavirus restrictions
7. Drug, alcohol, or other substance misuse
8. Domestic abuse or violence (including stalking)
9. New family formation
10. Unsatisfactory contact with children
11. Existing court order
12. Distance / they live too far away
13. Other family members
14. Lack of communication
15. Other (specify)
16. None – no barriers
17. Don’t know
Section D: Different types of support and arrangements
In the next set of questions, we want to know about you as a parent. This section asks about the things you do to care for your child(ren) and your experiences of raising your child, since separating from their other parent.
If B1>1: Please answer these questions in relation to [Insert child name].
Ask all. Single code
D1: In what ways, if at all, [If PWC code 1 at B3: does the other parent; If NRP code 2 at B3: do you] provide care for [B1=1: your child] [If B1>1: Insert name of child]?
Add if PWC: Please include support that the other parent have agreed, either verbally or in writing, to provide even if you don’t receive the support in practice.
Add if NRP: Please include support that you have agreed, either verbally or in writing, to provide even if you don’t provide the support in practice.
Read out except DK
Please select one answer
1. Provide financial support (e.g. monthly payment or paying for goods and services)
2. Provide non-financial care (e.g. overnight stays or school pick-ups)
3. Provide both financial support and non-financial care
4. None of these [Go to D18]
Ask if provide non-financial support (Code 2 or 3 at D1)
D2: What types of non-financial care [If PWC code 1 at B3 does the other parent; if NRP code 2 at B3 do you] provide?
Prompt to codes
Please select all that apply
1. Daytime care
2. Overnight stays / care
3. School pickups
4. General support (e.g. with home improvements or shopping)
5. Help with homework
6. Non face-to-face contact (e.g. video or telephone calls)
7. Other (Specify)
8. Don’t know
Ask if provide non-financial support (Code 2 or 3 at D1). Single code per statement
D3: When it comes to the non-financial care that [If PWC code 1 at B3 the other parent provides; If NRP code 2 at B3 you provide], do you have any agreements about what will be provided, or not?
Prompt to codes
Please select one answer
1. Yes – a verbal agreement
2. Yes – a written agreement
3. Yes – other
4. No, we do not have an agreement
5. Don’t know
Ask if financial support (Codes 1 or 3 at D1). Single code
D4: How is the financial support between you and the other parent arranged?
Read out
Please select one answer
0. Child Maintenance Service Arrangement – money is collected by the CMS.
1. Child Maintenance Service Arrangement – money is paid directly to me (PWC)/the other parent (NRP)
2. Through a court order
3. Arranged or agreed privately between you – verbal
4. Arranged or agreed privately between you – written
5. Other
6. Don’t know
Ask if privately arranged financial support (Codes 3 or 4 at D4). Multicode OK
D5: What types of financial support [If PWC code 1 at B3 does the other parent; If NRP code 2 at B3 do you] provide?
Prompt to codes
Please select all that apply
1. Pay an ongoing monthly payment
2. Pay for daily expenses (e.g. food or travel)
3. Pay for goods or services (e.g. school uniforms, leisure trips, meals at restaurants)
4. Pay for ongoing costs (e.g. rent, mortgage, school tuition, medical expenses, school dinners)
5. Other
Ask if privately arranged financial support (codes 3 or 4 at D4). Multicode OK except DK
D6: How did you calculate the amount of financial support that [IF PWC code 1 AT B3 the other parent provides; IF NRP code 2 AT B3 you provide]?
Prompt to codes
Please select all that apply
1. Used online calculator on the Child Maintenance Service website
2. Looked at child’s outgoings and expenses
3. Considered what was affordable [NRP: for me] [PWC: for the other parent= NRP]
4. Considered [the income of the other parent: NRP] [my income: PWC], including benefit payments
5. Took number of overnight stays into consideration
6. Other (specify)
7. Don’t know
Ask if (code 0 or 1 at D4)
D7: Did the Child Maintenance Service calculation factor in…?
a) overnight care b) costs that may be incurred by [If PWC: the other parent] [If NRP: you] to maintain contact (i.e. travel, accommodation)
Do not read out
Please select one answer
1. Yes
2. No
3. Don’t know
Ask if provide support (D1=1-3). Multicode 1-4.
D8: In your opinion which, if any, of the following should be taken into account when calculating the amount of child maintenance to be paid?
Please select all that apply
Read out
1. Overnight stays
2. Day time care
3. School pick-ups/drop offs
4. Payments for regular goods or services (e.g after school clubs, music lessons)
5. None of the above should be taken into account
6. Don’t know
Ask if (code 1 or 2 at D4). Multicode OK except none
D9: Outside of any monthly Child Maintenance Service payments, what other types of financial support, if any, [If PWC code 1 AT B3 does the other parent; If NRP code 2 AT B3 do you] provide?
Prompt to codes
Please select all that apply
1. Pay an ongoing monthly payment
2. Pay for daily expenses (e.g. food or travel)
3. Pay for goods or services (e.g. school uniforms, leisure trips, meals at restaurants)
4. Pay for ongoing costs (e.g. rent, mortgage, school tuition, medical expenses, school dinners)
5. Other
6. None of these
Ask if provide financial support (Code 1 or 3 at D1). Single code. Reverse 1-4
D10: Thinking about the amount of financial support that was calculated or agreed, would you say that [If PWC code 1 at B3 the other parent generally pays; If NRP code 2 at B3 you generally provide]…?
Read out 1-4
Please select one answer
1. All of the money
2. Most of the money
3. Some of the money
4. None of the money
5. It varies too much to say
6. Don’t know
7. Prefer not to say
Ask if not providing all money (Codes 2-5 at D10). Multicode except DK and REF D11
What, if anything, would help [If PWC code 1 AT B3 the other parent to pay; If NRP code 2 at B3 you to provide] the full amount of financial support?
Prompt to code
Please select all that apply
1. Financial support or advice
2. Debt resolution
3. Job or income security
4. Not being on furlough
5. A clearer view of where the money goes / how it is being spent
6. More or better contact with your child(ren)
7. A better relationship between you and the other parent / less conflict / more co-operation
8. An agreement on the amount of money that is actually needed
9. Formal intervention (e.g. via a court)
10. Other (specify)
11. Don’t know
Ask if not fully supporting (Codes 1 or 2 at D1). Multicode OK except DK
D12: For what reasons, if any, [If PWC code 1 at B3 does the other parent of [B1=1: your child] [If B1>1: insert name of child]; If NRP code 2 at B3 do you] not provide…?
a) Ask if code 2 AT D1: financial support b) Ask if code 1 AT D1: non-financial support
Prompt to codes
Please select all that apply
D12 a) Codes if PWC code 1 at B3:
1. I do not want to receive this support from them
2. We have an arrangement for this support but it is not upheld in practice
3. They are not interested or willing to provide this type of support
4. They provide other types of support (e.g. care)
5. We were unable to reach an agreement for this type of support
6. They cannot afford to provide this type of support
7. Other (specify)
8. Don’t know
D12 a) Codes if NRP code 2 at B3:
1. They do not want to receive this support from me
2. We have an arrangement but I do not uphold it
3. I do not want to provide support to the other parent
4. I provide other types of support (e.g. care)
5. We were unable to reach an agreement for this type of support
6. I cannot afford to provide this type of support
7. Other (specify)
8. Don’t know
D12 b) Codes if PWC code 1 at B3:
1. I do not want to receive this support from them
2. We have an arrangement for this support but it is not upheld in practice
3. They are not interested or willing to provide this type of support
4. They provide other types of support
5. We were unable to reach an agreement for this type of support
6. Other time commitments (e.g. work)
7. Other (specify)
8. Don’t know
D12 b) Codes if NRP code 2 at B3:
1. They do not want to receive this support from me
2. We have an arrangement but I do not uphold it
3. I do not want to provide support to the other parent
4. Already providing other types of support
5. We were unable to reach an agreement for this type of support
6. Other time commitments (e.g. work)
7. Other (specify)
8. Don’t know
Ask if any codes 1-3 1-3 at D1
The next set of questions ask you about your support and care arrangements. Please think about all of the financial and/or non-financial support that you [If PWC code 1 at B3 receive; If NRP code 2 at B3 provide] when answering.
Ask all codes 1-3 at D1. Single code. Reverse scale except DK
D13: How satisfied or dissatisfied, if at all, are you with your current arrangements for support?
Prompt to codes
Please select one answer
1. Very satisfied
2. Fairly satisfied
3. Neither satisfied nor dissatisfied
4. Fairly dissatisfied
5. Very dissatisfied
6. Don’t know
Ask all codes 1-3 at D1. Single code
D14: Would you like to have a different arrangement for support with the other parent, to care for your child(ren), or not?
Do not read out
Please select one answer
1. Would like a different arrangement
2. Happy with current arrangement
3. I would prefer not to have an arrangement
4. Don’t know
Ask if want different arrangement (Code 1 at D14). Multicode OK except DK
D15: What would you like to be different about your arrangement for support with the other parent?
Prompt fully and select and all that apply
Please select all that apply
If NRP:
1. I want to see my child more regularly
2. I want to see my child less regularly
3. I want to share responsibilities equally / 50:50
4. I want full custody / care of my children
5. I want our financial agreement to take into account my income / be more realistic
6. I want an arrangement that allows me to work
7. Other (specify)
8. Don’t know
If PWC:
9. I want the other parent to see my child more regularly
10. I want the other parent to see my child less regularly
11. I want to share responsibilities equally / 50:50
12. I want full custody / care of my children
13. I want more financial support
14. I want an arrangement that allows me to work
15. Other (specify)
16. Don’t know
Please type your answer in the box below
Ask if do not want an arrangement (code 3 at D14)
D16: Why do you prefer not to have an arrangement for support with the other parent?
Prompt fully and write out in full
Please type your answer in the box below
Ask if want a different arrangement (Code 1 at D14). Multicode OK except DK
D17: What, if anything, is preventing you from having the arrangement that you would like?
Prompt to codes
Please select all that apply
1. Disagreements on what the arrangement should be between you and the other parent / lack of co-operation
2. Conflict between you and the other parent
3. Financial difficulties or debt
4. I do not feel confident that the agreement would be upheld
5. Re-partnering / new family formation
6. Employment / work circumstances
7. Issues with accommodation
8. Distance / live too far away
9. Other (specify)
10. Don’t know
People without an arrangement
Ask if do not have an arrangement (code 4 at D1). Multicode OK except DK and REF
D18a: Please could you tell us why you have not arranged to [If NRP: provide support to] [If PWC: receive support from] the other parent of [B1=1: your child] [If B1>1: insert name of child]?
Probe fully and select all that apply
Please select all that apply
If NRP:
1. I do not want to provide support
2. We do not get on / do not have a good relationship
3. They do not want me to have contact or offer support
4. I don’t have the means to offer support
5. Distance / we live too far away
6. The other parent can manage by themselves
7. Other (specify)
8. Don’t know
9. Prefer not to say
If PWC:
1. They do not want to provide support
2. We do not get on / do not have a good relationship
3. I do not want them to have contact or offer support
4. They don’t have the means to offer support
5. Distance / we live too far away
6. I can manage by myself
7. Other (specify)
8. Don’t know
9. Prefer not to say
Ask if do not have an arrangement (Code 4 at D1). Multicode 1-4.
D18b: In your opinion which, if any, of the following should be taken into account when calculating the amount of child maintenance to be paid?
Please select all that apply
Read out
1. Overnight stays
2. Day time care
3. School pick-ups/drop offs
4. Payments for regular goods or services (e.g after school clubs, music lessons)
5. None of the above should be taken into account
6. Don’t know
Ask if do not have an arrangement (Code 4 at D1). Single code.
D19: Would you like to have an arrangement in place for support with the other parent, or not?
Do not read out
Please select one answer
1. Yes
2. No
3. Don’t know
Ask if would like to have an arrangement (Code 1 at D19). Multicode OK except DK, Nothing
D20: What support, if any, would help you to have an arrangement in place for support with the other parent of [B1=1: your child] [If B1>1: insert name of child]?
Please select all that apply
Prompt fully
1. Parental relationship support (e.g. to reduce conflict or improve communication)
2. Parenting support to enable you to co-parent your child(ren)
3. A mediator
4. A service which helps ensure payments are made
5. Stronger enforcement and consequences if the arrangement is not upheld
6. A child maintenance calculation that more accurately looks at income and savings
7. Guidance on creating a written agreement between us
8. Financial/money/debt advice
9. Support to increase my income (e.g. help to find/change work)
10. Support with legal costs
11. Support from a health professional for myself or the other parent (e.g. for physical or mental health or illness)
12. Support with understanding/explaining my child’s physical/emotional needs
13. Childcare support
14. Other (specify)
15. Nothing
16. Don’t know
Section F: Pre-separation and use of support
The next set of questions ask about the relationship that you have with [B1=1: your child] [If B1>1: insert name of child] and their other parent.
Ask all except code 3 at B2. Single code
F1: Before your separation, what was your relationship status with the other parent of [B1=1: your child] [If B1>1: insert name of child]?
Prompt to codes
Please select one answer
1. Married or in a civil partnership and living together
2. Married or in a civil partnership, but not living together
3. Together, but not married or in a civil partnership and living together
4. Together, but not married or in a civil and not living together
5. Never together or in a relationship
6. Other (specify)
7. Prefer not to say
Ask all. Display as a grid with codes as rows and scale as columns. Single code for each code
F2: I am going to read out a list of services and support options available to separated parents. For each, please tell me if you have used the support, or did not use it but would have liked to?
Below is a list of services and support options available to separated parents. For each, please tell us if you have used the support, or did not use it but would have liked to?
1. Child Maintenance Options service
2. Child maintenance online calculator
3. Local mediator / Arbitration / Relationship support
4. Lawyer or solicitor
5. Family court
6. Enforcement measures by the Child Maintenance Service
7. Support from a charity or public organisation e.g. Citizen’s Advice, Gingerbread
Prompt to codes
Please select one answer for each service
1. Used
2. Not used, but would have liked to use
3. Neither
4. Don’t know
Online: Add clickable info boxes next to each code:
1. Child Maintenance Options is a free service that provides impartial information and support to help separated parents make decisions about their Child Maintenance arrangements.
After using the Child Maintenance Options Service some parents make private arrangements (Family Based Arrangements / FBAs) and others go on to use the Child Maintenance Service (CMS) for their arrangements. The Child Maintenance Options service is the first point of contact for anyone looking to use the CMS.
Child Maintenance online calculator:
2. This is a free tool provided by the Child Maintenance Service (on gov.uk) that allows parents to work out an amount of child maintenance for their child(ren). It factors in things like overnight stays. This tool is available to everybody, not just CMS users.
3. These are independent professionals who support families through their separation. They are alternatives to going to court. Most people are required to attend a Mediation Information and Assessment Meeting before going to court.
4. Lawyers can provide advice to parents about their options when deciding their child maintenance arrangement. It could progress to the court but it does not have to.
5. This support is used if the parent/parents want a court to make a decision or have concerns about domestic abuse or child abuse’ Most people must attend a Mediation Information and Assessment Meeting before going to court.
6. Without a court order, the CMS has a range of powers to collect arears, these include:
- Deduction from Earnings Order: An employer deducts payment for arrears direct from the Paying Parent’s salary.
- Deduction Order: a lump sum or regular deductions are made from bank accounts
- Collection of Assets: money can be taken from a deceased paying parent’s estate.
With a court order, the CMS can:
- Force the sale of a paying parent’s property.
- Disqualify paying parent from driving
- Hold a paying parent’s passport
- Impose a prison sentence on the paying parent.
7. These are independent organisations that provide advice and support to separating and separated parents.
Ask for all scale 1 at F2. Single code per service code per service. Display as grid with services as rows and scale as columns.
Reverse scale
F3: And how useful, if at all, did you find…?
[insert services with scale 1 at F2]
Prompt to codes
Please select one answer for each service
1. Very useful
2. Fairly useful
3. Somewhat useful
4. Not at all useful
5. Don’t now
Ask if code 5 at F2. Multicode except DK and REF
F4: For what reasons have you been to family court?
Prompt to codes
Please select all that apply
1. To make financial arrangements
2. To make parenting / contact / residence arrangements
3. For arrangements relating to an adoption
4. Public law arrangements / relating to children taken into care
5. Other
6. Don’t know
7. Prefer not to say
Ask if did not use support at F2 (codes 2 or 3 or DK at all statements). Multicode OK except DK
F5: For what reasons did you not use any support?
Probe fully. Prompt to codes
Please select all that apply
1. Did not need support
2. Was unsure where to go / what support was available
3. Could not afford to pay for it
4. Did not think the support would be helpful
5. Was not able to access online support (e.g. not confident using the Internet)
6. Felt the support would work against me / would only benefit the other parent
7. Other (specify)
8. Don’t know
Ask all. Multicode OK except none of these and DK
F6: Which of the following types of support, if any, do you currently receive to help you care for [B1=1: your child] [If B1>1: insert name of child]?
Read out
Please select all that apply
Financial support
1. Financial support from your new partner (or their family)
2. Financial support from members of your own family
3. Financial support from members of the other parent’s family
Non-financial support
4. Non-financial support from your new partner (or their family) (e.g. childcare, school pickups)
5. Non-financial support from members of your own family (e.g. childcare, school pickups)
6. Non-financial support from members of the other parent’s family (e.g. childcare, school pickups)
7. None of these
8. Don’t know
Section G: Impact of separation
Ask all. Single code per statement. Reverse scale 1-5
G1: Has . . . got better or worse since you separated from the other parent?
a) your mental health and wellbeing b) your child(ren)’s mental health and wellbeing c) your ability to financially support your child(ren)
Prompt to codes
Please select one answer
1. Significantly better
2. Somewhat better
3. About the same
4. Somewhat worse
5. Significantly worse
6. Don’t know
Ask all. Multicode OK except DK/REF and code 7
G2: Which benefits payments, if any, did you access as a result of separation?
Prompt to codes
Please select all that apply
1. Income Support
2. Job Seeker’s Allowance
3. Child Benefit
4. Universal Credit
5. Child Tax Credit
6. Employment and Support Allowance
7. None of these
8. Don’t know
9. Prefer not to say
Section H: Demographics
These last questions are all about you and will help to classify your answers. Please remember that your answers are completely confidential and will only be reported on at an aggregate level.
Ask all except if code 3 at B2. Single code
H1: For approximately how long had you been in a relationship with the other parent of [B1=1: your child] [If B1>1: insert name of child], before you separated?
Prompt to codes
Please select one answer
1. Never been in a relationship
2. Less than 6 months
3. 6 months up to 1 year
4. 1 year up to 5 years
5. 5 years up to 10 years
6. 10 years or longer
7. Don’t know
8. Prefer not to say
Ask all except if never been in a relationship: code 3 at B2 or if code 1 at H1. Single code
H2: And for how long, approximately, have you been separated for?
Prompt to codes
Please select one answer
1. Less than 6 months
2. 6 months up to 1 year
3. 1 year up to 5 years
4. 5 years up to 10 years
5. 10 years or longer
6. Don’t know
7. Prefer not to say
Ask all. Single code
H3: Are you currently in a relationship with someone else?
Prompt to codes
Please select one answer
1. Yes – married or in a civil partnership, and living together
2. Yes – married or in a civil partnership, but not living together
3. Yes – and living together
4. Yes – but not living together
5. No
6. Don’t know
7. Prefer not to say
Ask all. Single code
H4: Is the other parent of [B1=1: your child] [If B1>1: insert name of child] currently in a relationship with someone else?
Prompt to codes
Please select one answer
1. Yes – married or in a civil partnership, and living together
2. Yes – married or in a civil partnership, but not living together
3. Yes – and living together
4. Yes – but not living together
5. No
6. Don’t know
7. Prefer not to say
Ask all. Single code
H5: Do you consider any of your children aged under 16 (or under 20 if in education or training) to have a Special Educational Need or Disability (send)?
Do not read out
Please select one answer
1. Yes
2. No
3. Don’t know
4. Prefer not to say
Ask all. Single code
H6: How old will [insert name of child] be on their next birthday?
Prompt to codes
Please select one answer
1. Under 5
2. 5 to under 10
3. 10 to under 16
4. 16 to under 18
5. 18 or older
6. Prefer not to say
Ask if sample = FRS. For all other, take from sample
H7: How old were you on your last birthday?
Prompt to codes
Please select one answer
1. Under 18
2. 18-29
3. 30-39
4. 40-49
5. 50-59
6. 60+
7. Prefer not to say
Do not ask – Take from sample
H8: Gender
Do not ask – Take from sample
H9: Region
Ask all. Single code
H10: What is your ethnic origin?
Prompt to codes
Please select one answer
1. White British
2. White Irish
3. Other White background
4. Mixed White and Black Caribbean
5. Mixed White and Black African
6. Mixed White and Asian
7. Other Mixed background
8. Indian
9. Pakistani
10. Bangladeshi
11. Other Asian background
12. Caribbean
13. African
14. Other Black background
15. Chinese
16. Other ethnic background (please type in)
17. Prefer not to say
Ask all. Single code
H11: Do you consider yourself to have any long-term disabilities or health conditions?
Do not read out
Please select one answer
1. Yes
2. No
3. Prefer not to say
Ask all. Single code
H12: What is your employment status?
Prompt to codes. If participant says more than one thing, ask them what they spend most of their time doing
Please select one answer – the one you spent most of your time doing.
1. Working full-time
2. Working part-time
3. Self-employed
4. Furloughed
5. Looking after the home
6. Retired
7. Unemployed but looking for work
8. Permanently sick/disabled
9. Student
10. Full-time carer
11. Other (specify)
12. Prefer not to say
Ask all. Single code
H13: What is your total household income per year from all sources, before tax and other deductions?
Please be reassured your response will be treated in the strictest confidence and will only be reported in an aggregate way.
Prompt to codes
Please select one answer
1. Less than £10,000
2. £10,000 up to £19,999
3. £20,000 up to £29,999
4. £30,000 up to £39,999
5. £40,000 up to £49,999
6. £50,000 up to £74,999
7. £75,000 up to £99,999
8. £100,000 or more
9. Don’t know
10. Prefer not to say
Ask all except knowledge panel. Single code
H14: The Department for Work and Pensions (DWP) would like to add information held on your benefits, employment and earnings to your survey answers. This will give them a better picture of the circumstances of parents who are separated.
All information will be used for research and statistical purposes only and will not contain your name or address. Your responses would only be seen by a small number of researchers within DWP, and no-one else. Your dealings with DWP or any other government agencies will not be affected in any way, and the information will not be used to work out whether anyone is claiming benefits they should not be.
Are you willing for us to let DWP match your answers to your records?
Do not read out
Please select one answer
1. Yes
2. No
Ask all. Single code
H15: Thank you for taking part in this research. The Department for Work and Pensions (or agencies that it is working with) may want to contact you again in the future about topics related to this research. Would that be ok?
You do not have to commit to anything now, just indicate a willingness to be contacted again in the next 12 months.
Do not read out
Please select one answer
1. Yes
2. No
If yes to either H14 or H15, display name, email address, and phone number from sample and confirm
Thank and close
-
See Separated families statistics April 2014 to March 2020 ↩
-
Small base sizes apply ↩
-
It is possible that there were differences in interpretation by parents when answering this question so apply caution when interpreting the findings. ↩
-
Small base sizes apply ↩
-
This question asked people which benefit payments did they access as a result of separation. We are unable to tell if parents accessed benefits prior to separation, or whether they have included benefits that have been split following their separation e.g Universal Credit – going from one household to two and making a new claim. ↩