State Pension uprating
Updated 6 October 2026

© Crown copyright 2026
This publication is licensed under the terms of the Open Government Licence v3.0 except where otherwise stated. To view this licence, visit nationalarchives.gov.uk/doc/open-government-licence/version/3 or write to the Information Policy Team, The National Archives, Kew, London TW9 4DU, or email: psi@nationalarchives.gov.uk.
Where we have identified any third party copyright information you will need to obtain permission from the copyright holders concerned.
This publication is available at https://www.gov.uk/government/publications/state-pension-uprating-analysis-2026/state-pension-uprating
Introduction
The State Pension is uprated annually. The government has committed to uprating on the basis of the Triple Lock throughout this parliament. This will see the basic State Pension (bSP) and the full rate of the new State Pension (nSP) increase by the highest of growth in average earnings, growth in the consumer price index (CPI) or 2.5% and reach a record high relative to earnings over the coming three years.
From April 2030 the government will adjust the Triple Lock, delivering a rising pension every year that protects against price rises and ensures that pensioners benefit as the economy grows via the State Pension retaining that record high value relative to earnings. In any given year it will go up by at least inflation or 2.5% – and anything more that is needed to retain that value. This means that over time the State Pension is set to rise in line with average earnings.
This ad hoc analysis shows the long-term impact of an adjusted Triple Lock from April 2030, including indicative long-term Annually Managed Expenditure (AME) savings figures. The publication is intended to support public understanding. The results should be read alongside the methodology, and assumptions set out below.
Methodology
Model, period and coverage
These long run estimates were produced using DWP’s dynamic microsimulation model, Pensim3. Pensim3 uses administrative and survey data, including the Family Resources Survey, to project the population and individual pension outcomes from 2018 to 2100. The analysis in this publication covers Great Britain. Estimates are based on the Office for National Statistics (ONS) 2024-based national population projections.
Method
Savings estimates are produced by comparing long-run projected State Pension expenditure under the adjusted Triple Lock uprating mechanism with expenditure under the current Triple Lock. State Pension values for the basic and new State Pension for each uprating mechanism are derived in future years. Components of the pre-2016 State Pension that are not covered by the Triple Lock are assumed to continue to be uprated by CPI. A negative estimate represents a saving relative to the Triple Lock, while a positive estimate represents an additional cost. Estimates are presented in both nominal and real terms. These are direct impacts on Annually Managed Expenditure (AME) and do not account for tax or debt interest effects.
For each year, modelled incomes of people above State Pension age were compared with a projected poverty threshold. The poverty threshold is based on Households Below Average Income data for financial year ending 2025 and is projected forward in line with average earnings growth. Estimates are presented for relative low income, defined as household income below 60% of the contemporary median.
Poverty analysis has been conducted for relative low income after housing costs, with housing costs projected based on tenure, age and income quintile. Further information on the methodology behind these measures can be found in How low income is measured in households below average income statistics and in Household below average income series: quality and methodology information report FYE 2021.
Limitations
Pensim3 relies on assumptions about demographic change, labour-market behaviour, pension participation, benefit receipt and the wider economy. Outcomes become more uncertain further into the projection period and should therefore be interpreted as broad indications of direction and scale.
The analysis isolates the modelled effect of uprating policy, rather than behavioural responses or wider policy and macroeconomic changes.
Expenditure estimates are inherently uncertain because they depend on assumptions about future earnings growth, inflation, caseloads, mortality, migration and State Pension entitlements. In particular, the Triple Lock and the adjusted Triple Lock respond differently to movements in earnings and inflation, which can compound over time and affect projected expenditure. These savings should not be used to then derive further point estimates for savings in an individual year and should instead be relied on for long-term estimates.
Uprating scenarios
The analysis provides illustrative savings and poverty projections under an adjusted Triple Lock State Pension uprating. The analysis applies a path for uprating the basic and new State Pension under the adjusted Triple Lock and resulting pensioner incomes are then compared to a projected poverty threshold.
The analysis is illustrative and are not forecasts of future government policy. Results are projections conditional on the assumptions used, rather than predictions of future poverty rates.
Impacts
Pensioner relative poverty after housing costs is projected to decline over the period when using the adjusted Triple Lock uprating mechanism as described above.
Chart 1: Projected changes in pensioner relative poverty after housing costs compared to 2024 to 2025
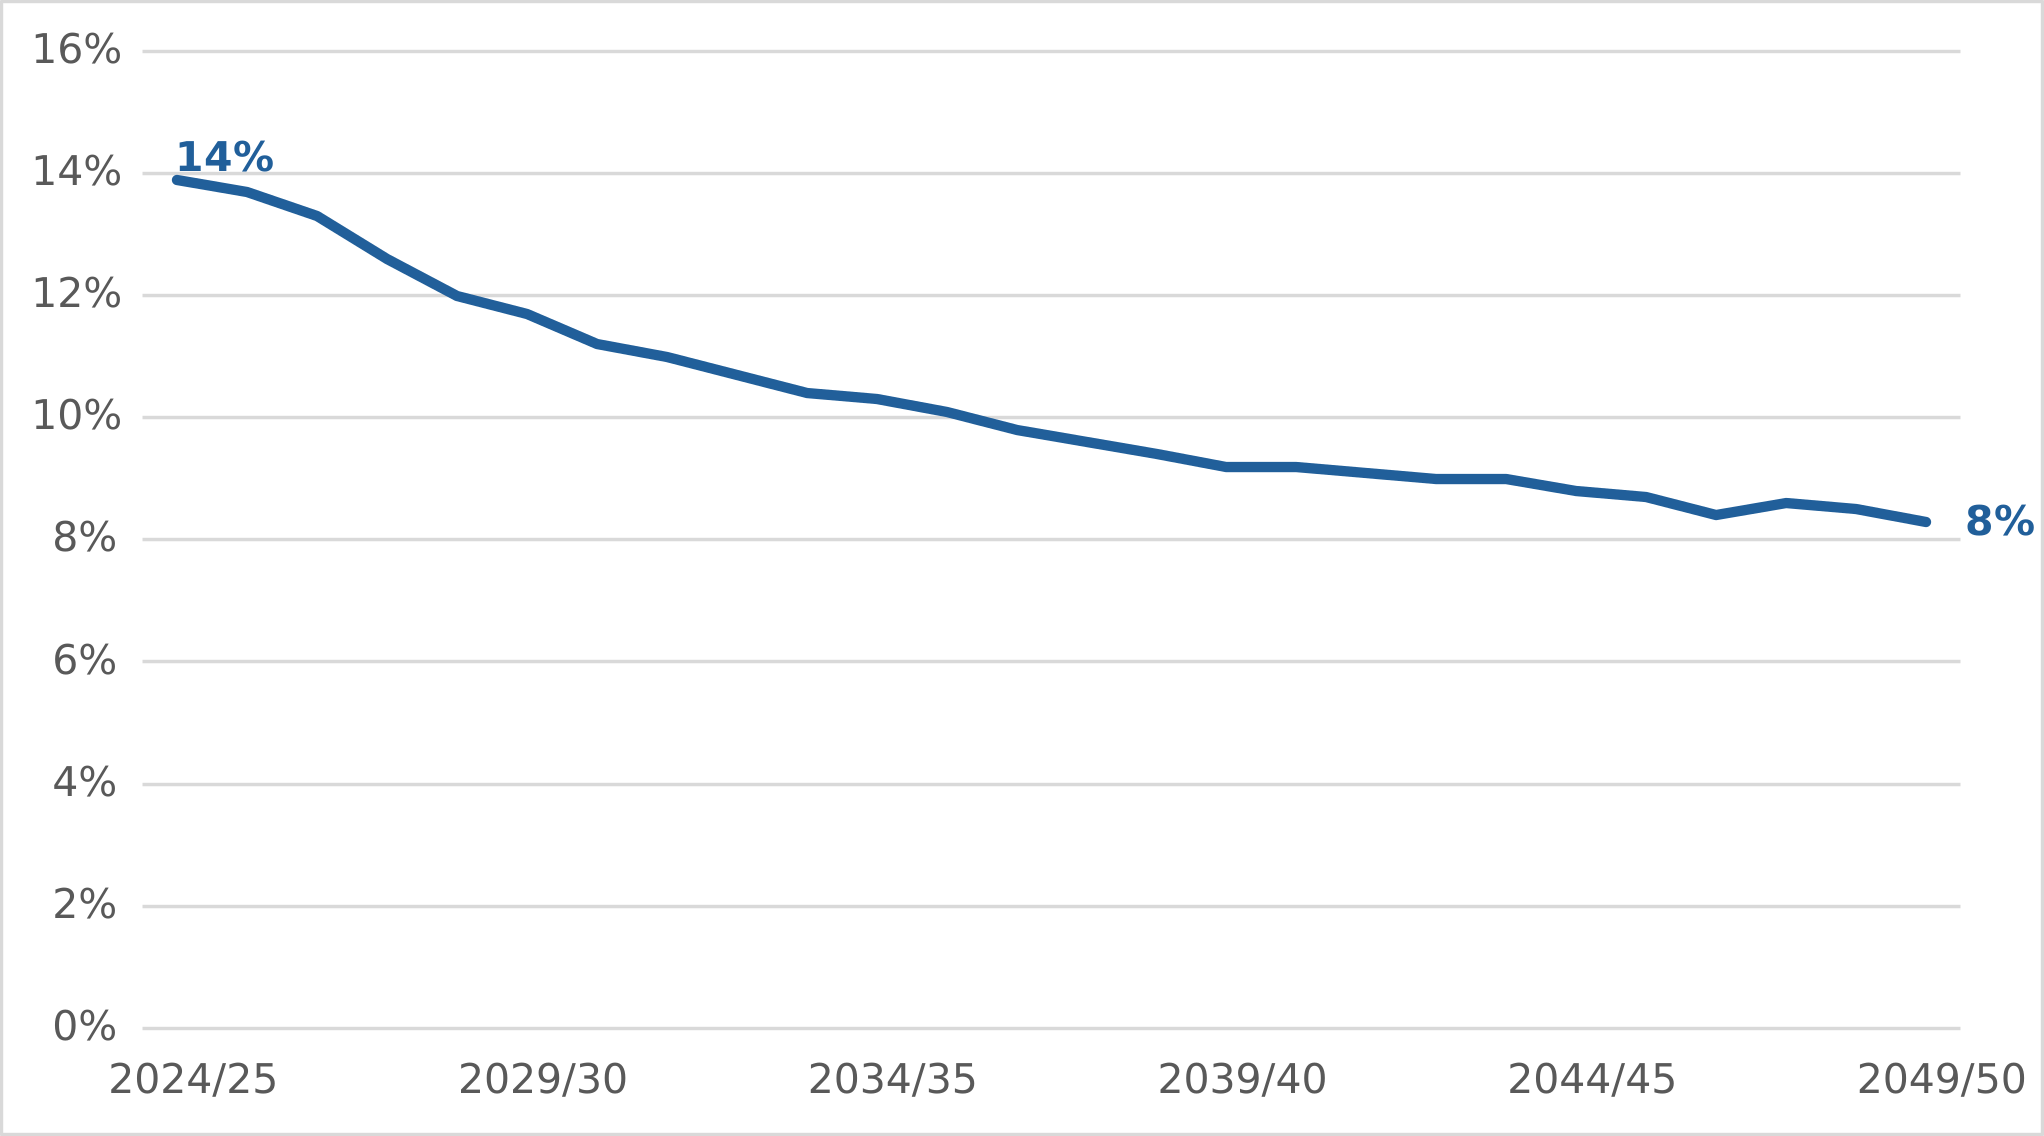
Chart 1 shows that relative pensioner poverty after housing costs under the adjusted Triple Lock is projected to fall from around 14% in 2024 to 2025 to around 8% in 2049 to 2050.
Table 1: Estimated AME savings of adjusted Triple Lock policy relative to Triple Lock (nominal)
| In-year AME savings (nominal terms, rounded to nearest billion, negative values denote savings) | 2039 to 2040 | 2049 to 2050 |
|---|---|---|
| Adjusted Triple Lock | -£15 billion | -£50 billion |
Table 2: Estimated AME savings of adjusted Triple Lock policy relative to Triple Lock (real)
| In-year AME savings (real terms, 2025 to 2026 prices, rounded to nearest billion, negative values denote savings) | 2039 to 2040 | 2049 to 2050 |
|---|---|---|
| Adjusted Triple Lock | -£11 billion | -£30 billion |
Statement of compliance with the Code of Practice for Statistics
The Code of Practice for Statistics (the Code) is built around 3 main concepts, or pillars:
- trustworthiness – is about having confidence in the people and organisations that publish statistics
- quality – is about using data and methods that produce statistics
- value – is about publishing statistics that support society’s needs
The following explains how we have applied the pillars of the Code in a proportionate way.
Trustworthiness
The figures were created to understand the impact of a different uprating mechanism for the State Pension. They are being published to give equal access to all those with an interest in them.
Quality
The data that underpins this information is taken from DWP’s dynamic microsimulation model PENSIM3, which uses both administrative and survey data.
Value
Releasing this information serves the public interest in understanding the impact of a different uprating mechanism on the State Pension. The figures also help reduce the administrative burden of answering Parliamentary questions, Freedom of Information requests and other forms of ad hoc enquiry and serves public.
Further information and feedback
Contact DWP Press Office if you have any questions or feedback.