Chapter 5: Geography that matters: travel-to-work area analysis
Published 29 October 2026

© Crown copyright 2026
This publication is licensed under the terms of the Open Government Licence v3.0 except where otherwise stated. To view this licence, visit nationalarchives.gov.uk/doc/open-government-licence/version/3 or write to the Information Policy Team, The National Archives, Kew, London TW9 4DU, or email: psi@nationalarchives.gov.uk.
Where we have identified any third party copyright information you will need to obtain permission from the copyright holders concerned.
This publication is available at https://www.gov.uk/government/publications/state-of-the-nation-2026-whos-getting-ahead/chapter-5-geography-that-matters-travel-to-work-area-analysis
Highlights
In this new analysis, we examine how patterns of labour market conditions vary across travel-to-work areas (TTWAs) instead of across local authorities (LAs). Administrative boundaries like LAs often hide the real geography of opportunity, because people often travel to a neighbouring LA for work, especially in big cities. TTWAs vary in size because they depend on local commuting patterns.
As with LAs, the TTWAs with the most favourable opportunities are mainly located in the south of England. Likewise, both LAs and TTWAs with the least favourable opportunities tend to be in former industrial areas, rural areas, and old coastal ports and seaside towns.
But there are important differences between the findings for LAs and TTWAs. The TTWA analysis identifies areas with favourable opportunities further from London, including Derby, Preston and York and, most significantly given its size, Leeds.
The influence of major cities with favourable opportunities can spread across several adjoining LAs. For example, the Belfast TTWA takes in much of the Lisburn & Castlereagh district. The Cardiff TTWA takes in parts of Vale of Glamorgan, Newport, Neath Port Talbot, among other areas. We can think of such areas as ‘city regions’.
City regions with the most favourable labour market opportunities for young people include Bristol, Edinburgh, Oxford and Reading, as well as London. City regions with the least favourable labour market opportunities include Doncaster, Middlesbrough & Stockton and Sunderland, alongside more rural or isolated areas such as Berwick, Dumfries, Llanelli, Margate & Ramsgate and Skegness & Louth.
Some small TTWAs, like Cromer & Sheringham, Skegness & Louth and Margate & Ramsgate, are local labour markets within geographically large LAs, so their disadvantaged position was invisible in our research on LAs. Some TTWAs with less favourable opportunities, such as Berwick and Hexham, even cross borders; again, this makes them invisible when using LA boundaries.[footnote 1]
TTWAs spanning multiple local authorities may have implications for the organisation of local government. For example, if neighbouring LAs take different and incompatible approaches to transport policy when they both belong to the same commuting zone, this is clearly inefficient.
Introduction
In our State of the Nation 2024 report, we presented the results from our composite index of Labour Market Opportunities for young people (aged 16 to 29 years).[footnote 2][footnote 3] We showed a strong north-south divide: most of the LAs with favourable labour-market opportunities were located in the south, especially in London. In contrast, many of the LAs with unfavourable opportunities were located in the north east of England, especially in former industrial and port areas, as well as in more rural areas, such as Northumberland and the Shetland Islands. This north-south divide reflected the patterns of economic growth across the UK, with London and the South East showing the highest levels of economic growth in recent decades.
This chapter introduces an innovative analysis that measures labour market opportunities for young people, as well as innovation and growth, using a more relevant geographical unit: the TTWA. TTWAs can be thought of as commuting zones or geographical labour markets.[footnote 4] For example, there is a TTWA surrounding and including London, which is the area whose residents typically work in the capital. TTWAs are constructed so that relatively few people commute across their boundaries. This avoids the arbitrariness of traditional administrative boundaries.
TTWAs are self-contained areas where most residents (75%) also work, and most workers in the area also live. They are a better choice for analysis than LAs because, in big cities like London or Manchester, people often live in one LA but travel to an adjacent one. Therefore using the LA where they live might not show their true job opportunities. TTWAs reduce this problem. For example, geographically large LAs, like Cornwall, can contain several smaller TTWAs with very different job markets. Looking at the whole LA could hide these local differences in opportunity.
Methodology
Construction of the indices
We follow the same methodology as for the LA-level composite indices. In order to improve the reliability of the estimates, we use multiple indicators (in this case the percentages of young people aged 16 to 34 years in employment, in professional and in working-class jobs). We use principal component analysis, a technique that analyses multiple indicators to produce a single score for each area.[footnote 5] We then work out the position of each TTWA according to this single score. Due to the small sample sizes for some rural TTWAs, we use a statistical method (multi-level modelling) to make the results more reliable. This method treats both extreme results and those results based on small sample sizes with more caution.[footnote 6] Details of the coding of TTWAs are shown in the technical annex.
To measure job opportunities for young people aged 16 to 34 years, we combine 3 indicators:
-
Percentage of young people in employment
-
Percentage of young people in professional jobs
-
Percentage of young people in working-class jobs[footnote 7]
In the State of the Nation 2025 report, the index of Innovation and Growth was based on 3 indicators:
-
Percentage of economically active individuals in the LA (aged 25 to 64 years) who had higher degrees
-
Percentage of people working in new economy occupations – those at the leading edge of research, innovation and development, such as carbon capture engineers or bioinformatics scientists
-
Gross value added (GVA) per head[footnote 8]
In this year’s report, we use the same 3 indicators but calculate GVA per employed person in the TTWA (rather than per head of population) as the number of employed people is a more appropriate denominator than the total population in the case of labour markets.[footnote 9] This new version has satisfactory technical properties when applied to TTWAs (see the technical annex for details).
Construction of the travel-to-work areas
TTWAs are self-contained areas where most residents (75%) also work, and most workers in the area also live. In some cases like medium-sized cities (for example, Bradford), LAs and TTWAs will more or less coincide. However, in large conurbations with good transport infrastructure (for example, London or the Greater Manchester area) many people will live in one LA but work in a neighbouring one, as figure 5.1 shows. In contrast to large conurbations where a single TTWA encompasses multiple LAs, there are also some geographically large LAs, such as the Highlands, Norfolk and Cornwall, that also encompass multiple small TTWAs. A focus on LAs could therefore also be misleading in these cases, since there may be unequal labour-market environments within the same LA.
Figure 5.1: Map of overlap between travel-to-work areas (TTWAs) and local authorities (LAs).
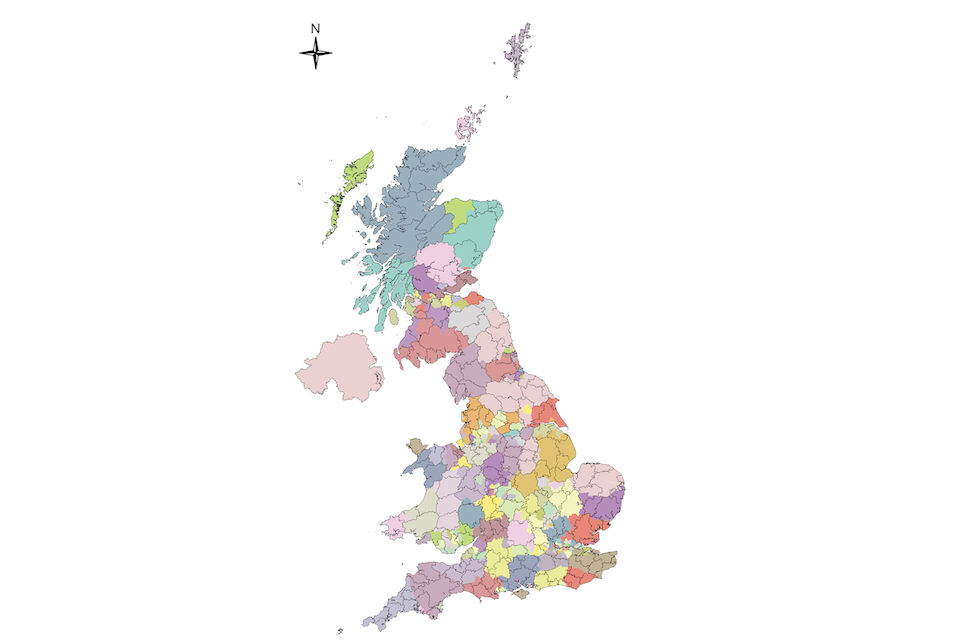
Source: Social Mobility Commission’s elaboration based on Office for National Statistics (ONS), Open Geography Portal data on TTWAs (2011) to Local Authority (LA) districts (2022).
Note: The zoomed-in key shows the overlap of LAs and the TTWAs in the Greater London area, where the coloured sections represent unitary and upper-tier LAs and the black line outlines the TTWA boundary. In the case of Northern Ireland, our data source – the LFS – does not enable us to distinguish different TTWA.
Limitations
The TTWA boundaries we used are based on data from the 2011 Census, which may now be out of date. The Office for National Statistics (ONS) will update these in due course. There is also a possibility that young people with lower salaries might not travel as far for work as older, higher-paid people. Finally, the data tells us where people live now, not where they grew up. If people move for better jobs or education, this will affect what the data shows about opportunities.
Since the scores are estimates based on survey samples, they are not exact measurements. They should be used as a guide and more attention should be paid to the largest and most significant scores.
Labour market opportunities for young people
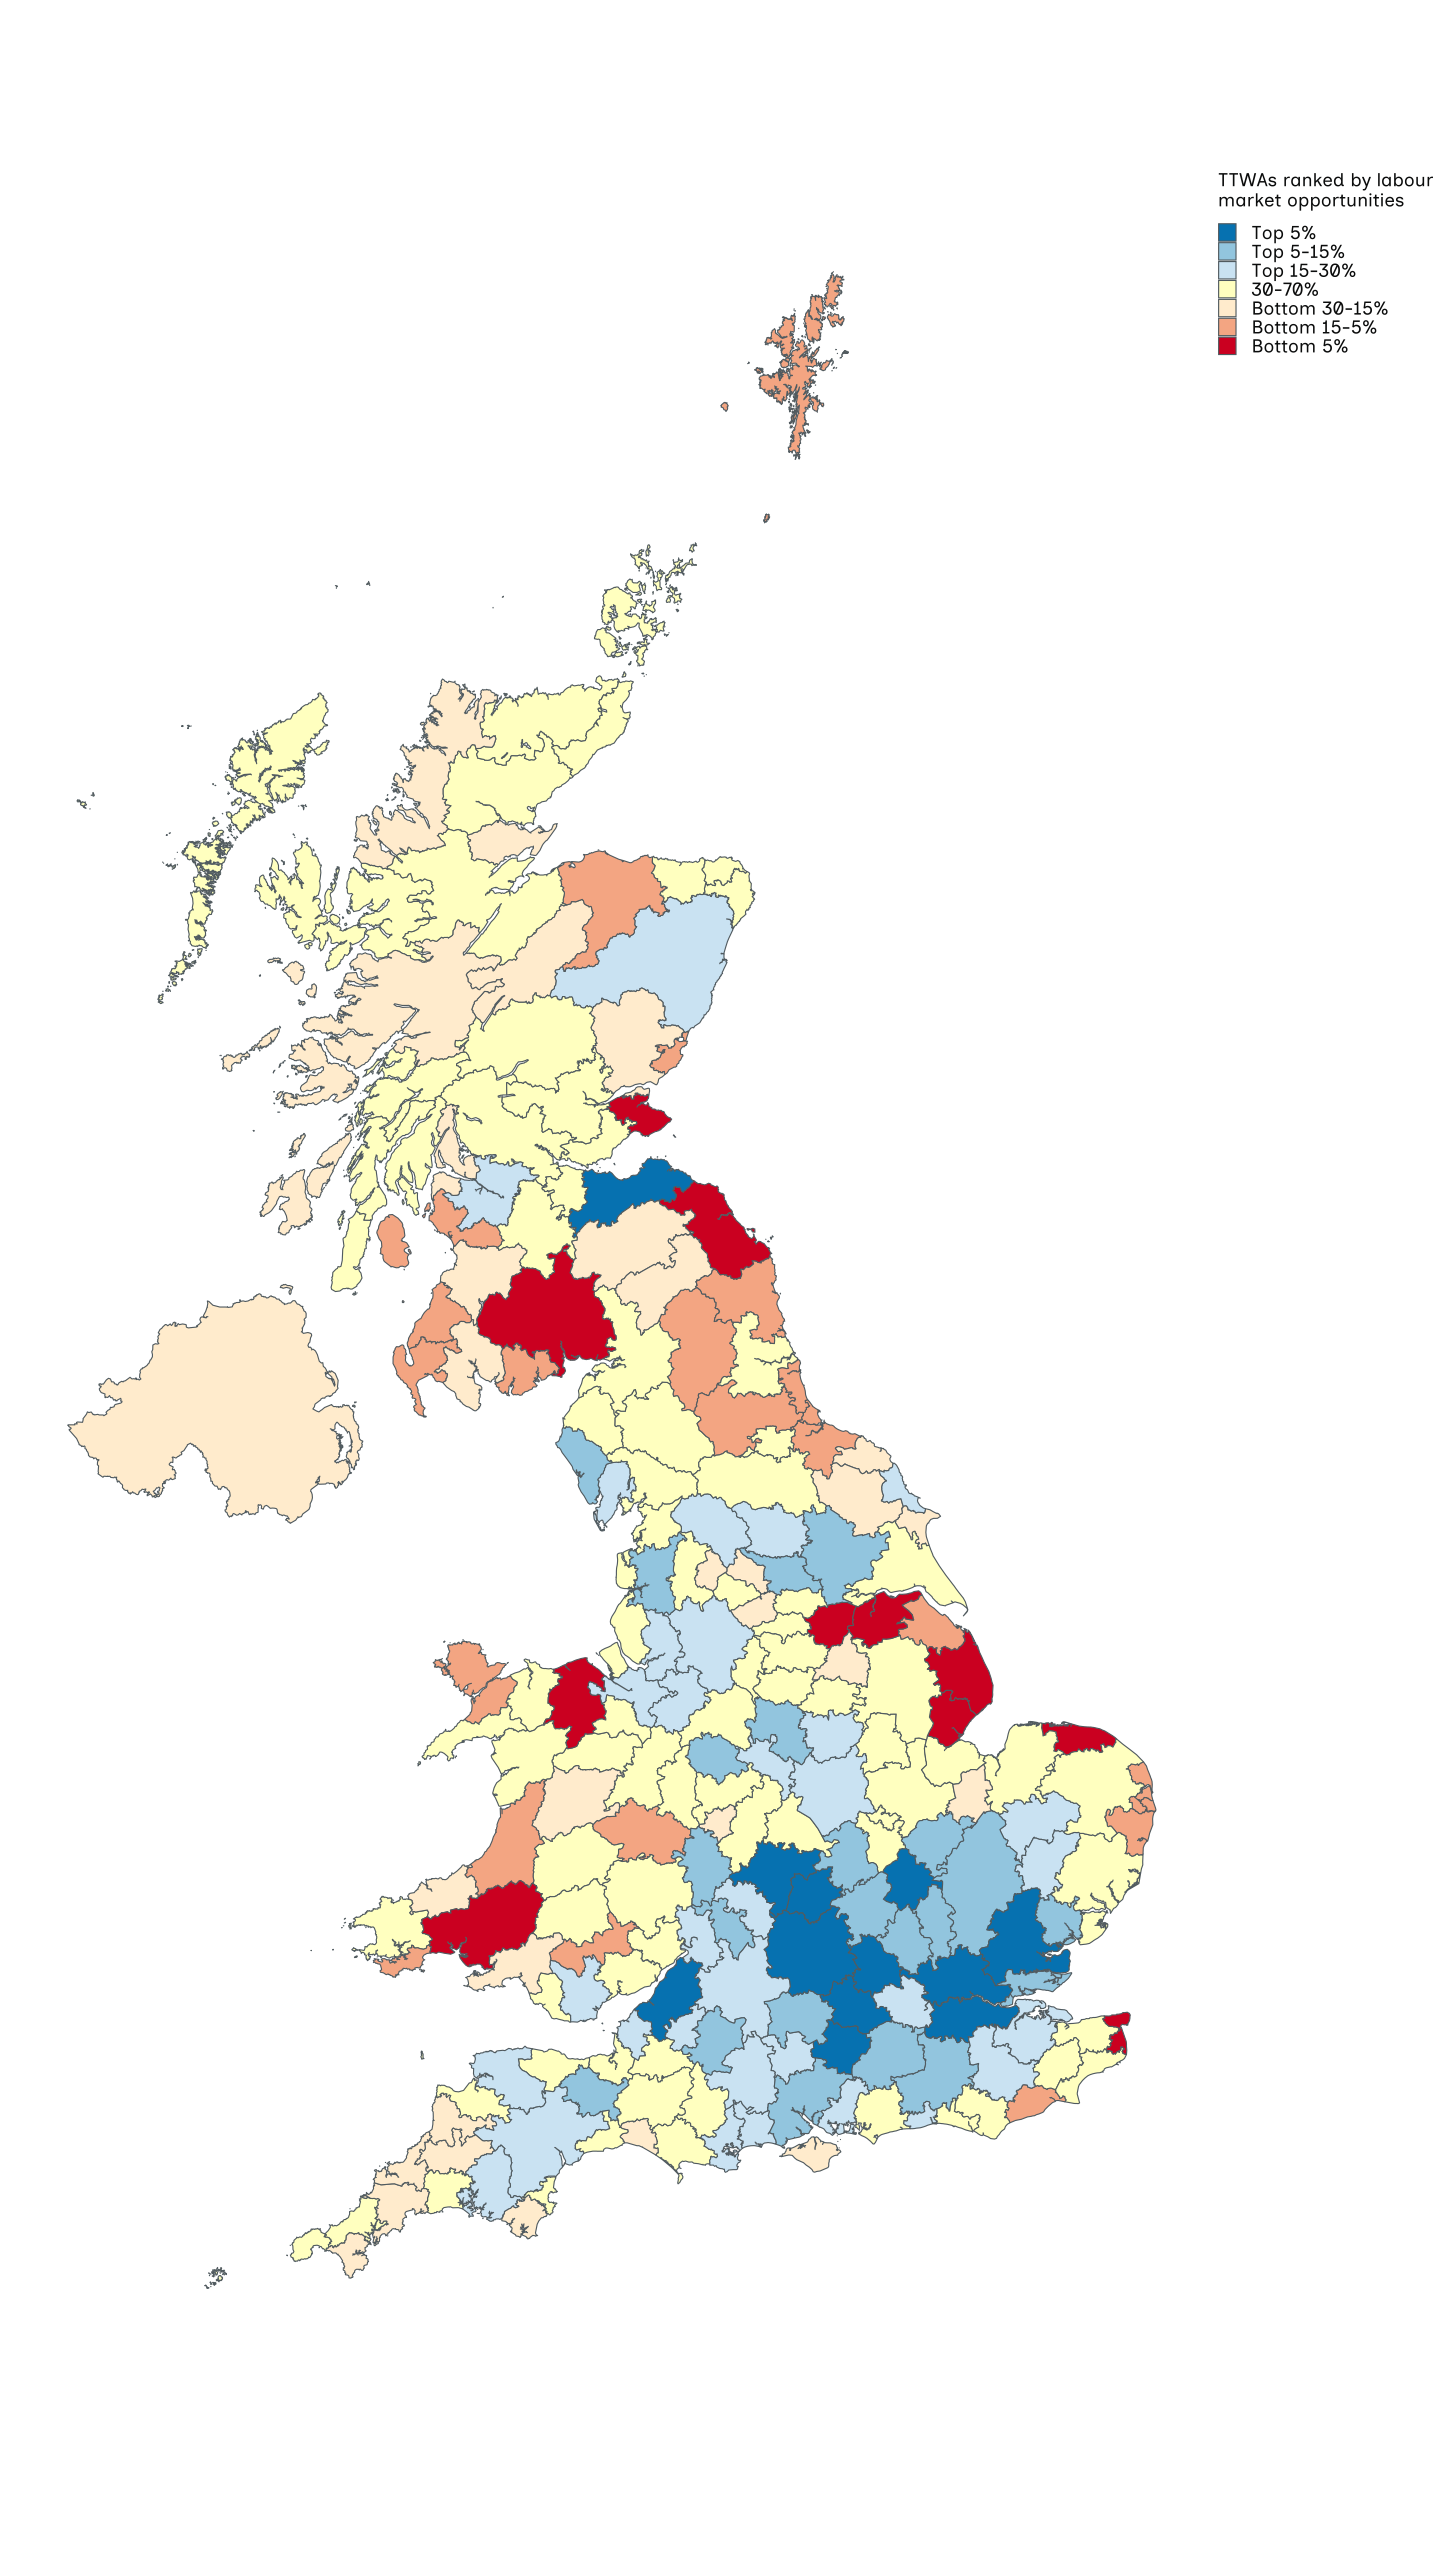
As we explain in the methodology section, this composite index takes into account the percentage of young people in employment, the percentage of young people in professional jobs and the percentage of young people in working-class jobs. The TTWAs with the most favourable job opportunities (deep blue on the map in figure 5.2) are mainly in the south of England. These favourable areas spread out from London to include places like Chelmsford to the east, Basingstoke to the south, Bedford to the north (up the M1), High Wycombe & Aylesbury, Reading and Oxford in the Thames Valley to the west, plus Banbury and Leamington Spa, which sit to the north-west of the M40 corridor. It is important to note that the London TTWA covers more than just the Greater London Authority (GLA), including significant parts of Essex, Surrey, Kent and Hertfordshire that border the GLA.
Figure 5.2: TTWAs with the most favourable labour market opportunities for young people include the Edinburgh city region and areas across south-central England. TTWAs with the least favourable opportunities are found around the coast.
TTWAs ranked according to their labour market opportunities for young people: the percentages of young people in employment, in professional jobs and in working-class jobs.
Source: ONS, Labour Force Survey (LFS) from 2014 to 2025 combined.
Note: Areas are based on TTWAs where people currently live. For more information on how each area was scored, please see the technical annex.
Outside London, Bristol and Edinburgh stand out, with Bristol’s job opportunities matching or even surpassing those in London, according to the composite index score. In our 2025 annual report, we noted that Bristol and Edinburgh score particularly highly on the ‘Innovation and Growth’ composite index.[footnote 10]
Areas with favourable opportunities (blue on the map) are also widespread in the south around London, stretching out further to include Cambridge, Southend and Colchester to the east, Southampton, Guildford & Aldershot and Crawley to the south, Newbury and Trowbridge to the west (along the M4), and Luton, Stevenage & Welwyn Garden City, Milton Keynes and Northampton (up the M1 corridor).
There are also important areas with favourable opportunities further away from London, in the Midlands and north of England: Derby, Preston, York and, perhaps most significantly given its size, Leeds. Unexpectedly, Manchester falls only within the light-blue category (top 15%). In Wales, the highest scoring TTWA is unsurprisingly Cardiff (the only light blue area in Wales). And in Scotland, apart from Edinburgh, we have Glasgow and Aberdeen in the upper-middling category. This gives a more encouraging picture of a range of labour market opportunities outside London, although the economic dominance of southern England is hard to ignore.
Most areas of unfavourable opportunity are around the coast. They can be found from St Andrews & Cupar in Scotland and Berwick (a cross-border TTWA straddling the Scottish Lowlands and English Northumberland), to Scunthorpe (and nearby Doncaster), Skegness & Louth, Boston in Lincolnshire, Cromer & Sheringham in north Norfolk and Margate & Ramsgate in Kent, then continuing to Llanelli in south Wales and Rhyl in north Wales, and back up to Dumfries in Scotland. Many places, such as Berwick, Dumfries, Boston and Cromer, have a largely rural character, while others, such as Rhyl, are focused on former seaside resort towns that have struggled in recent years as more people choose to holiday abroad.
Several other areas with unfavourable opportunities (orange) are also coastal and frequently rural. These include, for example, Elgin, Arbroath & Montrose and Stranraer in Scotland, Aberystwyth and Bangor & Holyhead in Wales, and Blyth & Ashington, Sunderland, Hartlepool, Middlesbrough & Stockton, Grimsby and Great Yarmouth down the east coast of England.
There are relatively few inland areas with unfavourable opportunities, but Hexham (straddling the Scottish border) and Ludlow (straddling the Welsh border) are both highly rural. Meanwhile, Durham & Bishop Auckland in the North East and Merthyr Tydfil in south Wales were formerly major mining areas (and also fairly rural). Several of these TTWAs with less favourable opportunities are small in population terms, sparsely populated and do not have easy access to major employment centres. These small TTWAs (in terms of population) tend to be local job markets within much larger LA areas.[footnote 11] Their disadvantage was, therefore, not obvious in earlier research based on LAs. There is also some evidence suggesting that young people are likely to move out of these small and remote TTWAs with unfavourable opportunities. Graduates in particular have been shown to be likely to leave poorer areas with lower average earnings and to move to areas with higher average earnings, especially to London as well as to major cities such as Brighton, Bristol and Leeds.[footnote 12]
Previous academic research
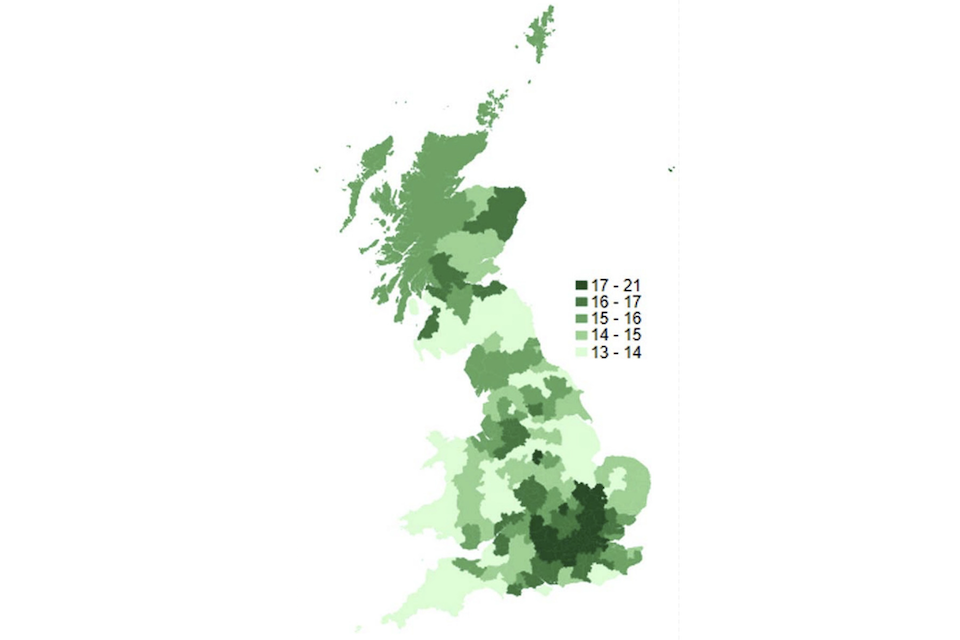
We now compare our results with those from the limited number of published articles on TTWAs. In figure 5.3, data collated by renowned research economists Henry Overman and Xiaowei Xu (2024) shows earnings per hour across TTWAs in 2019. Their picture largely mirrors ours, with London and the areas radiating out from London, Bristol and Edinburgh standing out. We should note that their map is based on the LAs that approximate best to TTWAs, so there are some geographical discrepancies. They are also unable to distinguish the smallest TTWAs such as Boston, Cromer & Sheringham or Margate & Ramsgate.
Figure 5.3: Earnings per hour across TTWAs in 2019 in the UK.
Source: Data from researchers Henry Overman and Xiaowei Xu (2024).[footnote 13]
Note: This chart shows data on average wage (£) per hour in 2019. Maps constructed using local authority approximations of 2011. Working-age (16–64) population. Wage data excludes self-employed people.
Henry Overman and Xiaowei Xu summarise their results as follows: “The north-south divide is visible, as is the relatively poor performance of many coastal and some rural areas. Differences in wages are more pronounced than differences in employment … but some areas such as the south of Scotland, north of England, Lincolnshire and Wales – fare poorly on both measures” (2024, pages 590 to 591). This is also a fair summary of our results.
Differences between travel-to-work areas and local authority findings
In many respects, the geographical patterns of LAs and TTWAs with favourable opportunities are similar (see figure 5.4). Just as with LAs, TTWAs with the most favourable opportunities are primarily located in the south of England, spreading out from London in all directions. Just as with LAs, TTWAs with the least favourable opportunities tend to be former industrial areas, sparsely populated rural areas and former coastal ports and seaside resort towns.
However, the map of TTWAs provides some new insights which were not apparent from the LA map. First, many of the TTWAs with unfavourable opportunities are small in population terms and sparsely populated, with no easy access to major centres of employment. These small TTWAs tend to be local labour markets within geographically large LAs. Their disadvantaged position was therefore invisible in our research on LAs.
Second, there are a number of cross-border TTWAs such as Berwick and Hexham (both of which are largely rural areas which straddle the border between Scotland and England). These cross-border TTWAs are also invisible when using administrative boundaries and again happen to provide less favourable opportunities for young people.
Third, the map of TTWAs brings out how the influence of major cities with favourable opportunities can spread and/or cut across several nearby LAs. For example, the London TTWA takes in parts of the surrounding Home Counties, the Bristol TTWA takes in parts of north-east Somerset and South Gloucestershire LAs, the Belfast TTWA takes in much of Lisburn & Castlereagh district, the Cardiff TTWA takes in parts of the Vale of Glamorgan, Newport, Neath Port Talbot (among others), and the Edinburgh TTWA takes in parts of West Lothian, Midlothian and East Lothian districts (among others). We can think of these areas as forming ‘city regions’. In several cases these city regions more or less correspond to the new combined authorities that the government is introducing.
Figure 5.4: Comparison of the index of Labour Market Opportunities for young people at TTWA and LA level.
Index of Labour Market Opportunities for young people at TTWA level (2014 to 2025):
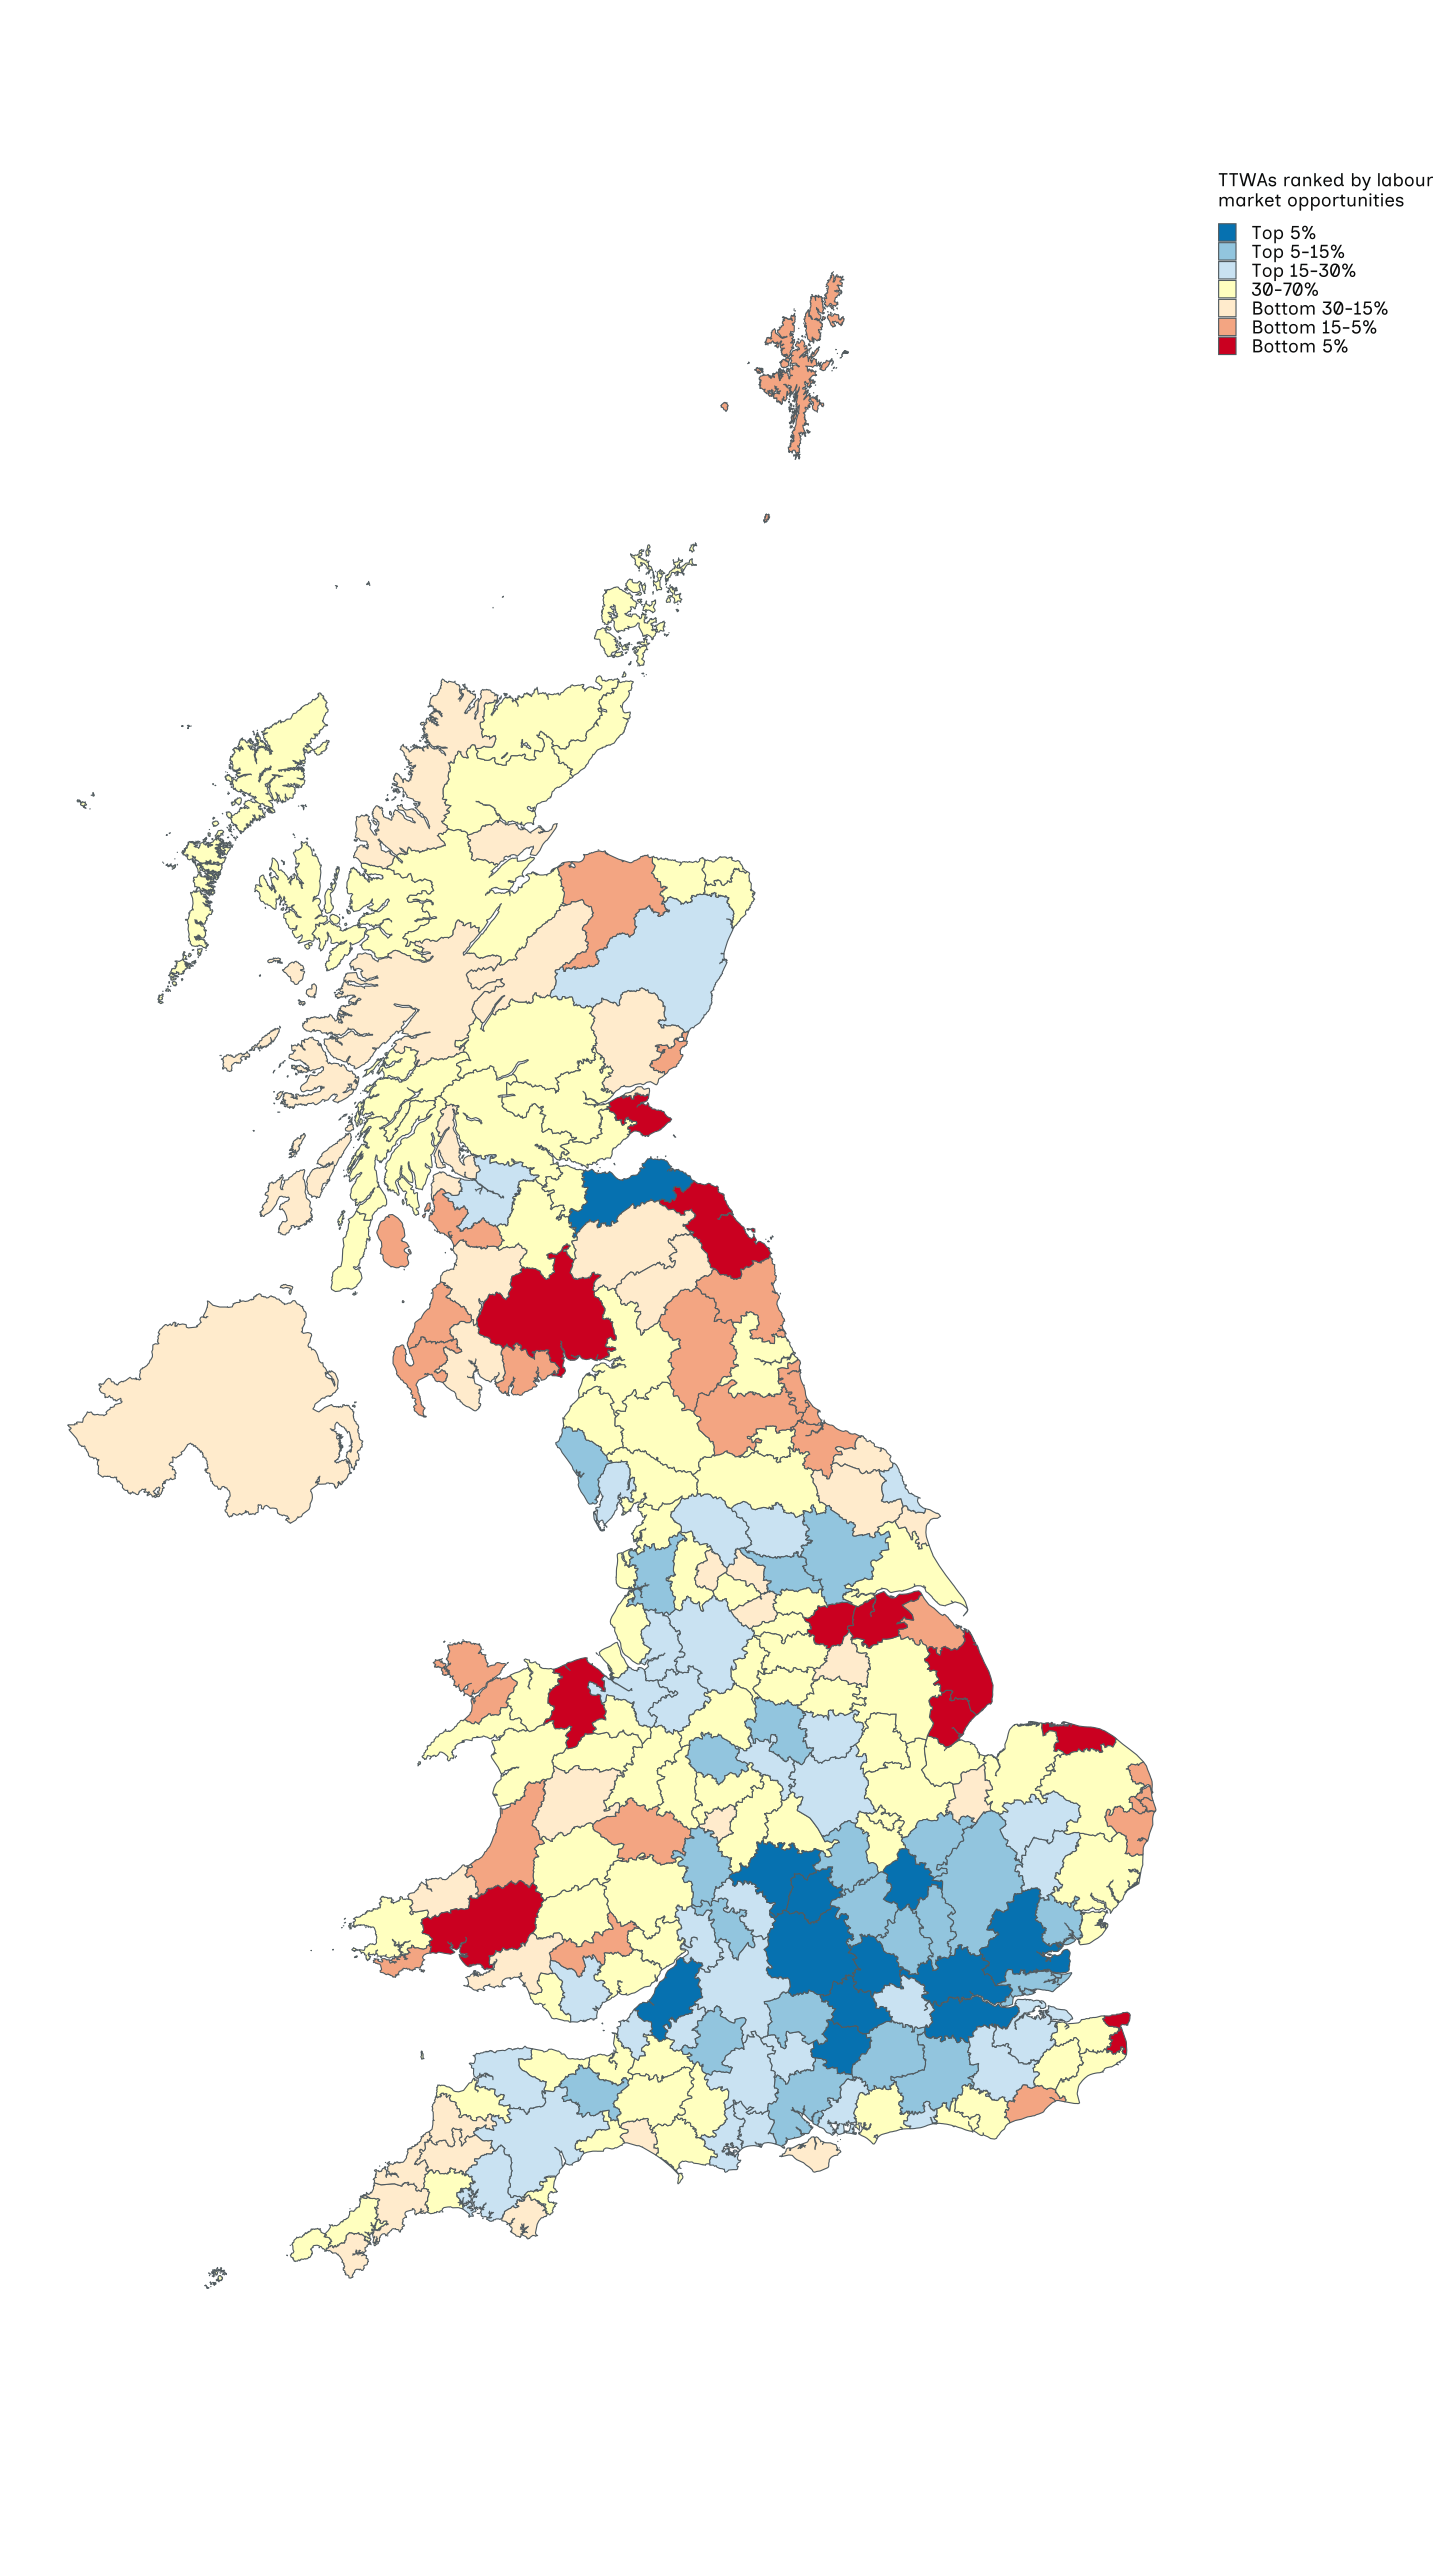
Index of Labour Market Opportunities for young people at LA level (State of the Nation 2024, 2014 to 2022 combined):

Source: ONS, LFS, 2014 to 2025.
Innovation and growth
In our State of the Nation reports 2024 and 2025, we developed a new composite index of Innovation and Growth across LAs in the UK. The index was designed to measure the environments that were potentially favourable to innovation and growth, and which may promote social mobility. The results in the 2025 report showed that, in addition to many London boroughs, centres with favourable environments included Aberdeen, Brighton & Hove, Bristol, Edinburgh, Oxfordshire and Reading.
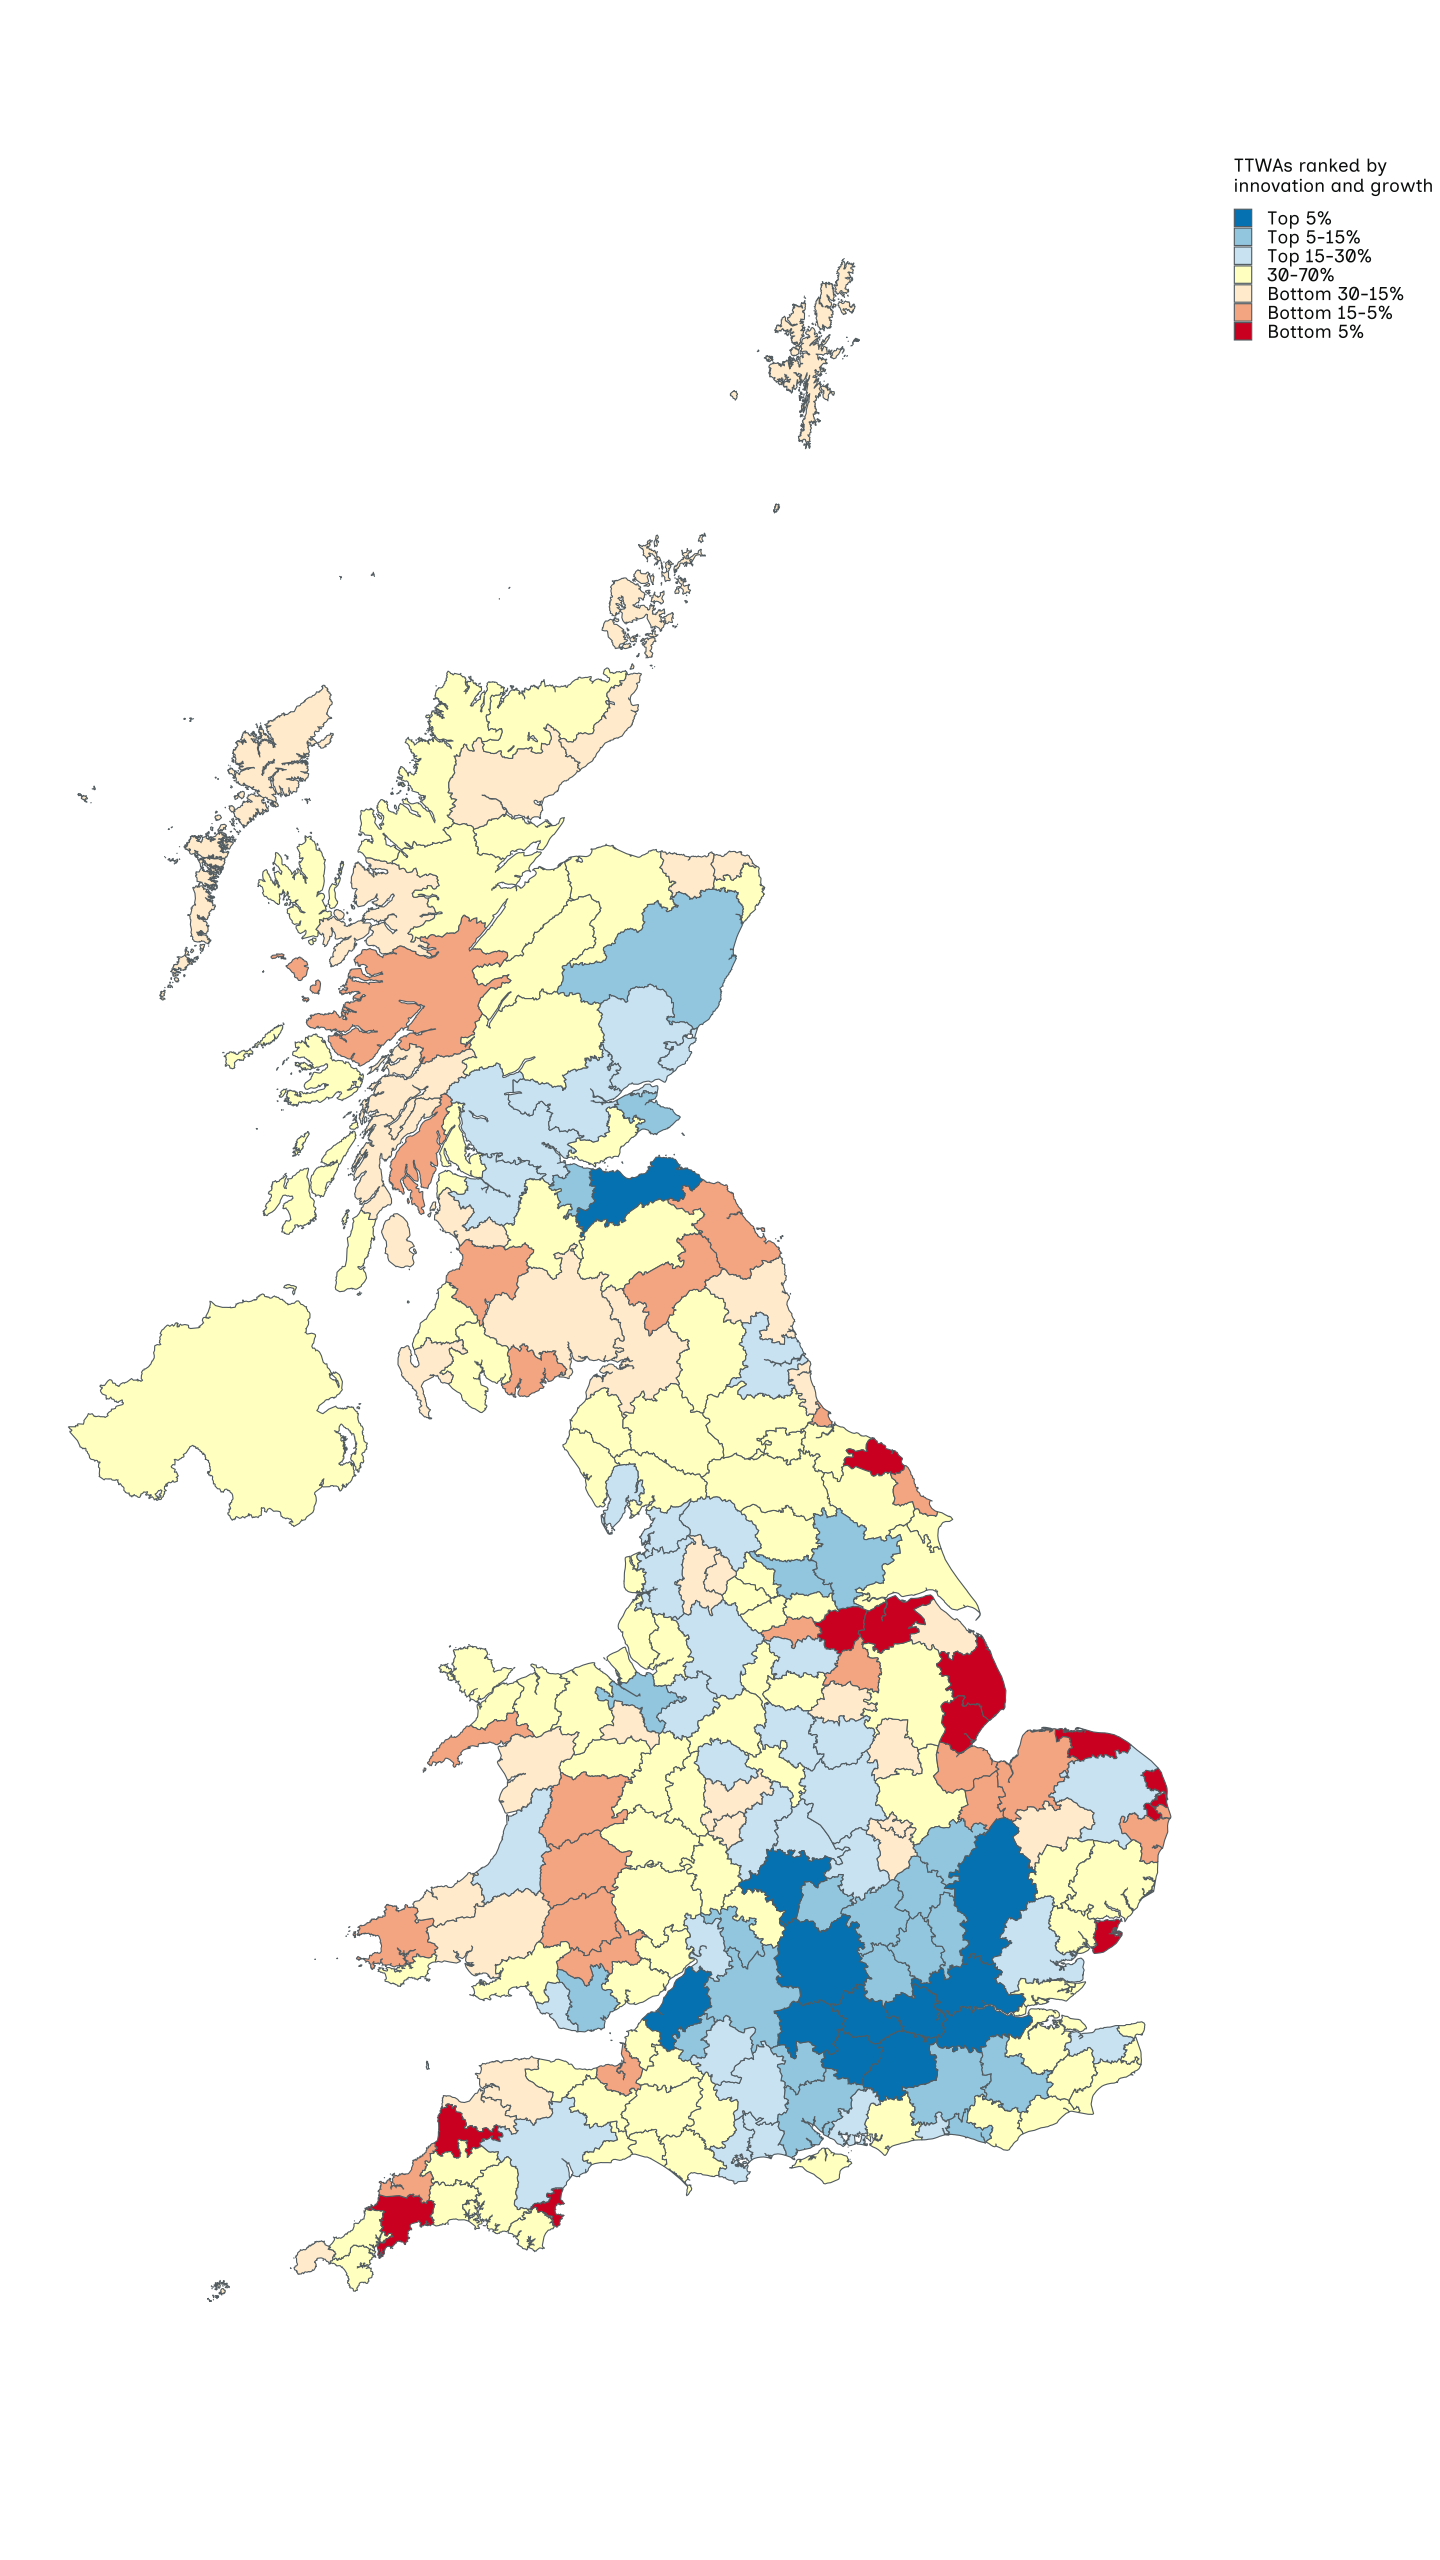
Figure 5.5 shows a map of TTWAs coded according to how favourable their environments are for innovation and growth (dark green indicating the 5% with the most favourable environments and dark red the 5% with the least favourable).
The TTWAs with the most favourable environments are largely city regions in the south-east of England and include Oxford, London, Slough & Heathrow, Reading, Cambridge, Basingstoke, Guildford & Aldershot and Newbury. Outside the south-east, other city regions such as Bristol, Edinburgh and Leamington Spa, score highly, while Aberdeen, Brighton, Leeds, Milton Keynes, Southampton and York also have rather favourable scores.
Figure 5.5: TTWAs with the least favourable environments for innovation and growth tend to be small in population terms and relatively remote.
TTWAs ranked according to their innovation and growth scores, constructed by combining measures of economically active postgraduates, people in new economy jobs, and productivity.
Source: ONS, LFS from 2014 to 2025 combined.
Note: Areas are based on current TTWAs. For more information on how each area was scored, please see the technical annex.
The least favourable areas include several geographically remote coastal areas, often with small populations, such as Boston, Bridgwater, Bude, Clacton, Great Yarmouth, Lowestoft, Scunthorpe, Skegness, St Austell & Newquay and Whitby. Among major cities, only Doncaster has a particularly unfavourable score. The largest cities, such as Derby, Glasgow, Birmingham, Leicester, Manchester, Newcastle, Nottingham and Sheffield, all lie in the top 30% of the distribution.
Differences between TTWA and LA findings
When it comes to innovation and growth, analysing the data by TTWA rather than LA confirms the same broad geographic patterns: the most favourable environments are overwhelmingly concentrated in the south of England, while the least favourable are typically remote coastal areas, sparsely populated rural locations and former industrial zones.
However, just as we saw with the youth job opportunities data, the TTWA map reveals specific localised areas of disadvantage that LA boundaries tend to hide. Because LAs can be geographically huge (for example, Scottish Borders or Northumberland), they often mask smaller, struggling local economies within them. For innovation and growth, this lack of opportunity becomes highly visible in small, remote coastal areas like Boston, Bude, Great Yarmouth, Skegness & Louth, St Austell & Newquay and Whitby.
This “hiding” effect also applies to administrative borders. For example, largely rural areas that straddle the border between England and Wales, such as Llandrindod Wells & Builth Wells and Newtown & Welshpool, show less favourable environments for innovation, a detail easily lost when analysis is based on strict local government boundaries.
Finally, the TTWA map clearly illustrates how the economic pull of major, innovative cities spreads outward, ignoring LA lines to create wider ‘city regions’. We see this not just with London pulling in the Home Counties, but with Bristol spreading into north-east Somerset and south Gloucestershire, Cardiff taking in parts of Newport and the Vale of Glamorgan, and Edinburgh extending into the Lothians.
Conclusions
The UK’s economic geography tells a consistent story, regardless of whether we are measuring labour market opportunities for young people or the overall environment for innovation and growth.
Both the LA and TTWA analyses confirm a persistent north-south divide. The areas with the most favourable scores for both labour market job opportunities and innovation are overwhelmingly concentrated in the south of England. However, prosperity is not exclusively southern; both indices highlight the strength of major city regions outside the South East, with places like Bristol, Edinburgh and Leeds consistently standing out as top performers.
In contrast, the overlap in disadvantaged areas is striking. Across both labour market opportunities and innovation, the least favourable environments are routinely found in geographically remote coastal areas, such as Skegness, Great Yarmouth and Boston. These struggles are also heavily concentrated in sparsely populated rural locations, former industrial or mining towns and former seaside resort towns.
The TTWA approach exposes pockets of deep disadvantage that previous research based on LAs has hidden. LAs often mask the struggles of the small remote coastal communities and rural economies locked inside them. Similarly, disadvantaged rural areas that straddle national borders – whether between England and Scotland, as at Berwick, or England and Wales, like Llandrindod Wells – are made invisible when relying on strict administrative boundaries.
Case studies
Matthew Cordwent, age 28, London

I come from a farming background, growing up in Devon in a lovely area between Dartmoor and Exmoor. However, this came with some challenges, like my closest bus stop was about a 40-minute walk and buses would only come every 2 hours, except for Sundays when there would be none at all.
Dairy farming was my childhood. It was enjoyable, but very hard work. As a child I would herd, milk and feed the cows, as well as cleaning out their sleeping place over the winter. My summers were often spent making hay and silage, fencing fields and looking after the livestock. The work never stops on a farm and even on Christmas Day we could be spending the morning herding sheep.
My first experience of law came about largely by chance. When I was 7 years old, I was helping my neighbour move house with my brother and my dad. We had a conversation about what I wanted to do when I was older and she offered me some work experience. Years later, while she was working as legal director at Southampton University, she got in contact again and remade the invitation. I took up the offer and thoroughly enjoyed it, I found the work played to my strengths and decided to study law at A level.
While studying, I was also working part-time and one of my colleagues mentioned a charity-funded law programme. I found out that there was one day left to apply and, thankfully, I was successful. The programme gave me fantastic opportunities to experience things I otherwise wouldn’t have, like networking with legal professionals, visits to the Inns of Court and even assistance with my UCAS [Universities and Colleges Admissions Service] personal statement. As a first-generation university student, this last opportunity was key to my legal journey as I couldn’t speak to my family for tips on how to approach my university application.
Through the pathway, I met a member of Causeway Education, a charity which promotes social mobility and supports young people with their applications to university. I am very proud to say that I have worked with Causeway ever since, for nearly 7 years, to help give others the same opportunities that I had.
I studied law at the University of Exeter and then completed the Legal Practice Course while working part time as a paralegal to cover the costs and gain experience, and I qualified in 2024.
I’m now an associate in the real estate disputes team. I particularly enjoy the variety of my work, dealing with a broad range of clients including large corporations, high-net-worth individuals and charities. My work involves dealing with disputes and providing advice on residential or commercial property issues, anything from boundary and rent disputes to professional negligence claims.
From my experience, I think that social mobility is rooted in the opportunities which are available to us. My first experience of law came about largely by chance and had it not been for that, my work and life would likely look rather different to what they are now.
My advice to anyone is to take every opportunity that you can. If nothing else it will give you the chance to try something new and find out what you like (and what you don’t!). I also encourage everyone to create every opportunity possible – for yourself but others too. Diversity is vital to all professions, not just law, and creating opportunities to support social mobility is needed to achieve this.
Sophie Timbrell, age 31, Bristol

I’m one of 4 children. My dad worked quite far away so I didn’t see him very often and my mum worked in various jobs in cafes and shops. We lived in a council house, didn’t have holidays and new school shoes weren’t a regular thing. My parents worked long hours to make sure all 4 kids didn’t feel we went without.
My parents were very intent on making sure we all stayed in education to get some security because they struggled with paying bills on a regular basis. We had bailiffs coming up to our house as money was tight.
School was difficult because I had undiagnosed dyslexia so I didn’t have any of the learning support. I ended up having to learn in lower-level English and maths meaning the highest I could get was a pass. I felt like if anyone had noticed I might have been able to achieve higher than a pass, but I was good at hiding it. I would never volunteer to read anything out loud or share any of my work with anyone so nobody would see how bad my spelling and grammar were.
I also personally struggled not having everything that a lot of other students had. It was noticeable to my peers that I didn’t have the right type of clothes, the right type of shoes, the right type of anything. I was singled out slightly but I managed to find a close group of friends that made me comfortable and I’ve kept them through my entire life.
I passed all my subjects at school and at 16. I went to Bath College to do media which was more practical than theoretical learning. I earned a merit pass which was better than anything I had achieved at that point.
After college, my parents were very strict that I couldn’t live at home without a job, so I worked at a pound shop on the local high street for 5 years. I was doing 12-hour shifts 6 days a week. I was physically and emotionally drained. I ended up developing carpal tunnel syndrome in both my hands as a result of lifting heavy boxes.
I decided to apply for an admin level 3 apprenticeship. I applied through the government website to at least 5 employers every single day. With an apprenticeship, I knew I could learn while still earning as I had my own life and bills to pay. The apprenticeship opportunities were scarce and I had to cast a wide net. I kept applying and finally found an apprenticeship helping house over-16s who had left care and had nowhere to go. While my apprenticeship was underway, the company downsized and could not keep anyone but one administrator. I was half-way through my apprenticeship with nowhere to finish it. The City of Bristol College had heard from my trainer that I was switched-on and eager to work. I had an interview with the manager of the apprenticeship department and they took me on immediately.
I am now a curriculum administrator at City of Bristol College. I work in a small team helping write letters, take minutes, organise events, diary management, produce meaningful documents and am the first point of contact for many departments as well as coordinating across the college. I genuinely enjoy my job. I get a lot of personal gratification from it and I have so much more flexibility with my work pattern which has drastically improved my quality of life.
-
TTWAs are different from parliamentary constituencies, and often do not align closely with administrative boundaries. ↩
-
Social Mobility Commission, ‘Chapter 3: mobility across the UK’, 2024. Published on GOV.UK. ↩
-
The term ‘labour market conditions’ refers to the job opportunities in an area — how easily people can find work and how easily employers can find the skilled staff they need. ↩
-
Office for National Statistics, ‘Travel to work area analysis in Great Britain: 2016’, Published on ONS.GOV.UK. ↩
-
The principal component analysis (PCA) technique distils several correlated variables into a single measurement. Details of the PCA are shown in the technical annex. ↩
-
A multi-level model takes account of the results for all LAs when looking at the result for an individual LA. So, if an LA ends up with an extreme value, and especially if the sample size for that LA is small, the model adjusts the estimated value to be closer to the average for all LAs. ↩
-
See Chapter 1 for definitions of job types. ↩
-
Social Mobility Commission, ‘Chapter 3: how have social mobility conditions changed across the UK?’, 2025. Published on GOV.UK. ↩
-
This includes all who are employed, both full time and part time. ↩
-
Social Mobility Commission, ‘Chapter 3: how have social mobility conditions changed across the UK?’, 2025. Published on GOV.UK. ↩
-
These small TTWAs have populations between 60,000 and 130,000 people. ↩
-
Jack Britton and others, ‘London calling? Higher education, geographical mobility and early-career earnings’. Figures 13 and 14, 2021. Published on IFS.ORG.UK. ↩
-
Henry Overman and Xiaowei Xu, ‘Spatial disparities across labour markets’, 2024. Published on ACADEMIC.OUP.COM. ↩