State-funded schools inspections and outcomes as at 31 March 2018: main findings
Updated 21 September 2020

© Crown copyright 2020
This publication is licensed under the terms of the Open Government Licence v3.0 except where otherwise stated. To view this licence, visit nationalarchives.gov.uk/doc/open-government-licence/version/3 or write to the Information Policy Team, The National Archives, Kew, London TW9 4DU, or email: psi@nationalarchives.gov.uk.
Where we have identified any third party copyright information you will need to obtain permission from the copyright holders concerned.
This publication is available at https://www.gov.uk/government/statistics/state-funded-schools-inspections-and-outcomes-as-at-31-march-2018/state-funded-schools-inspections-and-outcomes-as-at-31-march-2018-main-findings
This release contains:
- schools’ most recent inspections and outcomes as at 31 March 2018, now based on a new statistical methodology
- revised most recent inspection outcomes of schools at 31 August, for each year from 2010 onwards, based on the new statistical methodology
- provisional data for inspections completed between 1 January and 31 March 2018
- revised data for inspections completed between 1 September 2017 and 31 December 2017
There has been a substantial growth in the proportion of good and outstanding schools over the past 8 years
Revised data shows that the proportion of outstanding schools has increased from 18% at 31 August 2010 to 21% at 31 March 2018. The proportion of good schools also increased, from 50% to 65%.
The conversion rate for short inspections has fallen to 1% since January 2018, due to a change in policy
In January, Ofsted introduced changes to reduce the number of short inspections that convert to a full inspection. [footnote 1] As a result, the proportion of short inspections that converted in this academic year fell from 22% before the change to 1% after the change.
Figure 1: Most recent overall effectiveness grades of schools over time [footnote 2]
Revised data show that the proportion of outstanding schools has increased from 18% at 31 August 2010 to 21% per cent at 31 March 2018. The proportion of good schools also increased; from 50% to 65%.
1. Introduction
The purpose of these official statistics is to disseminate the data on school standards collected through Ofsted’s role as an inspectorate. They provide information about how the judgements of schools have changed over time and vary across different phases of education and different parts of the country.
This official statistics release reports on the outcomes of state-funded school inspections carried out under sections 5 or 8 of the Education Act 2005. These inspections were conducted between 1 September 2017 and 31 March 2018. This release also includes the most recent inspections and outcomes for all schools that have been inspected, as at 31 March 2018.
Following a consultation on changes to Ofsted’s statistical reporting of inspection outcomes for maintained schools and academies, this release contains some changes to the way in which we report on schools’ most recent inspection grades. The changes include:
- adding the grades of predecessor schools in the dataset for schools that have not yet been inspected in their current form[footnote 3], which gives a more comprehensive view of the sector
- the introduction of new fields to the school-level datasets which indicate whether the grades relate to an inspection of the school in its current form or a predecessor school
- an additional category of schools that are ‘not inspected in their current form’ has been added to chart 6 of the Excel file accompanying this release
- university technical colleges and studio schools are now reported on as separate groups and no longer included in the ‘sponsor-led academy’ category, although they are still included in the ‘all academies’ and ‘all types of school’ categories
Alongside this release, we published a one-off analysis of the impact of the methodology changes. This includes detailed comparisons of the data before and after the methodology change, by phase, type of school, region, local authority area, and over time.
In addition, this year there have also been some changes to which schools receive a short inspection and to the criteria for deciding whether short inspections convert to a full inspection. These policy changes affect the data and the trends seen in this release.
Throughout this release, the term ‘schools’ is used to cover all local authority maintained schools, state-funded academies and non-maintained special schools in England that Ofsted is required to inspect under section 5 of the Education Act 2005.
2. Schools at their most recent inspection
The changes to the statistical methodology following the consultation have led to a small reduction in the proportion of schools judged good or outstanding. Based on the previous methodology, 88% of schools would have been good or outstanding at 31 March 2018, compared to 86% based on the new methodology. Please see the accompanying release Changes to Ofsted’s statistical reporting of inspection outcomes for state-funded schools: An analysis of the changes for a full analysis of the changes.
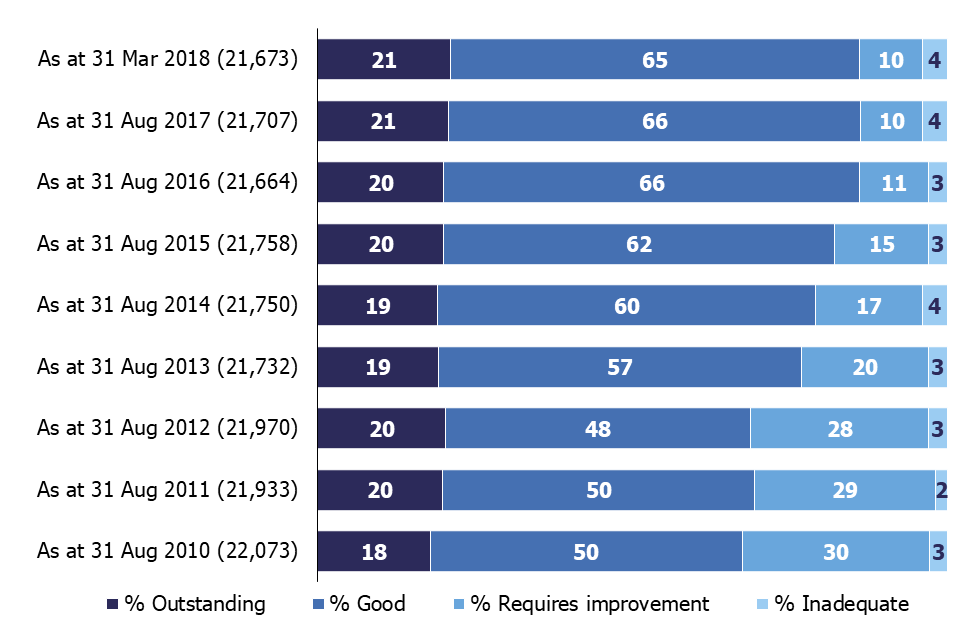
Figure 2 shows revised data as at 31 August for each year, based on the new methodology. This still shows a substantial growth in the proportion of good and outstanding schools over the past 8 years. Since 31 August 2010 the proportion of outstanding schools has increased from 18% to 21%, and the proportion of good schools from 50% to 65%.
Figure 2: Most recent overall effectiveness of schools over time[footnote 2]
Revised data show that the proportion of outstanding schools has increased from 18% at 31 August 2010 to 21% per cent at 31 March 2018. The proportion of good schools also increased; from 50% to 65%.
In addition to the methodology change, recent inspection outcomes have also led to very minor changes in the pattern of inspection outcomes. Under the revised methodology 87% of schools were judged good or outstanding at the end of August 2017, compared to 86% at the end of March 2018. This is a reduction of 0.6 percentage points.
3. Inspections between 1 September 2017 and 31 March 2018
There were 4,104 full and short inspections of schools between 1 September 2017 and 31 March 2018.
Of these, 1,611 were full inspections. These consisted of:
- 1,222 inspections that were planned to be full inspections (conducted under section 5 of the Education Act 2005)
- 88 inspections conducted under section 8 of the act (for instance monitoring visits), that became full section 5 inspections part way through the inspection, in order to gather further evidence and make an overall effectiveness judgement
- 301 short inspections that converted from a section 8 to a full section 5 inspection where evidence suggested a full inspection might not confirm the grade of the previous inspection, or where there were serious concerns about safeguarding, behaviour or the quality of education
In total there were 2,794 short inspections conducted between 1 September 2017 and 31 March 2018. Of these, 2,493 (89%) did not convert and therefore confirmed the grade given at the school’s previous full section 5 inspection.
Eighty-two per cent of the 4,104 schools receiving a full or short inspection were judged good or outstanding over the period. The majority of schools were judged to be good, across each phase of education, except for nursery schools where nearly two-thirds were judged outstanding. Pupil referral units and secondary schools continue to have the highest proportion of schools judged inadequate, both at 6%.
Of the 4,104 inspections in this academic year, 4,081 were of schools that had been inspected before. Most of the previous inspections were of the school in its current form (same URN), and some were of a predecessor school of the current school. Overall slightly more schools declined this year than improved: 14% compared with 12%. A large majority (75%) of schools retained their previous grade.
4. Short inspections
In September 2015, Ofsted introduced short inspections for schools that were judged good at their most recent full inspection, and for pupil referral units, special schools and maintained nursery schools that were previously judged outstanding. Short inspections last for one day and take place approximately every 4 years. A short inspection determines whether the school continues to provide a good or outstanding standard of education for the pupils and that safeguarding is effective.
Between 1 September 2017 and 31 March 2018, 2,794 schools were subject to a short inspection. Ninety-four per cent were of schools previously judged to be good. Figure 3 shows that of these, 92% remained good, 5% declined to requires improvement or inadequate and 3% improved to outstanding.
Figure 3: Outcomes of short inspections of previously good schools, September 2017 to March 2018[footnote 4]
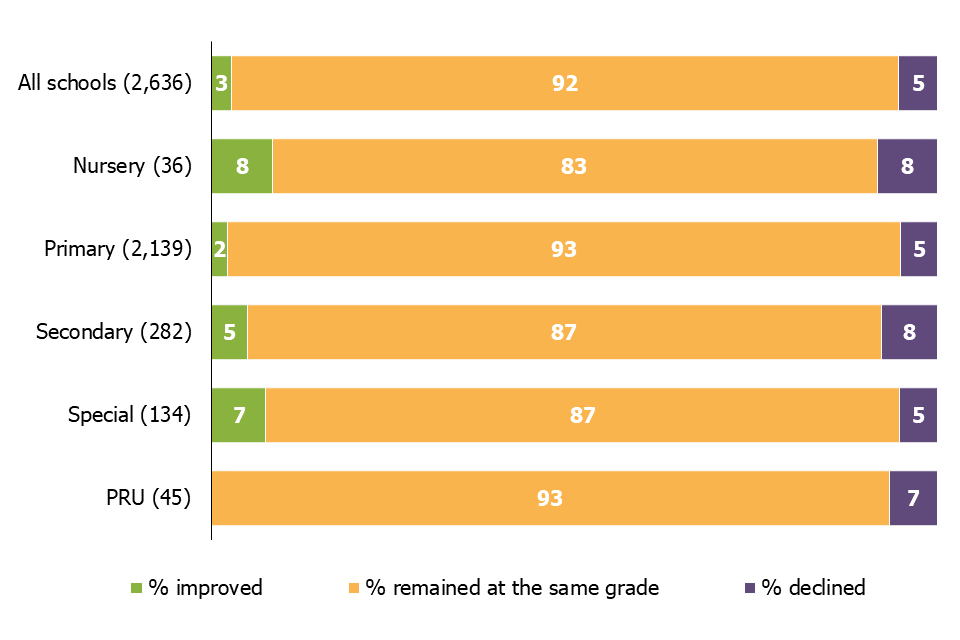
For schools judged good at their previous inspection, 3% improved to outstanding, 92% remained good and 5% declined to requires improvement or inadequate.
Before November 2017, good primary and secondary schools would normally have a short inspection unless there were safeguarding concerns. From November onwards, around 20% of these schools could have a full inspection where a risk assessment suggested they would be unlikely to retain their grade. Consequently there are proportionately fewer short inspections and more full inspections since November: 96% of inspections of good schools in September and October 2017 were short inspections, compared to 76% between November 2017 and April 2018.
From January 2018, there have also been changes to reduce the proportion of short inspections that convert. For schools that were previously good, inspections will only convert if the lead inspector has gathered evidence that suggests the school might be judged inadequate in one or more of the judgements at a full inspection, or there are serious concerns about safeguarding, behaviour or the quality of education. A further full inspection is scheduled, typically within 2 years, where inspectors have reason to believe that the school may not have retained its judgement of good or improved to outstanding had it received a full section 5 inspection on the day. Before January 2018 these short inspections would also have converted. This change in policy has led to a substantial decrease in the proportion of short inspections that convert to a full inspection.
For schools previously judged good, the proportion of short inspections converting has fallen to just 1% at inspections since January, down from 21% in November and December 2017 and 22% in September and October 2017. Figure 4 shows how conversion rates have changed over time.
Figure 4: Conversion rates for short inspections of previously good schools
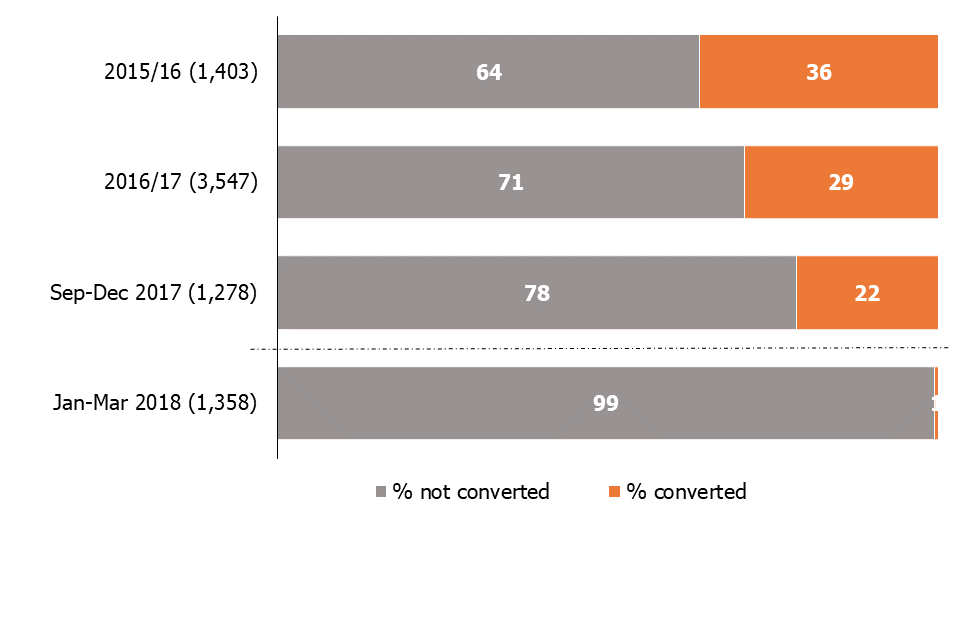
Figures show that the proportion of short inspections that converted fell to one per cent between January and March 2018. Down from 22% between September and December 2017.
5. Revisions to previous release
The provisional data in the previous release related to inspections that took place between 1 September 2017 and 31 December 2017, with the reports published by 31 January 2018. Revised data for inspections in this period is provided in tables 1R and 2R of the of the accompanying Excel file.
This revised data includes an additional 25 full inspections that had not been published by 31 January but were published by 30 April 2018. Eighteen resulted in an inadequate judgement, 5 requires improvement and 2 were good.
The inclusion of these inspections results in the following changes to the proportion of all schools at each grade between September and December 2017:
- the percentage of outstanding has been revised down one percentage point to 9%
- the percentage of requires improvement has been revised down one percentage point to 37%
- the percentage of inadequate has been revised up 2 percentage points to 9%
Fifteen of the additional inspections were of primary schools. As a result:
- the percentage judged good has been revised down one percentage point to 46%
- the percentage inadequate has been revised up 2 percentage points to 8%
Eight were of secondary schools. As a result:
- the percentage of outstanding, good and requires improvement have all been revised down one percentage point to 8%, 44% and 38% respectively
- the percentage of inadequate has been revised up 2 percentage points to 10%
Two were of special schools. As a result:
- the percentage of outstanding and requires improvement have both been revised down one percentage point to 36% and 13% respectively
- the percentage of good has been revised down 2 percentage points to 40%
- the percentage of inadequate has been revised up 4 percentage points to 11%
There were also 5 additional section 8 inspections:
- 4 short inspections that did not convert: 3 of primary schools and one of a special school
- one ‘schools into special measures visit’ of a special school
Revisions to data in this publication are published in line with Ofsted’s revisions policy for official statistics.
6. Notes
Data in this release is from inspections undertaken between 1 September 2017 and 31 March 2018 and most recent inspections of schools that were open at 31 March 2018, where the inspection report was published by 30 April 2018. If an inspection report is not published by 30 April 2018 then the previous inspection, where the school has one, will be reported as a school’s most recent inspection.
Inspections are conducted under sections 5 and 8 of the Education Act 2005. The current inspection framework for all settings on the Early Years Register, state-funded schools, non-association independent schools and further education and skills providers was most recently revised on 1 September 2015.
An explanation of the main uses of this data and further contextual information and the arrangements for quality assurance is provided in the methodology and quality report accompanying this release. This report provides information about strengths and limitations of the statistics.
7. Glossary
7.1 Academies
Academies are publicly funded independent schools. Academies do not have to follow the national curriculum and can set their own term times. They still have to follow the same rules on admissions, special educational needs and exclusions as other state schools.
Academies get money directly from the government, not the local authority. They are run by an academy trust, which employs the staff. Some academies have sponsors such as businesses, universities, other schools, faith groups or voluntary groups. Sponsors are responsible for improving the performance of their schools.
Academies include converter and sponsor-led academies, free schools, university technical colleges and studio schools.
7.2 Academy converters
Academy converters are schools which have opted to become an academy, most of which were good or outstanding local authority maintained schools before they became an academy.
7.3 Sponsor-led academies
Sponsor-led academies are academies which have sponsors such as businesses, universities, other schools, faith groups or voluntary groups. Sponsors are responsible for improving the performance of their schools.
7.4 Free schools
As a type of academy, free schools are funded by the government and not run by the local authority. They are set up on a not-for-profit basis by academy trusts, charities, universities, and community and faith groups, among others.
7.5 University technical colleges
University technical colleges are a type of academy set up through the free schools programme for 14 to 19 year olds. They deliver technical education as well as core curriculum subjects, and are sponsored by a university and employer partners.
7.6 Studio schools
Studio schools are small academies (usually with around 300 pupils) for 14 to 19 year olds, teaching mainstream qualifications through project-based learning. This means working in realistic situations as well as learning academic subjects.
7.7 Local authority maintained schools
Maintained schools are state-funded and usually run by the local authority. They must follow the national curriculum.
7.8 Short inspections
Most good schools now receive short inspections, as do outstanding nursery, pupil referral units and special schools. Short inspections are a one-day inspection visit and take place approximately every 4 years. A short inspection determines whether the school continues to provide the same good or outstanding standard of education for pupils. A short inspection does not result in individual graded judgements and does not change the overall effectiveness grade of the school.
From November 2017 around 20% of previously good schools are now subject to a full section 5 inspection instead of a short inspection, where our risk assessment tells us that a short inspection would be highly likely to convert. For example where a school underwent significant change, such as changing its age range, or where other performance measures indicate that the quality of provision may have deteriorated significantly.
There have also been changes to what determines whether a short inspection converts to a full inspection.
Up until the end of December 2017, short inspections could convert to a full inspection if there was evidence that a full inspection might not confirm the grade of the school’s previous inspection. A full set of graded judgements, as required under section 5 of the Education Act, will be made at the converted inspection.
From January 2018, inspectors will continue to convert short inspections, usually within 48 hours, if they have serious concerns about safeguarding or behaviour, or if they think the quality of education provided by a school has declined to inadequate.
If there are no significant issues with safeguarding or behaviour, but inspectors identify potential concerns about either the quality of education or leadership and management, the inspection will not convert. Instead, Ofsted will publish a letter setting out the school’s strengths and areas for improvement. A section 5 inspection will then take place later, typically within two years. This will give the school time to address any weaknesses and seek support from appropriate bodies. In the meantime, the letter will be clear that the school’s current overall effectiveness judgement has not changed.
When inspectors have reason to believe that a school may be improving towards an outstanding judgement, Ofsted will publish a letter confirming that the school is still good and setting out its strengths and priorities for further improvement. A section 5 inspection will then take place within two years, giving the school time to consolidate its strong practice. However, requests from schools for early inspections will be considered. The majority of short inspections will confirm that the school remains good and, as now, Ofsted will return to carry out another short inspection after approximately 3 years.
A summary of the changes to short inspection practice can be found in the Ofsted confirms new arrangements for short inspections press release. More detail can be found in the response to the consultation.
8. Further information
If you have any comments or feedback on this publication, please contact Louise Butler on 03000 131 457 or inspection.insight@ofsted.gov.uk
8.1 Acknowledgements
Thanks to the following for their contribution to this statistical release: Michael Taylor, James Jordan, Chris Foley and George Deacon.
-
Changes were introduced in January to reduce the number of short inspections that convert to a full inspection. They now only convert where there are serious concerns about the quality of education, behaviour or safeguarding. Schools that would previously have been subject to an immediate conversion will be subject to a full section 5 inspection within 2 years. See glossary for more detail on short inspections ↩
-
Data for all years includes outcomes for predecessor schools where the school is yet to be inspected in its current form, in line with the new reporting methodology introduced for this release. As a result, figures for previous years presented here differ slightly from data published in previous official statistics releases. ↩ ↩2
-
The data includes the most recent inspection grades for an inspection of an earlier version of the same school (inspected under a different URN) for schools yet to be inspected under their current URN. ↩
-
Schools that had a short inspection that didn’t convert are counted as retaining their grade, as these inspections confirm the grade of the last full section 5 inspection ↩