Sponsored Museums Performance Indicators 2015/16
Updated 22 February 2017

© Crown copyright 2017
This publication is licensed under the terms of the Open Government Licence v3.0 except where otherwise stated. To view this licence, visit nationalarchives.gov.uk/doc/open-government-licence/version/3 or write to the Information Policy Team, The National Archives, Kew, London TW9 4DU, or email: psi@nationalarchives.gov.uk.
Where we have identified any third party copyright information you will need to obtain permission from the copyright holders concerned.
This publication is available at https://www.gov.uk/government/statistics/sponsored-museums-annual-performance-indicators-2015-16/sponsored-museums-performance-indicators-201516
1. Introduction and Key Findings
1.1 Introduction
During 2015/16, the Department for Culture, Media and Sport (DCMS) sponsored 15 museums (13 nationals, and 2 non-nationals) which provided free entry to their permanent collections. These museums were:
- British Museum
- Geffrye Museum
- Horniman Museum
- Imperial War Museums
- National Gallery
- National Museums Liverpool
- National Portrait Gallery
- Natural History Museum
- Royal Armouries
- Royal Museums Greenwich
- Science Museum Group
- Sir John Soane’s Museum
- Tate Gallery Group
- Victoria and Albert Museum
- Wallace Collection
The data are collected by the museums through sample surveys, with the exception of the information on educational visits and total visits, which are based on actual counts. Additional information explaining how the data should be collected is available here.
1.2 Key Findings[footnote 1]
- In 2015/16 there were 47.7 million visits to DCMS-sponsored museums. This was a decline of 6.0 per cent on 2014/15, and a decline of 2.6 per cent when Tyne and Wear Museums are excluded from 2014/15.
- In 2015/16, there were 7.9 million child visits[footnote 2] to DCMS-sponsored museums. This was a 14.4 per cent decrease on 2014/15, and a decline of 1.8 per cent when Tyne and Wear Museums and the Horniman Museum are excluded from 2014/15.
- In 2015/16, the total self-generated income for DCMS-sponsored museums was £330.8 million, a decline of 20.2 per cent on 2014/15, and a decline of 19.9 per cent when Tyne and Wear Museums are excluded from 2014/15. This decline is linked to the high value of donated objects in 2014/15.
2. Visits to DCMS sponsored museums
2.1 Total visits to sponsored museums
Total visits to all sponsored museums decreased by 6.0 per cent, from 50.7 million in 2014/15 to 47.7 million in 2015/16. When excluding the Tyne and Wear Museums from 2014/15, this decline was 2.6 per cent.[footnote 1]
The most visited museum was the British Museum, with 6.9 million visits, followed by the Tate Gallery Group (comprising of four branches) with 6.7 million visits (Figure 1).
Figure 1: Total visits by DCMS-sponsored museum, 2014/15 to 2015/16
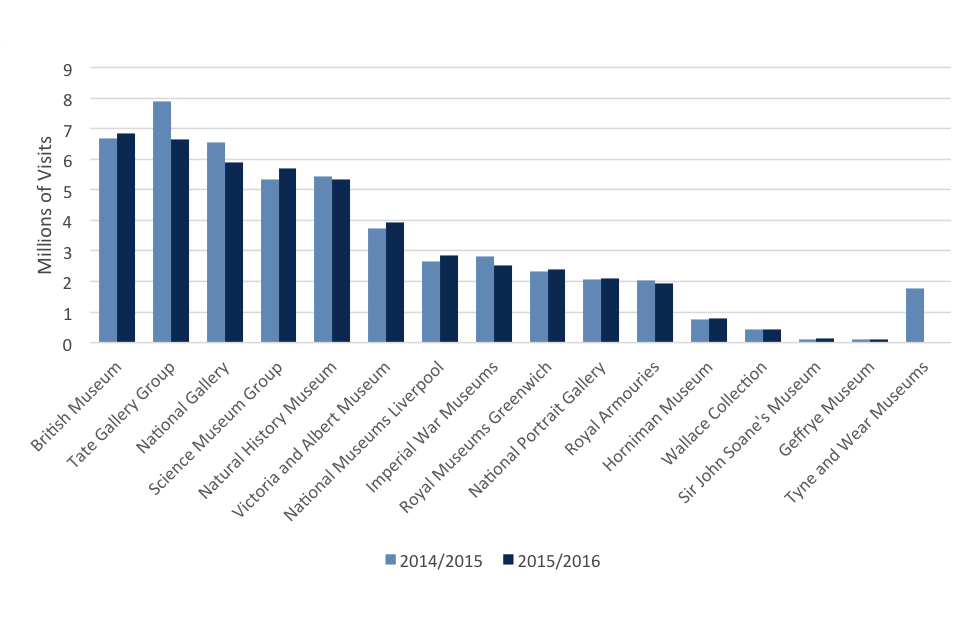
Figure 1
2.2 Website visits
In 2015/16 there were a total of 101.3 million unique visits to the websites of the DCMS sponsored museums. Due to changes in the software used to measure website visits by many of the museums at several points over time, these figures are not directly comparable between years.
2.3 Child visits[footnote 3]
There were 7.9 million visits by children aged 15 and under in 2015/16. This was a decrease of 14.4 per cent since 2014/15 (9.3 million). When excluding the Tyne and Wear Museums and the Horniman Museum from 2014/15, there was a 1.8 per cent decrease.
The Science Museum Group (comprising of five branches) had the greatest number of child visits at 1.9 million, followed by the Natural History Museum (comprising of two branches) with 1.3 million child visits (Figure 2).
Figure 2: The number of visits to DCMS-sponsored museums by children aged
15 and under by museum visited, 2014/15 to 2015/16
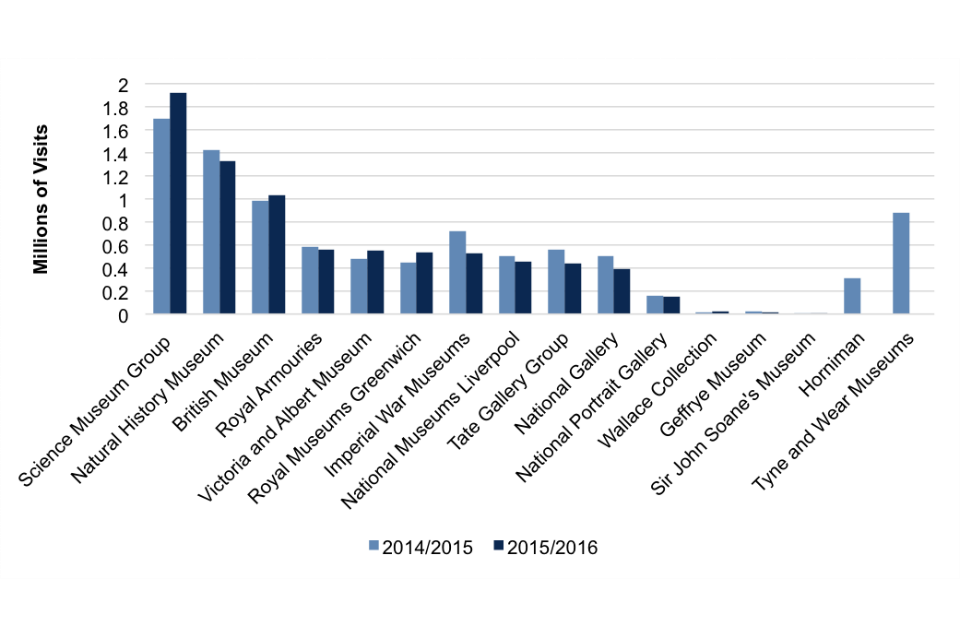
Figure 2
2.4 Educational visits and onsite activities
In 2015/16, across all sponsored museums, there were an estimated 2.5 million instances where visitors under the age of 18 participated in on site events, an 11.5 per cent decrease on 2014/15. When excluding Tyne and Wear museum from 2014/15, there was a 6.9 per cent decline.
The Science Museum Group (comprising of five branches) had the largest amount (830,000 visits), followed by the Tate Gallery Group (comprising of four branches) with 254,000 visits. In 2015/16 there were an estimated 2.0 million facilitated and self-directed visits by people under 18 in formal education, a 6.7 per cent decrease on 2014/15. When excluding Tyne and Wear museum from 2014/15, there was a 3.1 per cent decrease on 2014/15.
The Science Museum Group (comprising of five branches) had the most educational visits with 486,000 in 2015/16, followed by the British Museum with 259,000 facilitated and self directed visits over the same period.
2.5 Overseas visits[footnote 3]
There were an estimated 22.4 million visits to sponsored museums in 2015/16 by overseas visitors, accounting for 47.0 per cent of all visits (Figure 3). This was consistent with 2014/15. When excluding Tyne and Wear Museums and the Horniman Museum from 2014/15, overseas visitors accounted for 49.2 per cent of all visits.
Figure 3: Percentage of overseas and UK visits to DCMS-sponsored museums
in 2015/16
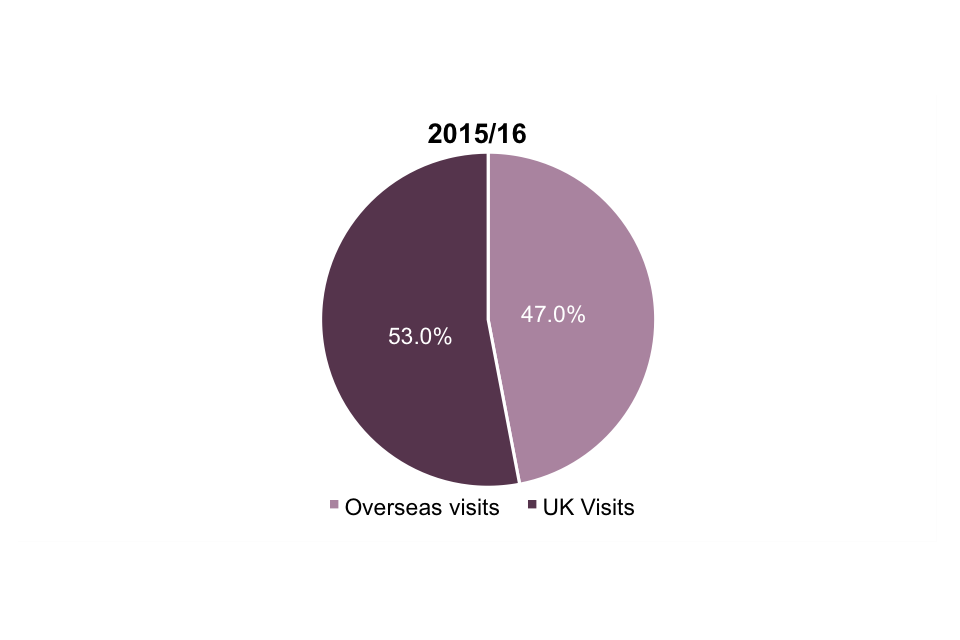
Figure 3
The Royal Armouries museum had the largest proportion of overseas visitors in 2015/16, with 67.5 per cent of visitors from overseas (Figure 4). This was a similar proportion to 2014/15, when the Royal Armouries also had the highest proportion of overseas visits.
Figure 4: Proportion of overseas and UK visits to DCMS-sponsored museums
in 2015/16
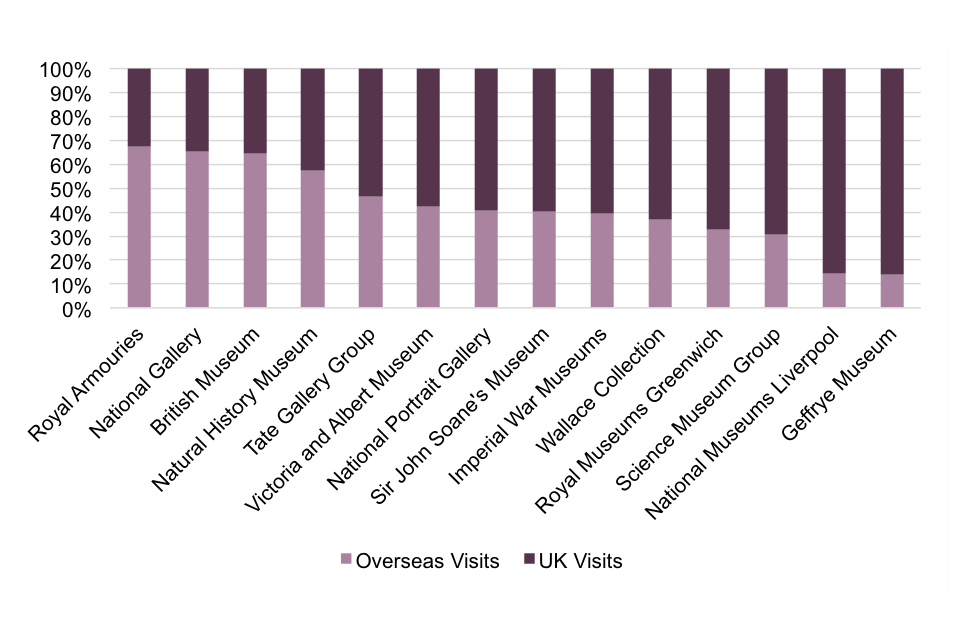
Figure 4
3. DCMS-sponsored museums self-generated Income 2015/16
3.1 DCMS-sponsored museums self-generated Income[footnote 6]
This chapter provides information on self-generated income of DCMS-sponsored museums. The total self-generated income for DCMS-sponsored museums is made up of fundraising, admissions and trading income. Fundraising includes donated objects, which are volatile year-on-year. In 2015/16, fundraising represented 61 per cent of the total self-generated income, whilst trading incomes and admissions represented 26 and 13 per cent respectively.
In 2015/16, the total self-generated income for DCMS-sponsored museums was £330.8 million, a decline of 20.2 per cent on 2014/15[footnote 7], and a decline of 19.9 per cent when Tyne and Wear Museums are excluded from 2014/15. This decline is linked to a large increase in the value of donated objects in 2014/15. The Tate Gallery Group (comprising of four branches) had the highest self-generated income in 2015/16 at £110.8 million (Figure 5).
Figure 5: Admissions, trading income and fundraising for the sponsored museums,
2015/16
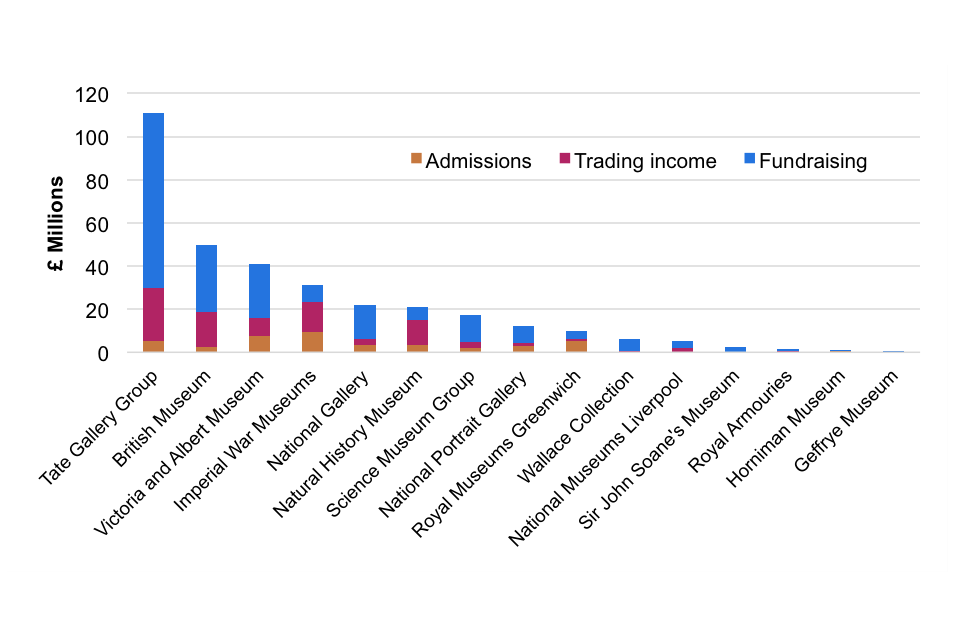
Figure 5
Admissions (Gross Income)
Admissions are the charges made to view some permanent collections or temporary exhibitions.
In 2015/16 DCMS-sponsored museums and galleries generated £42.3 million through admissions. This was a decrease of 0.6 per cent on the 2014/15 figure of £42.6 million (Figure 6), and 0.2 per cent when excluding Tyne and Wear Museums from 2014/15 figures.
The Imperial War Museums generated the most revenue (£9.5 million), a 7.8 per cent increase on 2014/15 (£8.8 million).
Figure 6: Admissions income for the sponsored museums 2014/15 to 2015/16[footnote 8]
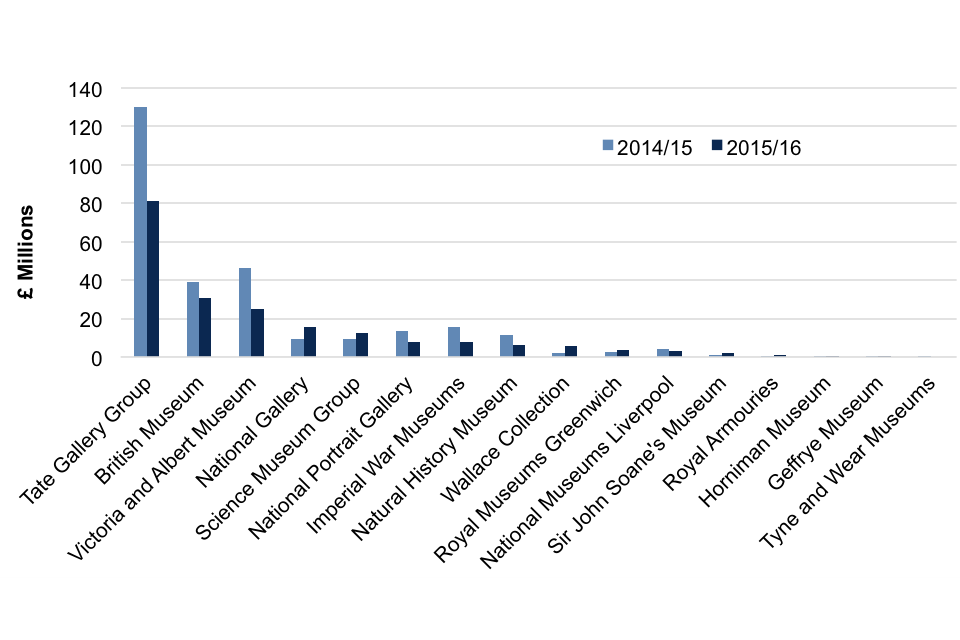
Figure 8
The trading income is the total income raised through activities which involve selling a product or service to a customer (e.g. retail sales, publications, reproductions, royalties, corporate hire, catering, location hire (TV and films), licensing, image licensing, consultancy, services, learning and access income).
In 2015/16 a total of £85.3 million was generated across the DCMS-sponsored museums, a decrease of 2.0 per cent on the 2014/15 figure of £87.1 million (Figure 7), and a decrease of 0.6 per cent when excluding Tyne and Wear Museums from the 2014/15 figures.
The Tate Gallery Group (comprising of four branches) generated the most trading income in 2015/16 (£24.4 million), although this was a 20.1 per cent decrease on 2014/15 (£30.6 million).
Figure 7: Trading income for the sponsored museums 2014/15 to 2015/16[footnote 9]
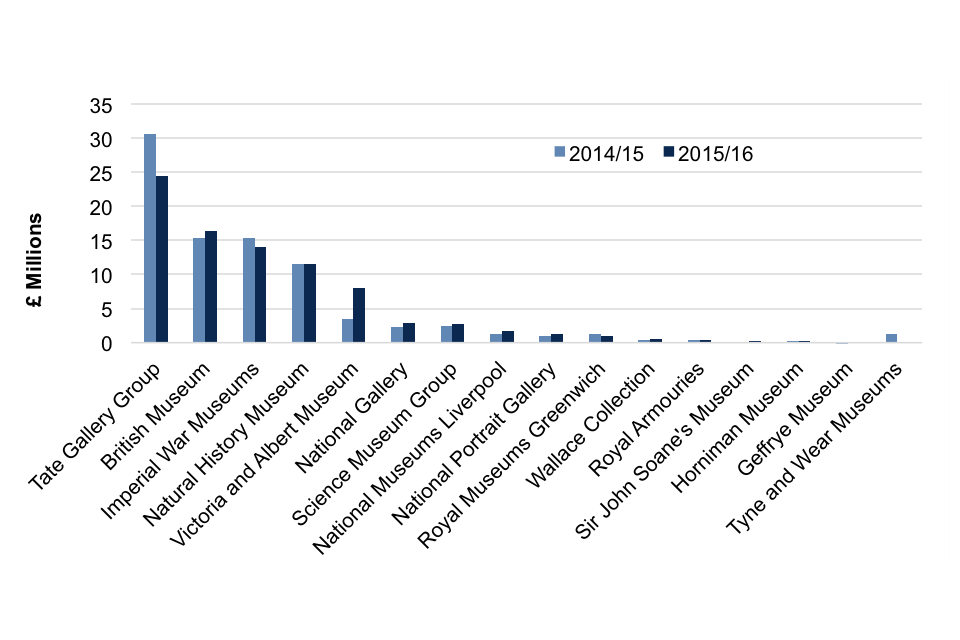
Figure 7
3.2 Fundraising (Charitable Giving)
Charitable giving is defined as any money or gift received from an individual, charity or private company, which is from one of the following: bequests, legacies, donations and capital grants from individuals, charities, foundations, trusts and private companies, as well as income raised through sponsorship and income from membership schemes. It does not include any money received from a publicly funded organisation, central government grants, investment income or lottery grant funding.
In 2015/16 a total of £203.1 million was received by the sponsored museums and galleries. This was a decrease of 28.7 per cent on the 2014/15 figure of £284.8 million (Figure 8), the same percentage decline as when excluding Tyne and Wear Museums from 2014/15. This decline was partly due to the high value of donated objects in 2014/15 compared to 2015/16.
For example, in 2014/15 the Tate received a number of high value donated art works worth over £70 million in total compared to less than £5 million in 2015/16. The Tate Gallery Group (comprising of four branches) generated the most revenue from fundraising in 2015/16 (£81.2 million), a 37.7 per cent decrease on 2014/15 (£130.4 million).
Figure 8: Fundraising for the sponsored museums 2014/15 to 2015/16
Figure 8
4. DCMS-sponsored museums Visitor Satisfaction
4.1 Proportion of visitors who would recommend a visit
The proportion of visitors who would recommend a visit is defined as those who answered ‘How likely are you to recommend a visit to your friends or family’ with ‘definitely will’ or ‘probably will’.
In 2015/16, across DCMS-sponsored museums and galleries, the average percentage of adults who would recommend a visit was 95.7 per cent. This is a similar proportion to 2014/15, when the figure was 96.3 per cent (Figure 9). This average was the same when the Tyne and Wear museums were removed from 2014/15.
Figure 9: Proportion of visitors who would recommend a visit, 2014/15 to
2015/16
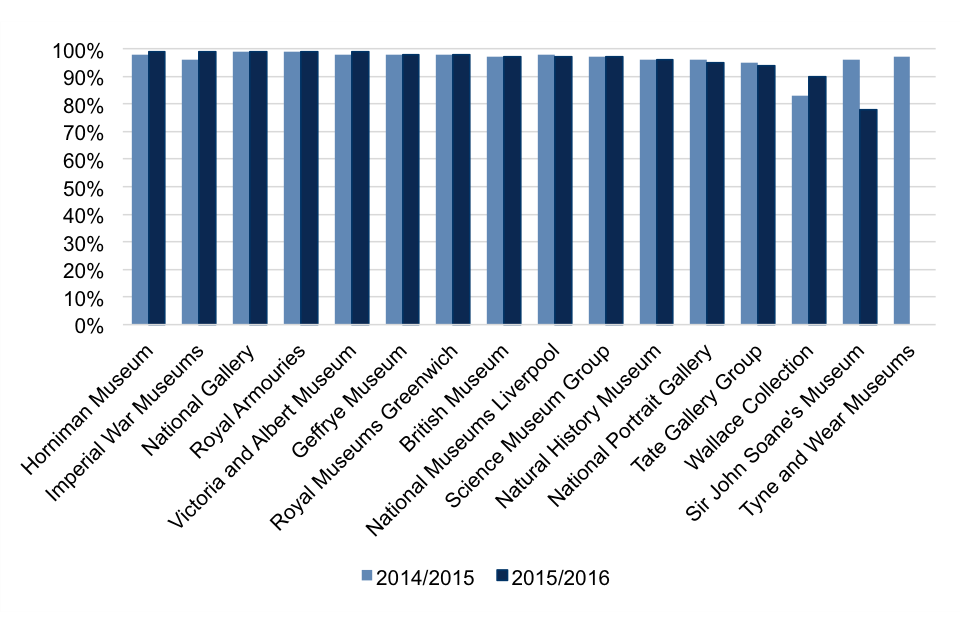
Figure 9
5. DCMS-sponsored museums Regional Engagement
5.1 Number of UK loan venues
A loan venue is defined as any approved borrowing institution, organisation, exhibition facility, or individual researcher who have been loaned an item from one of the DCMS sponsored museums and galleries. In 2015/16, there were 1,379 UK loan venues. This is 10.7 per cent lower than in 2014/15, when there were 1,545 loan venues. When excluding the Tyne and Wear museums from this figure, there was a 7.1 per cent decrease. The Victoria and Albert Museum (comprising of four branches) had the highest number of loan venues, lending pieces to 273 venues in the United Kingdom (Figure 10).
Figure 10: The number of UK loan venues, 2014/15 to 2015/16
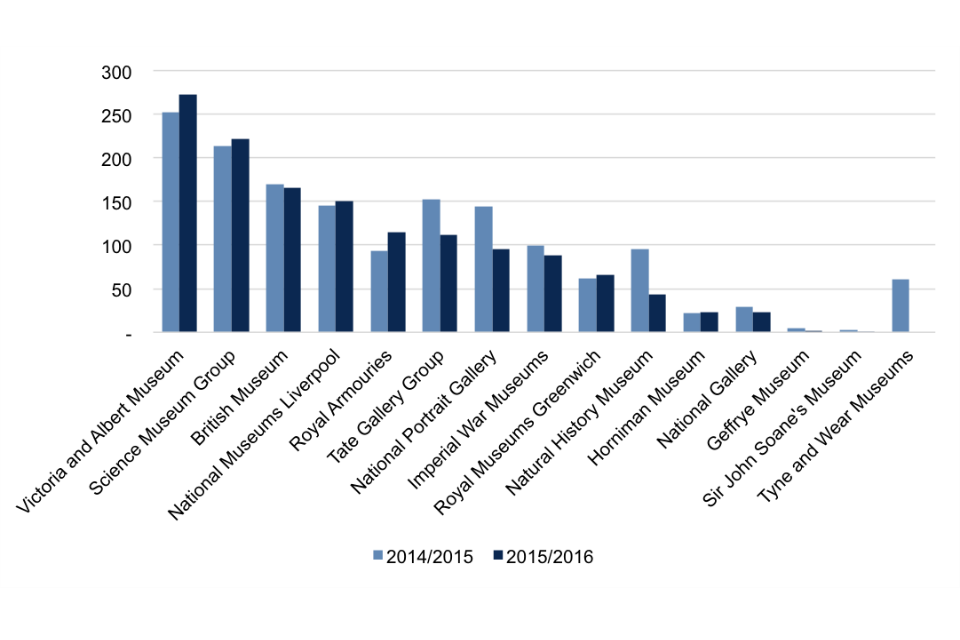
Figure 10
6. Annex A: Background note
- Sponsored Museums: Performance Indicators is an Official Statistic and has been produced to the standards set out in the Code of Practice for Official Statistics. Additional information is available here.
- Sponsored Museums Performance Indicator publications previously included data
on:
• Adult visits by NS-SEC group, ethnicity and whether visitors considered
themselves to have a long term illness, disability or infirmity.
• The number of instances of children participating in outreach activities outside the gallery
• The number of instances of adults aged 16 and over participating in organised activities at the museum/gallery.
• The number of instances of adults aged 16 and over participating in outreach activities outside the museum/gallery.
- Following consultation with the sponsored Museums and Galleries, the data outlined above were no longer collected from 2012/13 onwards to reduce the burden of data collection on the Museums and Galleries. If you have a continued user need for these data, or additional comments on this statistical release, please contact evidence@culture.gov.uk.
- This report has been produced by Becky Woods, Penny Allen and Chris Marnoch. The responsible statistician for this release is Penny Allen. For enquiries on this release, please contact evidence@culture.gov.uk.
- The next release is scheduled for Autumn 2017.
- For general enquiries telephone: 0207 211 6134 Department for Culture Media and Sport 100 Parliament Street London SW1A 2BQ enquiries@culture.gov.uk
-
In 2014/15, DCMS also sponsored the Tyne and Wear Museums, however they were no longer sponsored in 2015/16. As a result of this, comparisons have been made both including and excluding the Tyne and Wear Museums. ↩ ↩2
-
Figures for the Horniman museum are unavailable for 2015/16, due to concerns of the robustness of data. ↩
-
Figures for the Horniman museum are unavailable for 2015/16, due to concerns of the robustness of data. ↩ ↩2
-
Further information on DCMS-sponsored museums self-generated income (including Grant in aid) can be found in the Charitable Giving Indicators 2015/16 publication, available here. ↩
-
Due to the introduction of FRS102, new accounting standards which became effective from 1st of January 2015, some cultural institutions have restated their 2014/15 accounts. ↩
-
Geffrye Museum and the Wallace Collection do not usually charge for temporary exhibitions. ↩
-
Imperial War Museums figures have been revised to reflect total Trading Income. ↩