SPI-M-O: Summary of further modelling of easing restrictions – Roadmap Step 4, 9 June 2021
Updated 13 May 2022

© Crown copyright 2022
This publication is licensed under the terms of the Open Government Licence v3.0 except where otherwise stated. To view this licence, visit nationalarchives.gov.uk/doc/open-government-licence/version/3 or write to the Information Policy Team, The National Archives, Kew, London TW9 4DU, or email: psi@nationalarchives.gov.uk.
Where we have identified any third party copyright information you will need to obtain permission from the copyright holders concerned.
This publication is available at https://www.gov.uk/government/publications/spi-m-o-summary-of-further-modelling-of-easing-restrictions-roadmap-step-4-9-june-2021/spi-m-o-summary-of-further-modelling-of-easing-restrictions-roadmap-step-4
Summary
1. All modelling of taking Step 4 of the Roadmap on 21 June 2021 shows a large resurgence in infections and admissions. The scale of this resurgence is highly uncertain, and it could be either considerably smaller or larger than previous waves.
2. The key uncertainties are the growth advantage of B.1.617.2[footnote 1] (henceforth referred to as delta) compared to B.1.1.7 [footnote 1] (henceforth referred to as alpha), effectiveness of vaccines against severe disease caused by the delta variant, and the extent to which behaviours and therefore transmission will change after Step 4.
3. In all scenarios modelled, even a short delay to the timing to Step 4 results in a significant drop in the number of people being admitted to hospital as more people are vaccinated and as the school summer holidays get closer. Even a 2-week delay would have a significant effect, but a 4-week delay is modelled as reducing the peak in hospital admissions by around a third to a half. A delay would also allow evidence to build up on the effectiveness of vaccines against delta, potentially increasing precision in future modelling scenarios.
4. Since the start of April 2021, the ratio of confirmed cases to admissions has been stable. If this continues, each doubling of cases will lead to a doubling of admissions. The number of hospital admissions that are S-gene positive (and are therefore almost certainly the delta variant) has been growing in recent weeks, however, this has been masked by a drop in those which are S-gene negative.
5. R is estimated to be 40% to 80% higher for delta than for alpha, although a figure higher or lower than this cannot be ruled out.
6. SPI-M-O’s best estimate for R in England is between 1.2 and 1.4 and reflects the epidemiological situation approximately 2 weeks ago. This is substantially higher than the estimate of 1.0 to 1.1[footnote 2], which reflected the state of the epidemic shortly before Step 3 of the Roadmap was taken.
Key changes since the paper of 5 May 2021:
Models now include the delta variant, which has been seeded and become dominant in England over the past month. It is estimated that R is 40-80% higher for delta than for alpha.
Evidence from Public Health England and Public Health Scotland on vaccine effectiveness against the delta variant has been incorporated. This means assumptions on vaccine-induced protection are considerably less optimistic. Preliminary estimates of a higher rate of hospitalisation of cases for the delta variant compared with the alpha variant have not been included in these analyses, but are considered as part of sensitivity analysis in the accompanying LSHTM paper.
Key assumptions in the central scenarios
These are for the central scenarios and relate to the delta variant. Other assumptions, including for sensitivity analyses are given in Appendix 1.
Vaccine reduction in risk of infection
| AZ Dose 1 | AZ Dose 2 | Pfizer/Moderna Dose 1 | Pfizer/Moderna Dose 2 | |
|---|---|---|---|---|
| Imperial | 33% | 55% | 33% | 85% |
| LSHTM | 43% | 62% | 47% | 80% |
| Warwick | 34% | 71% | 34% | 73% |
Vaccine reduction in risk of infection of onwards transmission if infected
(in addition to transmission reduction from lower infection risk)
| AZ Dose 1 | AZ Dose 2 | Pfizer/Moderna Dose 1 | Pfizer/Moderna Dose 2 | |
|---|---|---|---|---|
| Imperial | 33% | 33% | 33% | 33% |
| LSHTM | 24% | 45% | 33% | 56% |
| Warwick | 45% | 45% | 45% | 45% |
Vaccine reduction in risk of symptomatic disease
| AZ Dose 1 | AZ Dose 2 | Pfizer/Moderna Dose 1 | Pfizer/Moderna Dose 2 | |
|---|---|---|---|---|
| Imperial | 33% | 55% | 33% | 85% |
| LSHTM | 43% | 71% | 47% | 84% |
| Warwick | 34% | 82% | 34% | 83% |
Vaccine reduction in risk of hospital admission
(or severe disease)
| AZ Dose 1 | AZ Dose 2 | Pfizer/Moderna Dose 1 | Pfizer/Moderna Dose 2 | |
|---|---|---|---|---|
| Imperial | 73% | 85% | 73% | 89% |
| LSHTM | 69% | 86% | 71% | 87% |
| Warwick | 64% | 90% | 64% | 91% |
Vaccine reduction in risk of death
| AZ Dose 1 | AZ Dose 2 | Pfizer/Moderna Dose 1 | Pfizer/Moderna Dose 2 | |
|---|---|---|---|---|
| Imperial | 73% | 85% | 73% | 89% |
| LSHTM | 69% | 90% | 71% | 92% |
| Warwick | 60% | 96% | 60% | 96% |
Coverage achievable
| Under 40- year olds | 40- to 49-year olds | 50- to 79-year olds | 80 and over | |
|---|---|---|---|---|
| Imperial | 80% | 90% | 95%-99% | 95% |
| LSHTM | 80% | Per actuals | Per actuals | Per actuals |
| Warwick | 80% | Per actuals | Per actuals | Per actuals |
Seasonality
Imperial: 20% peak (February) to trough (August) variation in transmission.
LSHTM: 20% peak to trough seasonality in central scenarios.
Warwick: 10% peak (February) to trough (August) variation in transmission.
Transmission advantage of Delta over alpha
Imperial: Central scenarios of 50%, 65% and 80%.
LSHTM: Scenarios of 30%, 50%, 70%.
Warwick: Central scenario 56% (CI 34%-81%). Sensitivities for 25% to 119% transmission advantage.
Rollout speed
This is based on a scenario, provided by the Cabinet Office, that may not reflect the situation most likely to occur.
An average of 2.15m doses per week in England until week commencing 25 July and 2m per week thereafter.
A full set of assumptions is given in Appendix 1 and the respective modelling papers.
Growth advantage of the delta variant
7. Five SPI-M-O groups have continued to independently estimate the growth advantage of delta over alpha. The most recent estimates are that R is 40% to 80% higher for delta, although a figure higher or lower than this cannot be ruled out. These estimates would change if it were to become clear that the generation time (the time between primary and secondary infections) for delta is different from that of alpha.
How the delta variant could result in a large surge in admissions
8. At present, the number of COVID-19 hospital admissions remains low. They are expected, however, to rapidly increase:
a. Cases of delta have been doubling in the most recent weeks. This has been masked by a gradual decline in the prevalence of alpha but, as delta has come to dominate, it is now clear in the overall numbers. There is evidence of exponential growth in the epidemic in England in every age group.
b. This exponential growth in cases will accelerate as people have more social contact (including more riskier contacts), particularly if Step 4 is taken on 21 June 2021. This increase will continue to quicken until either a) behaviours spontaneously change in response to the resurgence, b) policy changes or c) a build-up in immunity (acquired either through vaccination or by infection) means the epidemic starts to grow more slowly and eventually shrink.
c. The delta variant is highly transmissible. Whilst the precise herd immunity threshold cannot be calculated, an R0 of 7 would require over 80% of all people (not just adults) to be immune for herd immunity to be reached and for the epidemic to begin to shrink without further measures. Younger adults play a disproportionately large role in transmission but have not yet been vaccinated.
d. Whilst highly effective, vaccines do not provide perfect protection against infection and so more than 80% of the population need to be either vaccinated or infected to prevent ongoing long chains of transmission. Despite the success of the vaccine rollout, without behavioural change, the growth in cases will increase for many more weeks.
e. The relationship between cases and hospitalisations has changed, however, it is not entirely broken. The ratio of confirmed cases to hospital admissions has been roughly stable since the start of April 2021 (Figure 1). This implies that a rapid increase in cases will lead to a rapid increase in admissions. Once the epidemic has settled to a new stable age distribution a doubling of cases will be expected to result in a doubling of admissions.
Figure 1: Hospital admissions in England per 1,000 confirmed cases 10 days earlier (data: gov.uk)
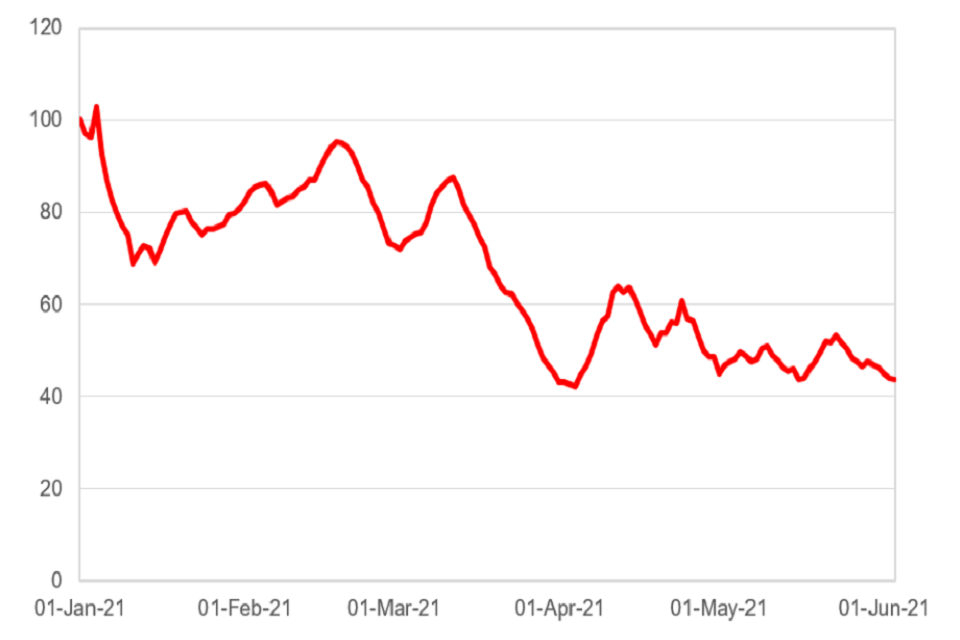
A line chart showing an overall decline in hospital admissions per 1,000 confirmed cases ten days earlier between January and June 2021, though with some periods of increase. The ratio of hospital admissions to cases is roughly stable from April onwards.
f. Hospitalisation numbers are currently very low. As with cases 2 to 3 weeks ago, however, there has been a rapid increase in admissions with S-gene positive variants (almost certainly the delta variant). This has been masked by a decline in S-gene negative variants (Figure 2).
Figure 2 (for release): Hospital admissions in England overall (left), with detectable S-gene (centre) and with S-gene failure (right). Black line is the 7-day moving average. This analysis uses data based on admissions from emergency care; it does not include patients admitted through other routes and will therefore undercount. Patients are only counted once on a single day. S-gene data are not available for all samples. Analysis by JBC using data from NHS Digital.
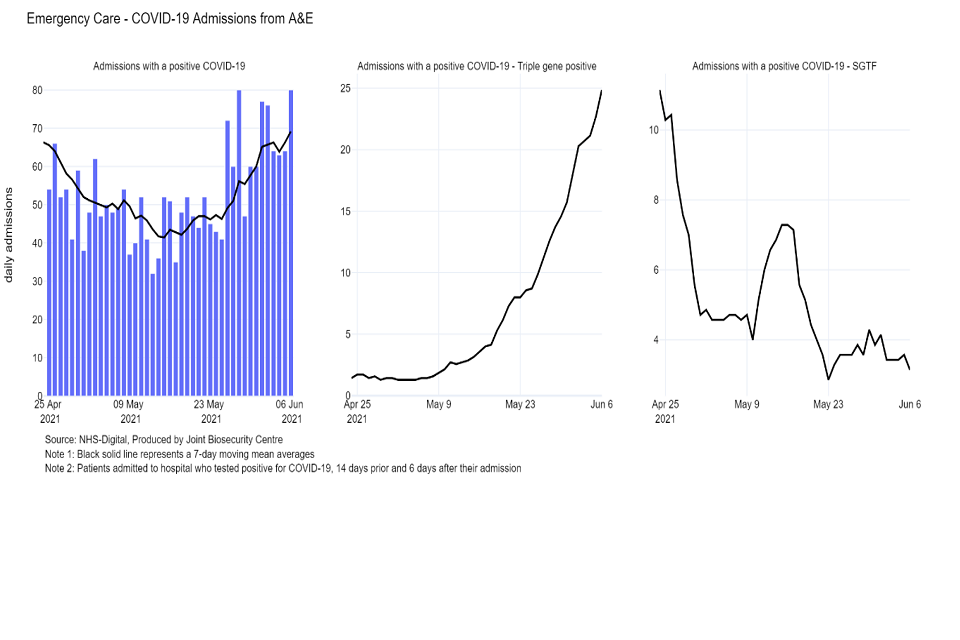
Bar chart of admissions from A&E, with line chart of moving 7-day average (April-June 21). These initially fall, then rise back to April levels. Line charts for the same period show rising S-gene positive admissions, while S-gene negative admissions fall.
Figure 2 (redacted): Hospital admissions in England overall (left), with detectable S-gene (centre) and with S-gene failure (right). Black line is the 7-day moving average. Data in the shaded grey area are incomplete and will be revised upwards. There may be further minor revisions in the non-shaded area to account for those with the longest hospital stay. S-gene data are not available for all samples. Analysis by JBC using data from NHS Digital.[footnote 3]
g. The last 18 months have demonstrated that exponential growth does not appear to be problematic at first, but this rapidly changes. On 6 June 2021, there were 121 hospital admissions in England. While low, this is only around 5 doublings from the peak in January 2021. It is highly likely that at least one doubling of admissions will occur within the next 2 weeks as the result of the recent doubling in cases.
Current epidemic estimates
9. SPI-M-O’s best estimate for R in England is between 1.2 and 1.4 and the growth rate is between +3% and +6% per day, based on data available up to 7 June 2021. Estimates for NHS England regions are given in Appendix 2. R is a lagging indicator, reflecting the state of the epidemic approximately 2 weeks ago when a smaller proportion of cases were caused by the delta variant. This estimate is significantly higher than an R of 1.0 to 1.1 (and a growth rate of 0% to +3% per day)[footnote 4], which reflected the state of the epidemic shortly before Step 3 of the Roadmap was taken.
10. The local hotspots have coalesced into wider regional patterns. On the current trajectory, high growth areas are expected to expand further. The epidemic remains highly heterogeneous.
Medium term projections and scenarios
11. Each week, SPI-M-O combine estimates from several independent models to project the trajectory of the epidemic if no further changes in behaviour or policy take place. They represent what the trajectory might be if the epidemic continued to follow the trends seen in the latest available data up to 7 June 2021. They are neither forecasts nor predictions and cannot fully reflect recent changes in transmission that have not yet filtered through into surveillance data. They are published separately as SPI-M-O medium-term projections.
12. Three of these same models have further been used to explore the potential impact of a range of scenarios following changes in transmission. These scenarios assume R changes to 1.2, 1.5, 1.8, or 2.1 on 21 June 2021 [footnote 5], and run for a further 6 weeks. These scenarios are shown on a logarithmic scale in Figure 3 (R=1.2 – green; 1.5 – blue; 1.8 – yellow; 2.1 – red) for England’s hospital admissions alongside the latest medium-term projection of current trends (grey) for comparison.
13. A doubling time in infections of around one week is consistent with growth in hospitalisations akin to the blue line (R=1.5) in Figure 3. Faster growth in infections will cause faster growth in hospitalisations a few weeks later.
14. Figure 3 shows that the ongoing vaccine rollout programme means that a period with R around 1.2 would result in a very small increase in hospital admissions. An increase of R to 1.5 or 1.8 would result in substantial number of hospital admissions.
Figure 3: Eight-week scenarios for daily hospital admissions in England over a range of R values (1.2 – green; 1.5 – blue; 1.8 – yellow; 2.1 – red) reflecting the possible impact of the easements from 21 June 2021. The grey line is SPI-M-O’s medium-term projection of current trends. All scenarios show interquartile ranges of model combinations as the shaded band. Note the logarithmic scale.
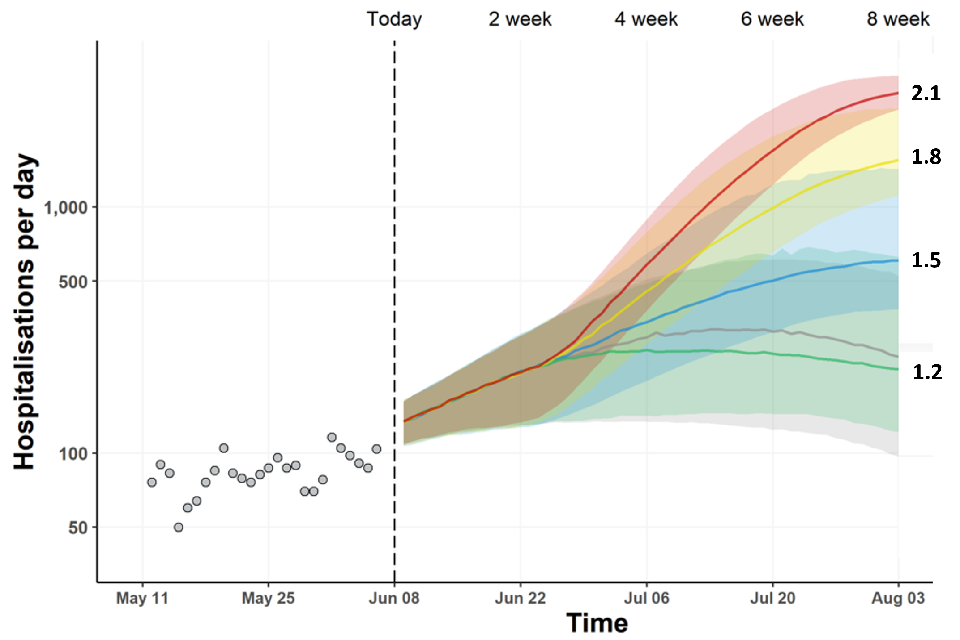
Fan chart showing rising admissions under all four scenarios for a rise in R value. Admissions plateau from late June if R=1.2. R=1.5, 1.8 or 2.1 lead to substantial rises in admissions. Interquartile ranges overlap for all scenarios until early July.
15. Similar scenarios, published in SPI-M-O’s Step 3 roadmap modelling, assumed a step change in transmission happened on 17 May 2021. In reality, in addition to a change in behaviour from that date, there were gradual increases in transmission in different parts of the country at different times as the delta variant spread. This means that hospital admissions have not yet settled down to a consistent trajectory across the country.
Modelling Step 4 of the Roadmap
16. SPI-M-O has considered the results from 2 academic groups that have independently modelled taking Step 4 of the Roadmap at the earliest possible date, 21 June 2021. These groups have made assumptions in the central scenarios that include:
a. Delta is the dominant strain, with increased transmissibility and decreased vaccine effectiveness compared to alpha. Increased risk of admission given infection is not included;
b. There is a step change in behaviour on 21 June 2021, but that transmission reduction remains as a result of baseline measures and behaviour change after Step 4;
c. Once removed, social distancing measures are never re-imposed.
17. All results are highly sensitive to the modelling assumptions, and extensive sensitivity analyses have been performed. The key uncertainties are laid out in this summary; full details are given in the accompanying modelling papers.
18. Imperial’s modelling is not described in detail in this paper but has results which are consistent with the other 2 groups. A full description is given their accompanying paper.
19. Every commissioned scenario from the 2 groups shows another substantial wave of hospital admissions. These waves are larger than those seen in SPI-M-O’s modelling at Step 3 of the Roadmap[footnote 6] due to the recent emergence and now dominance of the delta variant, with its increased growth advantage and decreased vaccine effectiveness compared to the alpha variant.
20. Figure 4 shows the results of the groups’ central scenarios[footnote 7]. In all instances, the confidence intervals indicate that under these particular sets of assumptions, a peak in hospital admissions that is either higher or lower than that of January 2021 is plausible.
Figure 4: England infections (top), hospital admissions (second row), hospital occupancy (third row) and deaths within 28 days of a positive test (bottom) in the Warwick (left – red) and LSHTM (right – green) models, assuming central assumptions if Step 4 is taken on 21 June 2021 including delta being 56% (Warwick) and 50% (LSHTM) more transmissible, 2 dose vaccine effectiveness against admission of 90-91% (Warwick) and 90% (LSHTM). Peaks in occupancy and daily deaths from January 2021 and levels seen in Spring 2020 are shown by past data points and dashed horizontal line. Vertical dashed lines show the dates at which each Roadmap step is taken. Shaded regions show the 95% (Warwick) and 90% (LSHTM) prediction/credible intervals and lines indicate the medians of the distributions.
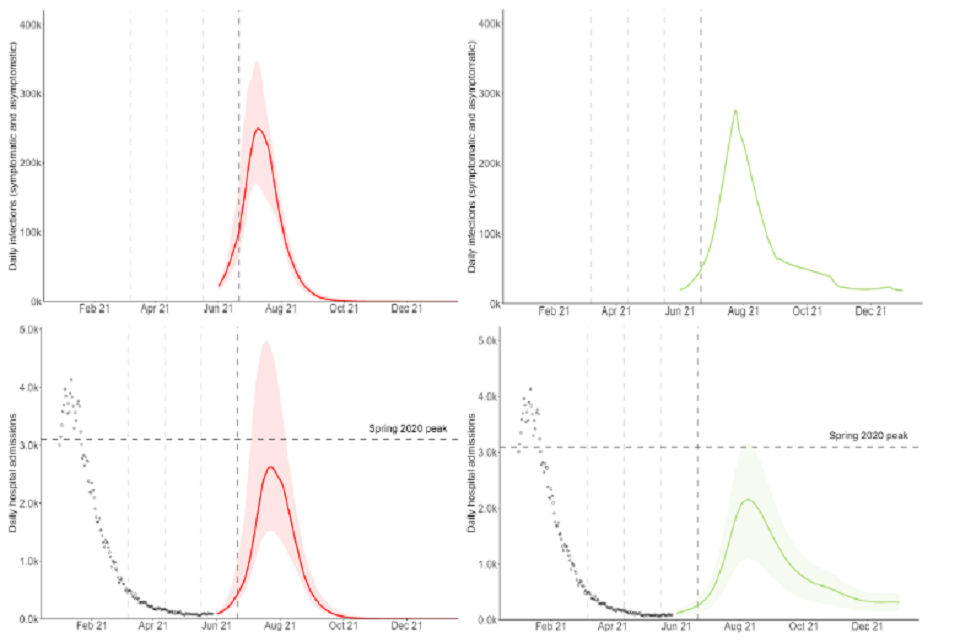
Two sets of four fan charts showing a resurgence in infections, hospital admissions, occupancy and deaths in England in the Warwick and LSHTM models.
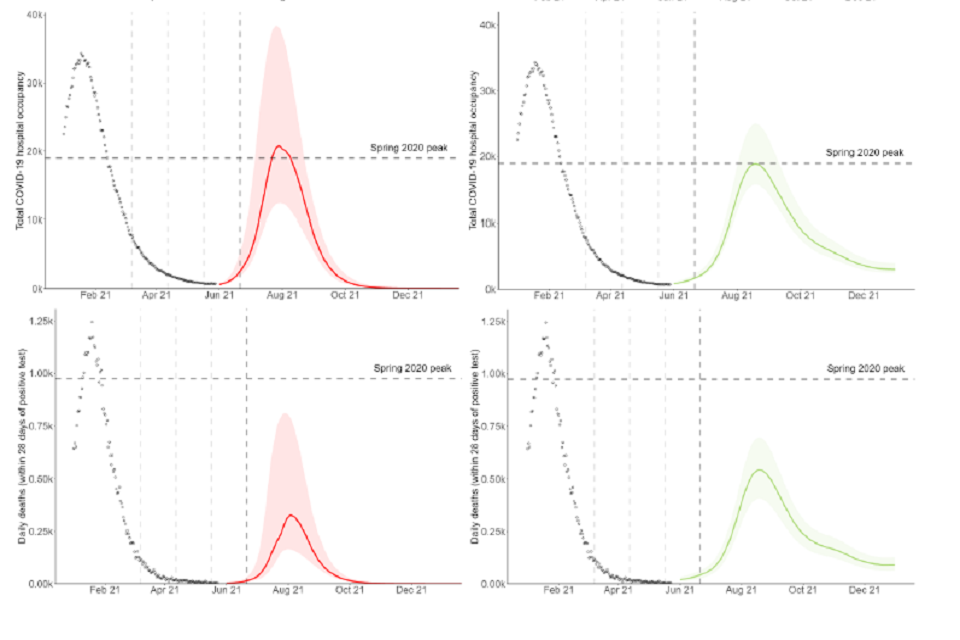
Two sets of four fan charts showing a resurgence in infections, hospital admissions, occupancy and deaths in England in the Warwick and LSHTM models.
21. There is some variation in the modelled age and vaccine status of those being admitted to hospital during the peak of the next wave. In the middle of June for each model, almost all admissions to hospital are from non- or partially vaccinated people. Models are also consistent in predicting that the proportion of admissions from vaccinated people will rise over time but disagree as to how far. This will depend on a complex mix of factors including vaccine uptake, effectiveness, and timing of the peak. Figure 5 shows the proportion of admissions split by age and vaccine status in Warwick’s central scenario. LSHTM project a smaller proportion of admissions being in vaccinated people whereas Imperial project a higher proportion.
22. This is broadly in line with SPI-M-O’s modelling of Step 2 of the Roadmap[footnote 8], although in this iteration of modelling, a slightly smaller proportion of admissions are from vaccinated groups. The latest modelling assumes a slightly lower uptake in under 50-year olds than that previously modelled (then 80% to 85% in those under 30 and approx. 90% in those aged 30 to 49, now in line with doses given to date in those aged 40 to 49 and 80% in those aged 18 to 39).
Figure 5: Admissions in England, split by age group and vaccination status (unvaccinated – red with diagonal hashing; one dose – solid green; 2 doses – blue with horizontal hashing). Central scenario from the Warwick model.
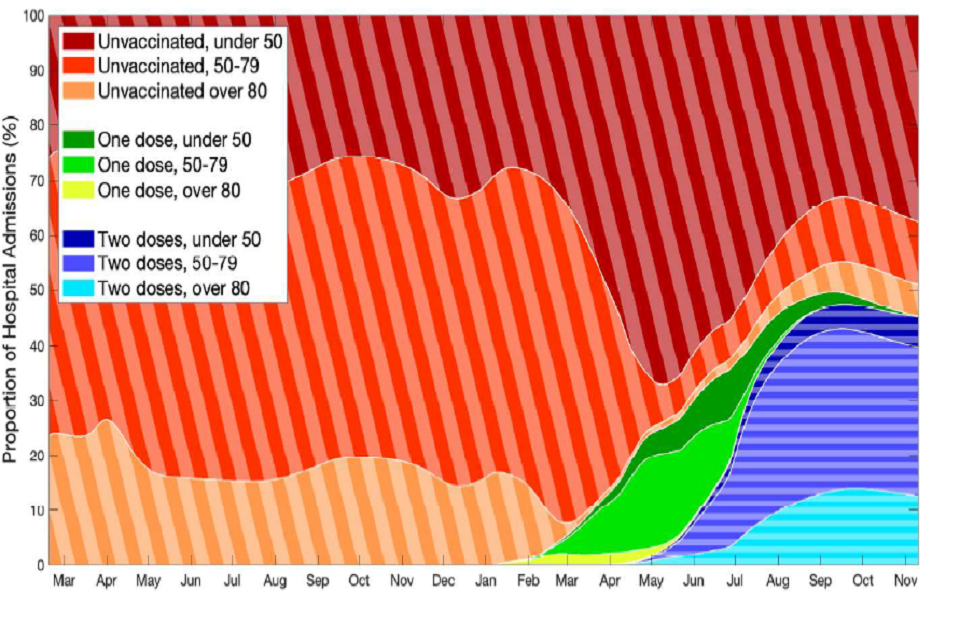
Stacked area chart showing the changing distribution of hospital admissions by age and vaccine status between March 2020 and November 2021 in the Warwick model.
Sensitivity to growth advantage of, and vaccine effectiveness against the delta variant
23. As mentioned in paragraph 7, whilst information is accruing about the transmission advantage of the delta variant, a wide range of estimates remain plausible. There is also very little data available so far on the protection given by vaccines against hospital admission and death with the delta variant. SPI-M-O has previously modelled the emergence of and possible impacts of variants with different properties, showing the sensitivity of results to the assumptions used[footnote 9].
24. Figure 6 demonstrates the sensitivity to each of these factors. The 3 different plots show admissions in the Warwick model with vaccine effectiveness assumptions that are central (top; 90% to 91% against admission after 2 doses), optimistic (bottom left, 95%) or cautious (bottom right, 86%). Within each plot, different colours represent a different assumption about the transmission advantage of delta, ranging from 20% lower (blue) to 40% higher (yellow) compared to the central scenario (red), where the central assumption is that delta has a 56% transmission advantage over alpha.
25. This shows that, while there is a significant resurgence in admissions in all scenarios, the scale of that resurgence is highly uncertain and ranges from considerably smaller than January 2021 to considerably higher. The difference between the optimistic and cautious effectiveness assumptions leads to a factor of 3 difference in the peak height; between 20% additional and 20% less transmission advantage leads to a factor of 5 difference.
26. As results are so sensitive to these assumptions, SPI-M-O cannot determine with confidence whether taking Step 4 of the Roadmap on 21st June would result in a peak that might put unsustainable pressure on the NHS.
Figure 6: Impact of assuming various levels of transmission of the delta variant, on the number of daily hospitalisations in England for the default vaccine efficacy assumptions (top), optimistic vaccine assumptions (bottom left), and cautious vaccine assumptions (bottom right) in the Warwick model. Each line and shaded area represent transmission of delta compared to the default (red) – either 20% lower (purple), 10% lower (blue), 10% higher (dark green), 20% higher (light green), or 40% higher (yellow). Dashed line represents the peak from spring 2020 and dots represent actual data, including the January 2021 peak. Shaded regions show the 95% prediction intervals and lines indicate the medians of the distributions.
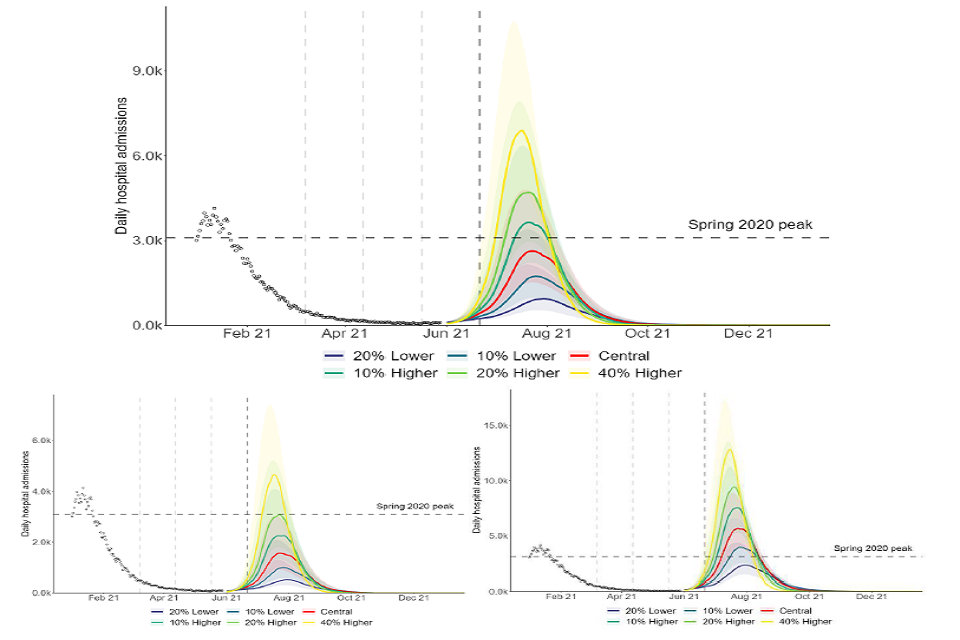
Three fan charts showing the scale of resurgence in hospital admissions increases with the level of transmission advantage assumed for the delta variant. Relative to default assumptions, peaks are much larger if cautious vaccine efficacy is assumed.
27. The epidemic is at a particularly uncertain point in time and models have struggled to reconcile the rapid growth in delta cases with what appear to be currently flat hospitalisations. This may be due to reasons outlined above in paragraph 8, however, this has made it more difficult for models to successfully fit to all data streams. Delaying Step 4 would enable more time to resolve these data interpretation issues, accrue more information on the delta variant’s transmission and hospitalisation rates and observe the progression of the new delta variant epidemic before adding even faster transmission as a result of further relaxations.
Sensitivity to timing of taking Step 4
28. In the scenarios modelled by both groups, a short delay to the date at which Step 4 is taken significantly reduces both the height of the next peak and the total number of deaths and admissions that occur over the duration of the wave. Even a 2-week delay would have a significant effect, but a 4-week delay is modelled as reducing the peak in hospital admissions by around a third to a half.
29. This is illustrated by Figure 7, showing the Warwick model with the central (top), optimistic (bottom left) and pessimistic (bottom right) vaccine effectiveness assumptions. The proportional impact is similar in each scenario, even though the scale is very different. Models assume that transmission will be significantly reduced during the school summer holidays and so a delay of 4 weeks that moves further relaxations into this time period has a particularly large effect.
Figure 7: Admissions in England in Warwick’s central (top), optimistic (bottom left) and cautious (bottom right) scenarios, if Step 4 is taken on 21 June 2021 (red) or with a delay of 1 to 4 weeks (purple to green lines) or a delay of 9 weeks (yellow). Shaded regions show the 95% prediction intervals and lines indicate the medians of the distributions.
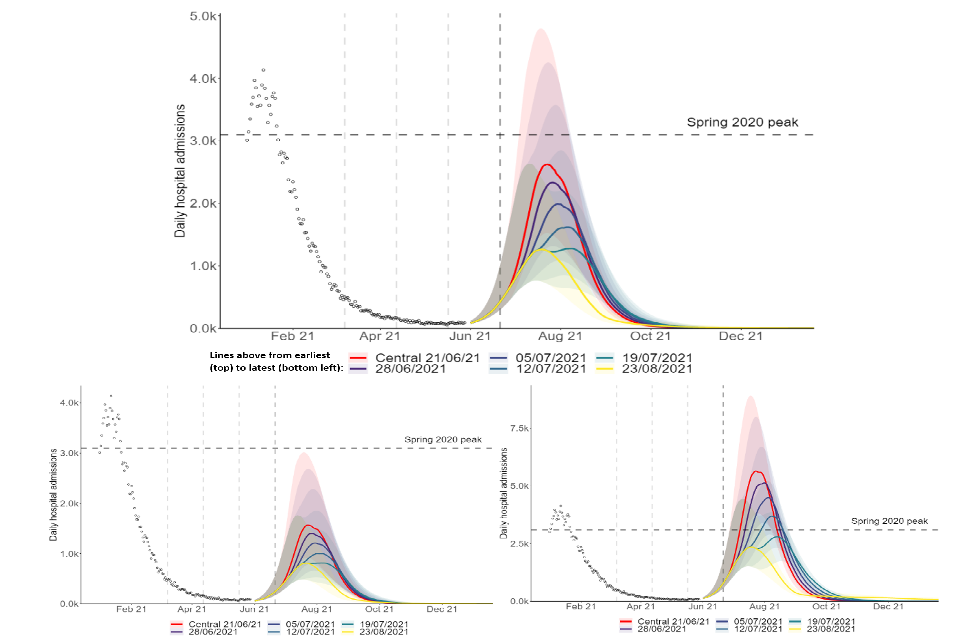
Three fan charts showing that the scale of resurgence in hospital admissions in England reduces as the delay in taking Step 4 increases, under central, optimistic and cautious vaccine efficacy assumptions.
30. In addition to allowing many more people to be protected by vaccination (thus reducing the risk of severe outcomes and the likelihood of unsustainable pressure on hospitals), a short delay to progressing to Step 4 would allow for greater clarity about the transmission advantage of delta and the extent to which vaccines offer protection against severe disease caused by it. This would provide greater certainty about the risk of taking Step 4 before it happens.
31. In some of the LSHTM scenarios, lower transmission over summer and waning immunity results in a second peak in the autumn, or an extended period of a high prevalence. This, however, does not account for either revaccination or the emergence of other variants.
32. As previously modelled by SPI-M-O[footnote 10], a 2-stage process in which restrictions are partially lifted on 21 June 2021 before being removed slightly later can also significantly reduce the peak of the next wave. This is illustrated by Figure 8, showing a return to pre-pandemic behaviour on 21 June 2021 (red) or a 2-stage process with partial relaxation on that date and a full relaxation 5 weeks later (blue).
Figure 8: Admissions in England in the Warwick model for default vaccine efficacy assumptions if there were a return to pre-pandemic behaviours on 21 June 2021 (dark red) or if there is a partial relaxation on that date followed by a return to pre-pandemic behaviour 5 weeks later (26 July 2021, blue); a 2-step relaxation with first stage on 26 July 2021 and second step 5 weeks later (30 August 2021, green); or first stage on 30 August 2021 and second step 5 weeks later (4 October, yellow). Please note, this single step scenario is not the same as the other central scenarios from Warwick modelling due to assuming a return to pre-pandemic levels of contacts.
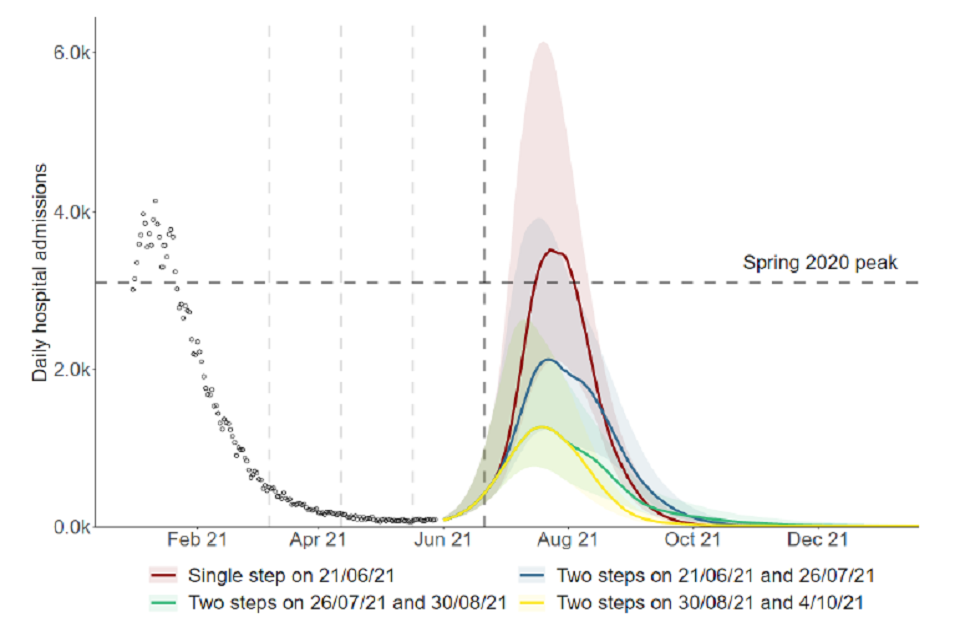
Fan chart showing a resurgence in admissions similar to Jan 2021, if pre-pandemic behaviour resumes 21 June. A partial lifting with full relaxation 5 weeks later reduces the peak by over a third. Delaying the initial relaxation further reduces the peak.
Sensitivity to transmission once all restrictions are lifted after Step 4 is taken
33. SPI-M-O have previously advised that an important unknowable factor is the extent to which behaviours will change after Step 4 compared to pre-pandemic, and how much baseline measures will reduce transmission.
34. Figure 9 shows the central scenario[footnote 11] in the LSHTM model with high, medium, and low transmission after Step 4, represented by high, medium or low mobility, in addition to a 30 to 40% transmission reduction from baseline measures. For this set of assumptions about the delta variant, the high mobility scenario results in a resurgence of a similar size to January 2020, but the low mobility scenario is half this size.
Figure 9: Admissions in England in LSHTM’s high (blue), medium (green), and low (purple) mobility scenarios if Step 4 is taken on 21 June, assuming 50% increased transmissibility relative to alpha and 2 dose vaccine effectiveness against admission of 90%. Shaded regions show the 90% credible intervals and lines indicate the medians of the distributions.
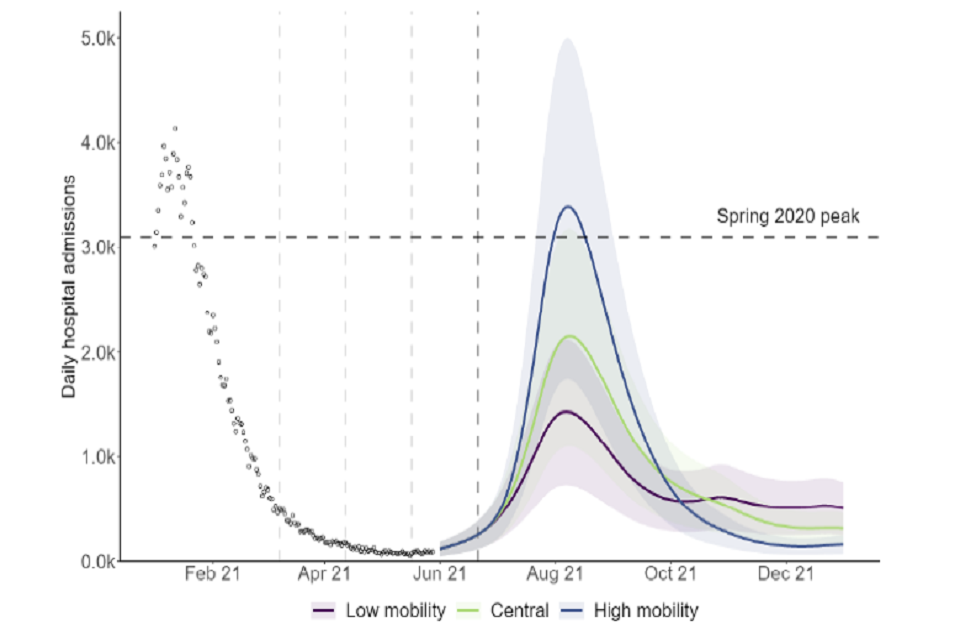
Fan chart showing the scale of resurgence in admissions increases with assumed mobility levels following Step 4 in the LSHTM model. High mobility results in a median peak of similar size to January 2021 and is approximately double the low mobility peak.
Sensitivity to other factors
35. Other sensitivity analyses are given in the respective full modelling papers, including considering the effect of overall vaccine uptake.
36. As expected, a more rapid rollout of first vaccine doses would somewhat reduce the size of the next resurgence (Figure 10). The effect is smaller than in previous iterations of SPI-M-O modelling as first doses have been rolled out more widely, and models assumed that the time between doses is fixed (at 8 weeks for those aged 50 and over, and 11 weeks for under 50-year olds).
37. Although there are good data on the number of vaccines administered to date, estimates of the total population, and therefore the number of unvaccinated people, vary considerably. This could mean the scale of the next wave is being under- or overestimated in these scenarios for some parts of the country.
Figure 10: Admissions in England in the Warwick’s central scenario with total vaccine rollout ranging from 25% faster (yellow) to 25% slower (blue). Shaded regions show the 95% prediction intervals and lines indicate the medians of the distributions.
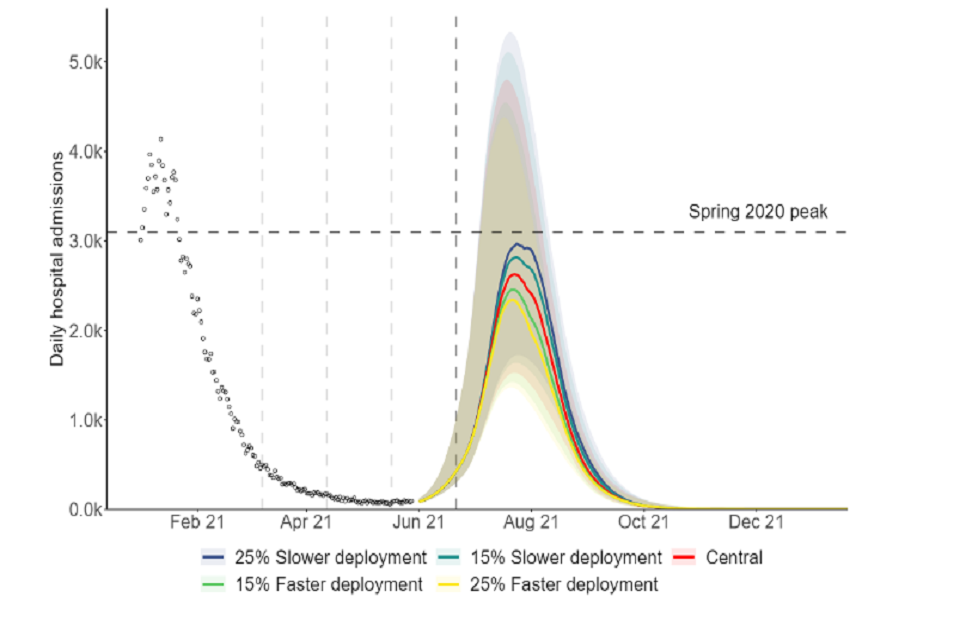
A fan chart showing that the scale of the resurgence in hospital admissions in England reduces with faster deployment of vaccines in the Warwick model, though the magnitude of the impact on peak admissions is modest.
Appendix 1: Model assumptions
Parameter values for B.1.1.7 are given in the respective modelling papers, alongside further details of the models. Given the dominance of B.1.617.2, the results are less sensitive to assumptions about B.1.1.7 than previously.
Vaccine reduction in risk of infection (Delta variant)
Imperial College
| Central | Pessimistic | Optimistic | |
|---|---|---|---|
| AZ 1 dose | 33% | 20% | 45% |
| AZ 2 dose | 55% | 30% | 60% |
| PF/MD 1 dose | 33% | 20% | 40% |
| PF/MD 2 dose | 85% | 78% | 86% |
LSHTM
| Central | Pessimistic | Optimistic | |
|---|---|---|---|
| AZ 1 dose | 43% | 38% | 48% |
| AZ 2 dose | 62% | 60% | 63% |
| PF/MD 1 dose | 47% | 43% | 52% |
| PF/MD 2 dose | 80% | 79% | 81% |
Warwick
| Central | Pessimistic | Optimistic | |
|---|---|---|---|
| AZ 1 dose | 34% | 33% | 45% |
| AZ 2 dose | 71% | 58% | 84% |
| PF/MD 1 dose | 34% | 30% | 45% |
| PF/MD 2 dose | 73% | 58% | 84% |
Vaccine reduction in risk of onward transmission if infected (Delta variant)
(additional to transmission reduction due to reduced infection risk)
Imperial College
| Central | Pessimistic | Optimistic | |
|---|---|---|---|
| AZ 1 dose | 33% | 20% | 45% |
| AZ 2 dose | 33% | 20% | 45% |
| PF/MD 1 dose | 33% | 20% | 45% |
| PF/MD 2 dose | 33% | 20% | 45% |
LSHTM
| Central | Pessimistic | Optimistic | |
|---|---|---|---|
| AZ 1 dose | 24% | 22% | 27% |
| AZ 2 dose | 45% | 44% | 46% |
| PF/MD 1 dose | 33% | 30% | 36% |
| PF/MD 2 dose | 56% | 56% | 57% |
Warwick
| Central | Pessimistic | Optimistic | |
|---|---|---|---|
| AZ 1 dose | 45% | 40% | 50% |
| AZ 2 dose | 45% | 40% | 50% |
| PF/MD 1 dose | 45% | 40% | 50% |
| PF/MD 2 dose | 45% | 40% | 50% |
Vaccine reduction in risk of symptomatic disease (Delta variant)
Imperial College
| Central | Pessimistic | Optimistic | |
|---|---|---|---|
| AZ 1 dose | 33% | 20% | 45% |
| AZ 2 dose | 55% | 30% | 60% |
| PF/MD 1 dose | 33% | 20% | 40% |
| PF/MD 2 dose | 85% | 78% | 86% |
LSHTM
| Central | Pessimistic | Optimistic | |
|---|---|---|---|
| AZ 1 dose | 43% | 38% | 48% |
| AZ 2 dose | 71% | 69% | 72% |
| PF/MD 1 dose | 47% | 43% | 52% |
| PF/MD 2 dose | 84% | 83% | 85% |
Warwick
| Central | Pessimistic | Optimistic | |
|---|---|---|---|
| AZ 1 dose | 34% | 27% | 45% |
| AZ 2 dose | 82% | 64% | 84% |
| PF/MD 1 dose | 34% | 24% | 45% |
| PF/MD 2 dose | 83% | 64% | 84% |
Vaccine reduction in risk of hospitalisation admission (delta variant)
Imperial College
| Central | Pessimistic | Optimistic | |
|---|---|---|---|
| AZ 1 dose | 73% | 68% | 78% |
| AZ 2 dose | 85% | 77% | 87% |
| PF/MD 1 dose | 73% | 68% | 76% |
| PF/MD 2 dose | 89% | 84% | 90% |
LSHTM
| Central | Pessimistic | Optimistic | |
|---|---|---|---|
| AZ 1 dose | 69% | 54% | 85% |
| AZ 2 dose | 86% | 81% | 90% |
| PF/MD 1 dose | 71% | 57% | 85% |
| PF/MD 2 dose | 87% | 85% | 90% |
Warwick
| Central | Pessimistic | Optimistic | |
|---|---|---|---|
| AZ 1 dose | 64% | 60% | 85% |
| AZ 2 dose | 90% | 86% | 95% |
| PF/MD 1 dose | 64% | 58% | 85% |
| PF/MD 2 dose | 91% | 86% | 95% |
Vaccine reduction in risk of death (delta variant)
Imperial College
| Central | Pessimistic | Optimistic | |
|---|---|---|---|
| AZ 1 dose | 73% | 68% | 78% |
| AZ 2 dose | 85% | 77% | 87% |
| PF/MD 1 dose | 73% | 68% | 76% |
| PF/MD 2 dose | 89% | 84% | 90% |
LSHTM
| Central | Pessimistic | Optimistic | |
|---|---|---|---|
| AZ 1 dose | 69% | 54% | 85% |
| AZ 2 dose | 90% | 86% | 95% |
| PF/MD 1 dose | 71% | 57% | 85% |
| PF/MD 2 dose | 92% | 89% | 95% |
Warwick
| Central | Pessimistic | Optimistic | |
|---|---|---|---|
| AZ 1 dose | 60% | 60% | 80% |
| AZ 2 dose | 96% | 93% | 99% |
| PF/MD 1 dose | 60% | 58% | 80% |
| PF/MD 2 dose | 96% | 93% | 99% |
Rollout speed (England basis)
Per Cabinet Office scenario:
An average of 2.15m doses per week in England until week commencing 25th July and 2m per week thereafter. Sensitivities of 15% and 25% faster and slower rollout are explored by Warwick.
8 weeks between doses for over 50s and 11-week period between doses for under 50s (LSHTM and Warwick); 11-week period between doses (Imperial).
Time to full vaccine protection
Imperial College
3 weeks (dose 1), 1 week (dose 2).
LSHTM
4 weeks (dose 1), 2 weeks (dose 2).
Warwick
2 weeks (dose 1), 2 weeks (dose 2).
Coverage achieved (all ages)
Imperial College
| Central | |
|---|---|
| 80 and over | 95% |
| 50-79 | 95%-99% |
| 40-49 | 90% |
| <40 | 80% |
| Care home residents | 95% |
| Care home workers | 86% |
LSHTM
| Central | |
|---|---|
| 40+ | Per actuals (ONS 2018 population estimates) |
| 18-39 | 80% |
Warwick
| Central | |
|---|---|
| 40+ | Per actuals (ONS 2019 population estimates) |
| 18-39 | 80% |
R (excluding the effect of immunity) after Step 4 of easing
Imperial College
In terms of B.1.1.7 R excl. immunity:
With schools open:
- (central; higher impact from measures): 3.0 (95% CI 2.33 to 3.8)
- (lower impact from measures): 4.5 (95% CI 3.81 to 5.28)
With schools closed:
- (central; higher impact from measures): 2.7 (95% CI 2.04 to 3.51)
- (lower impact from measures): 4.2 (95% CI 3.51 to 4.98)
B.1.617.2 assumed to have between 1.5-fold and 2-fold increase in R excluding the effect of immunity over B.1.1.7.
LSHTM
30-40% reduction in R from baseline measures plus additional reduction using mobility data (relative to baseline mobility in early 2020, pre-epidemic).
| Low | Medium | High | |
|---|---|---|---|
| Grocery and pharmacy | 105% | 105% | 105% |
| Retail and recreation | Aug 2020 | 95% | 105% |
| Transit | Sep 2020 | 80% | 90% |
| Workplace | 80% | 85% | 90% |
R (excluding immunity) reduced by 0.2 to 0.3 during school holidays in all scenarios.
Warwick
Central: 5.66 (95% CI 5.4 to 5.95)
Additional sensitivities for transmission reduction from baseline controls after Step 4 considered, ranging from R excl. immunity = 3.51 to 6.68.
School holidays modelled by changing the mixing patterns for school-aged children.
Transmission advantage of Delta over Alpha
Imperial College
Scenarios of 50%, 65% and 80% transmission advantage over alpha (central immune escape/vaccine effectiveness).
Additional sensitivities of 50%, 70% and 90% (low escape) and 40%, 55% and 70% (high escape).
LSHTM
Scenarios of 30%, 50% and 70% transmission advantage over alpha.
Warwick
Central scenario 56% (CI 34%-81%) transmission advantage over alpha.
Sensitivities for 20% or 10% lower, and 10%, 20% or 40% higher advantage relative to the central scenario of 56% - corresponding to between 25% and 119% transmission advantage.
Seasonality
Imperial College
20% peak (February) to trough (August) in central scenario.
LSHTM
20% peak to trough seasonality in central scenarios.
Warwick
10% (February) to trough (August) in central scenario.
Other scenarios included in accompanying paper.
Waning immunity
Imperial College
Exponential decay in infection-induced immunity with an average of 3 years.
LSHTM
Waning of natural and vaccine-induced immunity by 15% over 6 months. Sensitivity analysis with no waning also included.
Warwick
None over the timescale modelled.
Appendix 2: Regional estimates of R and growth rates
Table 1: Combined estimates of R values and growth rates in England, and NHS England regions (90% confidence interval)[footnote 12]. These estimates represent the transmission of COVID-19 2 to 3 weeks ago, due to the time delay between someone being infected, developing symptoms, and needing healthcare.
| Nation | R | Growth rate per day | Doubling time [footnote 13] |
|---|---|---|---|
| England | 1.2 to 1.4 | +3% to +6% | 13 to 21 days |
| NHS England region | R | Growth rate per day | Doubling time |
|---|---|---|---|
| East of England | 1.1 to 1.4 | +2% to +6% | 12 to 26 days |
| London | 1.1 to 1.4 | +2% to +6% | 12 to 26 days |
| Midlands | 1.1 to 1.3 | +1% to +5% | Flat to 15 days |
| North East and Yorkshire | 1.0 to 1.2 | 0% to +4% | Flat to 21 days |
| North West | 1.3 to 1.5 | +4% to +8% | 9 to 14 days |
| South East | 1.1 to 1.4 | +1% to +6% | Flat to 12 days |
| South West [footnote 14] | 1.0 to 1.3 | 0% to +6% | Flat to 13 days |
Appendix 3: Regional estimates of R and growth rates
Full details of the Roadmap for England are available[footnote 15]. A summary is given here.
Step 1a: 8 March 2021
- Schools and colleges return
- Higher education on practical courses return
- Recreation and exercise outdoors with household or support bubble, or with one person from outside their household
- Care home residents allowed one regular visitor
Step 1b: 29 March 2021
- Outdoor sport and leisure facilities
- Rule of 6 or 2 households outside
Step 2: 12 April 2021
- Non-essential retail
- Personal care
- Indoor leisure facilities
- Outdoor attractions
- Outdoor hospitality
Step 3: 17 May 2021
- Indoor hospitality, entertainment and leisure
- 30-person limit outside
- Rule of 6 or 2 households advised inside
- Return to face-to-face teaching for all higher education
- Large events (outdoor 50% capacity, limit 4,000; indoor 50% capacity, limit 1,000)
Step 4: Not earlier than 21 June 2021
Full unlock with long-term mitigations and guidance
-
The World Health Organisation recently recommended using letters of the Greek alphabet when referring to SARS-CoV-2 variants. Current variants of concern labelling stands as B.1.1.7 as alpha, B.1.351 as beta, P.1 as gamma, and B.1.617.2 as delta. ↩ ↩2
-
R estimate for England from 26 May 2021, published 28 May 2021 ↩
-
Footnote added for release: A redaction has been made to remove Figure 2 as originally presented to SAGE, as it contains statistically disclosive / identifiable data. An alternative Figure 2 has been provided for release that conveys a similar point. ↩
-
R estimate for England from 26 May 2021, published 28 May 2021 ↩
-
In each of these scenarios, R drops over time as vaccination and infection reduce the number of people who remain susceptible. ↩
-
SPI-M-O: Summary of further modelling of easing restrictions – Roadmap Step 3; SAGE 88 5 May 2021 ↩
-
No single central scenario is provided in the accompanying LSHTM paper. The scenario relating to medium mobility, low immune escape and delta being 50% more transmissible is shown here to aid comparability across the groups. ↩
-
SPI-M-O: Summary of further modelling of easing restrictions – Roadmap Step 2; SAGE 85 31st March 2021 ↩
-
SPI-M-O: Consensus statement on COVID-19; SAGE 80, 11 February 2021; SPI-M-O: Summary of further modelling of easing restrictions – Roadmap Step 2; SAGE 85 31 March 2021; SPI-M-O: Summary of further modelling of easing restrictions – Roadmap Step 3; SAGE 88 5 May 2021 ↩
-
SPI-M-O: Summary of further modelling of easing restrictions – Roadmap Step 3; SAGE 88 5 May 2021 ↩
-
No single central scenario is provided in the accompanying LSHTM paper. The scenario relating to medium mobility, low immune escape and delta being 50% more transmissible is used for consistency with Figure 4. ↩
-
The estimated intervals for R and growth rate may not exactly correspond to each other due to the submission of different independent estimates and rounding in presentation. ↩
-
Particular care should be taken when interpreting these estimates as they are based on low numbers of cases, hospitalisations, or deaths and / or are dominated by clustered outbreaks and so should not be treated as robust enough to inform policy decisions alone. ↩
-
Further details can also be found at COVID-19 Response – Spring 2021 (Summary) ↩