SPI-M-O: Insights from early vaccination modelling, 9 December 2020
Updated 13 May 2022

© Crown copyright 2022
This publication is licensed under the terms of the Open Government Licence v3.0 except where otherwise stated. To view this licence, visit nationalarchives.gov.uk/doc/open-government-licence/version/3 or write to the Information Policy Team, The National Archives, Kew, London TW9 4DU, or email: psi@nationalarchives.gov.uk.
Where we have identified any third party copyright information you will need to obtain permission from the copyright holders concerned.
This publication is available at https://www.gov.uk/government/publications/spi-m-o-insights-from-early-vaccination-modelling-9-december-2020/spi-m-o-insights-from-early-vaccination-modelling-9-december-2020
All probability statements are in line with the framework in Appendix 2.
Summary
The impact of immunisation on the epidemic critically depends on the effect of the vaccine on the infectiousness of those who have been vaccinated. This is currently unknown.
It is very important to get extremely high vaccine coverage in the most vulnerable groups before non-pharmaceutical interventions (NPIs) are eased (or adherence to them drops) if we are to avoid a very high death toll.
To reach herd immunity from vaccination, coverage of the adult population would need to be very high and vaccines would need to be highly efficacious against transmission.
If vaccines are not highly effective against infection and transmission, then they will not directly lead to herd immunity on their own; further naturally-acquired immunity would be needed as well.
Once the vaccine has been rolled out to the most vulnerable people, there will be scope for partial relaxation of non-pharmaceutical interventions (or lower adherence to them), but the extent of this scope is highly dependent upon the impact of vaccines on viral transmission.
Vaccines will prevent more COVID-19 deaths if restrictions are maintained and well-adhered to until a late stage of the vaccine rollout, and if prevalence kept low until that point.
Introduction
The paper is a summary of the insights from early modelling of the interaction between vaccines and non-pharmaceutical interventions over the course of 2021. It does not consider the optimal use and prioritisation for the vaccine rollout (which is a matter for Joint Committee on Vaccines and Immunisation [JCVI]) nor longer term considerations, such as waning immunity. It is drawn primarily from work by modellers from Imperial College London and the University of Warwick.
There is still a great deal of uncertainty about the trajectory of the epidemic in the UK over 2021, and there is much that is unknown both about the vaccines themselves and how rapidly they will be rolled out. These are high level findings and cannot offer precise predictions. Nevertheless, there are useful lessons to be drawn from modelling at this stage.
The impact of the earliest vaccines depends critically on several factors that are currently unclear. These include:
- effectiveness against infection and onwards transmission;
- the choice of non-pharmaceutical interventions (NPIs) and adherence to them;
- other behavioural factors, including behaviour of vaccinated people;
- the vaccine coverage that is achieved;
- speed of rollout; and
- duration of protection.
Trials have shown that some vaccines are highly effective at preventing symptoms of COVID-19. We do not know, however, how effective these vaccines are at preventing infection and onward transmission of the virus, so we consider a range of scenarios from a 0 per cent to a 75 per cent reduction in transmission. Modelling alone cannot determine the impact against infection or transmission, which will require bespoke epidemiological studies. Throughout this paper we use “protection against infection” and “protection against transmission” interchangeably.
Two scenarios are considered for policy and behaviour.
We assume that vaccine coverage is high, at 95 per cent for those in care homes and 75 per cent elsewhere, with a sensitivity analysis of 50% in the latter in one model. Further sensitivity analyses are needed on this assumption.
We consider a deliberately optimistic set of rollout timelines, so the dates shown here should be considered a best-case scenario. These will be refined as rollout progresses. Vaccination is broadly prioritised per the JCVI recommendations of 3 December. [footnote 1] Details of the rollout assumptions are given in Appendix 1. Vaccination begins with Pfizer alone for the first 4 million doses from 1 December and lasts a month. From then a mixture of 20 per cent Pfizer and 80 per cent AstraZeneca vaccines are rolled out until everyone over 50 has had been offered two doses. This takes around three more months. Finally, the vaccine is offered to remaining adults below the age of 50.
We do not explicitly consider waning immunity in this work. If vaccine-induced or infection-induced immunity wanes rapidly then people may need to be regularly revaccinated. [footnote 2] All modelling assumes some pre-existing immunity resulting from previous infection with SARS-COV-2. The assumed proportion immune are consistent with observed population proportions with antibodies.
Modelling in this paper assumes that Pfizer’s vaccine gives 90 per cent protection against disease, AstraZeneca’s gives 65 to 90 per cent in the over 50s (one group models this as age dependent and the other as two age-independent scenarios), and the vaccine used in the under 50s are 75% effective. The same effectiveness is assumed for effectiveness against both hospital admission and death. It is not yet clear from available data whether this is the case, and further sensitivity analysis could give insights into this.
A summary of modelling assumptions is given in Appendix 1, including more detail on the rollout timelines. Full model details are documented in the accompanying papers.
Extremely high vaccine coverage in the most vulnerable people is critical
The key insight from early modelling work is that it is critical to get extremely high vaccine coverage in the most vulnerable groups before non-pharmaceutical interventions (NPIs) are eased (or adherence to them drops) if we are to avoid a very high death toll.
This will be covered in more depth later in this document, but it is an intuitive conclusion given the large number of older people in the UK. There are an estimated 5.69 million people aged 75 or over. [footnote 3] While different groups within SPI-M-O use different estimates for the infection fatality rate by age, we can for example consider PHE and Cambridge’s estimate of 11.0 per cent for the more recent part of the epidemic. [footnote 4] If vaccine coverage in this age group were 75 per cent, and the vaccine has a 90 per cent efficacy against death, then 1.85 million of them would not have direct protection. [footnote 5] Even if a careful re-opening strategy and partial vaccine effectiveness against transmission means that only 20% of this group become infected, this would result in 40,700 deaths in this age group alone. [footnote 6] If we could increase coverage in the over-75s to 90 per cent, this reduces to 23,800. [footnote 7]
What happens if NPIs are partially removed, or behaviours change slightly, so that transmission returns to early September levels (R = 1.2 to 1.4) midway through rollout?
The first scenario that we consider is one where we keep R slightly below 1 until, at different points during vaccine rollout, the country returns to what would have been early September levels of transmission in the absence of vaccination (for example R approximately 1.2 to 1.4). This can be thought of as the result of restrictions being loosened slightly, behaviours changing, or a combination of both. This set of restrictions and behaviours is then maintained indefinitely. In reality, it is highly likely that measures would later be loosened further once deaths are low, so this scenario will not happen in its entirety, but we can draw important conclusions from modelling such a scenario.
If the vaccine has no effect on transmission, then once restrictions are lifted there would be another epidemic wave. Whilst it would be less severe than without vaccination, there would still be very many hospital admissions and deaths. Their number depends on how far rollout has progressed, the effectiveness of vaccines against disease and the level of prevalence when restrictions are eased. This is shown by the red lines in Figures 1 and 2. In each instance, we see an epidemic resurgence. The more people who have been vaccinated at the point when measures are released, and the lower that prevalence is at this time, the more deaths vaccines will prevent and the smaller the chance that hospitals will be overwhelmed.
The red lines in these figures demonstrate the importance of high coverage in older groups; the peak number of daily deaths remains high even if the epidemic is kept under control until 28 million people (56 million doses) have been given a vaccine, because in these scenarios 25 per cent of older people have no direct protection, and there is no indirect protection from vaccine-induced herd immunity.
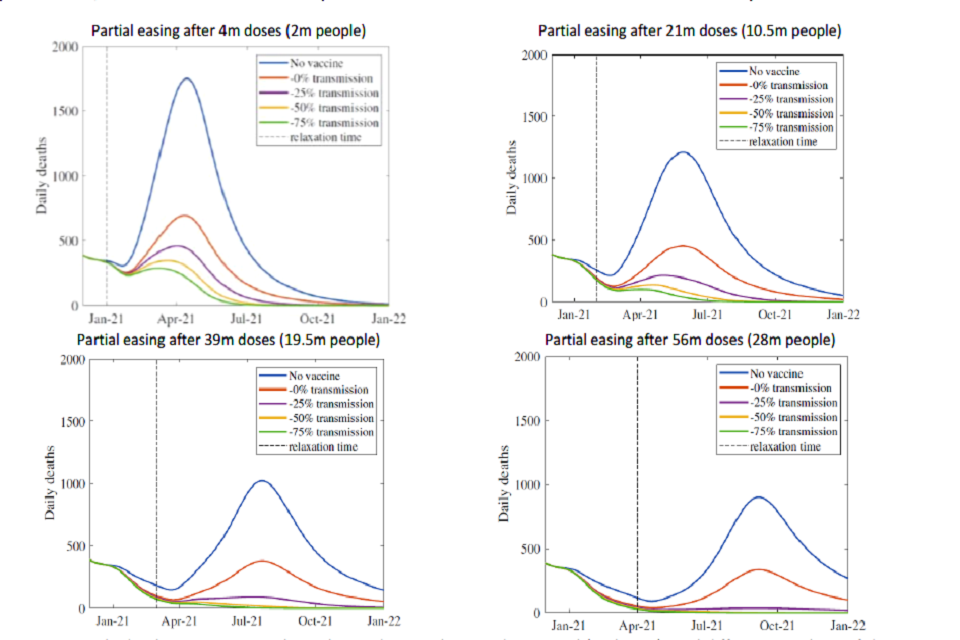
Four line charts showing the scale of resurgence in deaths is smaller the more people have been vaccinated when measures are eased, and the greater the impact that vaccines have against transmission.
Figure 1: Daily deaths in scenarios where the epidemic is kept under control (with R <1) until different numbers of doses have been administered, at which point NPIs are relaxed (or there are equivalent changes in behaviours) that return R to early September levels (approximately 1.3) and maintained at this level indefinitely with varying degrees of reduction in transmission. From Warwick model, other assumptions in Appendix 1. All dates solely indicative and dependent on rollout speed.
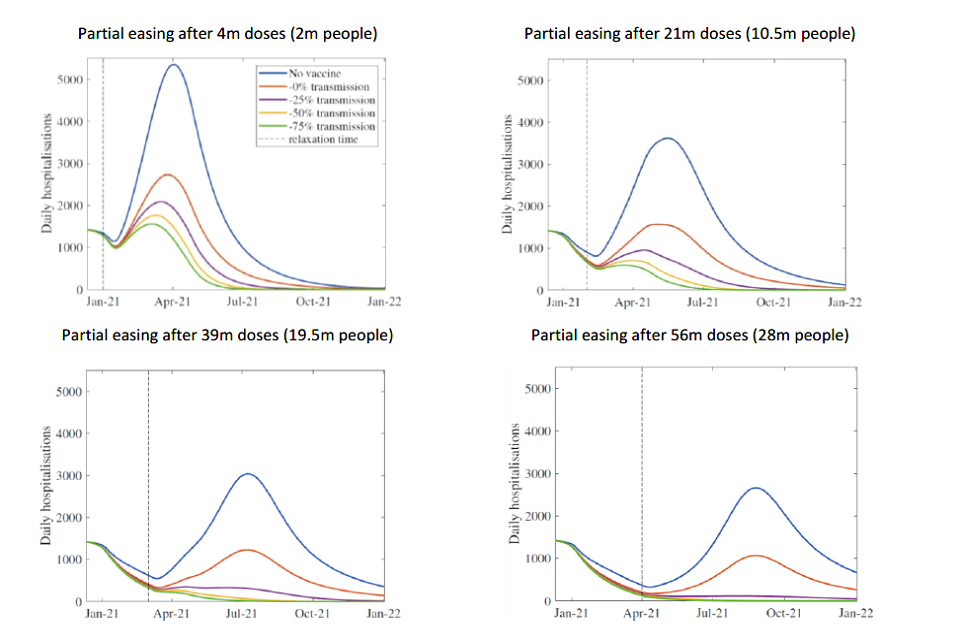
Four line charts showing the scale of resurgence in hospital admissions is smaller the more people have been vaccinated when measures are eased, and the greater the impact that vaccines have against transmission.
Figure 2: Daily hospital admissions in scenarios where the epidemic is kept under control (with R <1) until different numbers of doses have been administered, at which point NPIs are relaxed (or there are equivalent changes in behaviours) that return R to early September levels (approximately 1.3) and maintained at this level indefinitely, with varying degrees of reduction in transmission. From Warwick model, other assumptions in Appendix 1. All dates solely indicative and dependent on rollout speed.
If the vaccine significantly reduces transmission, then once a large number of people have been immunised there would be scope for partial relaxation of NPIs (or lower adherence to them), without another epidemic wave. To get a sense of scale of how many people this would need to be, a third of people would need to be immune to infection (whether from infection or vaccines) for a scenario with R = 1.5 to become one with R = 1. This is because when R = 1.5, ten infected people would transmit the virus to 15 other people. If one third of those 15 people were immune to infection, the first 10 people would transmit the virus to 10 others, meaning that the epidemic would remain the same size. For comparison, SAGE’s estimate of R in the UK from 1 October (reflecting transmission in the 2 to 3 weeks before this date) was 1.3 to 1.6.
The top left panels in Figures 1 and 2 show the risk of doing this too early. In these scenarios, there are too many susceptible people to prevent an epidemic resurgence. Because prevalence is already high at this point (approximately mid-October levels), it does not take much time before hospital admissions return to mid-November levels. Delaying such behavioural or policy changes until a large proportion of people have been immunised (39 million and 56 million in the bottom left and bottom right panels respectively) means an immediate further wave can be avoided. In each case, the peak levels of hospital admissions and deaths are significantly lower than those in the absence of vaccination.
The next conclusion of this work is therefore that the scope for partial relaxation of NPIs (or lower adherence) critically depends on the impact vaccines have on viral transmission. Scientists are unlikely to know what effect vaccines have on transmission for at least a couple of months after vaccine rollout. If decisions were made to slightly loosen restriction in the earliest months of rollout, this would happen with no one able to say whether or not to expect a resurgence in cases.
An alternative way of looking at the results of Figures 1 and 2 is given by Figure 3. This shows the total number of symptomatic cases (left) and deaths (right) in the same scenario where restrictions are relaxed to the equivalent of early September levels at different times during vaccine rollout. The span of each block corresponds to the uncertainty interval in the modelled number of cases and deaths with the Oxford/AstraZeneca vaccine providing 65 per cent to 90 per cent protection against disease. The different colours show different level of protection for all vaccines against transmission (as before, red = 0 per cent, purple = 25 per cent, yellow = 50 per cent and green = 75 per cent). The horizontal axis gives the date at which measures are relaxed.
This shows again that if the vaccines are effective against transmission, then the number of cases and deaths drops rapidly if we can keep R below 1 until most people have been offered a vaccine. If it is not effective against transmission, the number of deaths will remain high because there is a pool of unvaccinated vulnerable people who are neither protected directly nor by others around them being immune to infection and infectiousness.
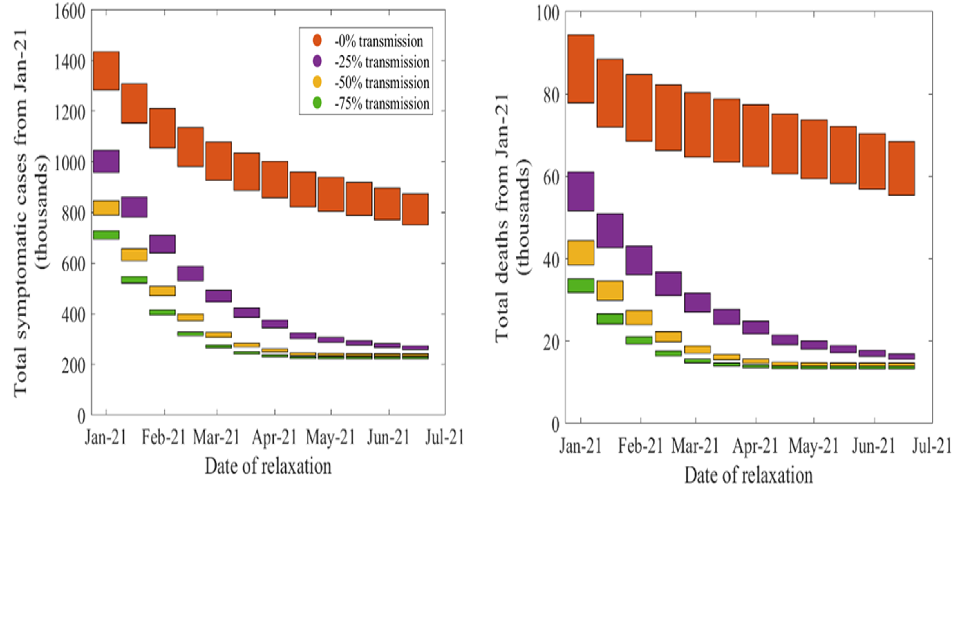
Bar chart showing the total number of symptomatic cases and deaths reduces the later that NPIs are relaxed and the greater the impact that vaccines have on transmission. Delaying relaxation has more impact if vaccines are effective against transmission.
Figure 3: Total number of symptomatic cases (left) and deaths (right) for different impact of vaccine on transmission (red = 0 per cent, purple = 25 per cent, yellow = 50 per cent and green = 75 per cent) and relaxation dates (columns), if the epidemic is kept under control until a given time at which point NPIs are relaxed (or there are equivalent changes in behaviours) that return R to early September levels (approximately 1.3) and maintained at this level indefinitely. The height of each block spans possible levels of protection against disease provided by the Oxford vaccine, between 65 per cent and 90 per cent. Results from the Warwick model. All dates solely indicative and dependent on rollout speed.
An independent set of modelling results from Imperial College London provides further evidence for this. Table 1 shows results for equivalent scenarios where vaccines are as efficacious against transmission as they are against disease. With vaccine coverage of 75 per cent in those over 50s who do not live or work in care homes, sustaining early September-like restrictions and behaviours with these assumptions corresponds to tens of thousands of deaths, but the longer that R is maintained below 1, the fewer the number of deaths.
| Scenario | Number of doses administered when measures lifted (people vaccinated): 5 million (2.5m) | Number of doses administered when measures lifted (people vaccinated): 22 million (11m) | Number of doses administered when measures lifted (people vaccinated): 38 million (19m) | Number of doses administered when measures lifted (people vaccinated): 55 million (27.5m) |
|---|---|---|---|---|
| AZ efficacy 65%, 95% care home coverage, 75% coverage in 50+, 50% coverage in < 50s, R = 1.4 post lockdown | 57,400 (32,200 – 84,600) | 43,000 (25,800 - 61,000) | 33,900 (21,600 – 46,200) | 27,100 (19,300 – 35,100) |
| AZ efficacy 90%, 95% care home coverage, 75% coverage in 50+, 75% coverage in < 50s, R = 1.2 post lockdown | 44,500 (26,500 – 63,600) | 32,400 (20,700 – 45,100) | 25,600 (18,100 – 32,400) | 21,600 (17,100 - 26,800) |
Table 1: Deaths between 1st December 2020 and 1st September 2021 in the Imperial model when partially lifting NPIs (or there are equivalent changes in behaviours) when a given number of doses have been administered that return R to early September levels (~1.3) and maintaining them at this level indefinitely, for vaccines which are as effective against transmission as disease. Values in brackets are 95% credible intervals.
As mentioned above, all these simulations assume that the September levels of restrictions are maintained indefinitely, even once deaths return to a low level. It is highly unlikely that this would happen in practice, so if restrictions were later lifted further the total death toll in such scenarios is likely to be higher than estimated here. If restrictions are gradually lifted before vaccines have sufficiently reduced transmission, then we could see a long plateau with a sustained high death toll. The number of additional deaths would depend on both the extent of the easing and policy and behavioural responses following that resurgence.
When do we reach herd immunity?
Herd immunity means that enough people are unable to transmit the virus that R is below 1 in the absence of any restrictions, with everyone behaving as they did before the pandemic. If vaccines do not provide sufficient protection against transmission, they cannot generate herd immunity.
Approximately speaking, achieving herd immunity against a virus with basic reproduction number R0 requires all but 1/R0 of the population to be solidly immune to infection. If SARS-COV-2 has a basic reproduction number of about 2.7-3.0, around 60-70% of the population need to have been immunised (and unable to transmit the virus) by either a vaccine or natural infection. Although reality is more complex [footnote 8], this shows that to reach herd immunity from the first round of vaccination take up needs to be very high amongst the 79% of the population who are over 18 [footnote 9] and for the vaccines to be highly efficacious against transmission. To maintain herd immunity, we need vaccine-induced immunity to be long-lasting or for re-vaccination have a high take up rate.
Suppose that strict measures (keeping R below 1) were kept in place until the vaccine had been offered to all adults, at which point all restrictions were lifted entirely and we returned to pre-pandemic behaviours. There would be another epidemic wave unless vaccine coverage had been very high, and it was highly efficacious against transmission. If 75% coverage amongst adults were achieved using a vaccine that was highly effective against transmission, reducing it by an average of 75%, then the total reduction in transmission caused by vaccination would be 0.75 multiplied by 0.75 multiplied by 0.79 = 44%.
Whilst undoubtedly highly beneficial, whether this could prevent further epidemic waves is unclear. Both Imperial College London and Warwick University have modelled a scenario with 75% coverage and 75% reduction in transmission. The former shows a substantial resurgence and the latter a very small one.
Despite this difference, there is consensus that unless vaccines are highly effective against transmission, even coverage of 75% would not be sufficient to avoid further epidemic waves following a post- vaccination return to pre-COVID life. Such a resurgence has the potential to require re-imposed restrictions to prevent the NHS from being overwhelmed.
The fact that it may be very difficult to achieve herd immunity through a combination of vaccines and natural immunity from the 2020 waves of infection does not mean that vaccines cannot provide us with an exit strategy. If we can achieve very high vaccine coverage, particularly in the most vulnerable groups, we would be able to gradually reduce the number of restrictions in place in such a way that the subsequent resurgence in hospitalisations would be considerably smaller than the peaks seen in 2020 and therefore not threaten the NHS.
Appendix 1: Summary of modelling assumptions
Full details are given in the accompanying papers.
| Warwick modelling assumption | Imperial modelling assumption | |
|---|---|---|
| Vaccine efficacy against disease | Pfizer 90%. AstraZeneca age dependent for between 65% and 90%. Vaccine used for <50s 75%. Stepped efficacy over time: From 1st dose to day 7, zero efficacy; from day 7 to day 35, 50% of final efficacy; final efficacy reached from day 35 onwards |
Pfizer 90%. AstraZeneca 65% (pessimistic scenario) and 90% optimistic scenario). Vaccine used for <50s 75%. Stepped efficacy over time: From 1st dose to day 10, zero efficacy; from day 10 to day 31, 65% of final efficacy; final efficacy reached from day 31 onwards |
| Vaccine efficacy against death | Same as against disease. It is not yet clear whether that is the case. | Same as against disease. It is not yet clear whether that is the case. |
| Vaccine efficacy against transmission | Scenarios of 0%, 25%, 50% and 75% considered | Either 0%, or the same as protection against disease. Imperial also modelling a scenario where a vaccine reduces the severity of disease. That is not presented in this summary paper. |
| Rollout timeline | 1. 2m people (4m doses) of Pfizer vaccine in December. 2. 20% Pfizer and 80% Oxford vaccine until everyone over 50 has had been offered 2 doses by the end of March. 3. 2.5 more months for vaccine with 75% efficacy to be rolled out to under 50s by end of June. |
1. 2m people (4m doses) of Pfizer vaccine to care home residents in December. 2. 20% Pfizer and 80% Oxford vaccine until everyone over 50 has had been offered 2 doses by early March. 3. This speed maintained until all under 50s have been offered a vaccine. |
| Coverage | 95% in care home residents 75% elsewhere | 95% in care home workers and residents. 75% in other over 50s. 50% (pessimistic scenario) and 75% (optimistic scenario) in the under 50s. |
| Epidemiological scenario between lockdown ending and relaxation of measures | R kept below 1, so the epidemic shrinks until measures are relaxed. | Pessimistic and central scenarios of R (excluding the effect of immunity) = 1.4. Optimistic = 1.2. |
Appendix 2: PHIA framework of language for discussing probabilities

0 to 5% remote chance.
10% to 20% highly unlikely.
25% to 35% unlikely.
40% to 50% realistic possibility.
55% to 75% likely or probably.
85% to 90% highly likely.
95% to 100% almost certain.
-
Priority groups for coronavirus (COVID-19) vaccination: advice from the JCVI, 2 December 2020 ↩
-
If infections after immunity has waned are mild, then repeated vaccinations might not be necessary ↩
-
This calculation is based on (1-0.75*0.9) multiplied by 5.69m = 1.85m ↩
-
This calculation is based on (1.85m multiplied by 0.2 multiplied by 0.11) = 40,700 ↩
-
This calculation is based on (1-0.9 multiplied by 0.9) multiplied by 5.69m = 1.08m; (1.08m multiplied by 0.2 multiplied by 0.11) = 23,800 ↩
-
There are several reasons for this. When immunity is achieved by natural infection, the herd immunity threshold is lower, as people who have the greatest role in transmission are often infected first and therefore are more likely to be immune. We do not know which age groups have the greatest role in transmission, but if it is younger people then starting vaccination with older people means it would take longer to have a significant effect on transmission than starting with younger people. If people who have a higher risk of transmitting the virus are also less likely to come forward for vaccination, or if propensity to be vaccinated is correlated within households then the herd immunity threshold would be higher. Finally, people are more likely to mix with others of similar ages and are from the same communities (both geographical and cultural). True herd immunity means that all communities are protected from a resurgence. The chains of transmission that lead to infection in vulnerable groups are the most critical to interrupt. ↩
-
ONS 2019 mid-year population estimates. Footnote added for release: this should read 18 and over. ↩