SPI-M-O: Consensus view: 13 April review of social distancing measures, 1 April 2020
Updated 13 May 2022

© Crown copyright 2022
This publication is licensed under the terms of the Open Government Licence v3.0 except where otherwise stated. To view this licence, visit nationalarchives.gov.uk/doc/open-government-licence/version/3 or write to the Information Policy Team, The National Archives, Kew, London TW9 4DU, or email: psi@nationalarchives.gov.uk.
Where we have identified any third party copyright information you will need to obtain permission from the copyright holders concerned.
This publication is available at https://www.gov.uk/government/publications/spi-m-o-consensus-view-13-april-review-of-social-distancing-measures-1-april-2020/spi-m-o-consensus-view-13-april-review-of-social-distancing-measures-1-april-2020
1. This document gives SPI-M’s consensus view on changes to social distancing measures. It summarises what we know about the impact of the interventions to date, the likely impact of them being lifted immediately or sustained for a longer period, an assessment of the likely result if further changes to social distancing alter the rate of transmission, and an assessment of which measures are expected to have had the greatest impact to date.
2. It is not possible to robustly model the health impact of potential future changes to the social distancing measures at this stage because:
- the results of the recent measures brought in on 23 March are not yet reflected in epidemiological data, so their impact be directly assessed at this time;
- we still do not know what proportion of the population has been infected, nor do we know the role of children in transmission; these, and other unknowns, are fundamental scientific uncertainties;
- measures have been introduced simultaneously or in quick succession, so their individual effects cannot be disentangled; self-imposed population behaviours may also complicate the picture.
What can be said about the impact of interventions to date?
3. It is almost certain that the interventions put into place will have reduced the rate at which the virus is transmitted. Although the rate of increase in hospital admissions has started to slow slightly, it is too early to be able to draw conclusions from epidemiological data as there is a 2 to 3 weeks lag before these policy changes enacted on 23 March will be fully reflected in ICU admissions, and a further week before they are seen in deaths. The proportion of infections confirmed by swabbing is small and changing over time, which makes confirmed cases a less reliable indicator of the overall trend.
4. We anticipate that it will be possible to start drawing robust conclusions from epidemiological data on the current measures from mid-April, but with more precision in the following 2 weeks.
5. Data from sources including ONS and DfT have shown that there have been very substantial changes in measured behaviours. This, and the analysis of epidemics in other countries, mean that SPI-M is confident that there will have been a large drop in the reproduction number, R. While this data gives useful insights into societal changes, it is more difficult to infer how these affect contact patterns and virus transmission without calibration against epidemiological data, which is lagged by a few weeks. Initial studies of the link between movement data and transmission in China suggest they are very strongly correlated initially, however the amplitude of the drop in R is very likely to be country specific. In addition, one of the largest sources of infections is contacts within the home, where any changes in contacts are not captured by available data.
6. An alternative way of estimating how the policies have impacted transmission is to look at surveys of contact patterns, which can then be compared to previous contact patterns to allow direct modelling of changes in behaviour immediately relevant to transmission. This has led to an early estimate of how the measures implemented on 23 March have affected the reproduction number, with a central estimate of R now being 0.6, however with a very wide confidence interval, 0.3-0.9. This survey, however, has limitations, such as not including under 18s, not capturing contact changes within households, it started after the interventions were implemented, and is based on a relatively small sample size although this will increase with the addition of a second cohort.
7. Given the lag between changes in transmission and the impact on hospitalisations and deaths, it is still not yet clear whether R is substantially below 1. As a result, SPI-M’s consensus is that, although it is realistic possibility that R may currently be around 0.6, it could also be much closer to 1. We cannot rule out R being greater than 1.
8. To provide modelling advice on the impact of changing behavioural and societal interventions, we will need to wait until mid-April to understand what the current R value is.
- If hospital admissions are still rising at that time, R is likely to currently be greater than one. Relaxation of measures would result in continued exponential growth of infections, but with a shortened doubling time.
- If hospital admissions have plateaued, this suggests that R has reduced but remains around one, and any relaxation of measures that increased contact rates would result in a return to exponential growth.
- If hospital admissions are falling, this would suggest measures implemented on 23 March have slowed disease transmission and likely brought R below one. It is only under this scenario that any relaxation of social distancing measures might not lead to increased spread of the virus.
What can be said about the impact of maintaining these interventions for the long term?
9. The impact of the current interventions will depend on how far they have reduced the reproduction number and how long they are maintained. The longer interventions that reduce the reproduction number below one are in place, the lower the incidence of infections there will be.
- If R is currently above one, we will see continue to see exponential growth, but with a longer doubling time than previously.
- If R is just below 1 then we would be in a situation near to the agreed reasonable worst case planning scenario, under which there would be expected to still be over 1,000 deaths per week by the start of September.
- If R is around 0.6, then we would be in a situation near to the agreed optimistic planning scenario, in which there are under 500 deaths per week by the end of April.
- If R is between 0.6 and 1 then the number of deaths would drop at a rate somewhere between these two.
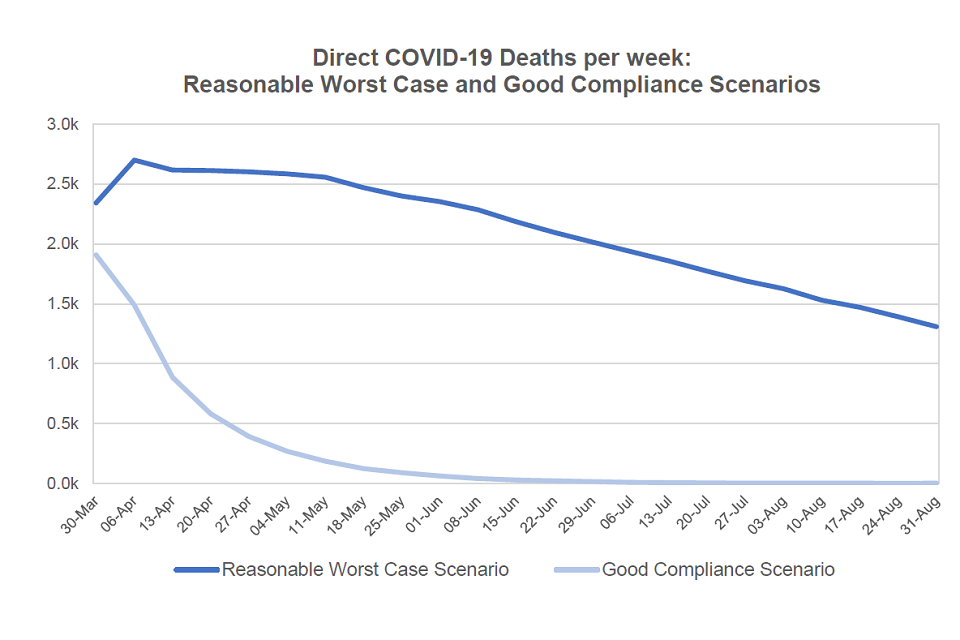
Line chart showing weekly deaths over 2,500 in April to mid-May in the reasonable worst-case scenario, falling to between 1,000-1,500 by the end of August. Under “good compliance”, weekly deaths fall from 2,000 in March to below 500 by the end of April.
Figure 1: Comparison of direct COVID-19 deaths per week, under modelled reasonable worst case and good compliance scenarios.
What can be said about relaxing some of the social distancing measures in the short term?
10. There is good evidence that the key restrictions that substantially reduce R are restricting school and work contacts, though the relative importance of schools is very sensitive to assumptions about susceptibility and infectivity of children. These social settings, combined with household contacts, are the largest contributors to R.
11. If the measures put into place have reduced transmission such that R is slightly below one, then any relaxation would be expected to result in a return to exponential growth, but from a starting point of high death rates.
12. If measures put into place have reduced transmission to the extent that R has been reduced to around 0.6 then:
- Relaxing rules of the use of outdoor spaces, including working outdoors, is highly unlikely to make a significant direct difference to infection rates, as long as social distancing continues to be followed in this environment.
- There is limited evidence on the effect of closing of non-essential retail, libraries, bars, restaurants, etc., but it is likely that R would return to above 1 and a subsequent exponential growth in cases.
- Whilst lifting the policy of shielding the vulnerable would have a relatively modest impact on the incidence of infection, it would lead to a sharp increase in hospitalisation, ICU admissions, and the death rates within this age group.
- Lifting any of the other measures in place, including school closures are almost certain to return R to above 1.
13. Members of SPI-B who have been present in SPI-M working groups have advised that relaxing one measure may allow for longer term adherence to other measures, and that, if measures were lifted one by one, greater adherence would be likely.
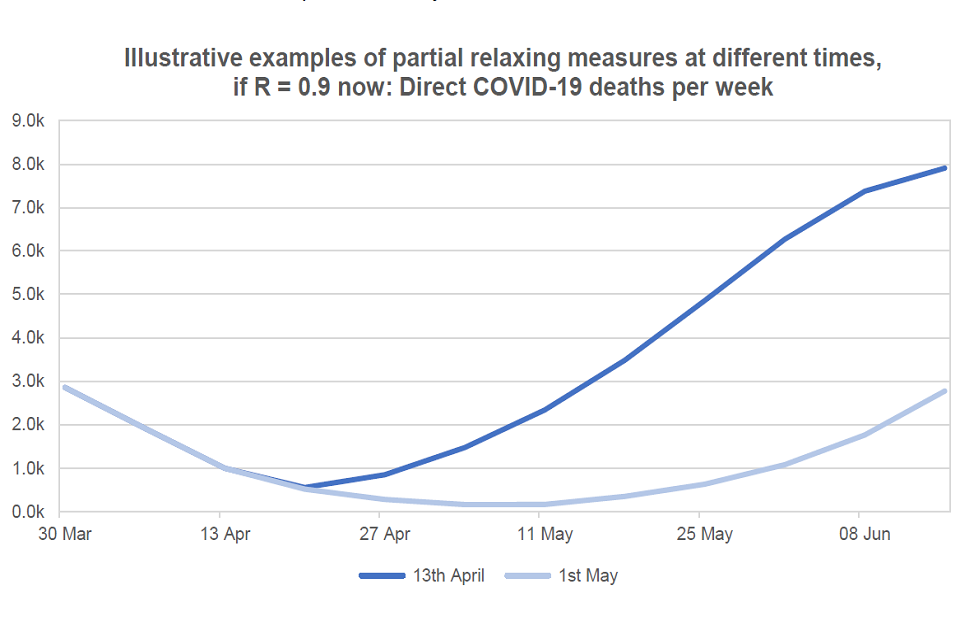
Line chart showing the illustrative impact of relaxing measures on weekly deaths. When measures are eased on 13 April, deaths exceed 30 March levels by mid-May and continue to rise. If eased on 1 May, the rise in deaths is lower and more gradual.
Figure 2: Illustrative example of direct COVID-19 deaths per week with a moderate lifting of the measures at either 13 April or 1 May 2020.
What can be said about the potential further measures?
14. Reducing exercise or restricting shopping for essentials are highly unlikely to significantly decrease transmission rates.
15. Increasing adherence with movement restrictions, through any means, is likely to further reduce the transmission between households, and therefore reduce transmission.
16. Of the measures listed for consideration, reducing non-home working is very likely to have the largest effect.
17. It would take around 2 to 3 weeks after implementation for SPI-M to estimate how these measures will have changed contact patterns and therefore predict the effects on transmission. If the current measures are changed on 13 April and these new interventions imposed for 4 weeks, then there would be enough time to see their effect clearly before making the next decision.
What is needed to assess this more accurately at future decision points?
18. We will have greater, but still imperfect, clarity on the epidemiological impact of these interventions in 3 to 4 weeks’ time, using existing health data streams from NHSE and others, and data available from, for example, DfT, DfE, ONS.
19. However, other scientific information is critical for greater accuracy to be possible.
- The proportion of infections that are asymptomatic. Without large-scale population level serology surveys, it is impossible to improve current estimates of the proportion of the UK who have been infected, and there that are immune. This is urgently required as it is a key source of uncertainty for current modelling.
- Information on the role of children in transmission. This is poorly understood but critical given their centrality in transmitting other respiratory infections, but low levels disease. This is also essential for assessing the impact of school closures on reducing transmission in the wider population.
- Evidence on the likelihood of transmission outdoors. This is very important when considering restrictions on outdoor activities.
Annex: SAGE framework of language for discussing probabilities

0 to 5% remote chance.
10% to 20% highly unlikely.
25% to 35% unlikely.
40% to 50% realistic possibility.
55% to 75% likely or probably.
80% to 90% highly likely.
95% to 100% almost certain.