SPI-M-O: Consensus statement on COVID-19, 19 January 2022
Updated 13 May 2022

© Crown copyright 2022
This publication is licensed under the terms of the Open Government Licence v3.0 except where otherwise stated. To view this licence, visit nationalarchives.gov.uk/doc/open-government-licence/version/3 or write to the Information Policy Team, The National Archives, Kew, London TW9 4DU, or email: psi@nationalarchives.gov.uk.
Where we have identified any third party copyright information you will need to obtain permission from the copyright holders concerned.
This publication is available at https://www.gov.uk/government/publications/spi-m-o-consensus-statement-on-covid-19-19-january-2022/spi-m-o-consensus-statement-on-covid-19-19-january-2022
All probability statements are in line with the framework given in Annex.
Situation update
1. There is clear evidence that incidence has been dropping across the UK. Both testing data and ONS’s COVID-19 Infection Survey show that the exception to this is amongst primary school children, where cases have been increasing since the start of 2022. This age group is the most likely to be susceptible to infection as they have not been offered vaccines and omicron had not spread widely amongst them prior to the school Christmas holidays.
Removal of Plan B measures
2. Plan B measures will be lifted in England from 27 January. SPI-M-O has previously advised that omicron’s growth rate advantage over delta abruptly dropped in the middle of December 2021 [footnote 1]. The extent to which the reproduction number, R, reduced during this period is dependent on the generation time of omicron. [footnote 2] New analysis from the London School of Hygiene and Tropical Medicine (LSHTM) estimates that between 12 and 18 December, R decreased between 20% and 50%. It is not possible to determine how much of this was the result of Plan B measures, how much was due to spontaneous behaviour change following the rapid rise of omicron, and how much was for other reasons (such as omicron moving from younger adults, who tend to have the most contacts and therefore are intrinsically likely to have a higher growth rate, to the rest of the population).
3. It is highly unlikely that the removal of Plan B will result in a precise reversal of the decreased growth seen in mid-December and, when measures have been lifted in the past, behaviour change has been gradual. There is now substantially more immunity in the population than there was in early December due to infection and vaccination.
4. Nevertheless, SPI-M-O cannot rule out a return to epidemic growth following the removal of Plan B, particularly if levels of precautionary behaviour (including testing) decrease as a result of reduced perception of risk. It is almost certain that the generation time of omicron is lower than that of delta. This means that, if the reproduction number increases above 1, the epidemic will grow more quickly than were delta still dominant.
5. To consider the effect that different growth rates could have following the lifting of Plan B measures in England, SPI-M-O has produced further medium-term scenarios. These are not forecasts or predictions, but are extrapolations of plausible growth rates, in a statistical combination of 3 (for occupancy) or 4 (for admissions) different models.
6. Figure 1 shows these scenarios for hospital admissions (top) and hospital occupancy (bottom), assuming the epidemic grows at its current rate for a further week, until 26 January when R changes to 0.7 (purple), 0.9 (green), 1.1 (blue), or 1.3 (yellow) and is then sustained at these levels (other than growth rates shrinking as the number of susceptible people drops) for a further 7 weeks. SPI-M-O cannot rule out growth rates that are higher or lower than those shown here.
Figure 1: Projected COVID-19 hospital admissions (top) and occupancy (bottom) in England, if the reproduction number, R, were to maintain its current levels until 26 January, before changing to 0.7 (purple), 0.9 (green), 1.1 (blue), or 1.3 (yellow) and being sustained at these levels (other than growth rates shrinking as the number of susceptible people drops) for the subsequent seven weeks. Coloured areas are the interquartile ranges of the model combinations.
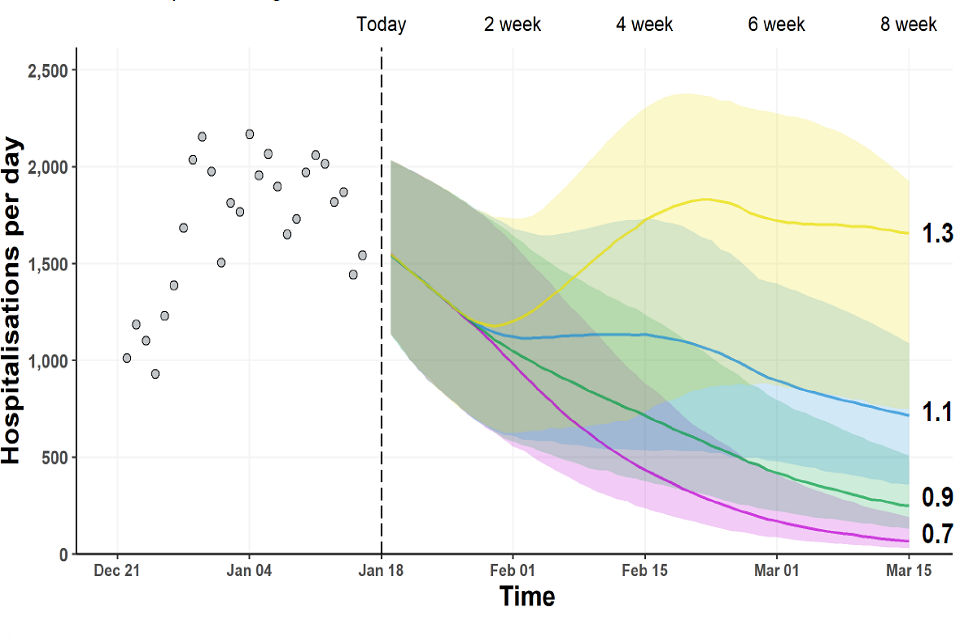
Fan chart showing admissions initially fall across all scenarios. This continues when R<1, but increases above current levels when R=1.3. When R=1.1, admissions plateau before further falling. Interquartile ranges overlap for neighbouring scenarios.
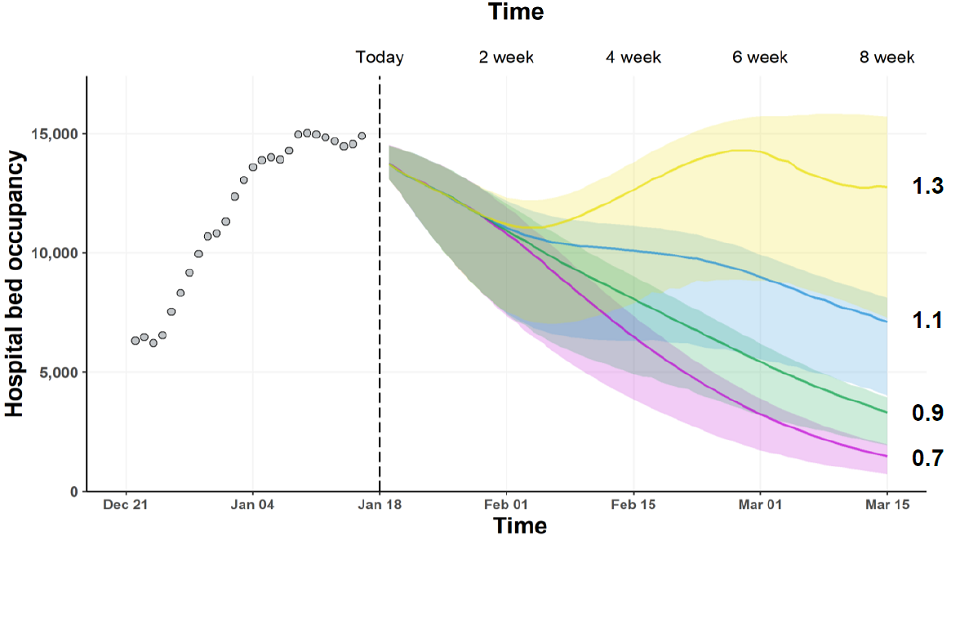
Fan chart showing falling occupancy in scenarios where R=0.7, 0.9 or 1.1, though with a period of plateau when R=1.1. In the scenario where R=1.3, occupancy rapidly rises after the change point before falling slightly in March.
7. The current very high prevalence means that, even if the epidemic were to suddenly return to moderate levels of growth, the number of hospital admissions is expected to rapidly peak at levels similar to those seen over the festive period. While this is well below the level of peak hospital admissions seen in January 2021, a sustained period of high levels of hospitalisations would have detrimental consequences for the NHS.
8. SPI-M-O considers the following to be the key factors that would result in higher numbers of hospital admissions.
- Waning immunity: if the hospitalisation risk per infection increases only a few percentage points, the numbers of individuals requiring hospital treatment could increase considerably.
- A reduction in the rate of testing, which is highly likely to be considerably reducing transmission: the extent to which the current rise in cases in primary school children will feed into other ages will depend, in part, on the uptake of testing amongst them and their families.
- The emergence of a novel variant, which is more severe and / or evades immunity better.
9. The ONS’s COVID-19 Infection Survey is critical for understanding the epidemic and will become even more so as testing policy and behaviours change.
Annex: PHIA framework of language for discussing probabilities

0 to 5% remote chance.
10% to 20% highly unlikely.
25% to 35% unlikely.
40% to 50% realistic possibility.
55% to 75% likely or probably.
85% to 90% highly likely.
95% to 100% almost certain.
-
SPI-M-O Consensus statement on COVID-19, 6 January 2022. ↩
-
The generation time is the average time between someone becoming infected and that person infecting others. More information on generation times and serial intervals is available from Plus magazine. ↩