Social enterprise: market trends 2021
Updated 19 November 2025

© Crown copyright 2025
This publication is licensed under the terms of the Open Government Licence v3.0 except where otherwise stated. To view this licence, visit nationalarchives.gov.uk/doc/open-government-licence/version/3 or write to the Information Policy Team, The National Archives, Kew, London TW9 4DU, or email: psi@nationalarchives.gov.uk.
Where we have identified any third party copyright information you will need to obtain permission from the copyright holders concerned.
This publication is available at https://www.gov.uk/government/publications/social-enterprise-market-trends-2021/social-enterprise-market-trends-2021
1. Executive Summary
This report has been produced by the Department for Culture, Media and Sport (DCMS) which coordinates government policy on social enterprises. The report examines the scale and size of the sector taking a broad definition of social enterprises, as set out in Chapter 2. Following this, the report turns to focus on the number of social enterprises in the UK compared to the small business population, in Chapter 3. It then compares the characteristics of social enterprises to those of Small and Medium-sized Enterprises (SMEs) which are defined in this report as enterprises within the small business population which are neither traditional non profits nor social enterprises (Chapter 4). Finally, in Chapter 5, the report looks at social enterprises’ business performance compared to SMEs.
Data for this report is drawn from the 2021 Longitudinal Small Business survey previously led by the Department for Business, Energy and Industrial Strategy (BEIS), now the Department for Business and Trade (DBT).
Number of Social Enterprises (Chapter 3)
- 6.6% of the UK small business population are social enterprises according to the DCMS definition of the term. The estimated number of social enterprises is approximately 364,000.
- Social enterprise employers make up 7.4% of the UK small business employer population, which is estimated to be approximately 104,000 employers. Compared to 2019, there was a significant decrease in the proportion of social enterprise employers in 2021.
Profiles of social enterprises (Chapter 4)
When compared to SME employers, social enterprise employers are more likely to:
- Be ‘small’ businesses, and less likely to be ‘micro’ businesses,
- Have been operating for more than 10 years compared to SMEs,
- Be operating in ‘Health and social work’, ‘Other services’ [footnote 1] or ‘Arts and Entertainment’ sectors,
- Be located in the South East or South West in England,
- Be women-led.
Business performance and support (Chapter 5)
It is estimated that the number of people employed by social enterprises is approximately 1,223,000.
In terms of business performance, when compared to SME employers, social enterprise employers are more likely to:
- Expect financial growth in the next 12 months.
- Expect growth in the number of employees they have in the next 12 months.
- Report ‘Coronavirus (COVID-19) pandemic’ [footnote 2], ‘National Living Wage’ and ‘obtaining finance’ as obstacles to success.
- Seek external advice or information to help them grow their businesses. The top reasons to seek advice or information were ‘financial advice accounting for general running of business’, ‘business growth’, ‘legal issues’, ‘improving business efficiency/productivity’.
2. Introduction
2.1 Background
The analysis in this report has been drawn from the Longitudinal Small Business Survey (LSBS) which was established in 2015 by the Department for Business and Trade (DBT (formally known as Department for Business, Energy and Industrial Strategy (BEIS)) as an annual panel survey of UK businesses with less than 250 employees. It is designed to broadly represent what is commonly referred to as the UK Small and Medium-sized Enterprise (SME) population [footnote 3].
Questions included in the 2017, 2019 and 2021 LSBS enabled the identification of social enterprises within the sample. For the 2017 and 2019 survey, this analysis was commissioned and published by the Department for Culture, Media and Sport (DCMS) [footnote 4] [footnote 5]. For the 2021 survey, the analysis was undertaken by DCMS in-house.
The 2021 report applies the same approach to identifying social enterprises in the LSBS as used in the 2017 and 2019 reports, employing a decision tree logic model to identify social enterprises through a set of questions to distinguish between organisational categories. This is discussed in further detail in section 2.3. Comparison of this report’s findings with the 2017 report are not possible as the 2017 report used a smaller sample of enterprises and did not use the LSBS data.
The 2021 report presents data on characteristics of social enterprises employers in percentage terms, with 95% confidence intervals used to classify whether differences from the wider SME employers - which for these purposes are defined as the combination of traditional and socially oriented SMEs - are statistically significant. It uses the Business Population Estimates 2021 only to estimate the number of social enterprises (total, employer and non-employer).
The total sample size for this year’s (2021) LSBS was 9,325. There were 7 responses where it was not possible to determine whether or not the respondent was a social enterprise. There were an additional 17 responses that were excluded as having more than 249 employees. This brings effective unweighted sample size for this report and the total number of analysed responses to 9,301, which was used in the calculations.
Throughout the following chapters, the bold numbers in the figures and tables indicate differences between SME employers and social enterprise employers that are statistically significant at the 95% level. Statistical significance indicates that the difference between two variables is unlikely to be due to chance. Throughout the publication, reported figures focus on statistically significant differences between groups, meaning we are more confident that these differences from our survey are likely to reflect the entire population. Non-significant differences may be reported on, but these will always be disclosed throughout the report.
2.2 Objectives of this report
The 2021 Social Enterprise: Market Trends report has two objectives:
-
Provide percentage estimates of the number of DCMS defined social enterprises in the UK small business population.
-
Describe the key characteristics of social enterprises and compare them to that of SMEs.
2.3 Decision Tree Methodology
This report follows the analytical framework adopted by the 2017 and 2019 Market Trends reports by applying a decision tree logic model to identify social enterprises (figure 2.3).
The decision tree is based on a set of questions related to the following enterprise characteristics:
- Legal form and charitable status: identifies organisations that have a social purpose and/or restrictions on profit/asset distributions.
- Income from trading: identifies organisations that earn at least 50% of income from trading or commercial activities.
- Organisational goals: identifies organisations that have social and environmental goals of greater or equal concern to financial goals.
- Use of profit/surplus: identifies organisations that have rules/restrictions to use at least 50% of their surplus or profit to further social and environmental goals.
Using the decision tree, organisations can be filtered into the following categories based on their answers to the above questions:
-
Social enterprises: Organisations which have a social mission, receive at least half their annual income from trading and reinvest at least half of their annual surplus/profit into their social mission. This is the DCMS definition of social enterprises, and these are the social enterprises that the report focuses on.
-
Traditional non-profit organisations: Organisations which receive less than half of their annual income from trading, such as charities.
-
Social Oriented Enterprises: Organisations that have a social mission but reinvest less than half of their surplus/profit into their social mission.
-
Commercial SMEs: Enterprises that do not have an explicit social mission.
Figure 2.3: Decision tree to identify social enterprises
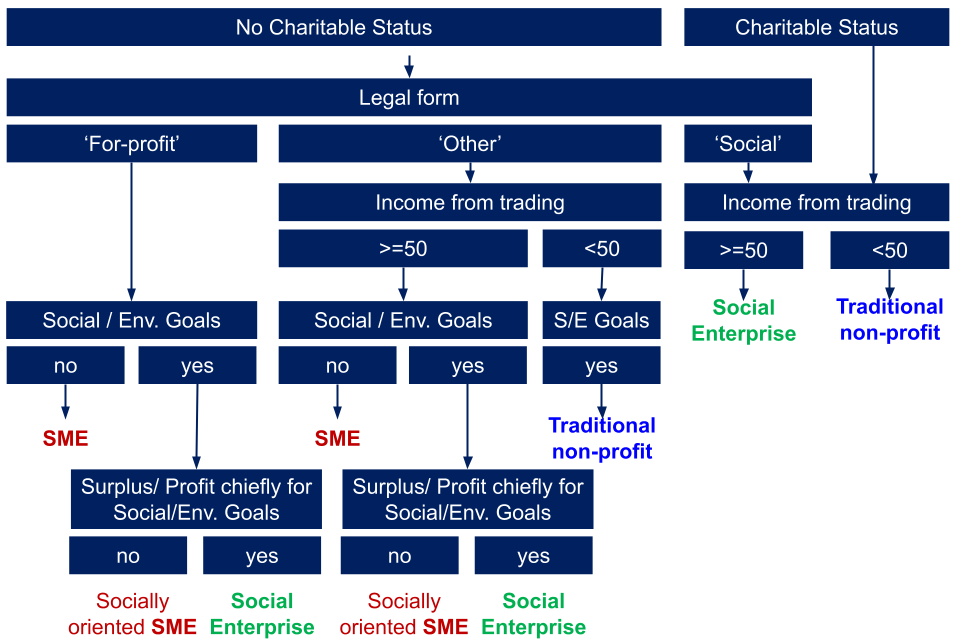
1. Env = Environmental and S/E = social or environmental
2. Chiefly = at least half
The picture above visually presents the logic of how social enterprises are determined and concludes that social enterprises are organisations which have a social mission, receive at least half their annual income from trading and reinvest at least half of their annual surplus/profit into their social mission.
This means the definition used for social enterprises is relatively broad compared to other definitions. For example, Social Enterprise UK (SEUK) has used their own definition and sample of social enterprises. Their definition:
consisted of SEUK members and databases, and members of related social enterprise networks and organisations, specifically, Co-operatives UK and UnLtd. [footnote 6].
3. Number of Social Enterprises
This chapter provides estimates of the proportion and number of social enterprises based on the LSBS data.
3.1 Proportion of social enterprises
Based on the decision tree (shown in figure 2.3), Figure 3.1 provides a breakdown of the classification of all types of organisations.
Using the DCMS definition, social enterprises make up 6.6% of the UK small business population: using the Business Population Estimates 2021, this means there are an estimated 364,000 [footnote 7] (336,000 - 392,000 [footnote 8]) number of social enterprises. Furthermore, 90.2% of the UK small business population conform to the definition of an SME, of which 73.5% are traditional SMEs and 16.7% are socially-oriented SMEs, and 3.3% of organisations are traditional non-profit enterprises.
Figure 3.1: Percentage of different organisation types, total
| Type of organisation | Percentage (%) |
|---|---|
| Traditional SMEs | 73.5 |
| Socially oriented SMEs | 16.7 |
| Social enterprises | 6.6 |
| Traditional non-profit | 3.3 |
1. The unweighted baseline is N = 9,301 for the small business population. 7 cases were marked as ‘unclassified’ due to missing data.
2. Percentages are rounded so may not add up to 100%.
3. Based on classification of sample according to decision tree, weighted to be representative of UK small business population.
Social enterprises make up 7.4% of organisations with employees (employers) and 6.3% of organisations without employees (non-employers). Using the Business Population Estimates 2021, it is estimated that the number of social enterprise employers is approximately 104,000 (97,000 - 112,000), and approximately 260,000 (240,000 - 280, 000) of them are non-employers [footnote 9]. Compared to 2019, there was a significant decrease in the proportion of social enterprise employers in 2021. Comparison between ‘non-employers’ was not possible as the 2019 report did not report on self-employed and ‘non-employers’.
Figure 3.2: Percentage of different organisation types, employers vs non-employers
| Type of organisation | Employees (%) | No employees (%) |
|---|---|---|
| Traditional SMEs | 70.8 | 74.3 |
| Socially oriented SMEs | 17.5 | 16.5 |
| Social enterprises | 7.4 | 6.3 |
| Traditional non-profit | 4.3 | 2.9 |
1. The unweighted baseline is N = 1,789 for non-employers in the small business population. 7 cases were marked as ‘unclassified’ due to missing data.
2. Percentages are rounded so may not add up to 100%.
3. Based on classification of sample according to decision tree, weighted to be representative of UK small business population.
4. Profiles of Social Enterprise Employers
71.4% of social enterprises have no employees. For the remainder of the report, findings are drawing comparison between social enterprise employers and the wider cohort of SME employers (which for these purposes are defined as the combination of traditional and socially oriented SMEs). This report refers to this combined category of SMEs as SME employers.
Percentages are based on 7,118 [footnote 10] survey responses.
4.1 Size of Social Enterprises
The majority (75%) of social enterprises are micro businesses.
Social enterprises were more likely to be ‘small’ businesses, and less likely to be ‘micro’ businesses, compared to SME employers (Figure 4.1).
Figure 4.1: Employment size
| Employment size | SME employers (%) | Social enterprise employers (%) |
|---|---|---|
| Micro (1-9 employees) | 83.3 | 75.0 |
| Small (10-49 employees) | 14.3 | 21.0 |
| Medium (50-249 employees) | 2.4 | 4.0 |
1. The unweighted baseline is N = 7,118 (SME employers = 6,393, social enterprise employers = 725). 7 cases were marked as ‘unclassified’ due to missing data.
2. Percentages are rounded so may not add up to 100%.
3. Bold numbers in the tables indicate differences between SME employers and social enterprise employers that are statistically significant at the 95% level. Statistical significance indicates that the difference between two variables is unlikely to be due to chance.
4.2 Age of Social Enterprises
73.7% of social enterprise employers have been in existence for ten years or more (Figure 4.2). 52% of social enterprises have been established for over 20 years.
Figure 4.2: Age of enterprises
| Age of enterprises | SME employers | Social enterprise employers |
|---|---|---|
| 0-5 Years | 11.1 | 12.6 |
| 6-10 Years | 17.6 | 13.7 |
| 11-20 Years | 27.4 | 21.7 |
| More Than 20 Years | 43.6 | 52.0 |
| Unknown | 0.3* | 0.0* |
1. The unweighted baseline is N = 7,118 (SME employers = 6,393, social enterprise employers = 725). 7 cases were marked as ‘unclassified’ due to missing data.
2. Percentages are rounded so may not add up to 100%.
3. Bold numbers in the tables indicate differences between SME employers and social enterprise employers that are statistically significant at the 95% level. Statistical significance indicates that the difference between two variables is unlikely to be due to chance.
4.*: signify where there were less than 30 observations for the cells, therefore results should be treated with caution.
4.3 Sector presence of Social Enterprises
The largest proportion of social enterprise employers operate in the ‘Health / Social work’ (13.7%) sector, followed by ‘Wholesale / Retail’ and ‘Accommodation and Food’ (11.4% for both).
Compared to SME employers, social enterprise employers are more likely to operate in:
-
Health and social work (13.7% compared to 2.2% for SME employers)
-
Other service (8.0% compared to 3.2% of SME employers) [footnote 11]
-
Arts and Entertainment (5.1% compared to 1.4% for SME employers)
Figure 4.3: Sector of Enterprises [footnote 12]
| Sector | SME employers | Social enterprise employers |
|---|---|---|
| Primary | 3.9 | 7.4* |
| Manufacturing | 6.6 | 4.0 |
| Construction | 14.0 | 6.9 |
| Wholesale/Retail | 18.2 | 11.4 |
| Transport/Storage | 3.9 | 4.6* |
| Accommodation/Food | 10.1 | 11.4 |
| Information/Communication | 6.0 | 5.1* |
| Financial/Real Estate | 5.2 | 3.4* |
| Professional/Scientific | 14.6 | 9.1 |
| Administrative/Support | 9.5 | 6.9 |
| Education | 1.1 | 2.9 |
| Health/Social Work | 2.2 | 13.7 |
| Arts/Entertainment | 1.4 | 5.1 |
| Other Service | 3.2 | 8.0 |
1. The unweighted baseline is N = 7,118 (SME employers = 6,393, social enterprise employers = 725). 7 cases were marked as ‘unclassified’ due to missing data.
2. Percentages are rounded so may not add up to 100%.
3. Bold numbers in the tables indicate differences between SME employers and social enterprise employers that are statistically significant at the 95% level. Statistical significance indicates that the difference between two variables is unlikely to be due to chance.
4.*: signify where there were less than 30 observations for the cells, therefore results should be treated with caution.
4.4 Regional presence of Social Enterprises
Most social enterprises are located in England, with South East and South West having the largest proportion of social enterprises (14.9% and 13.7% respectively).
There is a higher proportion of social enterprises (10.9%) in Scotland than SMEs (6.4%).
Figure 4.4: Region of enterprises
| Regions | SME employers | Social enterprise employers |
|---|---|---|
| East Midlands | 7.9 | 5.1 |
| East of England | 11.3 | 9.7 |
| London | 11.8 | 10.3 |
| North East | 2.7 | 4.6* |
| North West | 8.6 | 8.6 |
| South East | 17.5 | 14.9 |
| South West | 12.4 | 13.7 |
| West Midlands | 8.4 | 8.0 |
| Yorkshire and the Humber | 6.8 | 6.3 |
| Scotland | 6.4 | 10.9 |
| Wales | 3.8 | 5.1 |
| Northern Ireland | 2.5 | 2.9 |
1. The unweighted baseline is N = 7,118 (SME employers = 6,393, social enterprise employers = 725). 7 cases were marked as ‘unclassified’ due to missing data.
2. Percentages are rounded so may not add up to 100%.
3. Bold numbers in the tables indicate differences between SME employers and social enterprise employers that are statistically significant at the 95% level. Statistical significance indicates that the difference between two variables is unlikely to be due to chance.
4.*: signify where there were less than 30 observations for the cells, therefore results should be treated with caution.
4.5 Legal Status of Social Enterprises
Social enterprises take varied legal forms and how they are identified in different contexts, and by different governments and agencies can vary considerably according to the selection criteria used.
Almost half of social enterprise employers (46.9%) have private limited company status, limited by shares, compared to 71.9% of SME employers.
16% of social enterprise employers are private companies limited by guarantee status (this is compared to 3% of SME employers, thus social enterprise employers are over-represented in this category).
8.6% of social enterprise employers operate with a legal status of ‘Sole proprietorship/ trader’, whilst 8% of them are in the ‘Other’ category [footnote 13].
Figure 4.5: Legal status of enterprises
| Legal status | SME employers | Social enterprise employers |
|---|---|---|
| Charitable Incorporated Organisation | 0.0 | 7.4 |
| Limited liability partnership | 0.9 | 1.7* |
| Partnership | 7.4 | 8.6 |
| Private company limited by guarantee | 3.0 | 16.0 |
| Private limited company, limited by shares (LTD) | 71.9 | 46.9 |
| Sole proprietorship/trader | 12.2 | 8.6 |
| Other | 2.6 | 8.0 |
| Unknown | 2.1 | 2.9* |
1. The unweighted baseline is N = 7,118 (SME employers = 6,393, social enterprise employers = 725). 7 cases were marked as ‘unclassified’ due to missing data.
2. Percentages are rounded so may not add up to 100%.
3. Bold numbers in the tables indicate differences between SME employers and social enterprise employers that are statistically significant at the 95% level. Statistical significance indicates that the difference between two variables is unlikely to be due to chance.
4.*: signify where there were less than 30 observations for the cells, therefore results should be treated with caution.
4.6 Gender and Leadership in Social Enterprises
In the LSBS survey, women-led businesses are defined as those majority-led by women, that is controlled by a single woman or having a management team of which a majority are women. ‘Majority’ here means more than 50%. (Figure 4.6).
There are more women-led social enterprise employers than SME employers (22.9% compared to 18.4%) and social enterprise employers are less likely to be entirely male led than SME employers (32% compared to 46.1%). However, it’s important to note that 9.7% of social enterprise employers were unable to provide an answer compared to 1.4% of SME employers.
Figure 4.6: Women-led enterprises
| Women-led | SME employers | Social enterprise employers |
|---|---|---|
| Women Led | 18.4 | 22.9 |
| Equally Led | 25.3 | 20.0 |
| Women in Minority | 8.8 | 15.4 |
| Entirely Male Led | 46.1 | 32.0 |
| Unknown | 1.4 | 9.7 |
1. The unweighted baseline is N = 7,118 (SME employers = 6,393, social enterprise employers = 725). 7 cases were marked as ‘unclassified’ due to missing data.
2. Percentages are rounded so may not add up to 100%.
3. Bold numbers in the tables indicate differences between SME employers and social enterprise employers that are statistically significant at the 95% level. Statistical significance indicates that the difference between two variables is unlikely to be due to chance.
4.7 Ethnicity and Leadership in Social Enterprises
In the LSBS survey, a minority ethnic group led enterprise is defined as an enterprise led by a person from a minority ethnic group (MEG) or one which has a management team with at least half of its members from an ethnic minority (Figure 4.7).
A similar number of social enterprise employers and SME employers are MEG-led (around 6%) which is not statistically significant difference.
Figure 4.7: Minority ethnic group (MEG) led enterprises
| Minority ethnic group | SME employers | Social enterprise employers |
|---|---|---|
| MEG-Led | 6.1 | 6.9 |
| Non MEG-Led | 93.1 | 92.6 |
| Unknown | 0.8 | 0.6 |
1. The unweighted baseline is N = 7,118 (SME employers = 6,393, social enterprise employers = 725). 7 cases were marked as ‘unclassified’ due to missing data.
2.Percentages are rounded so may not add up to 100%.
3. Bold numbers in the tables indicate differences between SME employers and social enterprise employers that are statistically significant at the 95% level. Statistical significance indicates that the difference between two variables is unlikely to be due to chance.
4.8 Area of Deprivation of Social Enterprises
The Index of Multiple Deprivation (IMD) measures the relative deprivation of a geographical area (typically the size of around 15000 individuals or 650 households) across seven dimensions of deprivation.
- Health
- Employment
- Income
- Education
- Crime
- Living environment
- Barriers to housing and services
The IMD is calculated differently across England. Scotland, Wales and Northern Ireland. The scores are combined based on their relative rank and depicted below (from the 20% most deprived to 20% least deprived areas).
Figure 4.8 shows that both social enterprise and SME employers have similar levels of representation across all areas of deprivation with lower levels of representation in the most deprived areas (around 13% for both SME and Social Enterprise employers) compared to the more affluent areas (around 20% for both SME and Social Enterprise Employers). The difference between social enterprise employers and SME employers is not statistically significant.
Figure 4.8: Prevalence of social enterprise and SME employers in areas of deprivation (ranging left to right most deprived to least deprived quintile.)
| IMD quartiles | SME employers | Social enterprise employers |
|---|---|---|
| 1 | 13.0 | 13.2 |
| 2 | 18.8 | 20.1 |
| 3 | 23.9 | 23.0 |
| 4 | 23.7 | 24.1 |
| 5 | 20.5 | 19.5 |
1. The unweighted baseline is N = 7,118 (SME employers = 6,393, social enterprise employers = 725). 7 cases were marked as ‘unclassified’ due to missing data.
2. Percentages are rounded so may not add up to 100%.
3. Bold numbers in the tables indicate differences between SME employers and social enterprise employers that are statistically significant at the 95% level. Statistical significance indicates that the difference between two variables is unlikely to be due to chance.
4.9 Energy Efficiency of Social Enterprises
Social enterprise employers are more likely to have installed energy efficiency measures in the last 12 months than SME employers (6.9% compared to 4.1%).
The main reason that prompted both social enterprise and SME employers to take action for energy efficiency was ‘to reduce energy costs’.
Figure 4.9: Energy efficiency of enterprises
| Energy efficiency (Y/N) | SME employers | Social enterprise employers |
|---|---|---|
| Energy Efficient | 4.1 | 6.9 |
| Not Energy Efficient | 18.2 | 14.9 |
| Unknown | 77.7 | 78.3 |
1. The unweighted baseline is N = 7,118 (SME employers = 6,393, social enterprise employers = 725). 7 cases were marked as ‘unclassified’ due to missing data.
2. Percentages are rounded so may not add up to 100%.
3. Bold numbers in the tables indicate differences between SME employers and social enterprise employers that are statistically significant at the 95% level. Statistical significance indicates that the difference between two variables is unlikely to be due to chance.
5. Business Performance
5.1 Turnover (compared to 12 months ago)
82.3% of social enterprise employers said that, taking into account all sources of income in the last financial year, they generated a profit or surplus. This is not different from the proportion of SME employers.
As shown in Figure 5.1, there was no difference between SME and social enterprise employers, as they had experienced similar growth in the last 12 months. About a third of social enterprise employers (32.6%) have experienced significant or substantial growth, whilst just under a third (28.6%) have experienced no change in their annual turnover.
Figure 5.1: Turnover (compared to 12 months ago)
| Turnover | SME employers | Social enterprise employers |
|---|---|---|
| Substantial / Significant growth | 31.9 | 32.6 |
| Moderate / Minor growth | 6.9 | 9.1 |
| No change | 28.3 | 28.6 |
| Moderate / Minor shrinkage | 10. | 9.7 |
| Substantial / Significant shrinkage | 20.1 | 17.1 |
| Unknown | 2.8 | 2.9* |
1. The unweighted baseline is N = 7,118 (SME employers = 6,393, social enterprise employers = 725). 7 cases were marked as ‘unclassified’ due to missing data.
2. Percentages are rounded so may not add up to 100%.
3. Bold numbers in the tables indicate differences between SME employers and social enterprise employers that are statistically significant at the 95% level. Statistical significance indicates that the difference between two variables is unlikely to be due to chance.
4.*: signify where there were less than 30 observations for the cells, therefore results should be treated with caution.
5.2 Expected turnover in the next 12 months
Social enterprise employers are more likely to expect an increase in their turnover in the next 12 months (52% compared to 45.9% of SME employers).
Figure 5.2: Expected turnover in the next 12 months
| Expected turnover | SME employers | Social enterprise employers |
|---|---|---|
| Increase | 45.9 | 52.0 |
| Stay the same | 42.5 | 37.1 |
| Decrease | 8.3 | 8.0 |
| Unknown | 3.3 | 2.9* |
1. The unweighted baseline is N = 7,118 (SME employers = 6,393, social enterprise employers = 725). 7 cases were marked as ‘unclassified’ due to missing data.
2. Percentages are rounded so may not add up to 100%.
3. Bold numbers in the tables indicate differences between SME employers and social enterprise employers that are statistically significant at the 95% level. Statistical significance indicates that the difference between two variables is unlikely to be due to chance.
4.*: signify where there were less than 30 observations for the cells, therefore results should be treated with caution.
5.3 Number of employees (compared to 12 months ago)
Total number of employees is calculated by adding together the approximate number of employees on the payroll and the number of working owners and partners together in employer and non-employer social enterprises. It is estimated that the number of people employed by social enterprises is approximately 1,223,000 (1,145,000 - 1,302,000) [footnote 14].
In terms of number of employees, there was no notable difference between SME and social enterprise employers. Nearly half of SME employers (46.4%) and social enterprise employers (44.3%) estimated that they had similar numbers of employees as they did one year ago. A little over one-third estimated that they had fewer employees than one year ago (34.1% of SME employers and 36.2% of social enterprise employers).
Figure 5.3: Number of employees (compared to12 months ago)
| Number of employees | SME employers | Social enterprise employers |
|---|---|---|
| More than currently | 19.3 | 19.5 |
| The same | 46.4 | 44.3 |
| Fewer | 34.1 | 36.2 |
| Unknown | 0.2* | 0.0* |
1. The unweighted baseline is N = 7,118 (SME employers = 6,393, social enterprise employers = 725). 7 cases were marked as ‘unclassified’ due to missing data.
2. Percentages are rounded so may not add up to 100%.
3. Bold numbers in the tables indicate differences between SME employers and social enterprise employers that are statistically significant at the 95% level. Statistical significance indicates that the difference between two variables is unlikely to be due to chance.
4.*: signify where there were less than 30 observations for the cells, therefore results should be treated with caution.
5.4 Expected number of employees in one year’s time
Similarly to expected turnover, social enterprise employers were more optimistic about their expected number of employees in one year’s time. 34.9% of social enterprise employers expected to have more employees in the next 12 months, whilst 56.6% did not expect their number of employees to change in the same period.
Figure 5.4: Expected number of employees in one year’s time
| Expected number of employees | SME employers | Social enterprise employers |
|---|---|---|
| More than currently | 29.3 | 34.9 |
| The same | 62.3 | 56.6 |
| Fewer | 7.7 | 7..4 |
| Unknown | 0.7 | 1.1* |
1. The unweighted baseline is N = 7,118 (SME employers = 6,393, social enterprise employers = 725). 7 cases were marked as ‘unclassified’ due to missing data.
2. Percentages are rounded so may not add up to 100%.
3. Bold numbers in the tables indicate differences between SME employers and social enterprise employers that are statistically significant at the 95% level. Statistical significance indicates that the difference between two variables is unlikely to be due to chance.
4.*: signify where there were less than 30 observations for the cells, therefore results should be treated with caution.
5.5 Potential obstacles to success
Based on respondents’ accounts, the most common obstacles faced were:
- Coronavirus (COVID-19) pandemic (72.57%)[footnote 15]
- Competition in the market (44.6%)
- Staff recruitment and skills (42.4%)
Compared to SME employers, social enterprise employers were more likely to select:
- Coronavirus (COVID-19) pandemic (72.7%, SME employers: 64.6%)
- National Living Wage (28.8%, SME employers: 18.1%)
- Obtaining finance (21.5%, SME employers: 13.5%)
Figure 5.5: Potential obstacles to success
| Potential obstacles to success | SME employers | Social enterprise employers |
|---|---|---|
| Obtaining finance | 13.5 | 21.5 |
| Taxation, VAT, PAYE, National Insurance, business rates | 36.7 | 34.8 |
| Staff recruitment and skills | 44.2 | 42.4 |
| Regulations/red tape | 42.4 | 39.4 |
| Availability/cost of suitable premises | 14.8 | 16.9 |
| Competition in the market | 44.9 | 44.6 |
| Workplace pensions | 10.2 | 7.7* |
| Late payment | 26.7 | 24.6 |
| UK exit from the EU | 34.0 | 37.9 |
| National Living Wage | 18.1 | 28.8 |
| Coronavirus COVID-19 pandemic | 64.6 | 72.7 |
| Any other major issues or obstacles | 13.2 | 16.9 |
| None of these | 6.9 | 3.1* |
| Unknown | 0.6* | 0.0* |
1. The unweighted baseline is N = 2,385 (SME employers = 2,145, social enterprise employers = 240). 7 cases were marked as ‘unclassified’ due to missing data.
2. Percentages are rounded so may not add up to 100%.
3. Bold numbers in the tables indicate differences between SME employers and social enterprise employers that are statistically significant at the 95% level. Statistical significance indicates that the difference between two variables is unlikely to be due to chance.
4.*: signify where there were less than 30 observations for the cells, therefore results should be treated with caution.
5.6 Reasons for seeking information or advice
There are significantly more social enterprise employers (34.9%) who have sought external advice or information in the last 12 months compared to SME employers (24.5%).
In terms of the reasons for seeking information, the main reasons were:
- Financial advice accounting for general running of business (8.0%),
- Business growth (7.4%),
- Legal issues (7.4%),
- Improving business efficiency/productivity (5.7%).
Figure 5.6: Reasons for seeking information or advice
| Reasons for seeking information and advice | SME employers | Social enterprise employers |
|---|---|---|
| Business growth | 4.6 | 7.4 |
| Business survival or operation through Coronavirus (COVID-19) pandemic and beyond | 2.6 | 4.0 |
| E-commerce/technology | 1.3 | 2.3* |
| Employment law/redundancies | 3.2 | 5.1 |
| Exporting | 0.8 | 1.1* |
| Financial advice accounting for general running of business | 5.8 | 8.0 |
| Financial advice how and where to get finance | 2.3 | 4.6* |
| Health and Safety | 1.4 | 2.3* |
| Importing | 0.3 | 0.6* |
| Improving business efficiency/productivity | 3.4 | 5.7 |
| Innovation | 1.1 | 1.7* |
| Legal issues | 4.7 | 7.4 |
| Management/leadership development | 0.5 | 1.7* |
| Marketing | 1.9 | 2.3* |
| Regulations | 1.8 | 2.3* |
| Relocation | 0.1* | 0.0* |
| Tax/national insurance law and payments | 3.6 | 1.1* |
| Trade mission attendance | 0.0* | 0.0* |
| Training/skills needs | 0.9 | 2.3 |
| Workplace pension | 0.3* | 0.6* |
| Other | 2.4 | 3.4 |
| Unknown | 0.3* | 0.0* |
1. The unweighted baseline is N = 7,118 (SME employers = 6,393, social enterprise employers = 725). 7 cases were marked as ‘unclassified’ due to missing data.
2. Percentages are rounded so may not add up to 100%.
3. Bold numbers in the tables indicate differences between SME employers and social enterprise employers that are statistically significant at the 95% level. Statistical significance indicates that the difference between two variables is unlikely to be due to chance.
4.*: signify where there were less than 30 observations for the cells, therefore results should be treated with caution.
5.7: Information or advice sought from
Compared to SME employer, social enterprise employers are more likely to seek advice from:
- Consultant/general business adviser (11.4%),
- Business networks/trade associations (7.4%),
- Local Council/Authority (2.9%).
Figure 5.7: Information or advice sought from
| Information or advice sought from | SME employers | Social enterprise employers |
|---|---|---|
| Accountant | 9.7 | 9.1 |
| Bank | 0.8 | 1.7* |
| Business networks/trade associations | 4.5 | 7.4 |
| Business Wales | 0.2* | 0.0* |
| Chamber of Commerce | 0.7 | 0.6* |
| Consultant/general business adviser | 7.6 | 11.4 |
| Find business support website | 0.3* | 1.1* |
| Friend or family member | 0.5 | 0.6* |
| GOV website | 2.5 | 2.3 |
| Inter-Trade Ireland | 0.0* | 0.0* |
| Internet search/google/other websites | 1.6* | 2.3* |
| Invest NI | 0.1 | 0.0* |
| Local Council/Authority | 1.1 | 2.9 |
| Local Enterprise Partnerships | 0.7 | 1.1* |
| NI Business Info website | 0.0* | 0.0* |
| Solicitor/lawyer | 2.8 | 4.6 |
| Specialist financial adviser | 1.2 | 1.7* |
| Tax agent | 0.3* | 0.6* |
| The Pensions Regulator | 0.1* | 0.0* |
| Universities/other education sector | 0.4 | 1.1* |
| Work colleagues | 0.6 | 0.6* |
| Other | 2.9 | 6.9* |
| None | 0.4 | 0.6 |
| Unknown | 0.2 | 0.6* |
1. The unweighted baseline is N = 7,118 (SME employers = 6,393, social enterprise employers = 725). 7 cases were marked as ‘unclassified’ due to missing data.
2. Percentages are rounded so may not add up to 100%.
3. Bold numbers in the tables indicate differences between SME employers and social enterprise employers that are statistically significant at the 95% level. Statistical significance indicates that the difference between two variables is unlikely to be due to chance.
4.*: signify where there were less than 30 observations for the cells, therefore results should be treated with caution.
-
‘Other services’ covers categories that are not covered by the UK Standard Industrial Classification (SIC) 2007. ↩
-
Please note that this report is drawing on 2021, therefore ‘Coronavirus (COVID-19) pandemic’ related issues are likely to be more prominent than in other reports. ↩
-
DBT (formally known as BEIS), Longitudinal Small Business Survey: technical report (2021) ↩
-
DCMS and DBT, Social enterprise: market trends 2017 ↩
-
DCMS and DBT, Social enterprise: market trends 2019 ↩
-
Social Enterprise UK (SEUK), No Going Back – State of Social Enterprise Survey 2021, Methodology section, pg. 11. ↩
-
Please note, the number of social enterprises are estimates and not exact numbers, this is rounded to the nearest thousand. ↩
-
Please note, the actual number is estimated to be within the range in brackets. The true number of social enterprises is expected to fall within this range. ↩
-
Please note, the number of social enterprises are estimates and not exact numbers, this is rounded to the nearest thousand.
Please note, the actual number is estimated to be within the range in brackets. The true number of social enterprises is expected to fall within this range. ↩ -
The effective unweighted sample size is N=7,118 as this section of the report only relies on social enterprise and SME employer data. 7 enterprises could not be classified as social enterprise, traditional non-profit, commercial or socially-orientated SME due to missing data. ↩
-
‘Other services’ covers categories that are not covered by the UK Standard Industrial Classification (SIC) 2007. ↩
-
These categories are based on UK Standard Industrial Classification (SIC) 2007, which was used by the Longitudinal Small Business Survey 2021. For more information, please see Longitudinal Small Business Survey: technical report, BEIS, 2021. ↩
-
‘Other’ covers legal statuses that are not covered by the above categories, which included examples such as ‘Industrial and Provident Societies (IPS), Certificate of Incorporation (CIO), CBCommunity Benefit Society (CBS), Community Interest Company (CIC). Some described themselves as ‘trusts, friendly societies, cooperatives, royal charter companies or unincorporated associations’. Source: DBT, Longitudinal Small Business Survey: SME Employers (2021) ↩
-
Please note, the number of employed by social enterprises are estimates and not exact numbers, this is rounded to the nearest thousand.
Please note, the actual number is estimated to be within the range in brackets. The true number of social enterprises is expected to fall within this range. ↩ -
Please note that this report is drawing on 2021, therefore ‘Coronavirus (COVID-19) pandemic’ related issues are likely to be more prominent than in other reports. ↩