Sector Skills Needs Assessment – Health and adult social care
Updated 6 October 2026

© Crown copyright 2026
This publication is licensed under the terms of the Open Government Licence v3.0 except where otherwise stated. To view this licence, visit nationalarchives.gov.uk/doc/open-government-licence/version/3 or write to the Information Policy Team, The National Archives, Kew, London TW9 4DU, or email: psi@nationalarchives.gov.uk.
Where we have identified any third party copyright information you will need to obtain permission from the copyright holders concerned.
This publication is available at https://www.gov.uk/government/publications/skills-england-annual-skills-report-and-sectoral-skills-needs-assessments-2026/sector-skills-needs-assessment-health-and-adult-social-care
1. Handling notes
The SNAs use occupations, as defined by Standard Occupation Classification (SOC) codes, to provide an indication of the skills needs for the sectors. These allow for a consistent approach and cross-sector comparison. However, they are an approximation and do not work for all types of employment, particularly in highly specialised and emerging roles. As such, we have expanded our methods by using the newly developed UK Standard Skills Classification to identify the skill areas relevant for priority occupations. This is the first step for assessing the future demand for skills across key sectors in terms of both occupations and specific skills areas.
All estimates of future employment and skills are highly uncertain and their inclusion here is not for making precise forecasts of employment levels. Rather, the aim is to provide information about the general nature of changing employment patterns and their implications for skill requirements. The projections should be regarded as indicative of general trends and orders of magnitude, given the assumptions set out in section 5 below.
At the time of preparing the Skills Needs Assessments, due to ongoing workforce modelling for the upcoming 10 Year Health Workforce Plan, the Department of Health and Social Care (DHSC) were not able to provide projected demand estimates for health priority occupations. As such, this report does not include any future demand estimates for health.
The demand figures for the adult social care sector are based on Annual Population Survey (APS) data and SOC codes. While these classifications provide the closest match to adult social care job roles, APS estimates are generally considered less accurate than sources preferred by DHSC, such as Skills for Care’s Adult Social Workforce Care dataset. However, APS data is used here to maintain consistency across sectors. Data is provided on demand growth for England only.
The data and methodology used to create the Skills Needs Assessments are set out in the accompanying tables and technical annex published alongside this report.
2. Executive summary
2.1 Health – executive summary
The Department of Health and Social Care (DHSC) identified 26 priority occupations for the health sector. In 2024, it is estimated that health priority occupations employed around 1.5 million people across the UK (Annual Population Survey, ONS 2025).
These roles typically require high proficiency in listening, problem solving, and decision making. The vast majority of projected additional employment (95%) in these priority occupations require qualifications at level 4 and above, a considerably higher proportion than across all priority occupations.
One of the occupations (biochemists and biomedical scientists) also faces demand from the Life Sciences sector, which could create demand pressures in this occupation.
These occupations are already showing signs of high demand, with 63% of the occupations in critical or elevated demand across the whole economy, and a third in critical demand.
Details of future employment in the health sector will be featured as part of the forthcoming NHS 10 Year Workforce plan.
Historically, the education pathways most important to the priority occupations are higher education courses in nursing and midwifery, medicine and dentistry, and allied health at level 6 and above. A considerable proportion of these leavers already enter priority occupations, up to 93% in the case of nursing and midwifery. These same courses have seen strong growth in recent achievements, growing by at least 13% between 2021 to 2022 and 2023 to 2024, with allied health growing at the fastest rate (27%).
2.2 Adult social care – executive summary
The Department of Health and Social Care (DHSC) identified 5 priority occupations within the adult social care sector. Employment demand for these priority occupations is projected to grow by 281,000 (28%) between 2025 and 2035. This is in addition to the estimated 404,000 workers expected to leave these priority occupations over that period that need to be replaced, bringing total demand to around 685,000 workers.
The majority (79%) of projected additional employment in priority occupations requires workers with qualifications of level 2 or 3.
Although adult social care is more accessible to people with lower level qualifications compared to some other priority sectors, the work requires complex interpersonal skills (such as advising and supporting vulnerable people and providing care and support services) which are far more prevalent in the sector than across the economy. The priority occupations typically require high proficiency in the core skills of listening and working with others.
None of the priority occupations face demand from other priority sectors. However, there is evidence from The Health Foundation about broader competition between adult social care and the NHS.
Adult social care priority occupations are already showing signs of high demand, with 80% of the occupations in critical or elevated demand across the whole economy and 40% in critical demand.
Historically, the education pathways most important to the priority occupations are the health and social care apprenticeship at level 2/3 and health and social care degree at level 6. Growth in important pathways has been highest in level 4 and 5 apprenticeships between 2021 to 2022 and 2023 to 2024, where nursing and subjects/vocations allied to medicine and health and social care have seen a 54% and 20% growth, respectively. However, further education lower level routes have seen a recent decline in achievement numbers of almost a quarter (24%).
Note: for consistency across priority sectors, the SNAs analysis required the use of SOC codes for occupations. However, DHSC colleagues and Skills England engagement with the sector has indicated that SOC codes do not fully represent the diversity of roles within adult social care. As such, we recognise that the findings of the SNAs analysis for adult social care has limitations, and it should be treated as indicative only.
3. Workforce overview and demographics
3.1 Health – workforce overview and demographics
In 2024, it is estimated that health priority occupations employed 1,487,000 people across the UK (Annual Population Survey, ONS 2025). Data from the Annual Population Survey reflects the whole health sector and covers the NHS and wider provision. This has been used for consistency with other priority sectors. Data on NHS workforce specifically is published by NHS England here: NHS Workforce Statistics - January 2026 - NHS England Digital.
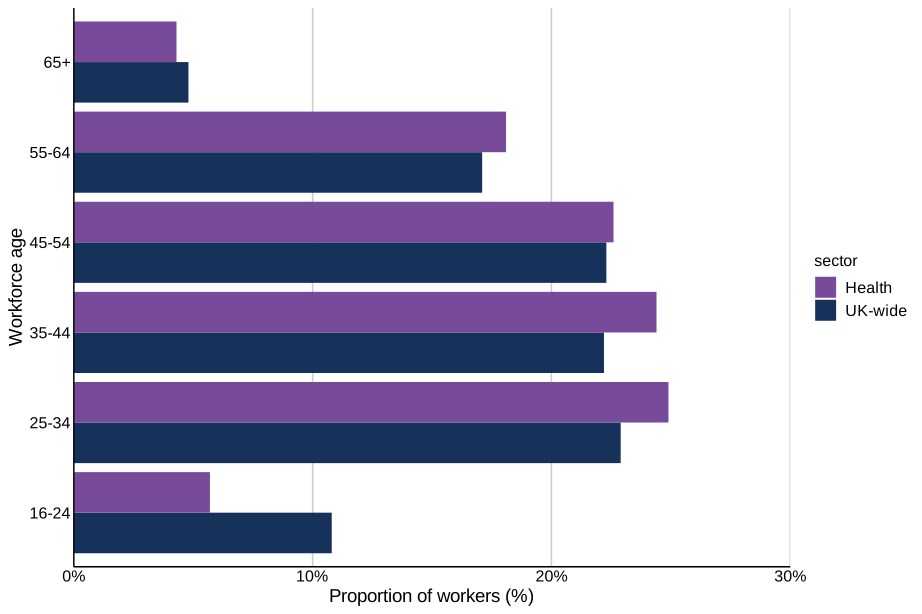
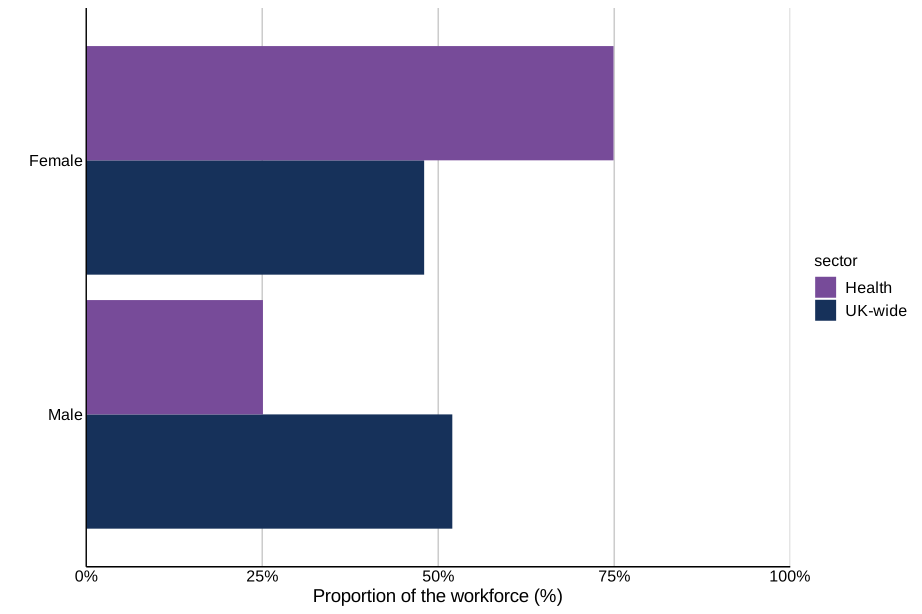
The demographics for the sector suggest an age profile similar to that of UK-wide employment, as shown in Figure 1, but with a relatively lower proportion of the workforce in the 16 to 24 age group. The largest age group in health is 25 to 34 (24.9%), which is 2 percentage points higher the UK average (22.9%). The workforce is female-dominated, as shown in Figure 2, with 74.9% of workers being female, compared to 48.0% across the UK.
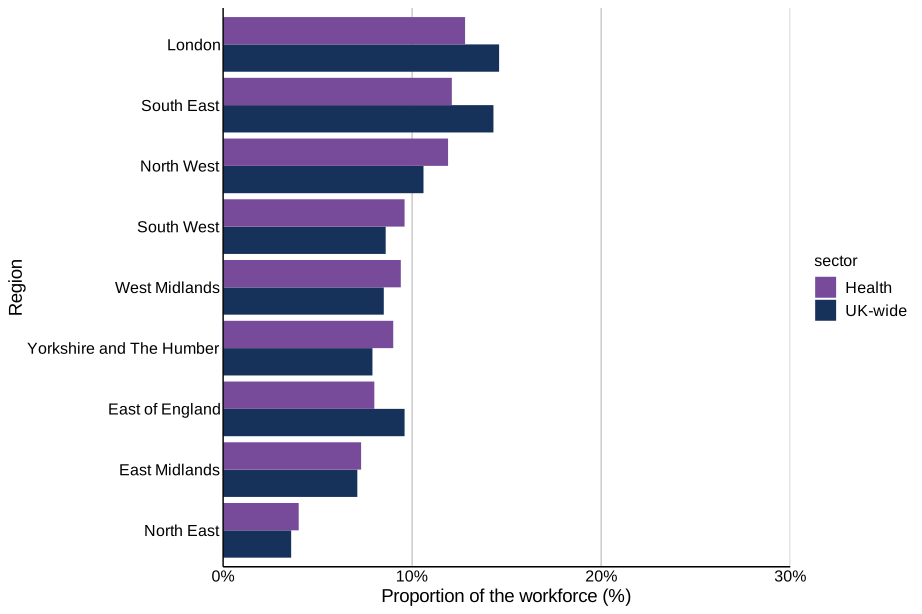
Regionally, the workforce in health is spread across the country, following a similar regional distribution the UK-wide employment, as shown in Figure 3. The largest share of workers are in London (12.8%), but this is actually 1.8 percentage points lower than the UK average (14.6%).
Figure 1: Age distribution for health compared to UK-wide employment in 2025
Source: Annual Population Survey, ONS 2025
Figure 2: Sex distribution for health compared to UK-wide employment in 2025
Source: Annual Population Survey, ONS 2025
Figure 3: Regional distribution for health compared to UK-wide employment in 2025
Source: Annual Population Survey, ONS 2025
3.2 Adult social care – workforce overview and demographics
In the year 2024/25, it is estimated that the adult social care sector employed 1.47million people across England (Skills for Care, trended data download – 2024/25).
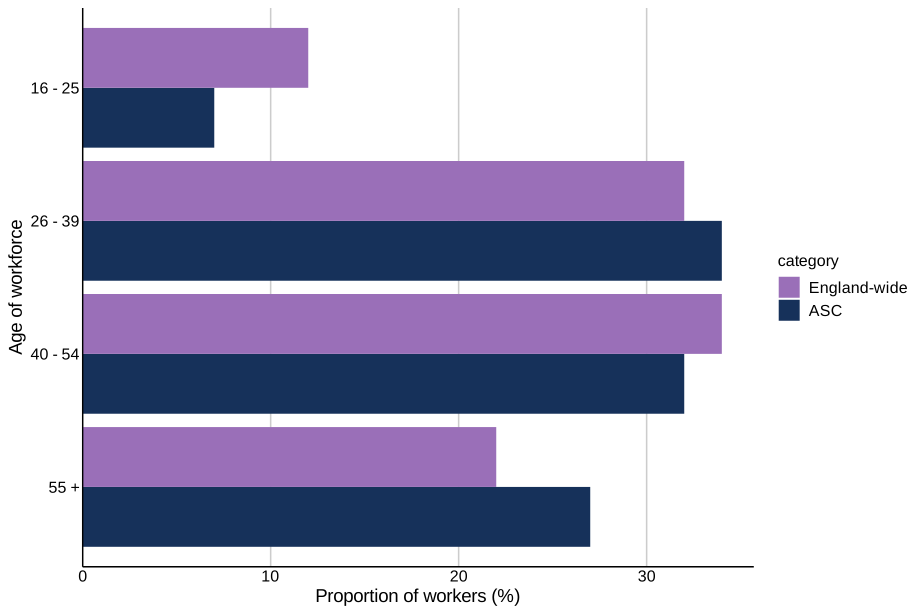
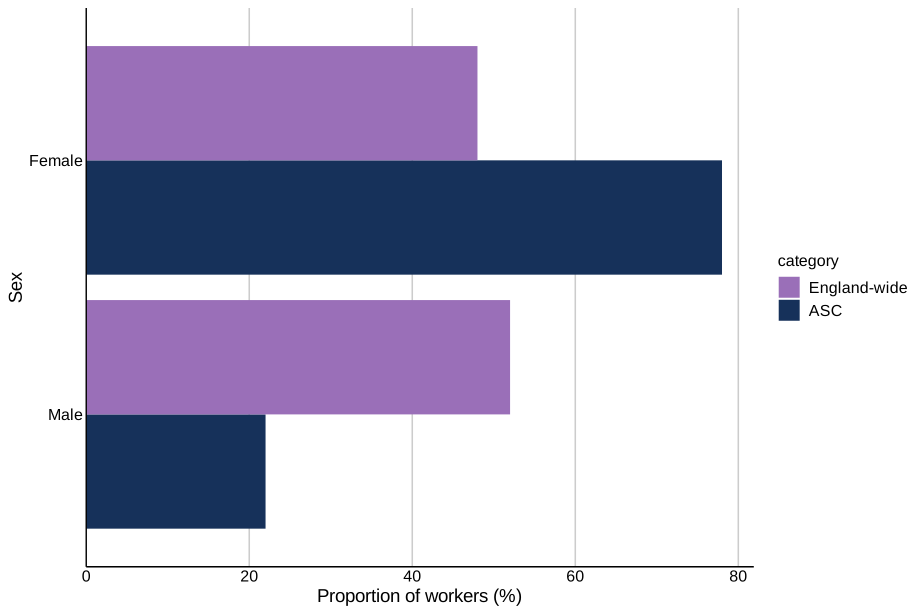
The demographics for the adult social care sector in England present a workforce with a notable lower proportion of workers age 16 to 25 relative to England-wide employment, but a relatively higher proportion of workers aged 55 and over, as shown in Figure 4. The largest age group in adult social care is 26 to 39 (34.0%), which is 2 percentage points higher the average for England (32.0%). As Figure 5 shows, the workforce in adult social care is female-dominated, at 78.0% female, compared to 48.0% across England.
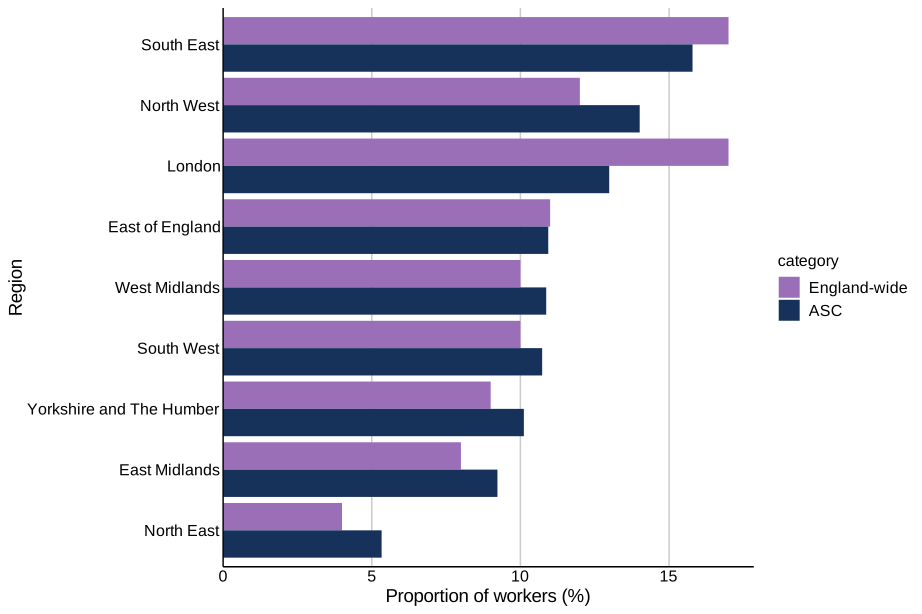
Regionally, as shown in Figure 6, the workforce in adult social care is most concentrated in the South East (15.8%), which is 1.2 percentage points lower than the average for England (17.0%).
Figure 4: Age distribution for adult social care (ASC) compared to England-wide employment in 2025
Source: Skills for Care, Adult social care statistical appendix, 2025
Figure 5: Sex distribution for adult social care (ASC) compared to England-wide employment in 2025
Source: Skills for Care, Adult social care statistical appendix, 2025
Figure 6: Regional distribution for adult social care (ASC) compared to England-wide employment in 2025
Source: Skills for Care, Adult social care statistical appendix, 2025
3.3 Health and adult social care – place analysis
The following Business Register and Employment Survey (BRES) analysis defines adult social care using SIC labels that span both health and social care activities, incorporating employment across hospital and medical services alongside residential, nursing, and wider social work provision.
Based on Business Register and Employment Survey (BRES) 2024 data, employment volumes are highest in large urban areas, with the Central London Forward Local Skills Improvement Plan (LSIP) geography employing around 320,000 people, while smaller LSIP geographies such as Buckinghamshire record much lower employment totals, at around 12,000.
Proportional concentrations illustrate how the share of health and adult social care employment varies across local areas based on the care needs of the area. Liverpool City LSIP geography records the highest concentration, with around 20% of its workforce employed in health and adult social care, followed closely by Tees Valley LSIP geography (19%). In contrast, Hertfordshire (10%) and Central London Forward (9%) LSIP geographies have the lowest proportions of employment in health and adult social care, reflecting differences in underlying population health profiles, levels of need for care and support, and the extent to which the sector forms part of the wider local economy.
Substantial variation is also evident within LSIP geographies themselves example, within the Liverpool City LSIP geography, health and adult social care accounts for 25% of employment in the Wirral LSIP geography, compared with 13% in St Helens LSIP geography, illustrating how the volume of care required, and the workforce needed to meet statutory service obligations, can differ significantly across neighbouring LSIP geographies.
Recent trends point to continued growth, alongside some local divergence. Between 2021 and 2024, health and adult social care employment increased by around 267,000 nationally, with growth observed in the majority of LSIP geographies. Growth was strongest in Greater Manchester LSIP geography (27%), while the largest decline was observed in Cumbria LSIP geography (-8%). Changes also varied within LSIPs geographies, such as in the North East LSIP geography, where employment rose by 25% in Gateshead LSIP geography but fell by 2% in South Tyneside LSIP geography.
Note: BRES primarily captures VAT- and PAYE-registered businesses and may therefore under-represent sectors with high numbers of freelancers or micro-businesses. As a result, apparent regional concentrations may reflect the location of larger employers rather than the full distribution of sectoral employment.
4. Priority occupations and current demand
4.1 Priority occupations
Skills England has been working with DHSC to identify occupations of importance to the health and adult social care sectors. Priority occupations in health were selected based on the 2023 NHS Long Term Workforce Plan. However, SOC codes do not always match clearly with NHS occupation groups.
There are 26 selected priority occupations for health, one of which overlaps with the Life Sciences sector: biochemists and biomedical scientists. The priority occupations unique to the health sector include:
- generalist medical practitioners
- specialist medical practitioners
- physiotherapists
There are 5 priority occupations for adult social care, none of which overlap with any other priority sector. These 5 priority occupations are:
- care workers and home carers
- senior care workers
- social workers
- residential, day and domiciliary care managers and proprietors
- social services managers and directors
Priority occupations in adult social care were selected because of their volume, compatibility with SOC code system, and distinctiveness within adult social care – aiming to reduce overlap with the forthcoming NHS 10 Year Workforce plan or other industrial strategy sectors.
While these classifications provide the closest match to adult social care job roles, DHSC colleagues and Skills England’s engagement with the sector has indicated that SOC codes do not fully represent the diversity of roles within adult social care. For instance, the Social Worker SOC includes adult and children social workers. In this instance, the demand growth estimate is based solely on projected demand for adult social workers on top of SOC numbers for all social workers in general.
Although there is no overlapping demand from other sectors, we note that there is evidence of competition between adult social care roles and roles in the NHS. The Health Foundation finds lower paid staff leaving adult social care for other occupations frequently become employed in the NHS, with 28% later employed as nurses or nursing auxiliaries and assistants. However, only 7% of lower paid NHS staff work become carers after leaving the NHS.
4.2 Demand for priority occupations
Of the priority occupations in health, 33% are in critical demand (substantially higher demand than usual). Moreover, 63% of priority occupations are either in critical demand or elevated demand (above average). This is based on Skills England’s Occupations in demand analysis, published in 2025.
Of the priority occupations in adult social care, 40% are in critical demand and 80% of priority occupations are either in critical demand or elevated demand.
This illustrates a very high level of current demand experienced in the priority occupations identified by both the health and adult social care sectors.
To note that, in the health sector, demand is largely a function of public funding. Indicators of strong demand – as used in ‘occupations in demand’ – may not equate to a similar number of available roles.
4.3 Demand for skills
The UK’s first Standard Skills Classification (SSC) provides a mapping of relevant skill areas to occupations. Using an initial prototype of the SSC, experimental analysis was conducted to identify the skill areas which are relevant to priority occupations.
Across the priority occupations in the health sector, the top 3 technical skill areas are:
- conducting scientific surveys and research
- conducting commercial and legal research
- compiling, validating and preparing data
Across the priority occupations in the adult social care sector, the top 3 technical skill areas are:
- advising and supporting vulnerable people
- providing personal care and support services
- managing organisational and operational records
Core Skills
The SSC also sets out 13 ‘Core Skills’, which are fundamental abilities that contribute to the capability to carry out the tasks associated with a specific job, such as numeracy, reading, and writing. They are often transferable, meaning they can be applied across different sectors of activity and roles. The SSC provides proficiency scores for core skills by occupation, on a 1 to 5 scale from minimal proficiency to expert proficiency.
The 13 Core Skills defined in the UK Standard Skills Classification (SSC) are listed below. These are foundational, transferable abilities required across occupations, and they are listed explicitly in the SSC Core Skills Explorer.
- planning and organising – setting goals, prioritising tasks, structuring approaches
- adapting – adjusting strategies or behaviour to new or changing situations
- working with others – collaborating effectively with teams or groups
- listening – understanding spoken communication, including non-verbal cues
- speaking – communicating clearly and confidently through speech
- leadership – motivating, guiding, and inspiring others
- learning and investigating – searching for, gathering, and understanding new information
- creating – developing original ideas, innovations, or solutions
- problem-solving and decision-making – identifying issues, analysing information, selecting solutions
- numeracy – applying mathematical techniques and interpreting numerical data
- digital literacy – using digital tools and technologies effectively (including AI)
- reading – interpreting written information accurately
- writing – communicating ideas clearly and persuasively in written form
The required proficiency in core skills for the priority occupations have been compared to the UK average. Where core skills have a higher required proficiency in priority occupations, this suggests that these skills are particularly important for these occupations.
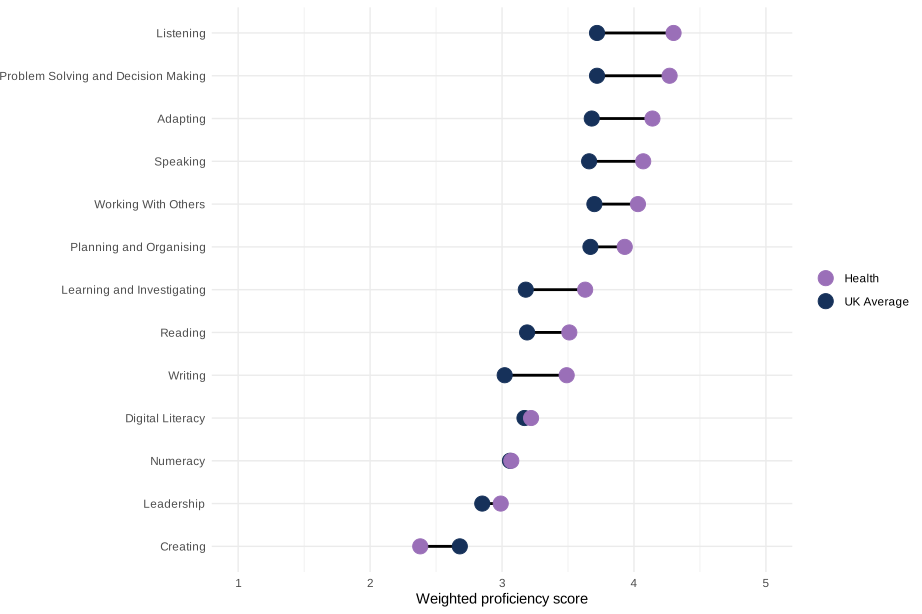
Figure 7 below shows which core skills are important for the health sector compared to the wider UK. Health requires notably higher proficiency in the core skills: listening (4.3 versus 3.7) and problem-solving and decision-making (4.3 versus 3.7).
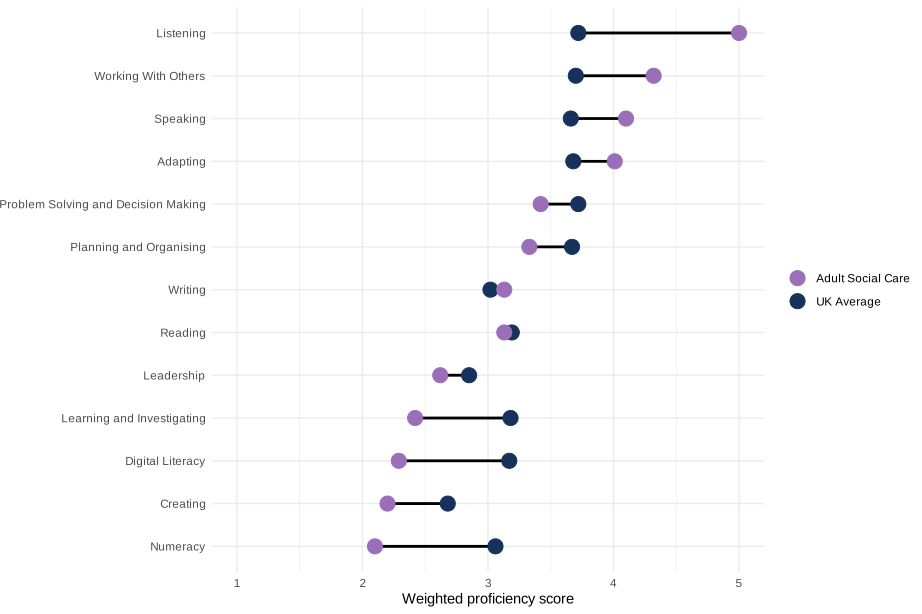
Figure 8 shows which core skills are important for the adult social care sector compared to the wider UK. Adult social care requires notably higher proficiency in the core skills: listening (5.0 versus 3.7) and working with others (4.3 versus 3.7).
Figure 7: Core skills proficiency for the health sector compared to the UK
Source: Internal analysis using the UK Standard Skills Classification, based on 2024 data for health priority occupations
Figure 8: Core skills proficiency for the adult social care sector compared to the UK
Source: Internal analysis using the UK Standard Skills Classification, based on 2025 data for adult social care priority occupations
5. Future demand for priority occupations
Within the adult social care sector, employment demand for priority occupations is projected to grow by 281,000 (28%) between 2025 and 2035.
Projected employment demand has been estimated by DHSC by using the Annual Population Survey to sum full time and part-time employees in England that belong to the relevant SOC codes. It assumes that current supply meets demand and that the workforce will grow proportionally with projected care user growth. Care user growth is based on Care Policy and Evaluation Centre (CPEC) published projections (2025), with 2023 to 2024 as a base year, and 2024 to 2025 onwards using published CPEC projections.
The demand figures based on APS data use SOC codes. While these classifications provide the closest match to adult social care job roles, APS estimates are generally considered less accurate than other preferred sources, such as Skills for Care’s adult social care dataset. However, APS data is used here to maintain consistency across sectors.
Data is provided here on demand growth for England only.
5.1 Top occupations by employment growth to 2035
At the time of preparing the Skills Needs Assessments, due to ongoing workforce modelling for the upcoming 10 Year Health Workforce Plan, DHSC were not able to provide projected demand estimates for health priority occupations. As such, this report does not include any future demand estimates for health.
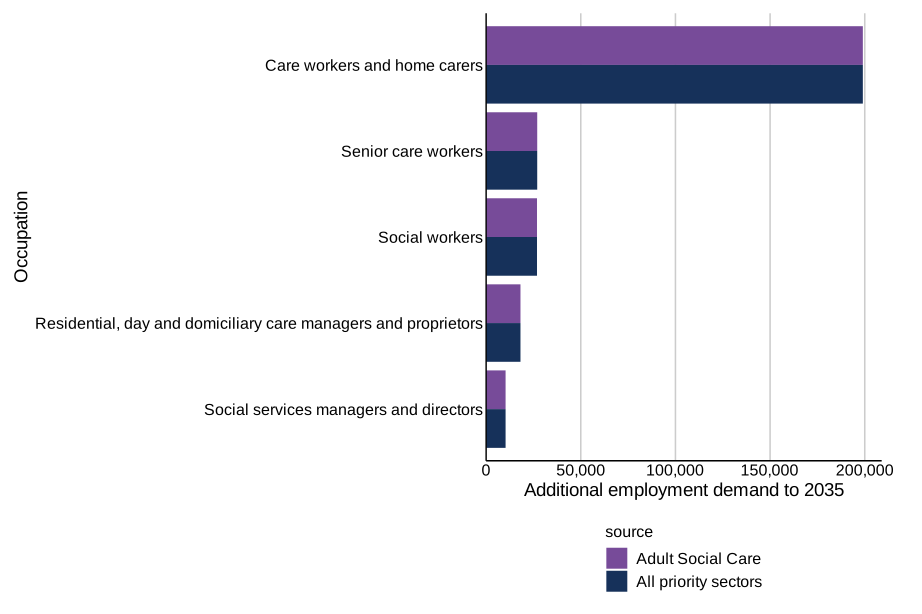
For adult social care, as seen in Figure 9, the occupation with the highest projected employment demand is care workers and home carers, with 199,000 additional workers needed in adult social care between 2025 and 2035.
Figure 9: Priority occupations in the adult social care sector by additional employment to 2035
Source: Demand projections provided by Department of Health and Social Care (DHSC)
5.2 Expected qualification levels
For health, the majority (95%) of employment in priority occupations in 2024 required workers with qualifications at level 4 and above. This is considerably higher than across the priority occupations in the other priority sectors, where 62% of the projected additional employment to 2035 requires workers with level 4 and above qualifications.
Table 1: Health - expected qualification level of workers
| Priority occupations | Scope | Level 2 or 3 | Level 4 or above |
|---|---|---|---|
| Health priority occupations | Employment in 2024 | 5% | 95% |
| All priority occupations (excluding health) | Projected additional employment to 2035 | 38% | 62% |
Source: Skills England planning scenarios based on sector-level projections
Note: Figures are not directly comparable due to the difference in scope. This is because this report does not include any projected additional employment estimates to 2035 for health.
For adult social care, 21% of projected additional employment to 2035 in priority occupations requires workers with qualifications at level 4 and above. This is considerably lower than across all priority occupations, where 62% of additional employment requires workers with level 4 and above qualifications.
Table 2: Adult social care - Expected qualification level of workers needed to meet demand to 2035 in priority occupations
| Priority occupations | Level 2 or 3 | Level 4 or above |
|---|---|---|
| Adult social care priority occupations | 79% | 21% |
| All priority occupations (excluding health) | 38% | 62% |
Source: Skills England planning scenarios based on sector-level projections
5.3 Alternative scenarios
Any future projection of how the economy will evolve is inherently uncertain. This uncertainty increases the further forward the projection extends. To improve the understanding of the uncertainty in the skills assessment projections for adult social care, Skills England asked the sponsoring department to provide an alternative scenario. The total job growth in this scenario is shown in Table 3 below. To create an alternative scenario, Skills for Care’s Adult Social Care growth estimates were applied (as opposed to growth estimates from CPEC) to produce projections up to 2035.
As outlined in section 5.1 above, this report does not include any future demand estimates for health.
In the alternative scenario for adult social care, growth in priority occupations is 66,100 workers lower (215,200) compared with the central scenario (281,300). The growth rate in the alternative scenario is 21%, which is 7 percentage points lower than the central scenario (28%).
Table 3: Alternative demand scenarios for adult social care
| Scenario | Increase in employment demand from 2025 to 2035 | Percentage change in employment demand from 2025 to 2035 |
|---|---|---|
| Central | 281,300 | 28% |
| Alternative | 215,200 | 21% |
Numbers rounded to nearest 100
Source: Demand projections from DHSC
5.4 Replacement demand
In addition to expansion demand, where we consider the additional workers needed due to expected future sector growth, there is also demand for workers required to replace existing workers in the labour market. This is known as replacement demand. This demand will be particularly acute for some occupations and sectors (for example, those with an ageing workforce, high attrition due to poor terms or conditions, or particularly affected by labour augmenting technologies).
We have attempted to gauge the potential scale of replacement demand for the health and adult social care sectors. However, the focus of our Skills Needs Assessment analysis remains on expansion demand, and we make the assumption that current supply into the workforce (either directly from education leavers or from other routes) is sufficient to maintain the existing size of the workforce and meet replacement demand. In practice, this will not be the case for many occupations.
To estimate replacement demand we use existing national labour market projections to get occupation-specific replacement rates. These rates capture expected workforce exits due to retirement, mortality and other factors. Rates are available at the 2-digit SOC level and are applied to corresponding 4-digit occupations. We then apply these rates to the future workforce demand estimates provided by departments, to estimate annual replacement demand by priority occupation.
For adult social care, each year, we estimate an average of 40,400 workers needing to be replaced within priority occupations in the sector. Over the 10-year period of 2026 to 2035, the total estimated replacement demand is 404,000 workers. This increases the total demand for workers. When combining this with total additional employment demand to 2035 (281,300), the total demand for workers in adult social care is 685,000.
However, this estimate of replacement demand for adult social care could be a substantial underestimate. DHSC estimate (using Skills for Care data) that the number of staff leaving the ‘care worker occupation alone in 2024/25 was greater than 100,000.
For health, labour market projections estimate an average of 67,800 workers each year needing to be replaced within priority occupations. To 2035, the total estimated replacement demand is 678,000 workers.
Note: as we do not have future workforce demand estimates for health, we have calculated replacement demand in a different way to adult social care, taking the replacement demand forecasts directly from national labour market projections only.
6. Education supply
As part of this assessment, we have considered the supply of workers in priority occupations relevant to the health and adult social care sectors. Employment in the sector is influenced by a range of joiners (inflows) and leavers (outflows), as illustrated in Figure 10. This analysis focuses on one component of supply: inflows from education.
Education inflows capture individuals who move from education into employment in priority occupations. This group is predominantly made up of career starters, while also including a smaller number of job switchers and individuals returning to work. Taken together, these flows provide a robust and consistent indicator of the pipeline of new talent entering priority occupations and form a reliable basis for understanding the contribution of the education system to workforce supply.
Figure 10: Stock and flow of joiners and leavers into industries
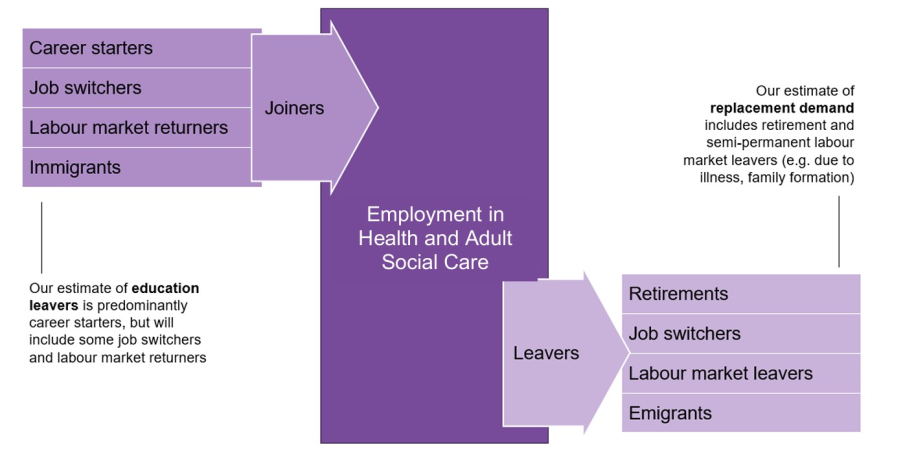
Figure 10 is a stock and flow diagram showing how people join the health and adult social care sectors, listed as career starters, job switchers, returners, immigrants. It then shows what makes them leave: retirements, job switchers, labour market leavers, emigrants. For joiners, the diagram states that Skills England’s estimate of education leavers is predominantly career starters, but will include some job switchers and labour market returners. For leavers, the diagram outlines that Skills England’s estimate of replacement demand includes retirement and semi-permanent labour market leavers (for example, due to illness and family formation).
6.1 Important training routes
There are multiple routes by which people enter employment in a given occupation. Using information on historic pathways into these occupations and the Skills England Occupational Maps, we have identified the most prominent routes that provide direct supply into priority occupations identified for the health and adult social care sector. The routes relate to entry into the occupation but cover all industries and are not specific to employment in the health and adult social care sector. These routes are summarised in Table 4.
Training routes have been selected by considering the volume of entrants to priority occupations identified for the sector and what proportion this is of all employed education leavers for that training route. Training routes with a high volume and proportion relative to other training routes are selected.
These broadly split into 3 types of courses:
- well-aligned routes, often technical in nature, where a high proportion of leavers progress into priority occupations, but sometimes with small cohorts
- balanced routes, where a reasonable proportion of leavers progress into priority occupations from a larger cohort
- high-volume routes, where a smaller proportion of leavers progress to priority occupations but contribute a large share of employment
Not all 3 course types are present in all sectors. For well-aligned routes, increasing the supply into priority occupations will likely require an increase in enrolments. Whereas for other routes that are less well-aligned, increasing the progression rates to priority occupations may be more effective.
Table 4: Health – key routes related to priority occupations for the health sector
| Pathway | Subject area | Level group | Number of education leavers entering priority occupations | Percentage of employed education leavers entering priority occupations |
|---|---|---|---|---|
| Higher Education | Nursing and midwifery | Level 6+ | 16,130 | 93% |
| Higher Education | Medicine and dentistry | Level 6+ | 6,380 | 80% |
| Higher Education | Allied health | Level 6+ | 6,780 | 63% |
| Higher Education | Pharmacology, toxicology and pharmacy | Level 6+ | 1,720 | 60% |
| Higher Education | Medical sciences | Level 6+ | 2,450 | 43% |
| Higher Education | Psychology | Level 6+ | 2,540 | 18% |
| Apprenticeship | Health and social care | Level 2/3 | 1,800 | 17% |
Source: Skills England estimates based on internal modelling for employment in 2022/23 tax year. Further details can be found in the Skills Needs Assessments technical annex.
The 7 routes in Table 4 account for 85% of entrants into priority occupations for health. This covers a range of health-related subject areas with nursing and midwifery having the highest rate of entrants to priority occupations of the sectors, and the highest rate for any pathway in any priority sector. Apprenticeships cover specific roles within the sector identified as priority occupations, including pharmacy technician and senior healthcare support worker.
Table 5: Adult social care - key routes related to priority occupations for the adult social care sector
| Pathway | Subject area | Level group | Number of education leavers entering priority occupations | Percentage of employed education leavers entering priority occupations |
|---|---|---|---|---|
| Apprenticeship | Health and social care | Level 2/3 | 3,490 | 33% |
| Higher Education | Health and social care | Level 6+ | 2,870 | 33% |
| Apprenticeship | Health and social care | Level 4/5 | 900 | 31% |
| Apprenticeship | Nursing and subjects and vocations allied to medicine | Level 4/5 | 420 | 23% |
| Further Education | Health and social care | Level 2/3 | 1,090 | 14% |
| Further Education | Sociology and social policy | Level 2/3 | 400 | 10% |
Source: Skills England estimates based on internal modelling for employment in 2022/23 tax year. Further details can be found in the Skills Needs Assessments technical annex.
The 6 routes in Table 5 routes account for 55% of entrants from education into priority occupations for adult social care. This shows that although the subject areas important for adult social care are narrow, the level and pathway are varied and include apprenticeships, higher education and further education (including T Levels). Individual pathways have lower rates of entrants into priority occupations than other sectors.
Note: the higher education health and social care Level 6+ route includes the top courses identified from our analysis as pathways into the ‘social worker’ occupation. Further information on routes into this occupation can be found through Skills for Care’s Social work education in England report 2026, based on analysis of Higher Education Statistics Agency (HESA) data.
Some newer training routes are not included in the historic data, including newer apprenticeship standards and Skills Bootcamps. Overall, based on the Skills England Occupational Maps, there are 41 apprenticeship standards linked to priority occupations in health and 6 for adult social care. Skills for Care provide further information on apprenticeships in adult social care.
As a limitation to our analysis on important routes for the adult social care sector, engagement with the sector has indicated that very few people come directly from education into adult social care. Analysis from Skills for Care has found that 53% of recruitment in the sector was from within adult social care. DHSC note that apprenticeships are used in the sector to support career progression for existing workers. Skills for Care report that, in 2024 to 2025, over three quarters (83%) of adult social care apprenticeship starters were aged over 24, compared to 51% for all apprenticeships.
6.2 Trends in training routes
We can get a sense of how supply into priority occupations is changing by looking at the number of learners successfully completing a course (defined as ‘achievements’) that is aligned with these occupations. Where courses have grown in achievement numbers, this could suggest that these courses will continue to be key pathways into priority occupations in the sector. Table 6 and Table 7 gives an overview of the change in achievement figures for the key routes over the 2 years between 2021 to 2022 and 2023 to 2024.
Table 6: Health - Growth in achievements for key routes related to priority occupations
| Pathway | Subject area | Level group | Achievements in 2023 to 2024 | Growth in achievements since 2021 to 2022 |
|---|---|---|---|---|
| Higher Education | Allied health | Level 6+ | 27,180 | +27% |
| Higher Education | Nursing and midwifery | Level 6+ | 32,670 | +18% |
| Higher Education | Medicine and dentistry | Level 6+ | 18,670 | +13% |
| Higher Education | Psychology | Level 6+ | 35,500 | +10% |
| Higher Education | Medical sciences | Level 6+ | 16,370 | +9% |
| Higher Education | Pharmacology, toxicology and pharmacy | Level 6+ | 8,340 | +8% |
| Apprenticeship | Health and social care | Level 2/3 | 13,920 | +1% |
Source: Figures provided by the Department for Education
Growth is steady across all higher education subject areas, with allied health seeing the highest growth rate. There has also been a relatively high level of growth in nursing and midwifery and medicine and dentistry. Apprenticeships have been relatively stable, with only minimal growth over the same period.
Table 7: Adult social care - growth in achievements for key routes related to priority occupations
| Pathway | Subject area | Level group | Achievements in 2023 to 2024 | Growth in achievements since 2021 to 2022 |
|---|---|---|---|---|
| Apprenticeship | Nursing and subjects and vocations allied to medicine | Level 4/5 | 3,140 | +54% |
| Apprenticeship | Health and social care | Level 4/5 | 4,690 | +20% |
| Higher Education | Health and social care | Level 6+ | 17,820 | +18% |
| Further Education | Sociology and social policy | Level 2/3 | 23,380 | +12% |
| Apprenticeship | Health and social care | Level 2/3 | 13,920 | +1% |
| Further Education | Health and social care | Level 2/3 | 20,760 | -24% |
Source: Figures provided by the Department for Education
Note: Further Education figures for level 2/3 cover full level 2/3 only.
There has been strong growth in apprenticeships at level 4/5 for both nursing and health and social care. For health and social care at level 2/3, apprenticeship achievements have been stable, and in further education achievements fell by a quarter.
There were also 700 learners that successfully completed Skills Bootcamps linked to health and adult social care in 2023 to 2024, an increase compared to 240 in 2022 to 2023.