Sector Skills Needs Assessment – Digital and technologies
Updated 6 October 2026

© Crown copyright 2026
This publication is licensed under the terms of the Open Government Licence v3.0 except where otherwise stated. To view this licence, visit nationalarchives.gov.uk/doc/open-government-licence/version/3 or write to the Information Policy Team, The National Archives, Kew, London TW9 4DU, or email: psi@nationalarchives.gov.uk.
Where we have identified any third party copyright information you will need to obtain permission from the copyright holders concerned.
This publication is available at https://www.gov.uk/government/publications/skills-england-annual-skills-report-and-sectoral-skills-needs-assessments-2026/sector-skills-needs-assessment-digital-and-technologies
1. Handling notes
The SNAs use occupations, as defined by Standard Occupation Classification (SOC) codes, to provide an indication of the skills needs for the sectors. These allow for a consistent approach and cross-sector comparison. However, they are an approximation and do not work for all types of employment, particularly in highly specialised and emerging roles, such as in the digital and technologies sector. In addition to SOC codes, we have expanded our methods to use the newly developed UK Standard Skills Classification (SSC) to identify the skill areas relevant for priority occupations. This is the first step for assessing the future demand for skills across key sectors in terms of both occupations and specific skills areas. Nevertheless, specialist and emerging occupations within the digital and technologies sector may not align perfectly with the predominant skills identified using the UK SSC.
All estimates of future employment and skills are highly uncertain and their inclusion here is not for making precise forecasts of employment levels. Rather, the aim is to provide information about the general nature of changing employment patterns and their implications for skill requirements. The projections should be regarded as indicative of general trends and orders of magnitude, given the assumptions set out in section 5 below.
The Standard Industrial Classification (SIC) system does not fully capture the detail and fast-changing nature of the digital and technologies sector, and this analysis uses a set of SIC codes as a proxy for the sector. Analysis in this report uses the SIC definition as previously published in the digital and technologies Sector Plan (published in June 2025). DSIT is developing an updated SIC proxy definition for the digital and technologies sector as part of a statistical release (due to be published in June 2026). Therefore, the analysis within this report should be treated as indicative rather than the latest representation of the sector.
The data and methodology used to create the Skills Needs Assessments are set out in the accompanying tables and technical annex published alongside this report.
2. Executive summary
According to analysis from Skills England and the Department for Science and Technology, employment demand is expected to increase substantially, with the 30 priority occupations within the digital and technologies sector projected to grow by 239,000 jobs (27%) between 2025 and 2035. In addition, an estimated 249,000 workers are expected to leave these priority occupations over this period and will need to be replaced, bringing total demand to around 488,000 workers.
These roles typically require higher than average proficiency in digital literacy, creating, and learning and investigating, alongside strong problem solving and decision making. The majority of projected additional employment (89%) in priority occupations requires qualifications at level 4 and above, a substantially higher proportion than across all priority occupations (62%). Many priority occupations overlap with other sectors covered in the Skills Needs Assessments: 25 of the 30 priority occupations are shared with at least one other sector, particularly in digital and engineering roles, increasing competition for talent. There is considerable uncertainty around how AI adoption may affect future demand, particularly for digital occupations generally, which are among those with the highest projected growth.
Priority occupations in the sector are already experiencing strong labour market pressure, with around two-thirds (68%) in critical or elevated demand across the UK economy. This includes 25% of occupations in critical demand, indicating that demand pressures are already acute.
AI adoption in the digital and technologies sector is accelerating, reshaping job roles and workflows. Evidence points to a shift away from routine coding and testing tasks towards oversight, assurance, judgement, and communication, supported by AI-enabled tools. As a result, skills demand is evolving, with growing emphasis on adaptability, accountability, collaboration, and the effective use of AI alongside technical expertise.
Historically, the most important education pathways into priority occupations relevant to the sector have been at level 6 and above, supported by apprenticeships across multiple levels. Key higher education routes are concentrated in computing, with smaller but still important contributions from engineering, mathematical sciences, and economics. Apprenticeships in digital technology (practitioners) at levels 2 to 5 also play a large role in supplying entrants.
Growth in training provision relevant for digital and technologies priority occupations has been strongest in digital pathways. Between 2021 to 2022 and 2023 to 2024, achievements increased by 46% to 82% for digital technology apprenticeships (varying by level groups) and by 40% for higher education computing. Growth in more traditional routes such as engineering, mathematical sciences, and economics was considerably lower, at around 6% to 7%.
3. Workforce overview and demographics
The digital and technologies sector is a core driver of UK productivity and economic growth. In 2023, it was estimated that digital and technologies employed 2.6 million people across the UK and accounted for around £207 billion GVA.
For the purposes of this assessment, the digital and technologies sector includes, but is not limited to, the below:
- digital
- advanced connectivity technologies
- artificial intelligence (AI)
- cybersecurity
- engineering biology
- quantum technologies
- semiconductors
The sector supports growth by driving innovation, enabling the adoption of emerging technologies, and improving productivity across the economy. It will play a central role in delivering wider government priorities, including AI adoption, economic resilience, national security, and competitiveness in high-growth technologies.
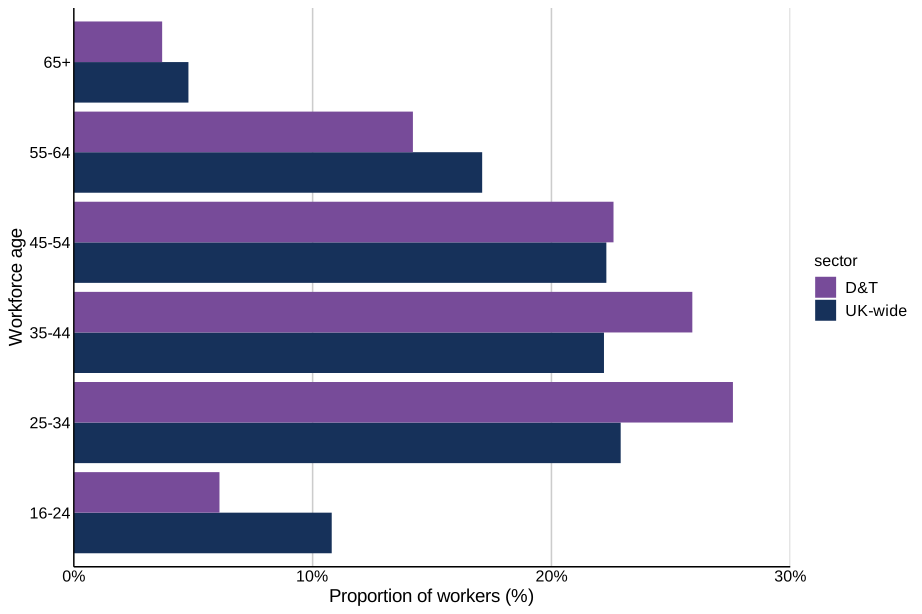
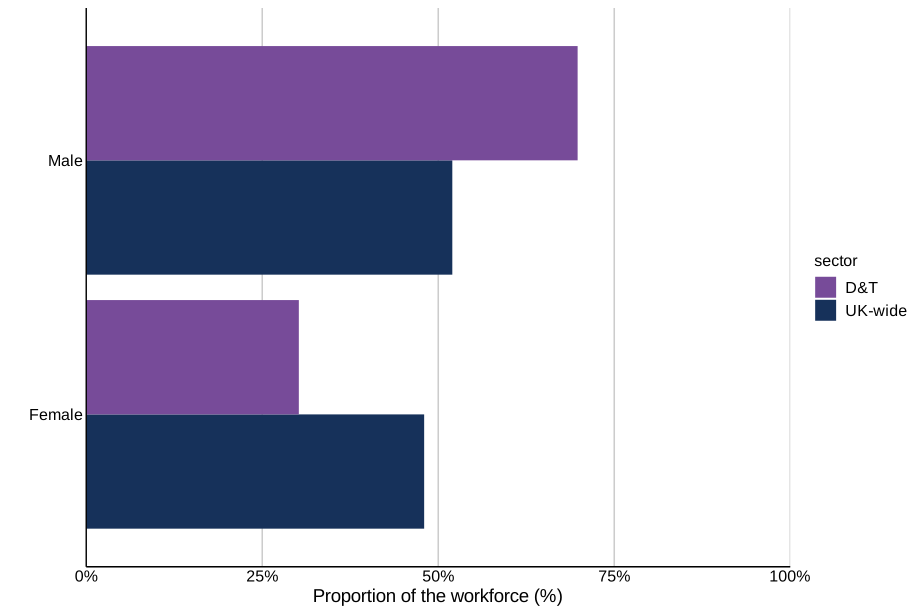
The demographics of the sector indicate a young sector, with over a quarter of employees aged between 25 to 34, 4.7 percentage points higher the UK average (22.9%). As shown in Figure 1, there is also a correspondingly lower proportion of workers 55+ in comparison to the wider UK workforce. As shown in Figure 2, the sector is also markedly male-dominated, with close to 70% of workers being male. Note: these demographic breakdowns are based on Standard Industrial Classification (SIC) analysis of Annual Population Survey (APS) data and should be used with caution.
Figure 1: Age distribution for the digital and technologies (D&T) workforce compared to economy-wide employment in 2025
Source: Annual Population Survey 2025
Figure 2: Sex distribution for the digital and technologies (D&T) workforce compared to UK-wide employment in 2025
Source: Annual Population Survey 2025
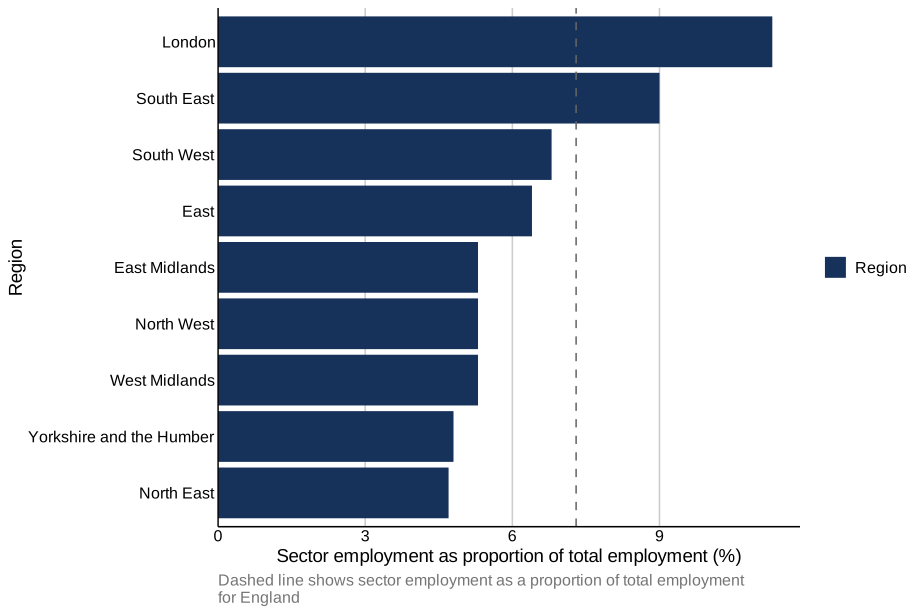
Based on employment estimates from the Business Register and Employment Survey (BRES) 2024 (for England only), London has the highest share of employment in the digital and technologies sector at 11.3%, considerably above the South East (9.0%) and the England average of 7.3%. This is shown below in Figure 3. All other regions fall below the England average. Yorkshire and the Humber (4.8%) and the North East (4.7%) show the lowest concentrations.
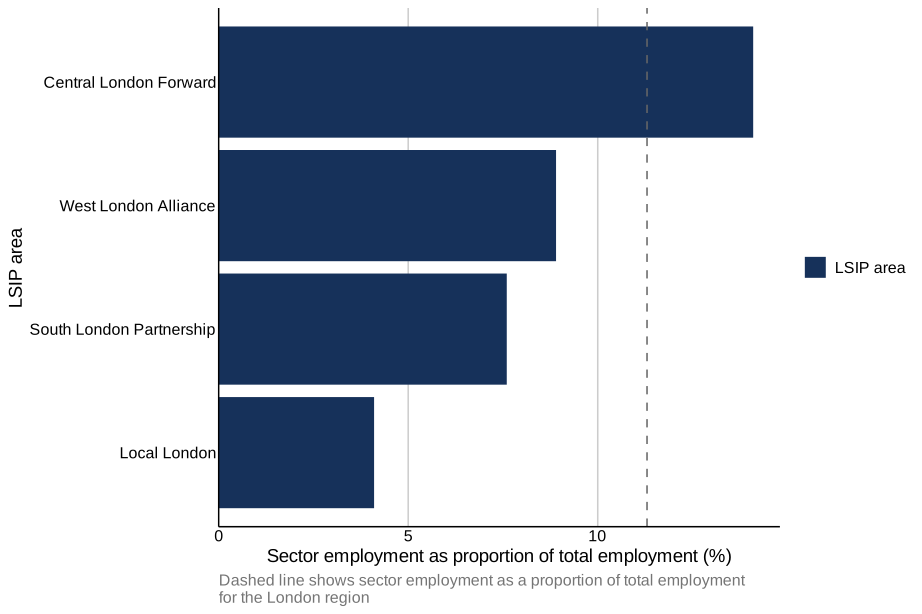
Within London, analysis by Local Skills Improvement Plan (LSIP) geographies show that the Central London Forward LSIP geography stands out amongst the 4 London LSIP geographies (Figure 4). In the Central London Forward LSIP geography 14.1% of total employment is in the digital and technologies sector, making it one of the UK’s leading digital hubs. In the South East region, Thames Valley Berkshire LSIP geography has the highest concentration at 16.1%. Oxfordshire (12.0%), Buckinghamshire (9.8%), and Surrey (9.6%) LSIP geographies show similarly strong profiles.
Figure 3: Share of total employment in the digital and technologies Sector, by English regions in 2024
Source: Business Register and Employment Survey (BRES) 2024
Figure 4: Share of total employment in the digital and technologies sector across all London LSIP geographies in 2024
Source: Business Register and Employment Survey (BRES) 2024
Note: BRES primarily captures VAT- and PAYE-registered businesses and may therefore under-represent sectors with high numbers of freelancers or micro-businesses. As a result, apparent regional concentrations may reflect the location of larger employers rather than the full distribution of sectoral employment.
4. Priority occupations
4.1 Priority occupations
Skills England has been working with the Department for Science, Innovation and Technology (DSIT) to identify occupations of importance to their sector. Priority occupations were identified by analysing job adverts for digital and STEM skill demand and recruitment intensity, ranking roles by labour market tightness, and validating the results with sector-specific qualitative and policy insight.
There are 30 identified priority occupations for digital and technologies, 25 of which overlap with at least one other sector covered by the Skills Needs Assessments. There are 11 priority occupations which overlap with at least one other sector, including:
- programmers and software development professionals (selected as a priority by 7 sectors including digital and technologies)
- IT business analysts, architects and systems designers (selected by 6 sectors)
There are 5 digital and technologies priority occupations which were only selected by this sector:
- IT project managers
- IT quality and testing professionals
- IT network professionals, database administrators and web content technicians
- computer system and equipment installers and servicers
The sectors with which digital and technologies has the most overlap in terms of priority occupations are life sciences, advanced manufacturing, defence, and financial services.
Table 1: Digital and technologies priority occupations appearing in at least two other sectors besides digital and technologies
| Occupation | Number of sectors including digital and technologies |
|---|---|
| Programmers and software development professionals | 7 |
| IT business analysts, architects and systems designers | 6 |
| Electrical engineers | 4 |
| Electronics engineers | 4 |
| Production and process engineers | 4 |
| IT managers | 4 |
| Engineering technicians | 4 |
| Information technology directors | 3 |
| Engineering project managers and project engineers | 3 |
| Quality assurance technicians | 3 |
| IT user support technicians | 3 |
Of the priority occupations in digital and technologies, 25% are in critical demand (substantially higher demand than usual) and 68% are in either critical or elevated demand (above average). This is based on Skills England’s Occupations in demand analysis, published in 2025. This illustrates a high level of current demand experienced in the priority occupations identified by the sector.
4.2 Demand for skills
The UK’s first Standard Skills Classification (SSC) provides a mapping of relevant skill areas to occupations. Using an initial prototype of the SSC, experimental analysis was conducted to identify the skill areas which are relevant to priority occupations. Across the priority occupations in the digital and technologies sector, the top 3 technical skill areas are:
- developing and deploying applications
- installing, integrating, securing and maintaining digital technology systems
- developing digital technology specifications, controls and policies
Core Skills
The SSC also sets out 13 ‘Core Skills’, which are fundamental abilities that contribute to the capability to carry out the tasks associated with a specific job, such as numeracy, reading, and writing. They are often transferable, meaning they can be applied across different sectors of activity and roles. The SSC provides proficiency scores for core skills by occupation, on a 1 to 5 scale from minimal proficiency to expert proficiency.
The 13 Core Skills defined in the UK Standard Skills Classification (SSC) are listed below. These are foundational, transferable abilities required across occupations, and they are listed explicitly in the SSC Core Skills Explorer.
- planning and organising – setting goals, prioritising tasks, structuring approaches
- adapting – adjusting strategies or behaviour to new or changing situations
- working with others – collaborating effectively with teams or groups
- listening – understanding spoken communication, including non-verbal cues
- speaking – communicating clearly and confidently through speech
- leadership – motivating, guiding, and inspiring others
- learning and investigating – searching for, gathering, and understanding new information
- creating – developing original ideas, innovations, or solutions
- problem-solving and decision-making – identifying issues, analysing information, selecting solutions
- numeracy – applying mathematical techniques and interpreting numerical data
- digital literacy – using digital tools and technologies effectively (including AI)
- reading – interpreting written information accurately
- writing – communicating ideas clearly and persuasively in written form
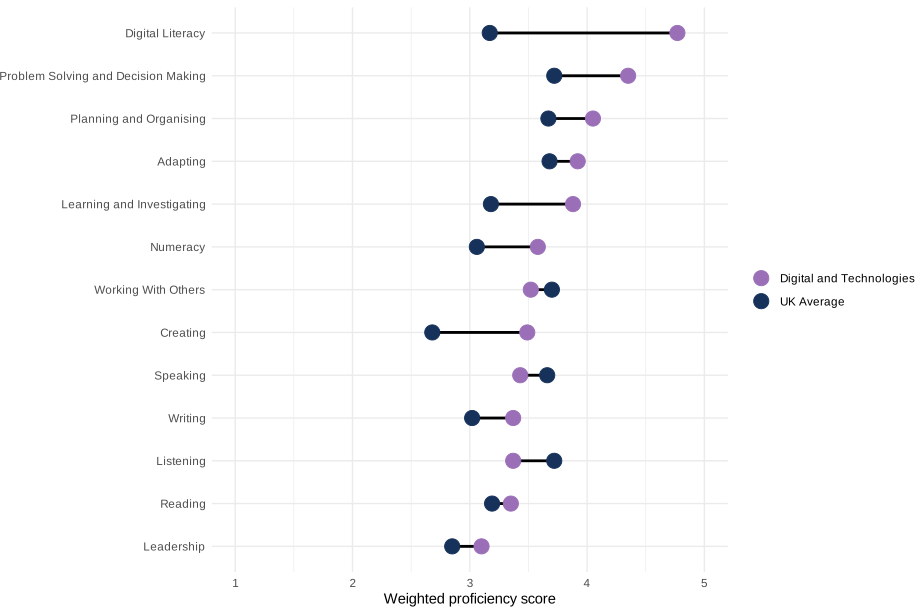
The required proficiency in core skills for the priority occupations in the digital and technologies sector have been compared to the UK weighted average across all occupations in the economy. Where core skills have a higher required proficiency in these priority occupations, this suggests that these skills are particularly important for these occupations. The graph below shows which core skills are important for the digital and technologies sector compared to the wider UK economy.
Digital and technologies requires notably higher proficiency in the core skills
- digital literacy (4.8 versus 3.2)
- learning and investigating (3.9 versus 3.2)
- creating (3.5 versus 2.7)
Figure 5: Core skills proficiency for the digital and technologies sector compared to the UK
Source: Skills England analysis using the UK Standard Skills Classification
5. Future demand for priority occupations
Within the digital and technologies sector, employment demand for priority sectors is projected to grow by 239,000 (27%) between 2025 and 2035.
Due to the fast-changing nature of the sector and the methodological limitations of modelling employment demand, projections carry a substantial degree of uncertainty and should be considered as illustrative only.
5.1 Top occupations by employment growth to 2035
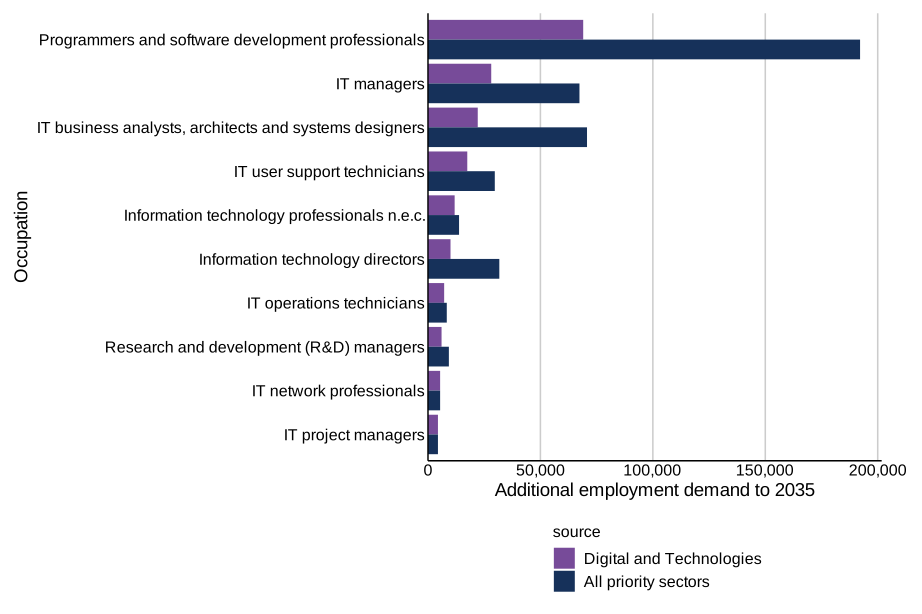
As seen in Figure 6, the occupation with the highest projected employment demand is Programmers and software development professionals, with 69,000 additional workers needed in digital and technologies between 2025 and 2035. This occupation also faces demand from other priority sectors. The total projected employment demand for Programmers and software development professionals across all priority sectors, including digital and technologies, is 192,200 workers. Note: Figure 6 combines projections from across the priority sectors, each of which has been calculated using a different methodology. Also, growth in this occupation may be distinctly affected by the increasing use of AI (for example, through the shift away from routine coding mentioned below) but evidence for changes in employment level is currently weak.
Projected employment demand has been estimated by weighting ASHE occupation-level employment data to the digital and technologies sector using SIC/SOC mappings, then projecting all occupations forward using a long-run digital sector growth rate derived from historic employment trends. An assumption is made that employment for digital and technologies priority occupations grows at the same average rate between 2025 and 2035 as that observed in the closely related digital sector between 2011 and 2024. Note: projections carry a substantial degree of uncertainty and should be considered as illustrative only.
Figure 6: Top 10 priority occupations in the digital and technologies sector by additional employment to 2035
Source: Sector projections provided by the Department for Science, Innovation and Technology
Note: The figures for all priority sectors combine projections from across the priority sectors, each of which has been calculated using a different methodology.
5.2 Expected qualification levels
The majority (89%) of projected additional employment in priority occupations for the digital and technologies sector requires workers with qualifications at level 4 and above. This is higher than across all priority occupations in all priority sectors, where 62% projected additional employment requires workers who are qualified at level 4 and above.
Table 2: Expected qualification level of workers needed to meet demand to 2035 in priority occupations
| Priority Occupations | Level 2 or 3 | Level 4 or above |
|---|---|---|
| Digital and technologies priority occupations | 11% | 89% |
| All priority occupations | 38% | 62% |
Source: Skills England planning scenarios based on sector-level projections
5.3 Alternative scenarios
Any future projection of how the economy will evolve is inherently uncertain. This uncertainty increases the further forward the projection extends. To improve the understanding of the uncertainty in the skills assessment projections, Skills England asked the sponsoring department to provide an alternative scenario. The total job growth in the alternative scenario is shown in Table 3 below. This alternative scenario has been calculated by applying baseline growth rates from economy-wide projections to ASHE data, apportioning results to the sector using SIC/SOC mappings.
In the alternative scenario, growth in priority occupations is lower (93,200) compared to the central scenario (239,300). The growth rate in the alternative scenario is 11%, which is 16 percentage points lower than the central scenario (27%).
Table 3: Central and alternative demand scenarios for digital and technologies
| Scenario | Increase in employment demand from 2025 to 2035 | Percentage change in employment demand from 2025 to 2035 |
|---|---|---|
| Central | 239,300 | 27% |
| Alternative | 94,100 | 11% |
Numbers rounded to nearest 100
Source: Projections provided by the Department for Science, Innovation and Technology.
Note: Where priority occupations were projected to decrease from 2025 to 2035, we have kept the change in employment demand for these occupations as zero.
The uncertainty in many of the projections is much greater currently due to the accelerated adopting of AI technology. Such technology will increase the productivity of many jobs and possible reduce the demand for new workers in affected occupations. The speed of such changes will be uneven across the economy and very uncertain.
The uncertainty caused by AI has been a particular issue for the assessment of the digital and technologies sector. For the purposes of this assessment, we have not adjusted the projections provided by sector experts to take account of AI adoption as the evidence for changes is not currently strong. However, it needs to be recognised that there is a heightened risk that projections of AI-exposed occupations including digital occupations are too high. Skills England intends to conduct some further work over the next year to understand the risks more fully.
5.4 Replacement demand
In addition to expansion demand, where we consider the additional workers needed due to expected future sector growth, there is also demand for workers required to replace existing workers in the labour market. This is known as replacement demand. This is a broad estimate, based on applying rates from economy wide projections.
Our analysis focusses on expansion demand and assumes current supply is sufficient to maintain the existing size of the workforce. In practice, this will not be the case for some occupations.
Each year we estimate an average of 24,900 workers needing to be replaced within priority occupations in digital and technologies. Over the 10-year period of 2026 to 2035, the total estimated replacement demand is 249,000 workers.
This increases the total demand for workers. When combining this with total additional employment demand to 2035 (239,000), the total demand for workers in digital and technologies is 488,000. Note: these figures are rounded to the nearest thousand.
6. Influence of AI on the digital and technologies sector
As AI adoption moves from widespread generative tools toward more autonomous, agentic systems, change is accelerating across coding, assurance, and core digital workflows. Evidence from the digital and technologies sector shows a shift away from routine coding and testing tasks toward roles focused on oversight, verification, and communication, alongside broader redesign of workflows. This may impact the growth in digital occupations in the digital and technologies sector, particularly in an occupation like programmers and software development professionals. These influences are uneven, shaped by firm size and organisational maturity (upcoming publication: What Works for AI Upskilling in the UK).
AI is changing work in the digital and technologies sector by shifting where value sits. As AI becomes routine, employers place greater weight on judgement, accountability, and the ability to use it well within organisations. This is reshaping roles, collaboration, and progression, as responsibility moves towards guiding and owning AI-enabled outcomes rather than producing tasks directly (AI skills for the UK workforce - GOV.UK and deep dives with stakeholders).
Skills England commissioned Dr Nisreen Ameen to develop an AI Skills tools package. As part of this, evidence from deep-dive workshops with sector leads and Skills England’s research and analysis report on AI skills for the UK workforce shows that there are several areas of skills demand that are particularly impacted by AI:
- code generation and translation are now mainstream, and agentic systems increasingly review, merge and deploy code, elevating human QA/verification as core responsibilities
- process automation beyond engineering (low/no code across HR, finance, and operations) expands jobs that support, enable or leverage technology, without requiring deep technical expertise but require AI literacy and prompt interrogation
- role reconfiguration - new hybrid AI-augmented roles emphasise oversight, assurance, orchestration, and cross functional collaboration
The demand for skills is changing with demand for AI-related competencies growing far faster than traditional skills. PwC’s AI Jobs barometer showed that AI-exposed roles such as those in the digital sector are changing 66% faster than other roles. However, there are substantial disparities in access to training particularly among SMEs (upcoming publication: What Works for AI Upskilling in the UK). In addition, a 2025 survey by Harvey Nash reports that 52% of UK tech leaders faced an AI skills gap – up from 20% in 2024.
Dr Ameen’s research also shows that shows that AI skills in demand can be mapped to 3 broad domains:
Technical skills
- using machine-learning-assisted development tools and low/no-code automation, code comprehension
- agent QA
- data/metadata literacy
- API orchestration
- applied analytics
- data interpretation
- simulation assisted development
- assisted development
Non-technical skills
- communicating AI-generated outputs across technical and nontechnical teams
- managing change
- commercial awareness
- continuous learning
Responsible and ethical skills
- governing and assuring
- creating audit trails
- bias testing
- transparency and explainability
- data protection and IP awareness,
- inclusive design
7. Education supply
As part of this assessment, we have considered the supply of workers in priority occupations relevant to the digital and technologies sector. Employment in the sector is influenced by a range of joiners (inflows) and leavers (outflows), as illustrated in Figure 7. This analysis focuses on one component of supply: inflows from education.
Education inflows capture individuals who move from education into employment in priority occupations. This group is predominantly made up of career starters, while also including a smaller number of job switchers and individuals returning to work. Taken together, these flows provide a comprehensive and consistent indicator of the pipeline of new talent entering priority occupations and form a reliable basis for understanding the contribution of the education system to workforce supply.
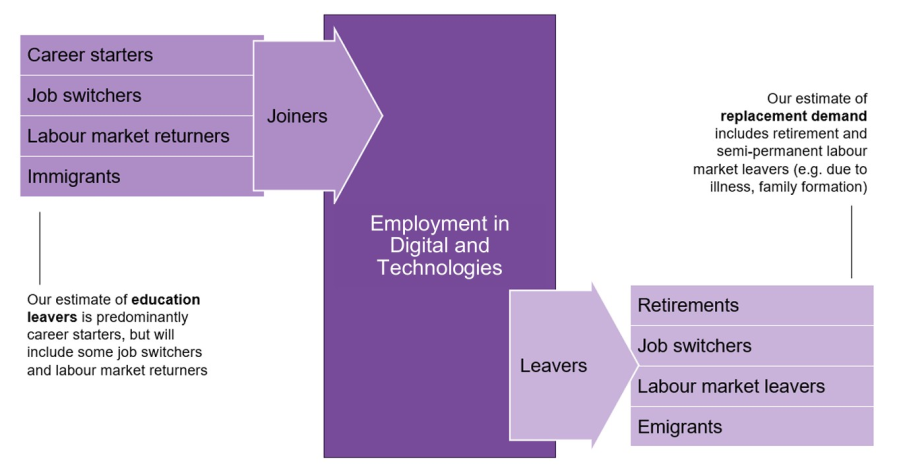
Figure 7 is a stock and flow diagram showing how people join the Digital and Technologies sector, listed as career starters, job switchers, returners, immigrants. It then shows what makes them leave: retirements, job switchers, leavers, emigrants. For joiners, the diagram states that Skills England’s estimate of education leavers is predominantly career starters, but will include some job switchers and labour market returners. For leavers, the diagram outlines that Skills England’s estimate of replacement demand includes retirement and semi-permanent labour market leavers (for example, due to illness, family formation).
7.1 Important training routes
There are multiple routes by which people enter employment in a given occupation. Using information on historic pathways into these occupations and the Skills England Occupational Maps, we have identified the most prominent routes that provide direct supply into priority occupations identified for the digital and technologies sector. The routes relate to entry into priority occupations for the digital and technologies sector, but these occupations can cover all industries and are not specific to employment in the digital and technologies sector. These routes are summarised in Table 4.
Training routes have been selected by considering the volume of entrants to priority occupations identified for the sector and what proportion this is of all employed education leavers for that training route. Training routes with a high volume and proportion relative to other training routes are selected.
These broadly split into 3 types of courses:
- well-aligned routes, often technical in nature, where a high proportion of education leavers progress into priority occupations, but sometimes with small cohorts
- balanced routes, where a reasonable proportion of leavers progress into priority occupations from a larger cohort
- high-volume routes, where a smaller proportion of leavers progress to priority occupations but contribute a large share of employment
Not all 3 course types are present in all sectors. For well-aligned routes, increasing the supply into priority occupations will likely require an increase in enrolments. Whereas for other routes that are less well-aligned, increasing the progression rates to priority occupations may be more effective.
Table 4: Key routes related to priority occupations for the digital and technologies sector
| Pathway | Subject area | Level group | Number of education leavers entering priority occupations | Percentage of employed education leavers entering priority occupations |
|---|---|---|---|---|
| Apprenticeship | Digital technology (practitioners) | Level 4/5 | 1,040 | 59% |
| Apprenticeship | Digital technology (practitioners) | Level 6+ | 600 | 59% |
| Higher Education | Computing | Level 6+ | 7,230 | 58% |
| Apprenticeship | Digital technology (practitioners) | Level 2/3 | 2,200 | 56% |
| Higher Education | Engineering | Level 6+ | 3,520 | 26% |
| Higher Education | Mathematical sciences | Level 6+ | 970 | 24% |
| Higher Education | Economics | Level 6+ | 790 | 16% |
Source: Skills England estimates based on employment in 2022 to 2023 tax year
Note: The routes relate to entry into the priority occupations identified by DSIT but, as these occupations can span multiple sectors beyond digital and technologies, this analysis is not strictly specific to employment in the digital and technologies sector.
The 7 routes in Table 4 account for 44% of education leavers entering priority occupations for the digital and technologies sector. This includes level 6+ higher education and apprenticeships. The key subjects are digital and computing across a range of education levels. Other numerate subjects in higher education also provide entrants to priority occupations for the sector, though at a far lower rate.
Some newer training routes are not included in the historic data, including newer apprenticeship standards and Skills Bootcamps. Overall, based on the Skills England Occupational Maps, there are 108 apprenticeship standards linked to priority occupations in the sector. There have been 6 newly introduced apprenticeship standards since August 2022 that cover established roles, such as data engineer, and emerging roles with an AI focused apprenticeship standard. In the 2024 to 2025 data, the majority of achievements on live standards were in digital technology (practitioners) (57%), and engineering (27%) and over half were at level 3. Engineering is not included, as the main standards driving the achievements numbers are more specific to aerospace and national infrastructure such as electricity generation.
7.2 Trends in training routes
We can get a sense of how supply into priority occupations is changing by looking at the number of learners successfully completing a course (defined as ‘achievements’) that is aligned with these occupations. Where courses have grown in achievement numbers, this could suggest that these courses will continue to be key pathways into priority occupations in the sector. Table 5 gives an overview of the change in achievement figures for the key routes over the 2 years between 2021 to 2022 and 2023 to 2024.
Table 5: Growth in achievements for key routes related to priority occupations
| Pathway | Subject area | Level group | Achievements in 2023 to 2024 | Growth in achievements since 2021 to 2022 |
|---|---|---|---|---|
| Apprenticeship | Digital technology (practitioners) | Level 4/5 | 4,190 | +82% |
| Apprenticeship | Digital technology (practitioners) | Level 2/3 | 6,960 | +49% |
| Apprenticeship | Digital technology (practitioners) | Level 6+ | 1,840 | +46% |
| Higher Education | Computing | Level 6+ | 50,280 | +40% |
| Higher Education | Engineering | Level 6+ | 43,080 | +7% |
| Higher Education | Mathematical sciences | Level 6+ | 13,500 | +7% |
| Higher Education | Economics | Level 6+ | 17,710 | +6% |
Source: Figures provided by the Department for Education
There were also 7,380 learners that achieved digital skills bootcamps in 2023 to 2024, an increase compared to 6,850 in 2022 to 2023.
There has been strong growth across the digital and computing routes across both apprenticeships and level 6+ higher education. Growth has been strongest in digital technology apprenticeships, especially at levels 4 and 5, followed by levels 2 and 3. While overall achievement volumes for apprenticeships remain far lower than higher education courses, growth has been faster, indicating that apprenticeships are becoming an increasingly important pathway for supplying priority occupations. The other subject areas have also grown, but at a more modest rate.