Self-Employment Income Support Scheme statistics: August 2020
Updated 2 September 2020

© Crown copyright 2020
This publication is licensed under the terms of the Open Government Licence v3.0 except where otherwise stated. To view this licence, visit nationalarchives.gov.uk/doc/open-government-licence/version/3 or write to the Information Policy Team, The National Archives, Kew, London TW9 4DU, or email: psi@nationalarchives.gov.uk.
Where we have identified any third party copyright information you will need to obtain permission from the copyright holders concerned.
This publication is available at https://www.gov.uk/government/statistics/self-employment-income-support-scheme-statistics-august-2020/self-employment-income-support-scheme-statistics-august-2020
This publication covers the number and value of claims made to the Self-Employment Income Support Scheme (SEISS) administered by HM Revenue and Customs’ (HMRC) up to 31 July 2020.
The release is classified as Experimental Statistics as the methodologies used to produce the statistics are still in their development phase. As a result, the data are subject to revision. These statistics have been produced quickly in response to developing world events. The Office for Statistics Regulation, on behalf of the UK Statistics Authority, has reviewed them against several key aspects of the Code of Practice for Statistics and regards them as consistent with the Code’s pillars of Trustworthiness, Quality and Value.
Contact details
For queries or feedback on this publication, please email seiss.statistics.enquiries@hmrc.gov.uk.
For press queries, please contact:
- Dan Allen, tel: 03000 585 024
- Lisa Billard, tel: 07773 091 264
Next release
The next release will be published on 18 September 2020.
Main findings
-
Around 5 million individuals reported self-employment income for the tax year 2018 to 2019, and had their data assessed for potential SEISS eligibility. In order to be assessed, a self-employed individual needed to have traded in the tax year 2018 to 2019 and submitted a Self Assessment tax return on or before 23 April 2020 for that year.
-
Via this process, 3.4 million self-employed individuals were identified as potentially eligible for the SEISS scheme. This means that they met the criteria for the scheme based on Self Assessment returns from 2018 to 2019 and earlier years. However, some of the potentially eligible businesses will not have been adversely affected by Coronavirus or have ceased trading since 2018 to 2019 so will not have been eligible.
-
By 31 July 2.60 million (77%) of the potentially eligible population had claimed a SEISS grant with the value of these claims totalling £7.6 billion. This compares to 2.55 million claims made and £7.4 billion claimed by 30 June, as published in the statistics in July.
-
The average value per claim was £2,900
- Around two-thirds of the potentially eligible population are male (2.3 million).
- A lower proportion of potentially eligible females have claimed a SEISS grant (71%) compared to males (79%).
- The average claim for females is also lower at £2,300 compared to the average claim for males of £3,200.
-
Around 90% of claimants are aged between 25 and 64 and take-up of the grant in those age groups is at or above 76% - no one age group dominates and claims are evenly spread.
-
The sector with the highest number of potentially eligible individuals and the highest proportion of claims is the construction industry. By 31 July, construction workers had made 884,000 claims for SEISS totalling £3.1 billion.
-
The two regions with the highest number of claims are London (498,000) and the South East (379,000), reflecting their relative sizes.
- Of the 1.6 million that did not meet the SEISS criteria, 1.4 million (88%) had trading profits less than non-trading profits (for example income from employment or investment income), 0.5 million (33%) had trading profits of £0 or made a loss and 0.2 million (11%) had trading profits over £50,000 (Note - Individuals may be counted more than once if they have trading profits which meet more than one of these criteria which explains why the figures sum to more than 1.6 million).
About this release
The Self-Employment Income Support Scheme (SEISS) provides support for self-employed individuals whose business has been adversely affected by Coronavirus (COVID-19). From 13 May eligible self-employed individuals could claim a grant worth 80% of their average monthly trading profits, paid out in a single instalment covering three months’ worth of profits, and capped at £7,500 in total.
The data used in this release cover claims to the SEISS scheme up to 31 July 2020. This data has been matched with other HM Revenue and Customs (HMRC) data to present breakdowns of claims by:
- age and gender
- sector of the economy
- geography
SEISS claims and eligibility
Around 5 million individuals who reported income from self-employment were assessed for SEISS: 3.4 million of these were found to be potentially eligible and 1.6 million were found to be ineligible.
Eligibility for SEISS required an individual to have levels of income which met specific tests on: - their 2018 to 2019 tax year income, or - the combination of income for consecutive tax years 2016 to 2017, 2017 to 2018, and 2018 to 2019 where available
Figures below represent all criteria that apply to each individual from both sets of tests. Additionally, within each element individuals can be ineligible for multiple reasons and, as a result, there is a high level of overlap between the categories presented below.
Of the 1.6 million individuals who were assessed to be ineligible: - 88% (1,435,000) had a trading profit that was less than their non-trading income - 33% (543,000) had a trading profit £0 or less - 11% (186,000) had trading profit exceeding £50,000 per year - 2% (31,000) were ineligible for other reasons
Between 13 May and 31 July 2020, HMRC received 2.6 million claims for the Self-Employment Income Support Scheme (SEISS) from a total potentially eligible population of 3.4 million. These claims totalled £7.6 billion with an average award of £2,900 per claimant.
SEISS claims by gender
Figure 1 shows the number of SEISS claims and the potentially eligible population by gender. Table 1 also shows claim values by gender.
Of 5.04 million individuals who were assessed for potential eligibility, men make up around two-thirds (65%), and also make up a slightly higher proportion (68%) of the potentially eligible population.
By 31 July HMRC had received 1,842,000 claims from men totalling £5.8 billion compared to 759,000 claims from women for £1.7 billion. Males have a higher take-up rate than females (79% compared to 71%) and their average grant value (£3,200) is 39% higher than the average for females (£2,300).
Figure 1: The SEISS potentially eligible population and SEISS claims to 31 July 2020 by gender
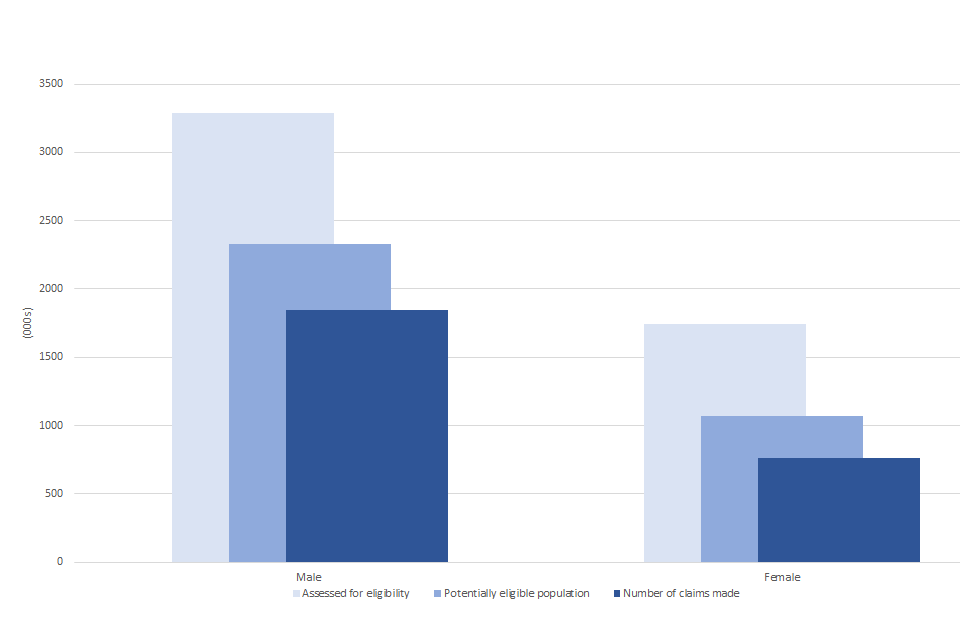
A chart showing the number of claims received and the potentially eligible population by gender
Source: HM Revenue and Customs Self-Employment Income Support Scheme linked to Self Assessment taxpayer information
Table 1 - SEISS potentially eligible population, number and value of claims by 31 July 2020, by gender
| Gender | Assessed for potential eligibility | Total potentially eligible population | Total no. of claims made | Total value of claims made | Average value of claims |
|---|---|---|---|---|---|
| Male | 3,288,000 | 2,329,000 | 1,842,000 | £5,833m | £3,200 |
| Female | 1,742,000 | 1,068,000 | 759,000 | £1,735m | £2,300 |
| All | 5,038,000 | 3,402,000 | 2,604,000 | £7,576m | £2,900 |
SEISS claims by age group
Figure 2 shows the potentially eligible population and claims made by age group. Table 2 also shows claim values by age.
Around 83% of individuals who were assessed for potential eligibility were between the ages of 25 and 64, with around 90% of claimants from this age group. Take-up of the grant in these age-groups is at or above 76%. No one age group dominates and claims are evenly spread.
The take up rate is noticeably lower for those who are aged 65 and over (61% have claimed), although they have the highest average claim value at £3,300. The youngest age group have the second lowest take up rate (70%) and the lowest average claim value at £2,100.
Figure 2: The total potentially eligible population and number of SEISS claims to 31 July 2020, by age group
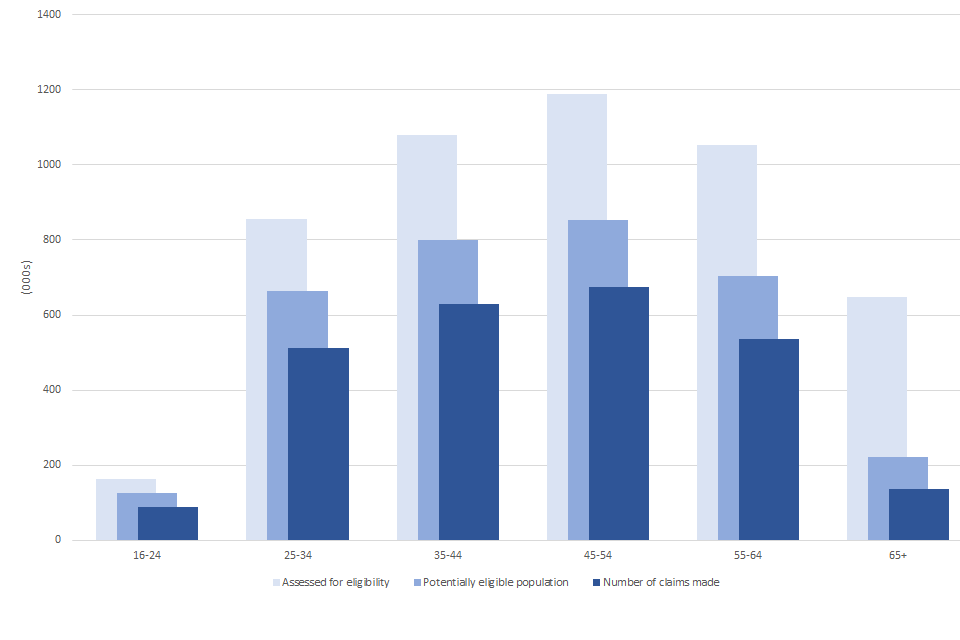
A chart showing the number of claims received and the potentially eligible population by age group
Source: HM Revenue and Customs Self-Employment Income Support Scheme linked to Self Assessment taxpayer information
Notes: 1. Age is calculated at the date the SEISS scheme opened on 13 May 2020 2. There is missing age information for 34,000 in the potentially eligible population.
Table 2 - SEISS potentially eligible population, number and value of claims by 31 July 2020, by age band
| Age band (as at 13 May 2020) | Assessed for potential eligibility | Total potentially eligible population | Total no. of claims made | Total value of claims made | Average value of claims |
|---|---|---|---|---|---|
| 16-24 | 164,000 | 127,000 | 89,000 | £187m | £2,100 |
| 25-34 | 856,000 | 664,000 | 512,000 | £1,462m | £2,900 |
| 35-44 | 1,080,000 | 800,000 | 629,000 | £1,832m | £2,900 |
| 45-54 | 1,189,000 | 853,000 | 676,000 | £1,993m | £2,900 |
| 55-64 | 1,053,000 | 703,000 | 537,000 | £1,580m | £2,900 |
| 65+ | 647,000 | 221,000 | 136,000 | £449m | £3,300 |
| Missing | 49,000 | 34,000 | 26,000 | £73m | £2,900 |
| All | 5,038,000 | 3,402,000 | 2,604,000 | £7,576m | £2,900 |
SEISS claims by industry sector
(see Table 3 in the accompanying tables for further details)
Self-employed individuals are asked to provide a description of their business activity on their Self Assessment returns. These activities have been mapped across to the Standard Industrial Classification (SIC) 2007 to enable analysis to be carried out by industry sector. Where an individual has multiple sources of self-employed income the activity with the highest income has been used for the SEISS analysis.
Figures 3 and 4 show the potentially eligible population and number of claims made by industry sector.
The construction industry has the largest population of individuals who were assessed for potential eligibility with over 1.2 million and over 1 million of these were potentially eligible to apply. By 31 July construction workers had made 884,000 claims for SEISS totalling £3.1 billion; an average of £3,500 per claimant.
Self-employed individuals in the transportation and storage sector make up 8% of the potentially eligible population and made 225,000 claims totalling £490 million. Administrative and support services also make up 8% of the potentially eligible population and have made 198,000 claims totalling £409 million.
The highest rates of being assessed as potentially eligible for SEISS were from individuals working in the construction industry (87%) and the transportation and storage sector (82%).
Lower rates of being assessed as potentially eligible for SEISS were found for individuals working in real estate activities (29%), financial and insurance activities (41%) and agriculture, forestry and fishing (45%).
Figure 3: The potentially eligible population and number of SEISS claims made to 31 July 2020, by sector (for the 6 largest SIC industries1 potentially eligible for the scheme)
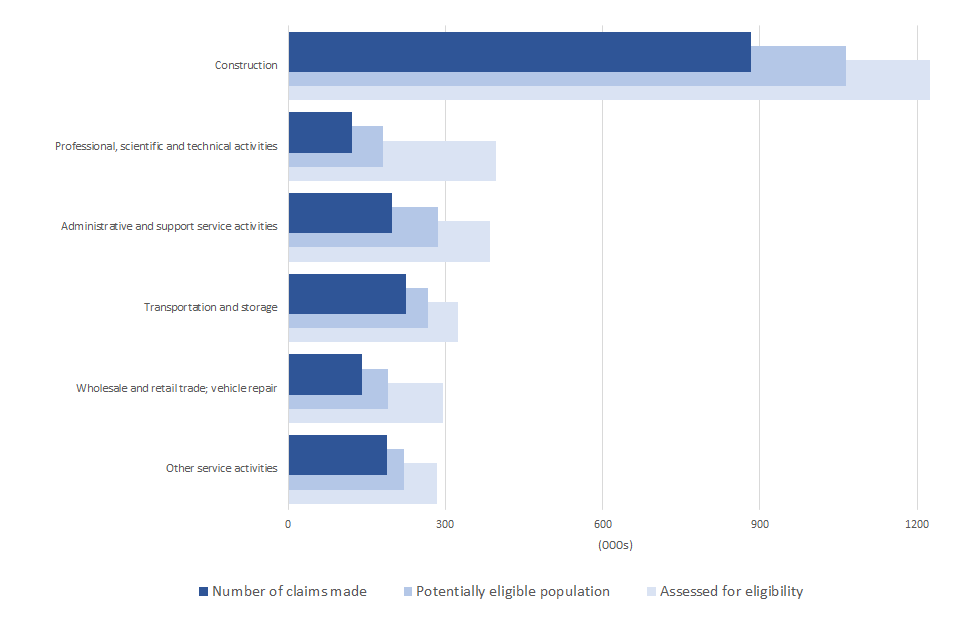
A chart showing the number of claims received and the potentially eligible population by industry sector for the largest six industries
Source: HM Revenue and Customs Self-Employment Income Support Scheme linked to Self Assessment taxpayer information
Figure 4: The total potentially eligible population and number of SEISS claims made to 31 July 2020, by sector; (smaller sectors not shown in figure 3)
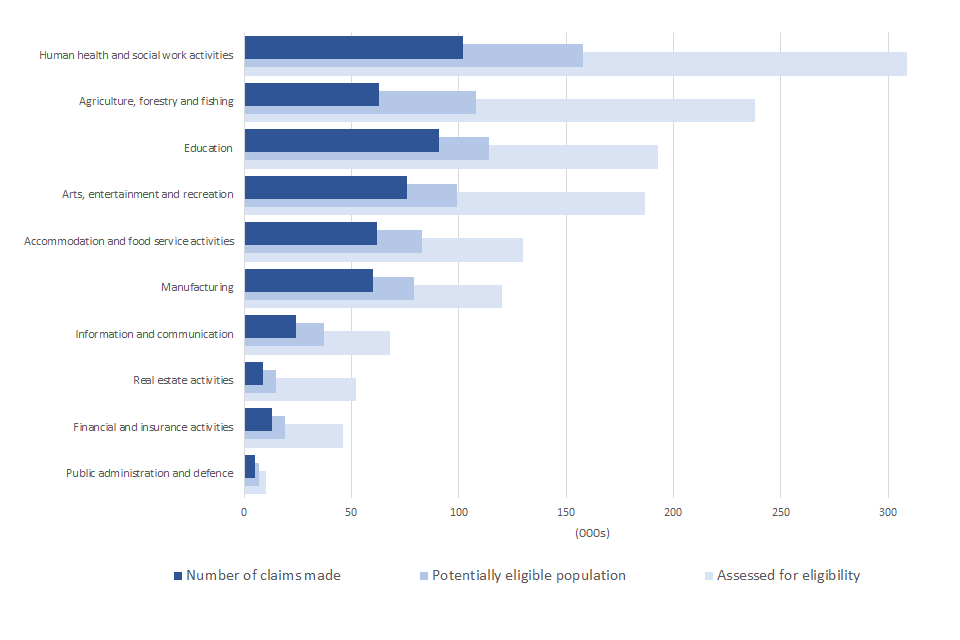
A chart showing the number of claims received and the potentially eligible population by industry sector for smaller industries not shown in Figure 3
Source: HM Revenue and Customs Self-Employment Income Support Scheme linked to Self Assessment taxpayer information
Notes: 1. 474,000 cases in the potentially eligible population are included as “Unknown and other” and almost all of these (99%) could not be allocated to a SIC code
Figure 5 shows the average value of claims by sector which range from £4,200 per claimant in the finance and insurance sector to £2,100 per claimant in administrative and support services.
Figure 5: Average value of claims to 31 July 2020, by primary industry of self-employment, ranked by average claim
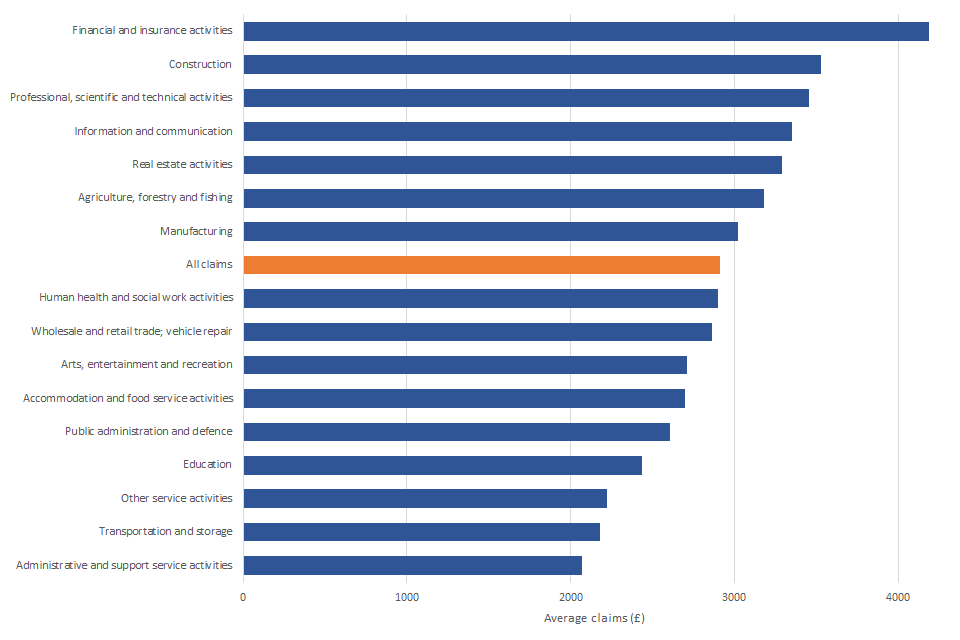
A chart showing the average value of claims received by industry sector
Source: HM Revenue and Customs Self-Employment Income Support Scheme linked to Self Assessment taxpayer information
Notes: 1. The allocation to industry represents an individual’s highest earning self-employment 2. 474,000 cases in the potentially eligible population are included as “Unknown and other” and almost all of these (99%) could not be allocated to a SIC code
SEISS claims by geography
(see Table 2 in the accompanying tables for further details) for further details)
Using the claimant’s Self Assessment address, SEISS claims can be mapped to countries of the UK, English regions and lower geographies.
Figure 6 shows the potentially eligible population and number of claims made by country and region.
London has the largest number of individuals that were assessed for potential eligibility (907,000), the largest potentially eligible population (648,000) and the largest number of claims (498,000) totalling £1.46 billion.
England had the highest proportion of assessed individuals that were found to be eligible (68%), followed by Wales (65%), Scotland (64%) and Northern Ireland (62%).
Northern Ireland has the highest take up rate (81%) followed by Wales and North West (78%). The take up rate in Scotland and the other eight English Regions is slightly lower with between 75% and 77% of the potentially eligible population claiming up to 31 July.
Self-employed individuals in Scotland have made 157,000 claims totalling £459 million; in Wales 110,000 claims for £295 million have been made and in Northern Ireland 78,000 claims for £223 million have been submitted.
Figure 6: The total potentially eligible population and number of claims made to 31 July 2020, by country and NUTS1 region, ranked by size of potentially eligible population

A chart showing the number of claims received and the potentially eligible population by country and region of the UK
Source: HM Revenue and Customs Self-Employment Income Support Scheme linked to Self Assessment taxpayer information
Notes: 1. The allocation to location represents the individual’s address registered on their Self Assessment return 2. 12,000 of the potentially eligible population could not be allocated to a NUTS1 region
Figure 7 shows the average value of claims by country and region.
The regions and countries with the lowest average claim values are the North East (£2,600), the North West (£2,600), Yorkshire and the Humber (£2,700) and Wales (£2,700).
The South East (£3,200), East of England (£3,100) and South West (£3,000) have average claim values above the UK average of £2,900.
Figure 7: The average value of claims by NUTS1 region, ranked by value
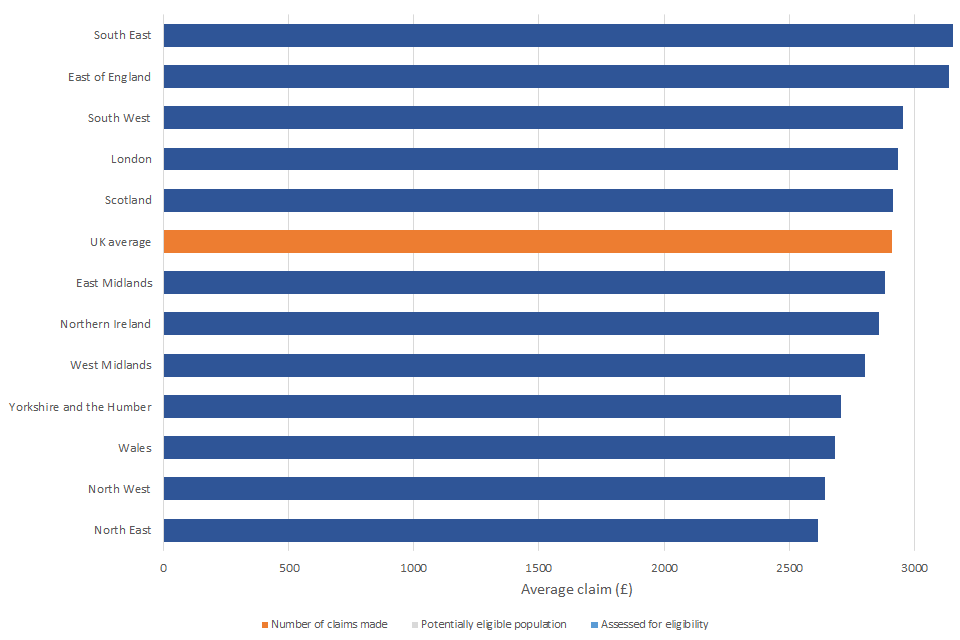
A chart showing the average value of claims received by country and region of the UK
Source: HM Revenue and Customs Self-Employment Income Support Scheme linked to Self Assessment taxpayer information
Notes: 1. The allocation to location represents the individual’s address registered on their Self Assessment return 2. 12,000 of the potentially eligible population could not be allocated to a NUTS1 region
Sub-regional breakdowns
Tables 4 and 5 in the accompanying Excel table pack for further details) provide a breakdown of SEISS claimants by Parliamentary Constituency and Local Authority.
The maps below illustrate how the take-up rate for the SEISS scheme has varied across the country. There are clusters of high take-up in Northern Ireland and south Wales. London has the greatest proportion of areas with the lowest take-up, particularly central London.
SEISS claims as a proportion of the potentially eligible population,by Local Authority

A map showing the SEISS take-up rate by local authority
Source: Office for National Statistics licensed under the Open Government Licence v.3.0. Contains OS data © Crown copyright and database right 2020
SEISS claims as a proportion of the potentially eligible population,by Parliamentary Constituency

A map showing the SEISS take-up rate by parliamentary constituency
Source: Office for National Statistics licensed under the Open Government Licence v.3.0. Contains OS data © Crown copyright and database right 2020
SEISS claims by industry sector and geography
(see Table 6 in the accompanying tables for further details) for further details)
The remaining sections of this bulletin consider the breakdown of the number of claims received in each country and region by different demographics (industry, gender and age). Comparable information relating to the value of claims, the potentially eligible population and take-up rates can be found in tables 6 and 7 in the accompanying tables for further details).
Figure 8 shows the breakdown of claims in each region and country by industry sector. Construction, transport and administrative services have the largest number of claims overall and are shown as separate categories on the chart. Agriculture, forestry and fishing is also large for some areas and is shown separately. Other smaller industries have been combined.
The industry profile of SEISS claimants does not vary greatly between countries and regions. The main exceptions are seen in the construction industry and agriculture, forestry and fishing.
Individuals working in the construction industry account for the highest proportion of claims in every country and region of the UK. London has the highest proportion, with 39% of claims being from those working in construction and Scotland has the lowest with 26%.
Individuals working in agriculture, forestry and fishing account for 13% of all claims made by individuals in Northern Ireland, 8% in Wales and 5% in Scotland. However, claims from this sector in the 9 English regions are consistently lower with 4% of all claims in the South West being from individuals working in this sector but a negligible proportion from individuals in London.
Figure 8: The proportion of claims received by 31 July 2020, in each country and region by primary industry of self-employment
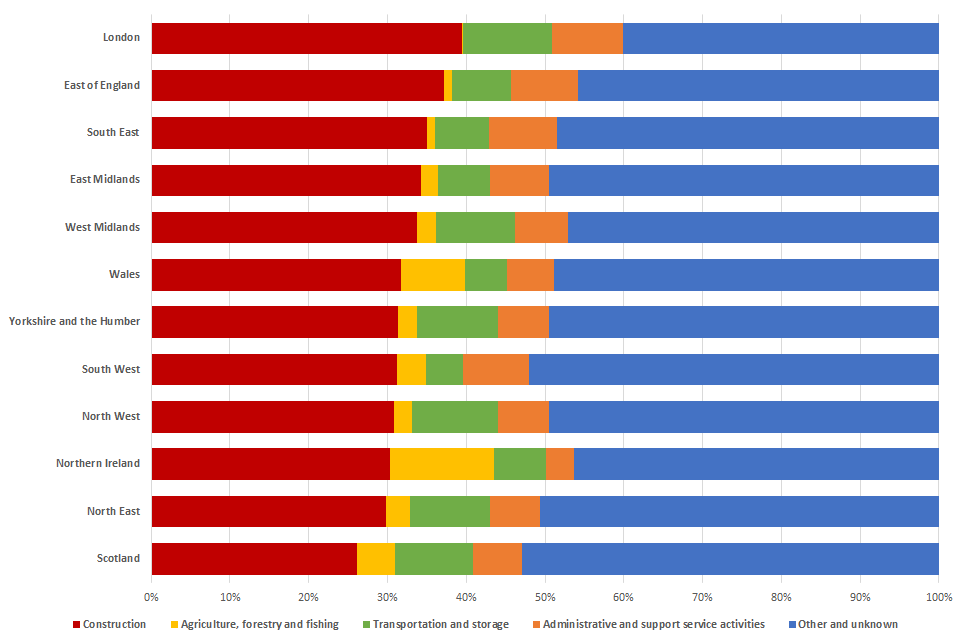
A chart showing the industry sector distribution of claims in each country and region of the UK
Notes: 1. The allocation to industry represents an individual’s highest earning self-employment 2. 474,000 cases of the potentially eligible population are included as “Unknown and other” and almost all of these (99%) could not be allocated to a SIC code
SEISS claims by gender and geography
(see Table 7 in the accompanying tables for further details) for further details)
In all countries and regions approximately two-thirds of the potentially eligible population are male. The area with the highest proportion of males in the potentially eligible population is Northern Ireland (73%) and the lowest areas are Scotland and the South West (65% each). A similar pattern is seen in the number of claims received by 31 July with male claimants accounting for 66% of claims in Scotland and 75% of claims in Northern Ireland.
Since the average claim amount is higher for males than females, men account for an even higher proportion of total claim values. In the West Midlands, East of England, London and Northern Ireland 79% of total claim values are from men. The lowest male share is in Scotland where 73% of the total amount claimed is claimed by men.
Figure 9: The proportion of claims received by 31 July in each country and region by gender
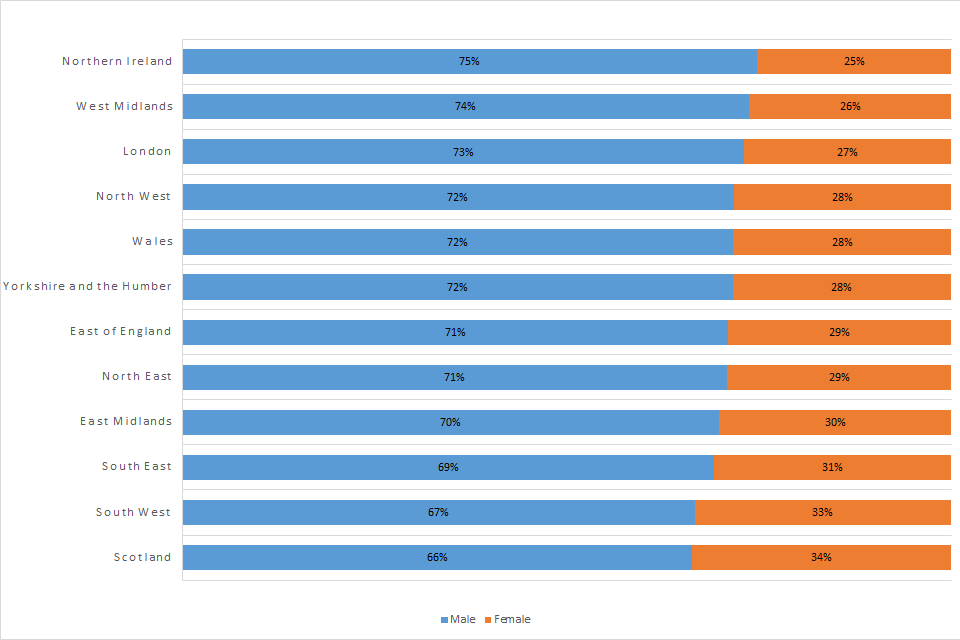
A chart showing the gender distribution of claims in each country and region of the UK
SEISS claims by age and geography
(see Table 7 in the accompanying tables for further details) for further details)
The age distribution of the potentially eligible population and claims received by 31 July is reasonably consistent across all countries and regions with the exception of London.
Between 41% (multiple areas) and 47% (East of England) of the potentially eligible population in each country and region is aged under 45 except in London where 58% are under 45.
A similar distribution is observed from claims with the lowest proportion aged under 45 being in Scotland (41% of claimants and 39% of claim value) and the highest being in London (58% of claims and claim value).
Figure 10: Age distribution of claims received by 30 June in each country and region
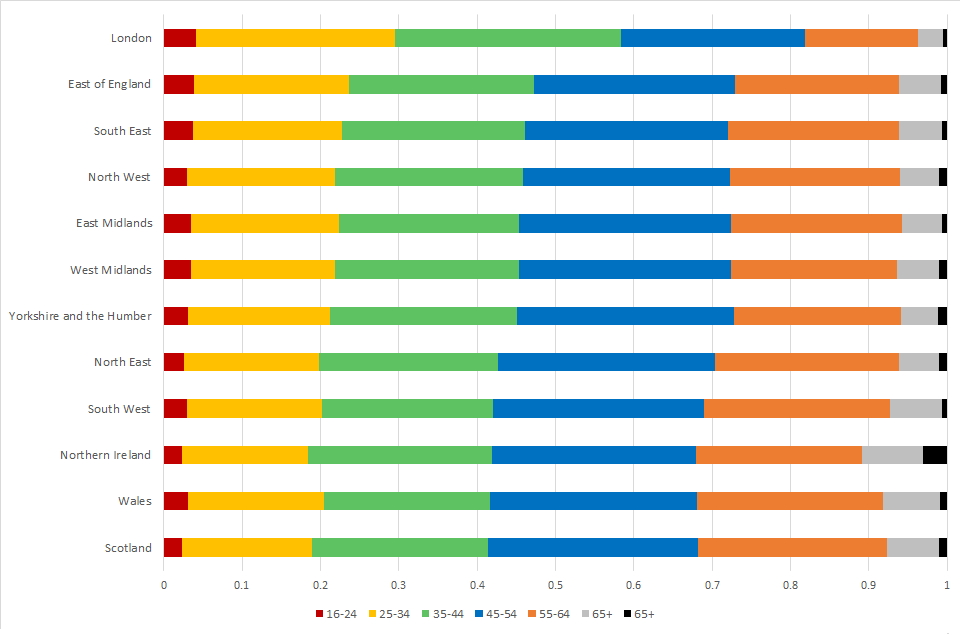
A chart showing the age distribution of claims in each country and region of the UK
Notes: 1. Age is calculated at the date the SEISS scheme opened on 13 May 2020. 2. The age for around 34,000 individuals in the potentially eligible population is not known which is around 1% of each country/region although slightly higher at 3% for individuals living in Northern Ireland. 3. The title of this graph was revised on the 1st September 2020. It incorrectly stated 30 June instead of 31 July.
Background to the SEISS
The Self-Employment Income Support Scheme (SEISS) was announced on 26th March 2020 as part of the UK government’s support package for businesses and self-employed people during the coronavirus outbreak in early 2020. The scheme was open to self-employed individuals and members of a partnership who met the following criteria:
- Traded in the tax year 2018 to 2019 and submitted their Self Assessment tax return on or before 23 April 2020 for that year
- Traded in the tax year 2019 to 2020
- Intended to continue to trade in the tax year 2020 to 2021
- Carried on a trade which had been adversely affected by coronavirus
A business could be adversely affected by coronavirus if, for example:
-
They were unable to work because they:
-
They have had to scale down or temporarily stop trading because:
The grant is not open to limited companies or those operating a trade through a trust.
To work out eligibility, HMRC first look at the 2018 to 2019 Self Assessment tax return. Trading profits must be no more than £50,000 and at least equal to your non-trading income. If an individual is not eligible based on the 2018 to 2019 Self Assessment tax return, HMRC will then look at the tax years 2016 to 2017, 2017 to 2018, and 2018 to 2019. The scheme allows an eligible individual to claim a taxable grant worth 80% of their average monthly trading profits, paid out in a single instalment covering 3 months’ worth of profits, and capped at £7,500 in total.
This first SEISS grant has been announced to close for claims on 13 July 2020.
On 29 May 2020 SEISS was extended to allow a second and final grant when the scheme reopens for applications in August. This will be a taxable grant worth 70 per cent of their average monthly trading profits, paid out in a single instalment covering three months’ worth of profits, and capped at £6,570 in total. The statistics presented in this release only covers claims from the initial SEISS scheme up to 31 July.
Glossary
The assessed for potential eligibility population are those self-employed individuals who HMRC identified as having traded in the tax year 2018 to 2019 and submitted their Self-Assessment tax return on or before 23 April 2020 for that year.
The SEISS potentially eligible population are those who HMRC identified as being potentially eligible for a SEISS grant based on the information held from their self assessment returns relating to the tax years; 2016 to 2017, 2017 to 2018 and 2018 to 2019. This is the group who have been invited to claim for a SEISS grant. This does not attempt to assess if a business was affected by coronavirus or whether they continued trading after 2018 to 2019. So it is the potentially eligible population based only on the information in the self assessment forms and not all will apply for the grant.
The assessed to be ineligible population are those self-employed individuals who HMRC identified as having traded in the tax year 2018 to 2019 and submitted their Self-Assessment tax return on or before 23 April 2020 for that year, but were found not to be eligible after being assessed against the SEISS criteria. Trading profits must be between £0 and £50,000 and at least equal to your non-trading income. For an individual to be found ineligible based on the income criteria they need to be found ineligible based on the 2018 to 2019 self assessment tax return and the combination of the relevant fields for consecutive tax years 2016 to 2017, 2017 to 2018, and 2018 to 2019. Individuals are also included in the ineligible figures in this publication if an individual’s grant calculation resulted in an amount of £0 or less and if they are recorded as having ceased trading on the self assessment systems.
The number of claims is defined as the total number of individuals who had submitted a claim for a SEISS grant by 6.17pm on 31 July 2020 that had been either paid, sent for payment or had been received and were awaiting various checks. Only non-rejected claims are included with the majority of these having been paid or sent for payment. However, a small number of claims were still being processed and could be rejected.
The definitions above apply in the vast majority of cases but there are some other circumstances that are considered when including individuals for assessment and which also may affect potential eligibility to SEISS. However, some of these are only applicable from when the second and final SEISS grant opens to claims on 17 August and are therefore not included in the statistics in this publication. Find out how different circumstances affect the Self-Employment Income Support Scheme.
Methodology and data sources
Coverage
This publication covers all self-employed individuals assessed for potential eligibility for the first SEISS grant as at 31 July 2020. Generally, this includes individuals that HMRC identified as having traded in the tax year 2018 to 2019 and submitted their Self Assessment tax return on or before 23 April 2020 for that year.
Although this covers the vast majority of cases, there are some other circumstances that are considered when including individuals for assessment and which also may affect potential eligibility to SEISS. However, some of these are only applicable from when the second and final SEISS grant opens to claims on 17 August and are therefore not included in the statistics in this publication. Find out how different circumstances affect the Self-Employment Income Support Scheme.
Since the first publication of these statistics in June, the potentially eligible population in the UK has increased by 4,398. This is due to changes to the eligibility status of a small number of individuals whose cases have been reviewed and ongoing monitoring of HMRC data systems to identify all potentially eligible individuals.
The claim information covers individuals who had submitted a claim for the SEISS grant by 18.17pm on 31 July 2020 which had not rejected or failed certain compliance checks.
Data sources used in this release
The data for this release come from HMRC’s system for administering SEISS claims. It covers the whole population rather than a sample of people or companies.
HMRC’s self assessment system and other HMRC administrative systems has been matched with SEISS data to produce the data released here.
The age, gender and postcode of residential address has been collected from the self assessment account for each individual. The industry information has been collected from the self assessment return for the tax year ending 5 April 2019, and relates to the self-employment business description provided on that return.
To produce the geographic breakdowns, the claimants’ residential postcode has been matched to Office for National Statistics (ONS) data that links UK Post Codes to geographic areas. The geographic areas that have been presented in this release are Country and English Region, Local Authority and Parliamentary Constituency.
The Self Assessment system is a live operational dataset and, as such, details such as residential address may be updated at any point. The allocation of geography and industry in these statistics is based on the latest reported information. As a result, it is possible for an individual claimant’s characteristics to change between the first publication of these statistics on 11 June and subsequent publications.
Ineligible population compared against SEISS eligibility criteria
Analysis of the assessed ineligible population against the eligibility criteria is as a result of additional analysis of the SEISS data in order to provide a description of this group of individuals. An individual can be outside of the criteria for multiple reasons for both the 2018 to 2019 self assessment tax return and the tax years 2016 to 2017, 2017 to 2018, and 2018 to 2019. Additionally, it is possible for the same individual to be ineligible due to different criteria across these two stages. For the purposes of the figures presented here, ineligible individuals are recorded against all of the categories that apply to that individual. As a result, individuals can be ineligible in multiple ways and there is a high level of overlap between the categories presented.
Strengths and limitations
Experimental Statistics status
This release is classed as Experimental Statistics as the methodologies used to produce the statistics are still in their development phase. This does not mean that the statistics are of low quality, but it does signify that the statistics are new and still being developed. As the methodologies are refined and improved, there may be revisions to these statistics.
Differences compared with the HMRC SEISS Management Information
Management information (MI) on the number and value of SEISS claims received has been published by HMRC at various dates since the scheme was launched on 13 May 2020.
The published MI report for 19 July 2020 showed 2.7 million claims totalling £7.8 billion. This is the latest MI report following the scheme closing to claims for the first grant on 13 July.
The data in this statistical release, dated 31 July 2020, shows slightly different figures of 2.6 million claims totalling £7.58 billion.
The difference in these figures is mainly due to the management information including all claims received and their associated value even though some of these are eventually rejected after compliance checks. The statistics in this release exclude claims which have been rejected.
There is also likely to be a smaller difference caused by the timing of claims flowing through the SEISS system. The MI measures claims at the “front end” of the system and the statistical publication is based on data made available from the “back end” of the SEISS system once claims have been checked.
Differences compared to Survey of Personal Incomes
In the Survey of Personal Incomes individuals are considered as self-employed if HMRC received or expects to receive Self Assessment forms covering income from self-employment in their 2017 to 2018 Self Assessment tax return.
The population assessed for SEISS eligibility includes only those individuals who submitted 2018 to 2019 Self Assessment returns by 23 April 2020 and included data on self-employment in that return.
Differences compared to other sources
Other organisations such as the ONS and Institute for Fiscal Studies have published information about SEISS either from surveys or estimates derived from previously published data. We believe these HMRC statistics provide a more reliable picture as they are based on administrative data from the SEISS claim and Self Assessment systems.