Evaluation of the Safer Streets Fund Round 1, year ending March 2021
Published 11 January 2023
Applies to England and Wales

© Crown copyright 2023
This publication is licensed under the terms of the Open Government Licence v3.0 except where otherwise stated. To view this licence, visit nationalarchives.gov.uk/doc/open-government-licence/version/3 or write to the Information Policy Team, The National Archives, Kew, London TW9 4DU, or email: psi@nationalarchives.gov.uk.
Where we have identified any third party copyright information you will need to obtain permission from the copyright holders concerned.
This publication is available at https://www.gov.uk/government/publications/safer-streets-fund-evaluation-round-1-year-ending-march-2021/evaluation-of-the-safer-streets-fund-round-1-year-ending-march-2021
Executive summary
This report presents the findings from an independent evaluation of the Safer Streets Fund Round 1 (SSF1). In October 2019, the Home Office announced a £25 million Safer Streets Fund (SSF) to tackle acquisitive crime in persistently and disproportionately affected residential areas. Police and Crime Commissioners (PCCs) across England and Wales could bid for funding up to £550,000 for situational interventions aimed at preventing acquisitive crime, using a problem-solving approach. There were 52 successful bid areas across 35 police forces, who implemented their interventions between July 2020 and June 2021, after the Home Office granted an extension to some areas due to the coronavirus (COVID-19) pandemic disruptions.
Kantar Public carried the evaluation out between May 2020 and November 2021. It comprised several strands, including a detailed process evaluation that explored how local projects implemented and delivered their SSF1 interventions. The impact evaluation aimed to measure the differences made by the SSF1 programme by analysing police recorded crime data and primary survey data on public perceptions of crime and safety. The report presents the preliminary impact findings below.
Process evaluation findings
The process evaluation strand applied a variety of qualitative research methods and considered a wide range of data sources, including bid reviews, in-depth interviews with members of the bid teams, holistic case study research and analysis of local management information data.
Overall, local PCC teams viewed the SSF1 programme very positively. They understood that its core purpose was to reduce acquisitive crime, but they also saw it as an opportunity to drive wider social change in their communities.
That said, the disruptions caused by the COVID-19 pandemic posed a series of major challenges to local areas in implementing their interventions. The lockdown restrictions meant there were unexpected procurement delays, staffing shortages and challenges with resident engagement – all of which contributed to the derailment of their original delivery plans and a degree of financial underspend in some areas.
The local SSF1 teams’ experience of implementation was mixed, and certain critical factors emerged as the key enablers of success. Where these elements were absent, they were found to be barriers to smooth implementation. These included:
- timing was key in shaping the bids; areas typically felt they could have done more to engage local partners and the community if they had more time to develop their grant applications
- strong partnerships between local delivery partners were critical to successful programme delivery; it was important that partnership working was supported by senior leads who could help drive the collaboration at the senior levels
- external input from academics/specialists and a dedicated project manager were important factors for effective delivery of projects
- community engagement was a core part of most programmes and drove wider benefits such as sustainability of the interventions, bringing about a sense of community pride and ownership which further enhanced the impact of the interventions
- there were implementation learnings specific to each intervention; these tended to revolve around the need to improve knowledge of governance processes, generating insight into the community and the target area, and enhancing collaboration with local police teams, local authorities, and delivery partners
Preliminary impact findings
Kantar Public measured possible programme impact on acquisitive crime by analysing survey data and the number of police recorded crime incidents, including both general acquisitive crimes and burglaries. By contrast, the team only measured the impact of the programme on anti-social behaviour by analysing survey data.
The impact findings presented here are preliminary at this stage. This is because of several factors, including delays to implementation that meant baseline and follow-up surveys were started while some projects were ongoing. Further impact analysis is planned with a longer follow-up period, together with an economic evaluation of the costs and benefits associated with the SSF1 programme.
Experiences of key offences
There was minimal evidence of any immediate impact on acquisitive crime from the SSF1 programme. The analysis found no statistically significant impact on estimates using the survey data, and the preliminary analysis of reported acquisitive crimes or burglaries suggested no significant effects during the first quarter of the follow-up period (April to June 2021).
Similar levels of change were seen when exploring anti-social behaviour. While there was a reduction in the likelihood of residents experiencing some types of anti-social behaviour which were not strongly linked to the SSF1 programme, most measures had no significant impact.
Resident perceptions of crime and policing
SSF1 had a statistically significant impact of +7 percentage points (pp) on residents’ likelihood to think that the local police were doing a good or excellent job.
The programme had a statistically significant impact of -9pp on residents’ likelihood to be fairly or very worried about being mugged or robbed, meaning the programme helped reduce residents’ concerns.
Awareness of SSF1 interventions
There was a statistically significant impact (+5pp) on residents’ awareness of the Safer Streets programme, reflecting the efforts many bid areas made in local communications and engagement with residents during implementation, especially around environmental improvement and target hardening.
Resident recollection of information and local communications
One-third of residents in the SSF1 treatment group (32%) had seen or heard information about police and local council activity to tackle crime and anti-social behaviour. Three-quarters (74%) could identify what this was about, most commonly concerning protective measures in the local area (41%), home security measures (35%) or community engagement (23%).
The most popular method to engage residents was through newsletters (29%), followed by Facebook (25%) and in-person visits (18%). Local areas could focus on these means of communication in future projects, as it seems these have worked best for recall by residents in the SSF1.
Conclusions and recommendations
The SSF1 programme has brought several substantial benefits to local police forces and communities by putting interventions in place to reduce acquisitive crime and achieve wider social benefits. While most of the quantitative evaluation impact estimates are not conclusive at this stage, there is evidence to support the conclusion that the programme achieved some of its original aims.
That said, there are clearly lessons to be learnt from the experience of implementing SSF1 and from conducting its evaluation.
For the Home Office and future commissioning practice, the team noted several key learnings to be applied to the next rounds of SSF funding. These include:
- the need to consider the timing of the bid launch and how much resource is available within PCCs to respond, together with allowing sufficient lead-in and preparation time for local areas to develop their bids
- it is vital that PCC areas have access to reliable guidance and best practice information on the sustainability of interventions, community engagement and calculating programme costs; this should include additional guidance for complex interventions
- consideration of a more structured approach to collating practical implementation learnings, building knowledge banks and sharing best practice with PCC areas
For SSF bid teams, the report outlines a series of practical lessons learnt and best practice insights into bid development, programme development and implementation as below:
- early engagement with delivery partners helps develop the bid and secures their commitment later on during the project implementation phase
- community engagement should also happen early in the bid development process, to strengthen residents’ support for the planned interventions
- evidence and specialist expertise are clearly vital elements in developing effective bids and programmes, which can be accessed through expert or academic partners where relevant
- undertake accurate cost projections at the bid development stage, as well as detailed procurement plans and identification of potential suppliers (ideally those with prior experience of delivering similar solutions), to avoid unanticipated costs and delays
- a dedicated bid lead with knowledge of the local area and ownership of all the key relationships with partners is required for effective bid and programme development, progress tracking and impact monitoring
And finally, looking ahead to future evaluation practice, the report recommends several measures that will increase the likelihood of detecting statistically significant impacts, including better timing of the baseline and follow-up periods to avoid overlaps with implementation periods; increased survey sample sizes; and longer police recorded data analysis reference periods to measure long-term impact.
Acknowledgements
Kantar Public relied on the contributions from several parties to evaluate the Safer Streets Fund and report on our findings. First, our thanks go to Professors Nick Tilley and Shane Johnson of UCL for their invaluable advice on methodology, fieldwork, analysis and reporting. We are also grateful to Home Office analysts and policy colleagues for their regular guidance and feedback throughout the evaluation. Our thanks also go to the anonymous peer reviewers who provided us with comments during the reporting stage and finally, to the evaluated project staff and their local residents who gave their time generously to the evaluation process.
1. Introduction
The Home Office commissioned Kantar Public to independently evaluate the Safer Streets Fund (Round 1). This report presents the findings of the process and preliminary impact evaluation carried out between May 2020 and November 2021. Further impact analysis is planned with a longer follow-up period.
1.1 Policy context and background of the Safer Streets Fund
Acquisitive crimes, such as theft, burglary or robbery, constitute over half of crime (excluding fraud and computer misuse) reported to the Crime Survey for England and Wales (CSEW) (ONS, 2020)[footnote 1]. While there has been a sustained decline in acquisitive offences since their peak in 1995, the evidence suggests this trend changed between 2017 and 2019, with the volume of acquisitive offences decreasing again in March 2020 as shown in Figure 1. The Home Office previously estimated the economic and social costs of theft and robbery offences against individuals at around £8bn (Home Office, 2018).
An important contextual element to view the findings of this report against is the COVID-19 pandemic and the resulting lockdowns and restrictions in mobility and the impact this had on crime. There have been significant decreases in acquisitive crime during this period due to the reduced opportunities for theft (Kirchmaier & Villa-Llera, 2020). Adjusted crime survey estimates indicate that acquisitive crime has decreased by 31% in the year ending March 2021 compared to the year ending March 2019.
Figure 1: CSEW/TCSEW long-term trends in theft and robbery
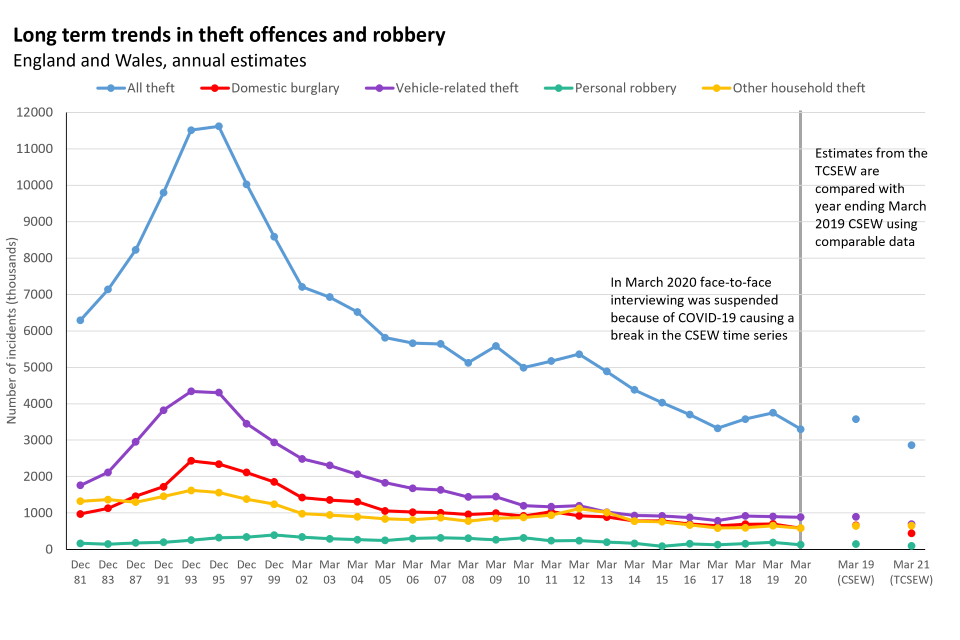
Source: ONS (2020, 2022a)
There is ample evidence that relatively simple interventions such as alleygating, street lighting and home security can prevent acquisitive crimes (College of Policing, 2021a). This body of evidence has been built through academic scholarship (see for example, Laycock & Tilley, 2018) and through practical learning experiences of recent government programmes, such as the Reducing Burglary Initiative (RBI)[footnote 2] which was a key element of the overarching Crime Reduction Programme. The Home Office launched the RBI in 1999, which has funded over 200 projects to reduce burglary in local communities.
In this context, the Home Office announced a £25million Safer Streets Fund (SSF) in October 2019, to tackle acquisitive crime in persistently and disproportionately affected areas (Home Office, 2021). Police and Crime Commissioners (PCCs) across England and Wales could bid for funding (up to £550,000 per bid) for situational interventions aimed at preventing acquisitive crime and burglary in residential areas using a problem-solving approach (ibid)[footnote 3]. To help PCCs identify suitable interventions, the Home Office commissioned the College of Policing to develop an evidence-based situational crime prevention toolkit (College of Policing, 2021a). The key outcome measures of the Fund were defined as:
-
Impact on acquisitive crime
PCCs could set out plans to target specific acquisitive crime types through their crime prevention plans. These primary crime types and interventions needed to focus on residential areas and cover crimes against individuals and households. -
Impact on other types of crime and disorder
PCCs could also identify secondary types of crime and disorder that are of significance to the local community and can also be targeted through situational interventions (supported by a small amount of the allocated funding). These could include anti-social behaviour, and violence and sexual offences (although the evaluation did not measure impacts on the latter 2). -
Effect on public perceptions of safety, relating to crime and policing
The fund also supports PCCs with improving public perceptions of safety and policing through implementing situational crime prevention interventions in high-crime areas.
In summary, SSF1 attracted 63 bid applications by the end of March 2020, of which 52 successful bids were announced in May 2020.
Most bids (31) focused on various forms of acquisitive crime as their primary target, while some focused on burglary specifically (21). Other secondary crimes included anti-social behaviour, drug-related activity, environmental crimes, criminal damage and violent crime[footnote 4].
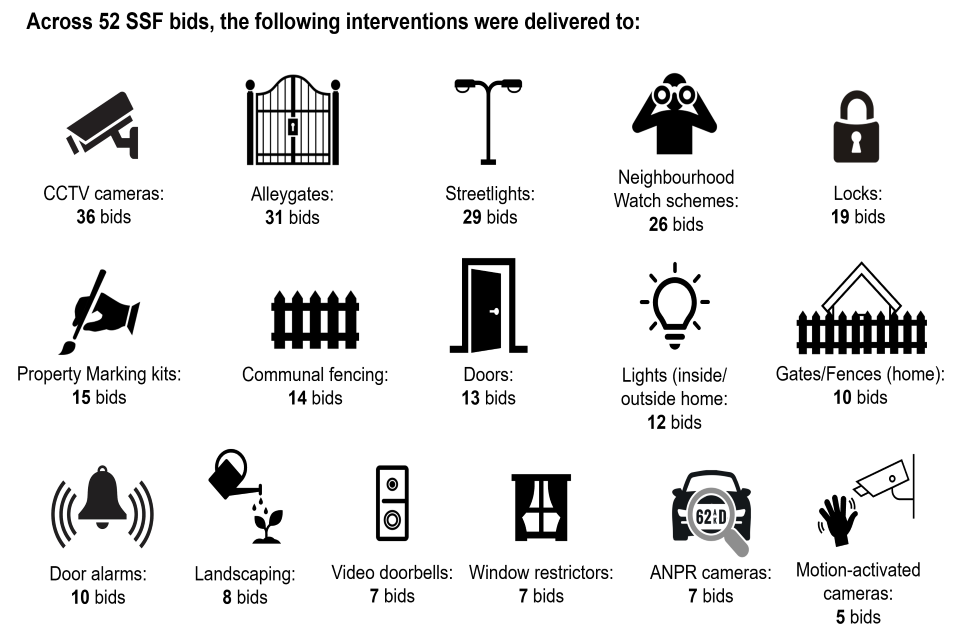
The most frequent intervention types included target hardening of homes (for example, providing locks, doorbells) and communal areas (for example, CCTV, street lighting), as well as measures to help identify stolen property (for example, property marking, Automatic Number Plate Recognition or ANPR), as shown in Figure 2 below. Most areas also engaged with the local community (for example, via Neighbourhood Watch).
The original implementation schedule – planned for June 2020 to March 2021 – had to be extended due to the COVID-19 pandemic. After the Home Office granted an extension, the last local projects finished their implementation in June 2021.
The Home Office awarded bid areas with initial funding of up to £550,000 to support their situational interventions. However, due partly to COVID-19 restrictions, there was some underspend and not all activities could go ahead as planned; many projects changed plans to interventions they were more able to deliver under the circumstances. Additionally, 11 projects were allocated additional funding in the year through a mini competition after the original allocations whilst 32 were granted an extension to allow more time for implementation[footnote 5].
Of all bid areas, 22 did not report any underspend and 8 bid areas reported an underspend of over 10%. Of these 8 areas, the underspend percentage ranged from 11% to 51%. The total underspend across all bid areas was 4.91%[footnote 6] – a fairly typical outcome for a fund of this size.
Figure 2: Overview of SSF1 interventions (from bid analysis, completed as of September 2020)
As an indication, projects were funded to deliver the following interventions. However, some changes were made given difficulties delivering certain interventions during COVID-19.
1.2 Evaluation objectives
The evaluation of the SSF1 programme aimed to provide both an impact assessment and process learning through a combination of local project level evaluations and programme level evidence synthesis. The core objectives of this evaluation were to:
- Explore whether, and how, funded projects help to reduce acquisitive crimes and have other benefits (Sections 2.3, 2.4, 2.5, 2.6 and 3).
- Produce evidence that can be useful to practitioners and policymakers interested in reducing acquisitive (and other) crimes (Sections 2.3.1, 2.5 and 3.1).
- Support each area with their local evaluation activities and establishing tools and guidance that ensure consistency and commonality across projects, besides Kantar Public’s own evaluation activities (Sections 2.2, 2.7, 2.7.2, 3 and 4).
- Bring together findings across areas through a common outcomes framework and project clustering by intended effects, intervention approach and local contexts.
This report addresses these objectives throughout the process evaluation (Section 2) and the impact evaluation (Section 3).
1.3 Evaluation approach and methods
The evaluation of the SSF used multiple evidence streams to provide an account of the process and impact of local interventions. This section outlines a summary of the evaluation approach and specific research methods; Appendix D provides a more detailed methodology. A key part of the initial scoping phase was a thorough review of all 52 successful SSF bids, which were analysed to gain a deeper understanding of local interventions, and to inform the subsequent design of quantitative and qualitative research materials.
1.3.1 Process evaluation approach
The process evaluation aimed to explore in detail the experiences of local SSF teams and their journeys from bid development to planning and implementation of their interventions. This element drew largely on qualitative primary research data gathered from local SSF delivery teams, combined with additional data sources such as original bid documentation. The insights shed light on several factors that facilitated a successful implementation of situational crime prevention interventions and problem-oriented policing approaches. They also helped to understand some of the key barriers and lessons learnt from the implementation experience.
The process evaluation had an iterative approach and fed emerging evidence into the impact evaluation strand to complement the quantitative data analysis. In summary, there were 3 main tasks:
Task 1: Initial bid area engagement and data collection (August to October 2020)
Telephone interviews with the PCC or delivery leads in 35 successful bid areas and in 6 unsuccessful bid areas.
Task 2: Holistic case study research (January to March 2021)
The evaluation team selected case studies reflective of the overall make-up of SSF areas covering all the key area characteristics, types of interventions, and target crimes of interest. The team explored the local implementation experience through in-depth interviews with bid team members leading the key interventions, and included an interactive exercise to draw up local level Theory of Change (ToC) models to help the evaluation team understand how the planned activities would result in a set of measurable outcomes[footnote 7]. The development of a ToC in collaboration with local delivery teams was a valuable exercise as it helped clarify how interventions were expected to work on the ground in the selected case study areas.
Task 3: Follow-up in-depth telephone interviews (May to July 2021)
A final round of in-depth telephone interviews with 35 local delivery leads when most areas had finished or were close to finishing their implementation of planned interventions.
Communications workstream (December 2020 to March 2021)
In response to a need from local PCC areas for more support around how best to communicate with their local communities, Kantar Public also conducted 10 one-hour interviews with communication leads of 6 SSF and 4 non-SSF police forces and then produced a separate guidance document as outlined in Section 3.1.
The process evaluation findings (Section 2) provide detailed analysis, learnings and implications for practitioners implementing crime prevention measures. The section has learnings drawn from the experiences of all bid areas which participated in this evaluation. Specific learnings and implications are provided on all stages of the project process, from bid development through to project delivery and intervention-specific learnings.
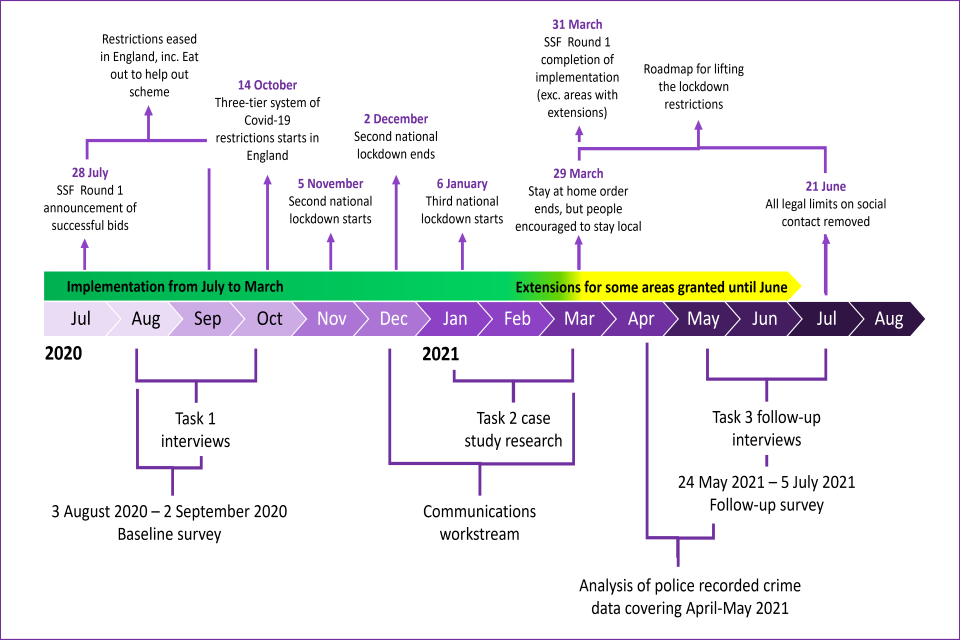
Figure 3 shows the timeline of key dates for the impact and process evaluation, alongside the implementation period related to SSF Round 1, and the COVID-19 pandemic lockdowns that coincided with this activity.
Figure 3: Timeline of SSF implementation, evaluation activities, and COVID-19 pandemic restrictions
1.3.2 Impact evaluation approach
The impact evaluation used 2 approaches:
- Using the synthetic control methodology to analyse police recorded crime data, comparing the outcomes in treatment areas to those in synthetic control areas.
- Applying a difference-in-difference (DiD) analysis to metrics measured in repeated cross-sectional surveys of local residents in treatment and control areas. This is referred to as ‘survey-based impact analysis’ in the discussion of the impact results.
Analysis of police recorded crime data
To assess the impact of SSF interventions on reported crime (including acquisitive crime and burglary, relating to outcome i), the analysis of police recorded crime data drew on official data sources including the Home Office’s Data Hub and police.co.uk data.
Kantar Public used a time series of police recorded acquisitive crime data to analyse the preliminary impact of the fund. The admin data period for this preliminary analysis was based on April to June 2021. Further impact analysis is planned with a longer follow-up period based on a year of data (1 April 2021 to 31 March 2022). The team used the synthetic controls method (Abadie, 2010)[footnote 8] to generate a control group for each of the successful SSF bid areas, considering crime rates and a variety of population statistics in the matching criteria using historic DataHub data (covering years ending 31 March 2017 to 2020). This method uses a weighted average of multiple control areas (census Lower Layer Super Output Areas or LSOAs[footnote 9]) to create an artificial control group, whose trend (in police recorded crime) before introducing the fund is closely matched to the trend in the SSF bid area.
The measurement of the impact of the fund comes from comparing the level of crime in the synthetic control areas to those in the SSF treatment areas, after administering the interventions (see Appendix D), Figure 7).
For this analysis, the team measured the level of crime as the number of reported crimes recorded in either DataHub or police.co.uk data[footnote 10]. When impact estimates are reported throughout this report, they represent the difference between the number of acquisitive crimes/burglaries (as applicable) reported in a bid area and the synthetic control estimate for that bid area.
Survey-based impact analysis
To assess the impact of the SSF interventions on public perceptions of crime and policing (outcome measure 3) as well as selected other crimes such as anti-social behaviour (ASB) (outcome 2), the team designed repeat cross-sectional surveys at pre- and post-implementation intervals[footnote 11].
In reality, the team had to conduct the follow-up survey while some of the local areas were still implementing their SSF interventions due to the COVID-19 related implementation difficulties and delays.
The team conducted the resident surveys in each successful bid area, and in 104 control areas (2 control LSOAs were selected for each successful bid area), which were matched using Coarsened Exact Matching (CEM) techniques (Iacus et al., 2009) to constitute a robust counterfactual.
The survey data was collected using an Address-Based Online Surveying (ABOS) methodology (Williams, 2016) with local addresses being randomly sampled from Royal Mail’s database of delivery points (PAF).
In summary, the baseline and follow-up survey achieved the following:
- baseline survey (3 August to 2 September 2020) – 4,318 achieved completed surveys comprising 1,834 paper completes and 2,484 online completes (20.6% response rate); 3,212 completes were in SSF areas[footnote 12] (treatment areas: 20.4% response rate, control areas: 21.1% response rate)
- follow-up survey (24 May to 5 July 2021) – 3,630 achieved completed surveys comprising 1,572 paper completes and 2,058 online completes (17.3% response rate); 2,720 completes were in SSF areas (treatment areas: 17.3% response rate, control areas: 17.4% response rate)
After collecting, processing and weighting all the survey data (more detail about this is available in the Appendix D, the team conducted DiD analysis to assess the impact that SSF interventions had on a range of observed outcomes (HM Treasury, 2020). This analysis measured the change in outcomes for treatment areas (SSF area residents) at 2 points in time (pre- and post-programme) and compared this change with the trend in outcomes experienced by non-SSF residents in the control group areas over the same time period. The difference between these 2 levels of change is the impact attributed to the SSF interventions, as illustrated in Figure 4. As a note, the DiD analysis also controlled for the differential impact of the prevalent COVID-19 pandemic restrictions in each area[footnote 13].
Figure 4: Difference-in-difference analysis

All survey data was subject to sampling error, which may have caused changes in the same measures between collection points. Statistical significance testing helped to determine which changes could be attributed to the programme, rather than any random error. The DiD analysis focused on impact findings that were statistically significant at the 5% level. This means that if the survey were to be conducted 100 times, there would be a finding of the same nature on at least 95 occasions. These statistically significant findings in the discussion of results are referred to as significant impacts.
This report provides impact estimates as percentage points (pp). For example, the SSF1 programme had a significant impact of +5pp on residents’ awareness of the Safer Streets programme.
Economic evaluation
If the longer-term impact analysis (based on 12 months of recorded crime data) indicates that SSF1 has led to a reduction in crime, a full economic evaluation will then be conducted. This would likely use the Home Office economic and social costs of crime framework (Home Office, 2018), in conjunction with the Manning cost-benefit tool (College of Policing, 2021b). Such an evaluation would monetise the overall benefits associated with SSF1.
2. Process evaluation findings
This section details the findings from the process evaluation of the SSF implementation experience. The aim here was to establish to what extent the programme has been delivered according to plan, to reflect on the implementation experience, identify any early impacts perceived by implementation teams and highlight lessons learnt.
As outlined in Section 1, this strand drew on a variety of data sources, including primary qualitative research data collected via in-depth telephone interviews with all the local project leads as part of Task 1 and 3. To explore the implementation journey from a holistic viewpoint, the Task 2 case study element comprised a range of data collection and analysis techniques – such as initial reviews of the SSF bid documentation, in-depth interviews with project leads and/or intervention delivery leads for the key interventions (covering CCTV, alleygating, home security improvements, community engagement, communication), local ToC workshops and analysis of local level project data.
The ToC models helped to identify factors that were not initially acknowledged as having a major bearing on programme performance, such as unforeseen procurement delays or the importance of strong partnerships. The latter point – having a set of effective partnerships across delivery organisations – came out particularly strongly as one of the key change mechanisms in that it helped enable positive outcomes. Other such contextual factors included the ability of local teams to adapt in response to challenges such as COVID-19 and Brexit, and their approaches to community engagement in helping to support sustainable outcomes.
2.1 Bid development and programme set-up experience
There was a strong positive response among bid areas to the announcement of the SSF and the opportunity to bring about change in communities. While the core funding objective was to reduce acquisitive crime, many teams also saw SSF as an opportunity to drive broader change in their local areas. The funding provided an opportunity to improve negative attitudes towards the police and other public services. Bid teams also felt that the funding could have a positive impact on public safety and therefore improve community cohesion, engagement, and pride in the area.
Overall, bid teams felt designing the SSF bids was highly collaborative with a strong partnership approach. In most cases, the key partners – the PCC, the police and the local authority – pooled resources to pull together the bid. Typically, the PCC played a pivotal role in bringing together the partners and coordinating the information and insights required for the bid.
In the process of bid development, several fundamental steps were common across all bid areas, though some teams undertook additional steps. Figure 5 summarises these steps. Note that while the figure illustrates the steps in a linear way, they often occurred simultaneously. The boxes with dotted lines represent additional steps taken by some teams.
Figure 5: Typical SSF bid development process

2.1.1 Target area identification
The first step in bid development was usually analysts on the policing team within the respective bid areas identifying LSOAs (unit of geography as defined by the Home Office in the SSF1 programme) and analysing crime data to identify LSOAs which fit the bid criteria. Where there were multiple LSOAs that fit the criteria and met the acquisitive crime benchmarks, teams usually selected the areas with the highest scores to include in the bid. While crime data was a central data source used by all teams, other sources of information included borough data, MOSAIC data (consumer classification data), and data from the fire and rescue services.
2.1.2 Stakeholder engagement
In most cases, the PCC co-ordinated between partners during bid development. The local authority and the police were key stakeholders and partners across all bid areas. Depending on the area, other partners included the fire and rescue services, local community organisations, housing associations and housing departments from the local authority.
At this stage, several teams formed Project Overview and Project Delivery boards that would have oversight of the programme, should funding be secured.
2.1.3 Area analysis
Teams usually conducted analysis of the target LSOA areas to establish the type of housing in the area and crime hotspots, through a combination of data analysis and day and night walkabouts by the policing team.
At this stage, the Designing Out Crime Officers tended to conduct Environment Visual Audits (EVAs). This was a critical step in the process as it was a key input into the choice of interventions and the target primary and secondary crimes.
2.1.4 Resident engagement
Only a small proportion of bid areas engaged with residents to develop their bid. Teams expressed that they would have liked to engage residents but could not do so because of the limited time available, as they saw it.
However, a few teams (approximately 10% of all the bid areas) mentioned that they carried out ‘light touch’ engagement initiatives. The method of engagement tended to be focus group discussions, either face-to-face or online, or through existing online engagement platforms.
Some example initiatives included:
- activities organised next to schools/nurseries around the time of drop-off so that teams could speak to parents returning from school
- engagement with a university within the LSOA to discuss the impact of crime
- discussions with retailers in the area
- a 3-day door knock initiative
- a community clean-up to help the team meet and conduct conversations with residents
Teams felt these community engagement initiatives were a critical supplement to the information from the EVA. However, there were some concerns that engaging with residents could lead to expectations that would not be fulfilled if funding bids were unsuccessful.
2.1.5 Asset and partner identification
There were bid areas which identified ‘assets’ (included existing networks, local organisations, volunteers and existing programmes that could be leveraged to help develop and implement the SSF1 programme) and partners as part of the bid development process. These teams collaborated to identity potential community assets and networks (for example, community organisations, residents’ groups, community representatives and key influencers).
2.1.6 Bid writing
Usually the PCC lead wrote the bid. Most teams said they were familiar with the SARA decision-making model (Scanning, Analysis, Response and Assessment) and had either applied it to their analysis or that the layout of the bid aligned with the SARA model requirements, which enabled them to comply with it[footnote 14]. Only a small minority of bid development teams were unaware of the model.
2.1.7 Feedback on the bid process
Most teams felt the bid guidance document was well-structured and they appreciated the directive instructions. Supporting resources such as the toolkits and seminars were felt to be highly valuable resources. The menu of interventions (as outlined in the SSF Toolkit) and supporting impact evidence (for example, in the Crime Reduction Toolkit from the College of Policing) were central to the choice of interventions and design of the respective bids. The bid submission platform and process were also reported to be straightforward and practical to use.
“We drew heavily on the College of Policing’s toolkit and the academic research to think about the vulnerability of the properties.”
There was consistent positive feedback on the Home Office’s support throughout the process. Bid teams regarded the Home Office as responsive and helpful to queries. The extension to the submission deadline was also highly appreciated and enabled some bid areas to assess the feasibility of the bid and, to an extent, engage relevant stakeholders.
However, most areas felt that the timings and the application requirements were key challenges that negatively impacted their bids. The timing of the bid launch was challenging for bid areas. As the fund was launched during the summer, staff being on leave during school holidays reduced resource, and teams were less able to coordinate efforts and engage partners. This resulted in inadequate community and partner engagement, and less research conducted about the area.
The uncertainty of the COVID-19 pandemic also presented a challenge. Resources diverted to COVID-19 pandemic responses reduced staffing and capacity. Areas also had to adapt to the uncertainty of potentially navigating national and local lockdown restrictions in the future.
“The biggest challenge was in the time scales. There was a lot of data to work through and engaging with local communities was not easy to do quickly.”
Despite the extension for submission, many teams felt that the time allocated for bid development was inadequate. The lack of bid development time was also cited as a key reason that some areas did not submit multiple bids (to cover more than one crime area, as outlined in the bid guidance).
Bid teams also reported issues with the application requirements. One challenge related to the requirement to use LSOAs, as some teams record their crime data via ‘beat areas’, which are different to LSOAs. To see LSOA data, an extensive re-mapping exercise was required, adding more time to an already tightly timed process.
“Police don’t have information via LSOAs, they have it via their ‘beat’. We had to get special permission from the council’s data team.”
“Felt like the HO [Home Office] was naïve in expecting bid areas to do a full-on academic exercise when there are better ways of providing evidence – was just a bureaucratic exercise that could be slimmed down; the volume of paperwork was overwhelming and didn’t marry up with the timescales.’’
A further challenge was that some teams felt that to fulfil the bid criteria, they had to select areas that would not otherwise have been their first priority. For example, there were areas which were a priority for the police but had a mix of domestic and commercial properties and so had to be excluded due to the bid criteria (which for SSF1 focused on residential areas, and crimes against individuals and households).
Bid teams in more rural areas raised a final issue. They felt the criteria and LSOA requirement was an urban bias, despite acquisitive crime also affecting rural areas. This feedback informed the next round of SSF investment as the Home Office adapted the eligibility of the fund to ensure non-conterminous rural areas were in scope along with commercial areas.
“Criteria from HO [Home Office] was very strict – wanted to do a rural bid but couldn’t make the criteria fit, would have been better if it wasn’t so restrictive.’’
2.2 Overall programme implementation experience
The Home Office announced the successful areas in May 2020 with the funding scheduled to end by 31 March 2021. Due to the delivery challenges, 32 bid areas applied for and were granted an extension to the funding until the end of June 2021.
The COVID-19 pandemic and the implications of Brexit strongly affected the implementation of local SSF interventions. COVID-19 impacted on resource as staff were diverted to work on local COVID-related activities such as test and trace. National and local lockdowns and social distancing requirements also made it challenging for areas to implement interventions as planned, thereby curtailing the ability to conduct in-person events and encourage resident take-up. Brexit primarily caused shipping delays, although there were also references to certain products being limited. However, the extension to the programme timeline (from March to June 2021) for some of the SSF project areas enabled bid areas to progress on delivery and adapt their programme plans and schedules.
“We were impacted by Brexit – the CCTV equipment we’d ordered was held up at the docks for over 3 months.”
Some common factors emerged across bid areas in their approach to implementation:
Central resources and evidence were used for programme design.
Bid areas reported using evidence primarily for intervention selection at bid development. Key sources included the What Works toolkit, College of Policing website and Police Crime Prevention Initiatives blogs. [footnote 15]
Across bid areas, the core partners for implementation and delivery consisted of the PCC, constabulary and local authority.
Other partners included within various bids included housing associations, Neighbourhood Watch teams, Community Safety Partnerships and other local community organisations.
Bid areas demonstrated flexibility and resilience in their implementation approach. Despite challenges posed by Brexit and the COVID-19 pandemic, most bid areas adapted their programme plans and how they approached intervention delivery to successfully complete intervention. Examples of adaptations included engaging with communities virtually, different communication approaches and extending target areas.
Proactive measures were taken to ensure the sustainability of interventions.
Bid areas reported taking specific measures during the implementation phase to ensure sustainability of the interventions. Examples included CCTV contracts that extended beyond the programme period, having a choice of home security products accredited by Secured by Design and offering ongoing advice to residents.
Some areas interviewed also reported a ‘behaviour change approach’ to bring about positive changes in the community, to ensure sustainability of some interventions. This referred to initiatives aimed at positive changes in behaviour amongst residents that may help to ensure continued effectiveness of the interventions. For example, communication campaigns targeted at students to drive the practise of locking doors and windows in their home, as a support to interventions focused on target hardening of homes.
2.2.1 Key enablers of a successful implementation
Interviews with the project and intervention leads revealed key factors that they believed contributed to the overall success of programme delivery.
a) Partnership working
Having strong relationships between implementing partners was seen as core to a successful project. Areas that had established and strong relationships with their partners felt they were key to helping them overcome process delays, reach hard-to-engage groups and collect additional information about the community. Good partner relationships also helped with the need to work flexibly and to tight timescales. This was particularly critical given the unprecedented nature of working through the COVID-19 pandemic, where there was a constant need to adapt and respond to new challenges. Successful collaborative working was facilitated by open communication and by all partners feeling as if they were working towards the same goal.
Case study 1 – Partnership working
To deliver target hardening, a PCC partnered with an arms-length management organisation (ALMO) who manages the council’s housing stock of properties. There was already a strong partnership between these 2 organisations, which proved critical as the PCC navigated the unprecedented challenges of the COVID-19 pandemic. This enabled them to work together flexibly throughout lockdowns.
This relationship meant that the partner only claimed for completed work. An acknowledged risk of working with an unknown partner was that it might have been much more challenging in terms of stop-starting throughout that period.
“The lesson we’ve learnt is when you’re trying to deliver projects of this nature – quite a lot of money spent within a very short amount of time – having those really good strong partnerships already established are really critical to guarantee you’re going to achieve those deliverables by the deadline.”
(East Midlands, Urban)
By contrast, in areas where partner relationships had not existed prior to SSF, it took more time to forge them at the start of the programme. This, bid areas felt, could create a barrier to success given the tight timescales and need to act quickly to get the project underway. This highlights the importance of early partner engagement prior to implementation.
Having senior management buy-in and collaboration across partner organisations supported and enabled partnership working. Stakeholders consistently fed back that collaboration between senior leads across organisations helped remove implementation barriers and meant that staff on the ground prioritised the programme. Communication from the top also drove responsibility for the programme within each partner organisation. For these reasons, securing senior management buy-in as early as possible in the programme process is important as it shapes ways of working.
A further benefit of partnership working was that it helped extend the project to include more hard-to-reach groups. Links and relationships within communities could take many years to build. Having partners with existing relationships extended the reach and impact of the project significantly. As an example of this engagement, some local authorities engaged residents and landlords and could thereby identify higher-priority residents.
Case study 2 – Inclusion of hard-to-reach groups
One team worked closely with the housing department of the local authority. This enabled them to link in with them in terms of housing information in the targeted areas.
Because of this, they had access to statistics on repeat victims who became a priority for target hardening. Within the targeted areas, they could therefore analyse the statistics to see who had been a victim of burglary before, and who was older or vulnerable. This allowed them to prioritise and tailor their offer to these residents initially.
“We were able to narrow the scope down to ensure those who were most vulnerable had first priority.”
[Wales, Urban]
Strengthening working relationships with partners could positively impact future programmes beyond just SSF1. As a result, areas felt they could engage partners in future work, which would be valuable in the future.
b) Interventions led by the appropriate teams/individuals
Selecting the right intervention lead was a further enabler of success. Identifying teams and leads that had experience in the intervention being implemented was valuable. This experience was especially critical for interventions such as CCTV and alleygates that had complex administrative requirements. In some cases where a team oversaw multiple bids, they reported different implementation experiences on specific interventions driven by the experience of the lead and partners.
For example, where the local authority was the lead partner for CCTV, areas reported a fairly smooth experience compared to those areas led by the police or the PCC (with limited experience on CCTV installation). Local authorities tended to be responsible for CCTV management and installation so were therefore familiar with both the requirements and processes, and had established suppliers and installation contractors.
c) Dedicated project manager (and effective project management)
An important insight identified by areas with a project manager was the value in having dedicated staff for specific roles – enabling delivery of interventions according to plan. These dedicated staff were better positioned to respond to challenges that arose and established stronger relationships with the different partner organisations.
Case study 3 – Effective project management
Ensuring that SSF was a priority, and that momentum was maintained, was a challenge in one area with a very small community safety team within the local authority. They decided to recruit a dedicated project manager to oversee the delivery and implementation of the project. The team felt that without this dedicated resource, they would not have successfully implemented the programme.
“We went for an ambitious SSF project, with a number of plates spinning. Add in the complexities of COVID-19 to that and we really needed a dedicated person. Having a SSF Project Manager was invaluable.”
(North West England, Urban)
d) Mobilising academic expertise
Some bid areas worked with academics and experts as part of their delivery. The academics were felt to have brought in fresh thinking and approaches that positively influenced delivery. For example, academics encouraged teams to use evidence to help identify what about the interventions had worked and what had not.
Academics, which included professors from nearby universities, also supported bid areas to have measurable objectives and specific initiatives, setting them up to draw learnings for future programmes.
Case study 4 – Mobilising academic expertise
One bid team consulted with 2 professors who guided them throughout the SSF project. They discussed matters such as whether there were elements of their target hardening approach that could be more effective and easier to achieve, given the challenges around timing and other external factors.
This team struggled initially to meet their target hardening implementation targets due to low take-up from the community. They consulted with their academics throughout for advice on which elements they could substitute if required.
“Throughout SSF we were able to ask the academics what elements could be substituted or changed if needed, and what effect that would have. We found it invaluable to have them as a resource.”
(North East England, Urban)
2.2.2 Implications for future programmes for bid areas
SSF areas reflected on the lessons they had learnt as part of the bid development and implementation process.
Area teams identified the following key learnings and implications relating to the bid development stage:
- engaging with delivery partners early in the bid development phase would help to ensure all partners are working to the same expectations and deadlines; as timings are tight and there is a need to be flexible, giving key partners as much warning of this as possible would be beneficial; early engagement could also help to improve the delivery of interventions later, should the bid be successful.
- engaging and consulting with residents during the bid development phase could help with resident support for the interventions and future sustainability
- focusing on accurate cost projections at bid development and investing time up front to identify suppliers could save time and help mitigate against unexpected budget changes
- having a dedicated lead who knows the area and has contacts could help when developing the bid, to ensure inclusion of the relevant people and information
Area teams identified the following key learnings relating to implementation:
- as with at the bid development stage, ensuring that partners are engaged early on and committed to the joint planning of delivery can help to ensure adherence to initial plans
- select experienced intervention partners with prior experience of delivering the intervention and/or partners who understand and know how best to engage with the local community
- allocate a dedicated programme manager or delivery staff where possible, which can help to mitigate against ‘drift and delay’ when coordinating with multiple partners
- leverage academic or external expertise, where relevant, to support evidence gathering and inject fresh thinking
- establishing a clear plan for tracking and measurement to track programme delivery and gather learnings on impact, possibly done in conjunction and with support from an academic partner
- establish a line of direct communication with the community to help gather feedback and, if required, adapt the approach or delivery
2.2.3 Implications for future programmes for the Home Office
SSF areas identified the following learnings and implications for the Home Office to consider at the bid development and implementation phases of future programmes:
Consider the timing of the bid launch
The timing of the launch can have a big impact on the resource available for teams to develop quality bids. Where possible, avoid holiday periods and other major funding applications and deadlines.
Offer longer lead time for bid development
Ensuring there is adequate time for teams to conduct local research and engagement is key to ensuring bid plans are well researched and set up for delivery.
Provide guidance and best practice information on the sustainability of interventions, community engagement and calculating programme costs
Central resources and toolkits, such as best practice examples for different interventions and practical examples, could help to support intervention sustainability and community engagement. Also include additional guidance in the suite of central resources on considerations and approaches to costing.
Provide additional guidance
On implementation processes (especially for those interventions with complex governance requirements).
A structured approach to collating these learnings
This would deliver a valuable resource for future programmes. Areas have built strong banks of knowledge on interventions (such as CCTV), community engagement and target hardening in the face of the COVID-19 pandemic restrictions.
There is also an opportunity to share best practice where specific target groups have been engaged successfully
Groups such as students or landlords require a customised approach and sharing information across areas implementing programmes for these audiences will help in implementation. Like the communications workstream, there is an opportunity to use learnings from non-SSF areas as well (where this has been addressed successfully).
2.3 Selected SSF intervention-specific learnings
To support future policy development, and also help local areas with implementing future interventions, the process evaluation also distilled several key learnings from implementing specific interventions. This section presents a selection of intervention implementation experiences – including CCTV, target hardening of homes and of public spaces, community engagement, and communications – together with key implications for future commissioning and practical recommendations.
2.3.1 CCTV
Seven out of 11 case study areas included CCTV as an intervention in their programme (overall 36 out of the total 52 areas implemented CCTV). Areas felt this deterred acquisitive crime and helped to bring down fly-tipping and ASB. CCTV was popular among residents, though implementation could produce some political challenges among delivery partners. Successful implementation often depended on the delivery team’s prior experience with CCTV.
2.3.2 Key enablers of a successful implementation
Implemented by an experienced team: teams that were new to CCTV installation often found it difficult to navigate the complex requirements; however, experienced teams found it simple to implement, having good awareness of the time and information required. Overall, local authority-led implementation teams had more experience of CCTV than police/PCC teams and these teams felt that implementation had progressed smoothly.
Holistic approach to CCTV placement: many teams used police and crime data as well as insight from other organisations (such as Safer Neighbourhoods teams within the council, or police teams targeting car crime) to identify the crime hotspots where CCTV would be most effectively placed.
“We could coordinate it in with crime data, and organised crime groups. Council also advised on locations and data protection issues. Took bit of time as it’s beyond the scope of PCC experience but had good partnership working with the council.”
Enabled responsiveness to community: in some areas, particular groups (such as residents and landlords of social housing) were supportive of CCTV and had specific requests for installation locations. SSF1 teams could meet these requests and install CCTV where the community wanted them.
“Land owned by registered social landlords, who were keen to have CCTV, so good partnership working. There were some estates with high deprivation levels where residents were quite keen, too.”
High visibility and proactive communication: CCTV was regarded as particularly effective when accompanied by highly visible communications about its presence. Stakeholders interviewed fed back that communication not only helped deter potential offenders, but it also helped to mitigate concerns about privacy among residents and the wider community. Study areas felt that proactive communication through media activity and community engagement helped to reassure residents about privacy issues while acting as a deterrent to potential offenders.
“We heard in a seminar and also from Keep Britain Tidy that the main deterrent of CCTV is the perpetrator thinking that they’ll get caught, so we promoted the message of CCTV presence via luminous signs on lamp posts saying everything is being filmed. Put flyers through doors. Anybody who lives in that street or visits that street will know that the surveillance is good.”
“I think residents are so frustrated with crime in the area, that every person who we spoke to was over the moon with the cameras.”
2.3.3 Key barriers to successful implementation
Complex governance requirements: in some areas, where police and PCC delivery teams had limited experience of CCTV, a lack of understanding of the complex processes involved resulted in delays. Commonly unanticipated issues included the need to secure planning permission, data protection requirements, the need to coordinate with existing CCTV systems, and plans for ongoing maintenance. Some stakeholders interviewed felt that non-police-led teams sometimes had not considered the quality or positioning required by the justice system (for example, for license plates to be visible for ANPR).
“Would have been easier if CCTV had been implemented by local authority rather than by the police … therefore we had to learn on the hoof, and then discover who we had to speak to, and then try and get them on board, and bringing them across considering they were miffed that they weren’t included.”
Areas felt implementation was particularly complex when multiple authorities were involved (such as, county authority, city authority), where the delivery team did not own the CCTV system or when the buildings where CCTV was to be installed were not owned by the implementing organisation.
Processes were further slowed by the COVID-19 pandemic as members of staff were on sick leave and resource was diverted to respond to the pandemic. A lack of clear communication between partners about expectations could lead to a reduction in effectiveness of CCTV; for example, if live monitoring of CCTV feeds is not included in provision.
“We underestimated the kind of CCTV and the cost required to get quality footage which is viable in a criminal case. Cameras need to be of a public commercial system and planning required is also significant … governance and policies around why it is being done, planning from a coverage point of view, total coverage of hotspots, ongoing maintenance, etc.”
Conflicting priorities: a few areas reported political differences or a lack of alignment between partners, resulting in delays or non-implementation. For example, in one area, funding for monitoring for CCTV had been recently removed, meaning that there was some sensitivity involved in reintroducing it. In other areas, the CCTV project overlapped with existing CCTV programmes, or fell under multiple jurisdictions, potentially leading to tension.
“Some of the cameras are on bordering LSOAs where there are different community councillors; this has ruffled the feathers of some other councillors and is a lesson for us in the future that we make sure all stakeholders from neighbouring LSOAs are engaged.”
Response from crime groups: in a few areas, newly installed CCTV was vandalised by organised crime groups. Bid areas felt that a plan should be in place to protect from vandalism when implementing CCTV in the future.
“We have got a bit of footage and some stills of this guy in military fatigues and a balaclava chopping this down within 24 hours or attacking it to the point where it had to be removed because it was unsafe.”
2.4 Target hardening of public spaces
Target hardening was anything that deterred, distracted or delayed, and included street lighting, fencing, alleygating, installation of communal doors, and working with the community to transform public spaces into allotments and playgrounds. Often, environmental improvements increased the community’s use of the area, making illegal activity more difficult.
2.4.1 Key enablers of a successful implementation
Straightforward to implement: many bid areas reported that the delivery of certain interventions such as street lighting and fencing was straightforward because of the simple processes involved. This contrasts with other interventions, such as CCTV, that had greater administrative or technological complexities or could be opposed by some residents.
Positive impact on perceptions of the area and SSF: there were reports of a very positive community response to certain initiatives that improved the local environment (for example, removing graffiti, creating community gardens) and those which had helped to eliminate long-standing ‘problem areas’ raised by the community (for example, demolishing disused garages). Bid areas reported that such measures had improved how people felt about the area and, by extension, about the SSF programme.
“People have been thrilled to see them; it’s made a huge difference. In consultation, people feel unsafe when they’re walking through an area covered in litter and graffiti, and what this has done has helped actually lift the area.”
“Demolishing of 15 garages behind a fencing area helped improve the area from drug activity, and residents gave positive feedback – not part of original bid’’
“It was adjacent to a hotspot of theft and robbery, into a place that is now much more open and accessible for all to use.”
Drove community engagement and ownership: as environmental improvements often created opportunities for residents to have a say in decision-making, bid areas believe there will be greater ongoing ownership of the projects, potentially improving the sustainability of the interventions.
“Residents are watering the plants daily and eating the veg! But also ensuring the plants are maintained and taking ownership of it.”
“Thinks it’s gone better than had done previously, because now [we] have a local voluntary group – they managed contracts for SS and picked litter up and got rid of weeds – really helped.”
“It really created a buzz for the community, not only in terms of there was an opportunity for funding but also for them to be a part of it, and for them to be linking into their community as well.”
2.4.2 Key barriers to successful implementation
Complex process of implementing alleygates: the primary implementation challenges for this set of interventions related to alleygates (implemented by 31 of the 52 bid areas). The overall feedback was that they were complex and time consuming to implement.
For private alleygates (that is, bordering property not owned by the council), there were challenges identifying property owners, especially in areas with a high proportion of private landlords where some do not live in the area. Obtaining consent from landlords was a further difficulty, as all landlords must consent to the alleygate being installed.
“Alleygating is a very well proven technique to prevent crime, but it’s very hard – it’s very labour intensive, and it’s very expensive.”
Difficulties in partnership working: Although in many cases the PCC led most of the implementation, the local authority tended to conduct consultations. In some cases, PCCs found that the local authority prioritised other activities over the consultation work.
“The council had to do the consultations. We had to remind [the] council of their responsibilities. It was trying at times because we had to get our partners to really step up.”
Also, as different local authorities had different processes and requirements, areas that were implementing alleygates in multiple areas encountered different challenges in each area and could not adopt a uniform approach.
“If an alleygate and anti-climb device is over certain height, some local authorities need planning permission to put the device on, others don’t. So, we could not get planning permission across the board as planned.”
Resistance from community: some residents, particularly those with restricted mobility, had concerns about access to certain areas. Further consultation during implementation addressed these requests but resulted in delays.
“We spent an awful lot of time talking to people, reassuring them, offering them advice without committing ourselves unnecessarily. That’s both draining on the team that are doing it, but also very time consuming.”
Vandalism and damage to gates: as with CCTV, some areas experienced a backlash from crime groups and gates were damaged as a result.
“I think we’re going through a period of high anti-social behaviour and crime at the moment, and I think that’s what’s making it a target again. It’s a very easy target for people because it’s; so visual.”
2.5 Target hardening of homes
Target hardening interventions included security assessments for residential properties, primarily for social housing though also for private properties. Following assessment, security measures were installed such as locks, security lighting, alarms and video doorbells.
One of the more popular interventions amongst residents, implementation of home security measures gained momentum once the COVID-19 pandemic restrictions were lifted. Word of mouth played a key role in driving the success of the intervention, with people requesting interventions after their neighbours had received them.
The positive response from residents towards video doorbells also created opportunities for bid areas to engage residents with SSF1 and crime prevention more widely. Bid areas felt that target hardening initiatives increased security of the properties and reduced acquisitive crimes when residents were out of their homes.
“It aided both the security of the property in terms of the security lighting and reduced acquisitive crime for when people were out and about, in terms of bikes being locked up in a less secure area.”
“It helps reduce the fear of crime, improves safety a bit, and it just encouraged people to put their hand up and say I’ll have the security survey for free please.”
2.5.1 Key enablers of successful implementation
Positive response from residents and community: local implementation teams perceived that target hardening interventions proved to be very popular with residents, driving awareness of and positivity about the programme. Local authorities or housing providers that owned buildings were also pleased that their properties were being improved for free, which drove a high response rate for these measures. There was particularly strong interest in video doorbells, leading to residents reporting an increased feeling of home security.
“I think that’s [target hardening] probably what’s won over our community the most. They really couldn’t believe what we were giving to them.”
“We’ve had requests for interventions from the community far in excess of what we’d have been able to provide.”
“The video door promotion – bringing those in means that people are registering … We’re putting a £50 doorbell in and it’s enticing people to get that – ‘I’d like that’, ‘why not’, ‘it’s too good to be true’.”
Successfully prioritised vulnerable groups: teams reported making a concerted effort to prioritise their vulnerable residents first. They obtained lists from Victim Support, PCSOs and Housing Officers of vulnerable people to ensure they were included and prioritised. They felt that home security assessments, conducted as part of the delivery process, had also helped them to identify groups of vulnerable residents or those with specific needs who otherwise may have gone undetected. The process of door knocking, and home visits provided a way in to identify social care referrals and other issues.
“The knocking on doors enabled police/wardens to have a look in people’s houses, discuss issues, residents were pointing out other houses where there were issues with neighbours.”
“We said to the Home Office we would target harden. So, we could just go, and target harden, or we could go, and target harden and actually look at other things at the same time. It was an engagement tool for us as well.”
Case study 5 – Prioritising vulnerable groups
In one area, door knocking, and the Neighbourhood Watch scheme identified vulnerable participants who were struggling or lonely. As a result, the Neighbourhood Watch began building a loneliness campaign around these residents.
Because of SSF and working so closely with the Neighbourhood Watch, they have been able to develop greater insight into the housing stock and communities.
“You know the community, you know the population, you know the housing stock and who owns it – yeah we had a good overview of that.”
(North West England, Rural)
Innovative approaches in response to the COVID-19 pandemic restrictions (that could also shape future programmes): when faced with the COVID-19 pandemic restrictions, some areas adopted different approaches to implement target hardening that worked particularly well. For example, one bid area resorted to remote home security assessments when they could not enter people’s homes. The remote assessments were so successful that the team is considering changing their ways of working in future.
“COVID presented us with an interesting challenge that then actually showed the worth of doing them [assessments] remotely, and actually how cautious I would have been around that at the start of the project, but actually we started to see quite significant efficiencies from it, and it got the homeowners quite involved and invested in the home security assessments.”
Partnership working to deliver added value: there were examples of positive partnership working where bid areas worked with other organisations, such as the Department of Work and Pensions (DWP) or the fire services, to deliver target hardening interventions besides other services (outside the SSF1 programme’s scope) that were needed by residents. For example, home visits for target hardening in one area also included the offer of fire service safety checks, council advice on recycling, and (DWP) contact about benefits and employment opportunities. Another area reported working with third-sector partners, enabling the team to identify and refer vulnerable individuals who would not have been otherwise identified, such as, victims of domestic abuse.
2.5.2 Key barriers to successful implementation
Difficulty engaging specific groups: bid teams reported finding certain groups more difficult to engage with and these groups were also less likely to volunteer for their properties to be covered. These included:
- vulnerable groups (especially in more deprived areas) who had low levels of trust in authority figures or were wary of the legitimacy of the offer
- landlords who were less invested in securing the property
- residents who were concerned about the potential costs of video doorbells
- students, who were generally more difficult to engage
“To start with, people were slightly suspicious around why people were knocking on their door, offering them free things – that doesn’t happen in life does it?”
“When first sent out to landlords, only got very small response which was concerning – did better with engagement of housing team.”
Bid areas attempted to overcome residents’ suspicions by communicating through partners that had existing relationships with residents, for example, through a local synagogue. Other bid areas set up dedicated areas on websites and communicated about the project through social media.
Limited insight into housing stock: limited knowledge of the properties involved sometimes hindered implementing target hardening. Examples included not being aware that some buildings were listed, which added time and complexity into the process; or inadequate understanding of the quality of the housing stock, which resulted in additional work being required (such as, fitting new doors or windows) before implementing the interventions.
Lengthy and complex procurement processes: without pre-existing suppliers in place, some areas had to go through formal procurement processes, adding time and complexity to the process. Conversely, areas with pre-existing suppliers often felt restricted and unable to select an alternative supplier as the best fit for the programme. In some cases, management of multiple contractors also added to the administrative burden.
“Procurement was an absolute nightmare. It’s very difficult when trying to do things quickly.”
“All the security stuff needed to be fitted by somebody and we found ourselves in knots of [sic] the procurement rules … we didn’t have time to go out for quotes, so we were hunting around for framework elsewhere in the country to piggyback on.”
Need for education and behaviour change to support home security: some bid areas felt that without adequate initiatives to change behaviour, encouraging residents to always lock doors and windows, some interventions may have limited impact.
“Students take care of their room … but the front door not being secure doesn’t bother them. Most burglaries could be prevented by locking doors.”
Delivery staff not fully briefed: a few issues emerged that related to key information not being aligned across the teams involved in implementation. For example, in one area, staff going door-to-door mistakenly offered residents interventions that were not included in the programme, which later had to be withdrawn. In another area, different teams conducting assessments and installations disagreed about what home security works needed to be done, resulting in inconsistencies and difficulties in budgeting.
Understanding the requirements underpinning video doorbells: areas implementing video doorbells often discovered a lack of Wi-Fi in the targeted properties, meaning residents had to return the device. In these instances, devices were replaced with more basic house alarms; it highlighted the digital exclusion of some residents and the importance of understanding the minimum requirements that they could communicated more clearly up front.
Case study 6 – Understanding barriers to take-up
One area reported that SSF had given them greater insight into the challenges the local community was facing. Because of this, they had a greater understanding of why the offer of free target hardening may not be taken up. This insight had helped them to understand some of the barriers that they might face with implementing future programs.
“That’s what we’ve got to start understanding, is how other people live, what their challenges are, and that it might seem like here’s a great freebie, it will protect you, but those people are wary of those things for a lot of reasons.”
“I always think of the scenario, single mum, she’s at home with 3 kids, she’s really struggling to make ends meet, and she will be worried about the fact that she hasn’t got a carpet in that room because she can’t afford a carpet and she can’t afford to put the heating on … then somebody knocks on the door and says oh I want to offer you a light and all the rest of it, other than the fact she probably thinks I can’t afford that, do you really think she wants to let that person in to see the state of her house? Because she believes that person will tell Social Services.”
(North East England, Urban)
2.6 Community engagement
Most areas carried out some form of community engagement to consult on their priorities, particularly in relation to target hardening of homes and implementation of alleygates, but also for the wider SSF1 programme. Initiatives included home visits, door knocking, street surgeries, online meetings and pop-up awareness-building activities. Engagement took place largely with the help of partners, though in some cases, areas recruited specifically for this purpose.
Stakeholders felt that community engagement was critical to the success and sustainability of their programmes, and there were multiple success stories across bid areas. Positive feedback from the community informed bid areas that engagement had been successful, though areas felt that the COVID-19 pandemic limited their activities.
Case study 7 – Sustainable community engagement
One success story from a bid team related to a landscaping project. As a result of developing a shared garden, they have also created community cohesion. Now, the residents are watering the plants daily, ensuring the plants are maintained and taking ownership of it.
“They’ve started to take some ownership, and for me that’s about the sustainability of the project – whilst you can say what’s lettuce planting got to do with designing out burglary, it’s about the eyes and ears of the community, in the same way as Neighbourhood Watch, so it’s making that visible guardianship much more ever present across the estate.”
(South England, Urban)
Hopefully, encouraging neighbours out of their flats and talking to other neighbours will also enable them to report any criminal activity.
2.6.1 Key enablers of a successful implementation
Partnership working: bid areas leveraged a range of partners with existing links to the community who had in-depth local knowledge, credibility with residents and understanding of local crimes, including:
- local PCSOs, ASB teams, Community Safety Partnerships, Neighbourhood Watch
- parish councils
- food banks
- places of worship, such as churches/mosques/synagogues
- local student representatives (in areas with a high student population)
- National Farmers Union
- other groups or individuals already working on local community activities
“The impact [of parish council members] is positive in some villages because they’ve just done our job for us. They’ve put leaflets up everywhere, they’ve gotten [sic] the message out, they’ve held meetings in community halls, they’ve got WhatsApp messaging groups.”
Working through partners, areas felt, helped to include harder-to-reach residents who would be unlikely to engage directly with the police or local authority. One area used ‘community champions’, individuals who spread information via word of mouth. The ‘champions’ trained through Victim Support to ensure they were equipped with skills to engage with vulnerable residents. The team felt the champions were integral to the success of their programme and are keen to strengthen their role in future.
“They were just like an extra pair of eyes and ears in the community for us. They were giving free stuff out and making people more aware, and giving people confidence in what we were doing, and giving tangible results, making people want to come and naturally report things to you as well. You’ve got to remember this community is very sceptical of anybody in authority. They don’t trust Social Services; they don’t trust the police.”
“I think that was quite key actually, having somebody from the community that knows people, and is also trusted and liked there as well – that was the big pull for people to come and join.”
Flexibility in budget to respond to resident requests: some bid areas found that spending some of their budget in direct response to community requests made a positive difference to their programme. In some areas, they conducted ‘participatory budgeting’, where a portion of the budget was pre-allocated to a project of the community’s choice. In other areas, there was flexibility in how the budget was spent in response to resident feedback. For example, one area conducted a survey and focus group with residents, which led to changes in the proposed projects to include things that the residents needed, such as the creation of gardening space, removal of bulk waste and street clean-up operations.
“As part of our participatory budgeting initiative, residents asked us to remove a wall outside a retail outlet that they believed was leading to ASB. We did this and are replacing it with bike racks. It is important to show them through activities like this that we are listening and their voice matters.”
“Some of the projects they prioritised were not directly linked to our programme objectives, but we are doing them because it is important to get the community engaged.”
Approach adapted to address the COVID-19 pandemic restrictions: though restrictions related to the COVID-19 pandemic limited engagement opportunities, some teams found greater success and innovation in their adapted approaches. For example, some online events could attract a higher number of participants compared to face-to-face activities, as attendance was easier for some residents. One area felt that the online approach helped give people a voice who otherwise might feel unable to express their views. Other areas organised different events in response to the restrictions, such as open-air cinemas (with safety packs distributed at screenings), which proved very popular among families. Another area used Geotag[footnote 16] to identify and message people in the area about upcoming SSF events.
Case study 8 – using more than one channel to engage communities
Through door knocking, one area learnt that a specific area had an active community WhatsApp group. Through their community contacts, they could therefore utilise this existing WhatsApp group to engage with the wider community. The WhatsApp group also became a way of responding to enquiries and communicating when necessary.
The area acknowledged that without the initial door knocking they may not have accessed this avenue. This learning will be taken forward for future community interventions.
“The WhatsApp group turned out to be essential in actually supplying the means to actually get in touch with people. Very useful indeed.”
(South East England, Urban)
Face-to-face contact in addition to leaflets and digital communication: besides digital engagement and leaflets, many bid teams made efforts to engage face-to-face where possible, to ensure engagement with those who may be digitally excluded. They felt that door knocking, for example, was important in reaching the transient population and foreign nationals, while also improving knowledge of local crime issues.
“The knocking on doors also enabled police/wardens to have a look in people’s houses, discuss issues; residents were pointing out other houses where there were issues with neighbours.”
2.6.2 Key barriers to successful implementation
The COVID-19 pandemic: while there were successes, teams also reported that the COVID-19 pandemic greatly affected their plans for community engagement, with many teams feeling unable to engage their residents to the extent they had planned to. Teams felt particularly limited because they could not bring people together in informal settings with food and drink, which they felt would have attracted residents.
“That posed the most challenges. I think if we’d been out there doing our events in the community centre, we would have had a higher response rate.”
Low business engagement: linked to the COVID-19 pandemic context, areas reported that local businesses were very occupied with instituting the COVID-19 pandemic processes and applying for grants from the local authority, which reduced their willingness to engage with SSF activities.
Limited response to Neighbourhood Watch (in some areas): in some areas, stakeholders felt that Neighbourhood Watch was seen as less relevant because there were already other local/neighbourhood groups in operation, with established networks for efficient information sharing.
“There’s lot of people who’ve set up own WhatsApp groups– they can get info out quicker via this than Neighbourhood Watch. So, it seems bit old fashioned way of working. Residents are saying they’re already on a FB [Facebook] site or WhatsApp group and see Neighbourhood Watch as another bit of work. For me, Neighbourhood Watch needs to drag itself forward now and look how we can tap into what they’re already doing … because it’s already there.”
Self-selecting groups: some areas noted that groups with particular points of view dominated their consultation. For example, one team noted that only retired people residing outside the target estate attended their sessions, and they used the session as a complaints forum rather than giving useful feedback on the interventions.
2.7 Intervention-related implications and recommendations
2.7.1 Overall intervention implications for bid areas:
- ensure that the right team leads an intervention’s implementation, and that the delivery team includes individuals with prior experience of implementation and a good understanding of the governance processes involved
- research existing supplier agreements and procurement processes and build this into intervention plans, budgets and timeline
- consider the local, political landscape during the planning stage (particularly where there are multiple organisations involved)
- in areas at risk of vandalism, coordinate protective measures for CCTV and alleygates with local policing teams
- engage delivery partners early to ensure priorities are aligned and responsibilities are clear
- leverage the knowledge of existing local organisations with deep connections to residents (particularly harder-to-reach groups) and understanding of local issues
- leverage information regarding implementation in published reports, particularly on alleygating and CCTV
- consider an end-of-funding exit plan and other ways to establish sustainability through community involvement
- develop a range of activity formats, including online and face-to-face, even if there are no restrictions due to the COVID-19 pandemic in place, to ensure maximum engagement and participation across different groups and partners
2.7.2 Intervention-specific recommendations
CCTV:
- plan for ongoing CCTV operation beyond the programme period (including allocating responsibility among local partners)
- future bid areas should develop a proactive CCTV communications plan, ideally after having engaged with the community to ensure CCTV placement and the messaging reflect local needs
Target hardening:
- research and plan for the governance processes required to implement alleygating; teams should take time to understand the housing stock in target areas to anticipate likely challenges, and to consider the different types of residents and their likely needs; this includes carefully considering whether to include areas with a high incidence of private landlords
- leverage existing or fresh insight about the local community to help anticipate potential barriers to engagement and develop tailored plans to engage with groups such as landlords, students and vulnerable groups
- seek opportunities to maximise knowledge-sharing opportunities, for example, in areas with high student populations
Community engagement:
- consider how best to leverage community ownership of the improved public space, ensuring that community consultation is weaved through their design and delivery
- research any existing local neighbourhood groups that may overlap with Neighbourhood Watch and consider how they use and communicate Neighbourhood Watch in line with local schemes
2.7.3 Intervention implications and recommendations for the Home Office
Share and disseminate cross-departmental best practice insight on engaging with harder-to-reach groups, such as landlords and students:
- signpost existing guidance and collate implementation learnings from across the bid areas and consider sharing to encourage delivery teams to use, in the context of likely resource constraints
- in future bids, consider allowing a portion of the budget set aside for projects requested by the community, helping to build trust and strengthen relationships between the police and the community, and increase positivity towards SSF
- consider developing a bank of community engagement activities as part of the suite of central resources, to make it easier for teams to replicate successful initiatives
- consider educational or behaviour change initiatives to ensure that residents’ actions shore up home security measures
2.8 Communications
The aims of communications conducted as part of SSF programmes were to:
- inform and educate the community about the programme
- build engagement and enhance feelings of safety and pride in the area
- encourage residents to take up the interventions
SSF areas targeted communications at potential victims and residents, rather than offenders, to ensure that messaging supported the wider programme, and instilled a sense of ownership of the area (rather than suggesting the area was unsafe). As a result, messages tended to be positive and focused on the investments and improvements, rather than on crime.
“It’s a fine line between deterring offenders and making residents feel unsafe as well.”
2.8.1 Key enablers of successful implementation of communications
Specific target audiences: the targets for SSF communications were highly specific, focusing on the residents and businesses who the interventions would affect. This ensured that expectations were not raised among those beyond the scope of the programme. One area used a hyperlocal social networking service for their online communications (Nextdoor.com), rather than other social media, to ensure only specific residents were targeted.
“Not all interventions are for all residents, so we broke it up into 3 letters so they can understand what’s happening in their streets.”
Build on community engagement: linking communications to community engagement was important in several areas, with communications being seen as a one-way channel and engagement a 2-way channel. Some areas looked for ways to incorporate opportunities for feedback and more personal engagement as part of their communications plan; for example, one area created a Facebook group and encouraged residents to leave comments and ask questions.
Leverage trusted brands: as with community engagement, areas had success in leveraging the brand of other groups that were trusted by the community. For example, one area used the fire and rescue service to conduct door knocking about alleygates among vulnerable residents. This also reduced the need for police resource. Linked to this, other areas successfully tied their communications to existing umbrella brands, using the same visual identity and tone to drive awareness and recall. For example, the ‘Love Rainham’ brand was adapted to ‘Love Gillingham’.
2.8.2 Key barriers to successful implementation of communications
Challenges related to the COVID-19 pandemic: areas highlighted time and resource constraints with central teams within local authorities focused on core messaging for the COVID-19 pandemic for the area and the ongoing amount of work associated with this. As with community engagement, communications also faced limitations related to the COVID-19 pandemic restrictions, and though some events transitioned online, other events could not be implemented. For example, some areas had planned for council staff to personally deliver letters, which they decided would not be appropriate.
Cross-team working: most areas adopted a multi-agency approach to developing and delivering their communications, but feedback suggested that success depended on communications being delivered by a single team, with a single point of control.
2.8.3 Implications: principles of best practice for communicating with the local community
Kantar Public conducted a separate strand of research with a sample of 10 police forces, of which 6 police forces implemented the SSF programme. The team conducted one-hour telephone interviews with communication leads alongside a review of relevant communication materials. This piece was a small add-on to the wider and more comprehensive evaluation of the SSF programme.
This research gained insight into how police forces are developing and delivering crime prevention communications focused on neighbourhood crime (targeted at both offenders as well as public/communities). Building on this evidence, the team developed and present here a set of best practice principles of crime prevention communication that can be applied to future communication campaigns.
- Use communication as a tool to drive both awareness AND behaviour change to prevent crime: communication is key to driving awareness, informing and educating. However, it also has the power to drive real change in behaviour and enhance the impact of interventions. It is possible to have messages with different objectives on a single programme, although it requires careful planning and consideration at the outset, with the objective of different messages agreed at the outset.
- Centralise control as far as possible: centralising control and responsibility of the campaign within a single team helps to ensure that implementation follows the strategy/plan. It is easier to control and coordinate what messages are being delivered and how, when there is a single point of control. This team, and the sign-off processes involved, should be agreed at the outset and should include people with communications expertise.
- Maintain consistency in messaging – tone of voice, look and feel: consistency drives recall, recognition and ultimately trust. Even when the content is different, consistency can be achieved through tone of voice, colours, visual stye, type of imagery and logos. It ensures people recognise the messages are about the same programme/issue/solution.
- Keep it personalised and relevant: make your messages as relevant as possible to your target audience to ensure they know it is for them. Reflect your community in your communications through language, familiar imagery and personalisation.
- Leverage the power of community engagement initiatives (like, with residents, businesses, political groups): community engagement is a critical supporting tool to enhance the impact of communications. Community engagement and communication teams need to align their plans so activities on the ground in the community support and enhance the communication (and vice versa). Working with relevant organisations (businesses, charities, schools), informal networks of influencers, and opinion leaders can help drive this programme forward.
- Get noticed and make it memorable – umbrella branding and catchy slogans: creative slogans and catchy umbrella brands do get messages noticed and remembered. Keeping it short, simple, focused and catchy, and using it across all communication on this programme ensures people recognise it as one programme/campaign which reinforces the message every time anyone is exposed to the communication.
- Tap into external expertise where possible – they bring in another perspective: external experts like academics and communication specialists may be able to bring in a different perspective and a different way of doing things. Experts can help develop communication plans or input into materials, whether they are internal, specialist agencies or experts who have delivered similar programmes in the past.
- Think 360 – victim, community and offender: the impact of communications can be maximised by addressing all the players involved, driving action at every level. Each one plays an important role in preventing crime. Different audiences should be targeted – victims, offenders and community – with messages individually developed or customised (in content and style) for each. This could also include tailoring according to the local profile of residents, from young people to hard-to-reach groups.
- Go beyond leaflets – use outdoor spaces and non-traditional forms of communication to get your message across: leaflets and letters are important forms of communication when addressing the community. However, there are many other forms of communication available, from social media to the use of public space. Leverage the physical spaces around your target audiences to get your message across.
- Be immersed in the insight: the preferences, attitudes, aspirations and fears of a community can be used to shape effective messages. There are a range of information sources that can be combined to help in understanding a community from different perspectives, including data on demographics, lifestyle, habits, cultural beliefs and attitudes, police and local authority data. Previous communication campaigns can also be reviewed to understand which have been successful in the community and why.
- Build a clear measurement and evaluation plan: the communication strategy and planning should include a clear plan for measurement of progress through the programme and performance at the end of the period. Parameters of success should be shaped by the strategic goals of the programme and be both tangible and measurable. How data is collected should be planned in advanced and responsibility for collection allocated. It is important to define how progress and performance will be reported, and to develop a clear plan for how progress and performance learnings are recorded, so they can feed into future programmes.
3. Impact evaluation findings
The impact analysis presented here uses analysis of police recorded crime data and analysis of the surveys conducted of residents before the programme and in the later stages of implementation (described as survey-based analysis). This analysis should be read with the following caveats in mind.
There were several factors that limited the evaluation of the SSF1 programme in its ability to detect statistically significant impacts within the given time and budgetary parameters. Firstly, because of the disruption of the COVID-19 pandemic, there were delays to the implementation schedule of local projects. The Home Office granted an extension to 32 SSF areas to allow for more time for implementation until June 2021, compared to the original deadline at the end of March 2021. However, the timing of the follow-up residents’ survey (24 May to 5 July 2021) could not be pushed back further than May 2021. This meant that most areas were still implementing by the time the follow-up survey data was collected, thereby limiting the available time for local interventions to be noticed by residents of the selected SSF areas, and for the interventions to impact upon crime.
The analysis of police recorded crime data sought to control for the effects of the COVID-19 pandemic. However, there was the potential influence of statistical floor effects on some of the outcomes measures due to the data being distorted by the pandemic, that is, where crime levels were already low, there was then very little variation in the data expected within bid and comparison areas making it more difficult to detect change. Additionally, the 3-month data reference period (April to June 2021) that was applied here also overlapped with areas still implementing their interventions.
Considering these challenges and limitations, the Home Office has commissioned Kantar Public to undertake further impact analysis to examine the impact of SSF1 over a longer timeframe. This future analysis will largely replicate the current police recorded data analysis approach but use a longer data reference period (covering 12 months of data from April 2021 to March 2022, rather than the current 3 months from April to June 2021). The plan for further impact analysis of SSF1 includes the option of increasing statistical power by pooling the SSF1 and SSF2 survey data and analysing common questions together, which might allow for sub-group analysis in the future.
The following section summarises the preliminary impact findings from 2021 below. Most questions asked in the SSF1 resident surveys are being asked in the SSF2 resident surveys in 2021 to 2022. The team can then analyse these with a larger combined sample using both surveys.
3.1 Experience of key offences
The preliminary analysis of police recorded data did not find any statistically significant impact on the number of acquisitive crime and burglary in areas where the SSF1 programme was implemented during the first quarter of the follow-up period (April to June 2021).
Likewise, the survey-based analysis did not detect any statistically significant impact on residents’ likelihood to experience or witness acquisitive crime or ASB in the local area in the last month.
However, the survey-based analysis found one statistically significant impact from the SSF1 programme for a specific type of ASB. This impact was on the likelihood of residents experiencing begging, vagrancy or problems with the homeless in the last month (-6pp). This finding is likely influenced by some unknown interaction between the SSF1 programme and government support to prevent homelessness, particularly rough sleeping, during the COVID-19 pandemic through the ‘Everyone In’ initiative (DLUHC & MHCLG, 2021), which would explain why residents would be less likely to experience these issues with homeless people.
3.2 Resident perceptions of crime and policing
The survey-based analysis found that the SSF1 programme had a statistically significant impact on residents’ likelihood to say the local police were doing a good or excellent job in their local area (+7pp).
It also found that the SSF1 programme had a statistically significant impact on residents’ likelihood of being fairly or very worried about being mugged or robbed (-9pp), meaning the programme reduced residents’ concerns.
The survey-based analysis did not detect any statistically significant impacts on:
- residents’ perceptions of how pleasant or safe they considered their local area to be
- residents’ feelings of safety when walking alone in their area after dark
- the effect of crime on residents’ quality of life in the last month
- residents’ likelihood of being fairly or very worried about having things stolen from their car, car theft or having their home broken into and something stolen
- residents’ perception of acquisitive crime or ASB as a problem in their local area
3.3 Awareness of SSF1 interventions
The survey-based analysis found that the SSF1 programme had a statistically significant impact on residents’ awareness of the Safer Streets project in their local area (+5pp). This could be because many of the areas focused on engagement with the community around implementing crime prevention measures, as well as public relations and communications campaigns raising awareness of the Safer Streets project.
There were unexpected statistically significant impacts on residents’ awareness of spikes on top of walls or fences to deter climbing (-7pp) and on residents’ awareness of car parks being built (+3pp). However, neither of these activities was a focus of bid areas, so it seems more likely that these significant results occurred by chance.
No statistically significant impacts from the SS1 programme were found on:
- usage of 11 home security measures listed in the survey, such as having external lights on a timer or sensor switch, having window locks and burglar alarms
- awareness of protective measures for public spaces in their local areas, except for spikes on top of walls or fences; the survey listed eight measures including CCTV and gates at the entrance of passages or alleys
- using any of the eight vehicle security measures named in the survey, such as alarms and electronic engine immobilisers
- awareness of community engagement measures in general, such as Neighbourhood Watch and the provision of new signage and information in local languages; in total, the survey asked about 13 activities, including the Safer Streets project itself
- awareness of environmental improvement measures to improve public spaces, except for awareness of building carparks; the survey listed 6 activities including community gardening and tidying greenspace
3.4 Resident recollection of communications
In the programme follow-up survey, Kantar Public asked residents to recall information about the actions their police and local council had taken to tackle crime and ASB since August 2020. No survey-based analysis of impact was carried out on these questions, as that would have required the questions to be asked in the pre-programme surveys. Key findings from these included:
- a third of residents in the SSF1 treatment group (32%) said they had seen or heard information about police and local council activity to tackle crime and ASB; three-quarters (74%) could identify what this was about, most commonly concerning protective measures in the local area (41%), home security measures (35%) or community engagement (23%)
- the most popular method to engage residents was through newsletters (29%), followed by Facebook (25%) and in-person visits (18%); local areas could focus on these means of communication in future projects, as it appears that these have worked best for recall by residents in the SSF1
4. Summary of implications and recommendations
This final section discusses several overall conclusions from the independent evaluation of SSF1.
The process evaluation indicates that SSF1 has been a broadly successful programme from the perspective of local PCC teams who implemented the interventions. There was a broad consensus that the Home Office effectively organised the bidding process, with appropriate information and guidance provided to local bid teams. Implementing SSF1 interventions was majorly affected by the COVID-19 pandemic and, to a lesser extent, by procurement delays caused by Brexit. The extension that was granted to the programme implementation timeline (from March to June 2021) enabled local teams to progress on delivery and adapt their plans and schedules. Despite these challenges, there was ample feedback from local stakeholders that their SSF1 interventions were enabling wider societal benefits in their communities.
In summary, the preliminary impact evaluation of SSF1 has not yet detected many statistically significant effects. This could be for a variety of reasons, including the COVID-19 disruption to project implementation; the timing of the baseline and follow-up surveys; the survey sample sizes and associated statistical power. Therefore, further impact analysis is planned with a longer follow-up period, which will look at the longer-term impact on police recorded crime data over a 12-month period, and analysing survey responses from SSF1 and SSF2 where possible to increase statistical power. That said, most quantitative ‘non-crime’ outcome measures are moving in the right direction, showing modest improvements on most outcomes and indicating a positive impact of SSF1. In particular, there was no impact on residents’ experiences of crime and only limited impact on ASB, there was a statistically significant impact on awareness of the SSF1 during the programme and a positive impact on resident confidence in the police.
The following sections discuss key implications of these findings – both for the Home Office in relation to commissioning practice and future SSF grant administration, and for local PCC teams who may engage in similar processes in the future.
4.1 Lessons learnt for local bid teams to carry over into future programmes
-
Best practice for developing bids:
- a joint approach between partners at bid development can promote early engagement and ownership of the programme
- early engagement of partners will prioritise the programme and set foundations for delivery
- gathering insight into community needs and physical areas is essential for planning interventions
- clear focus on accurate costing based on standard approaches; for example, using the Home Office Manning Tool to capture programme costs and benefits (College of Policing, 2021b)
-
Lessons for programme planning and set up:
- partner engagement and joint planning of delivery to ensure adherence to the initial plans
- leverage learnings on interventions gathered in previous SSF phases
- select the right intervention partners – based on experience of intervention and knowledge of the community’s needs
-
Programme implementation learnings:
- allocate a dedicated programme manager or delivery staff where possible
- leverage academic or external expertise where relevant
- establish a clear plan for tracking and measurement – to track programme delivery and gather learnings on impact
- establish a line of direct communication with the community to gather feedback and enable these inputs to guide changes in implementation approach, as required
4.2 Implications for the Home Office for future SSF commissioning
-
Timing of the bid launch along with time available for bid development and implementation is a key factor to be considered to drive additional and early community and partner engagement, collaboration between teams, and more sustainable interventions.
-
Additional guidance on implementation processes (especially for those interventions with complex governance requirements), programme costing to be considered as a part of the suite of central resources.
-
Areas have built strong banks of knowledge on interventions (such as CCTV), community engagement and target hardening in the face of the COVID-19 pandemic restrictions. A structured approach to collating these learnings would deliver a valuable resource for future programmes.
-
There is also an opportunity to share best practice where specific target groups have been engaged successfully. Groups such as students and landlords require a customised approach and sharing information will make it easier for areas to do this. Like the communications workstream, there is an opportunity to bring learnings in from non-SSF areas as well (where this has been addressed successfully).
-
Positive impacts on community were reported where areas had allocated a specific proportion of the budget for resident-requested interventions. Future programmes could require all areas to allocate a portion for this as it also drives community engagement and positive perceptions of the programme.
4.3 Suggestions to improve robustness of future SSF programme evaluations
-
Consider analysis requirements more explicitly at the design phase. For example, to isolate the effects of individual intervention types, each bid area needs to implement a smaller number of intervention types (1 or 2) so Kantar Public can confidently estimate the effect of each intervention type.
-
To increase the likelihood of detecting statistically significant effects of interventions, the team recommends considering the following:
- survey research and survey-based analysis:
- complete the baseline survey wave before implementation has started to ensure no contamination
- complete the follow-up survey wave a few months after implementation has finished to ensure measurement of full short-term impact on perceptions
- to maximise statistical power, budget for surveys would need to be increased to allow for a larger sample size
- analysis of police recorded crime data:
- data used to measure impact should be from after implementation has finished
- follow-up analyses of impact should be carried out to ascertain any future effects on police recorded crime, which may take longer to emerge
- survey research and survey-based analysis:
Appendix A: Crime breakdowns
Table 1: Breakdown of Safer Streets Fund Round 1 (SSF1) target crimes (from the bid analysis)
| Crime type | Target crime | No. of bid areas | % of total bid areas |
|---|---|---|---|
| Acquisitive crime | Domestic burglary | 43 | 82 |
| Commercial burglary | 3 | 6 | |
| Car theft | 15 | 29 | |
| Bike theft | 5 | 10 | |
| Theft (other) | 12 | 23 | |
| Shoplifting | 5 | 10 | |
| Robbery | 11 | 21 | |
| Anti-social behaviour | Alcohol in public places | 4 | 7 |
| Littering & dog fouling | 5 | 9 | |
| Intimidation/harassment | 3 | 5 | |
| On-street sex work | 3 | 5 | |
| Youth nuisance | 5 | 9 | |
| Off-road motorbike | 4 | 7 | |
| Drug-related activity | Drug use | 10 | 19 |
| Drug dealing | 7 | 13 | |
| Cuckooing | 2 | 4 | |
| Drug supply (incl. county lines) | 4 | 8 | |
| Criminal damage | Vandalism | 5 | 10 |
| Violent crime | Violence | 5 | 10 |
| Knife crime | 3 | 6 | |
| Gangs | 1 | 2 | |
| Rural crimes | Poaching | 1 | 2 |
| Joyriding across fields | 1 | 2 | |
| Sexual offences | Sexual exploitation | 1 | 2 |
| Environmental crime | Fly-tipping | 10 | 19 |
| Fires | 3 | 6 |
Table 2: Breakdown of SSF1 intervention types (from the bid analysis)
| Type of intervention | Intervention | No. of bid areas | % of total bid areas |
|---|---|---|---|
| Target hardening: public spaces | CCTV | 36 | 69 |
| Alleygating | 31 | 59 | |
| Street & other lighting | 29 | 56 | |
| Fencing | 14 | 27 | |
| Landscaping | 8 | 15 | |
| Anti-climb spikes | 4 | 8 | |
| Video entry system | 2 | 4 | |
| Target hardening: homes | Locks/chains | 19 | 36 |
| Doors | 13 | 25 | |
| Lights (inside/outside homes) | 12 | 23 | |
| Door alarms | 10 | 19 | |
| Gates/Fences | 10 | 19 | |
| Doorbells (e.g. video doorbells) | 7 | 13 | |
| Window restrictors | 7 | 13 | |
| Door viewers | 5 | 10 | |
| Motion-activated surveillance cameras | 5 | 10 | |
| Target hardening: vehicles | Bike locks | 4 | 8 |
| Bike storage | 4 | 8 | |
| Clutch claw (pedal lock) | 2 | 4 | |
| Faraday bags (car key signal blocking) | 2 | 4 | |
| Steering wheel locks | 2 | 4 | |
| Garage defenders | 1 | 2 | |
| Residential car parking permit scheme | 1 | 2 | |
| Safer Parking Scheme | 1 | 2 | |
| Community crime prevention | Neighbourhood Watch | 26 | 50 |
| Identifying stolen property | Property marking | 15 | 29 |
| ANPR | 7 | 13 | |
| Bike register | 2 | 4 | |
| Catalytic converter marking | 2 | 4 | |
| Asset tracking technology | 1 | 2 |
Appendix B: Funding allocation (2020 to 2021)
Table 3: Cost distribution across project areas
The Home Office awarded bid areas with initial funding of up to £550,000 to support their situational interventions. However, due partly to COVID-19 restrictions, there was some underspend whilst other projects were allocated additional funding through a mini competition after the original allocations or variated their original funding amount including extending implementation beyond March 2021.
| PCC | Area | Total grant funding |
|---|---|---|
| Avon and Somerset | Manor Farm, Bristol | £400,000 |
| Bedfordshire | Midland Road area, Bedford | £464,000 |
| Bedfordshire | High Town Area, Luton | £448,150 |
| Cambridgeshire and Peterborough | Arbury/West Chesterton area, Cambridge | £546,693 |
| Cheshire | Bewsey and Whitecross, Warrington | £550,000 |
| Cleveland | Newport area, Middlesbrough | £479,838 |
| Cleveland | Burn Valley area, Hartlepool | £444,608 |
| Cleveland | South Bank area, Redcar | £110,250 |
| Cumbria | Barrow-in-Furness area off Salthouse Road, Barrow-in-Furness | £436,994 |
| Derbyshire | West End, Derby | £514,561 |
| Devon and Cornwall | North Stonehouse close to Plymouth City Centre | £546,781 |
| Dorset | Pokesdown, Bournemouth, Dorset | £230,985 |
| Dorset | Boscombe West, Bournemouth | £35,372 |
| Durham | Northgate, Darlington | £298,918 |
| Durham | Horden, County Durham | £560,360 |
| Dyfed Powys | Glanymor and Tyisha, Carmarthenshire | £195,673 |
| Greater Manchester | Hilton Park, Leigh | £523,933 |
| Greater Manchester | Fallowfield, South Manchester | £360,080 |
| Hampshire | Bargate, Southampton | £549,991 |
| Hertfordshire | Cheshunt East | £310,802 |
| Hertfordshire | Cheshunt South and Theobalds | £390,976 |
| Humberside | Westcliffe Estate, Scunthorpe | £650,000 |
| Kent | Gillingham North, Medway | £111,005 |
| Lancashire | Bank Hall & Fulledge/Rose Hill & Burnley Wood, Burnley | £549,510 |
| Lancashire | Birchgreen, centre of Skelmersdale in West Lancashire | £197,500 |
| Leicestershire | Westcotes, Narborough Road | £441,998 |
| Leicestershire | Warwick Way and Dishley Estates | £649,999 |
| Leicestershire | Braunstone Frith, Leicester | £526,309 |
| Lincolnshire | West Lindsey, Lincoln | £250,780 |
| Merseyside | Bidston and St James Ward, Birkenhead | £549,700 |
| MOPAC | Hendon Park, Barnet | £301,162 |
| Norfolk | North Central, Norwich | £442,001 |
| North Wales | Queensway, Wrexham | £550,000 |
| North Wales | Rhyl West | £517,000 |
| North Yorkshire | Whitley Ward | £548,980 |
| Northamptonshire | Castle Ward, Wellingborough | £545,700 |
| Northamptonshire | St Crispin’s, Northampton | £650,000 |
| Northamptonshire | All Saints Ward, Kettering | £280,000 |
| Nottinghamshire | Chatham and Northgate, near Newark town centre | £550,000 |
| South Wales | Merthyr Tydfil | £513,410 |
| South Yorkshire | Hexthorpe, Doncaster | £649,964 |
| Staffordshire | Fenton, Stoke-on-Trent | £583,870 |
| Staffordshire | Northwood, Stoke-on-Trent | £484,263 |
| Surrey | Stanwell North | £547,791 |
| Sussex PCC | Lower St Leonards and Warrior Square, Hastings | £545,396 |
| Sussex PCC | Eastbourne town, East Sussex | £419,970 |
| Thames Valley | East Oxford Secure Homes Zone | £408,568 |
| Thames Valley | Iffley Road area, Oxford | £422,948 |
| West Mercia | Brookside, Telford | £550,000 |
| West Midlands | Hillfields, Coventry | £549,040 |
| West Yorkshire | Fagley, Bradford | £549,375 |
| West Yorkshire | Gledhow, Leeds | £159,936 |
| Total | £23,095,140 |
Source: Data supplied by the Home Office.
Appendix C: Theory of Change model
Figure 6: Local Police and Crime Commissioners (PCC) area Theory of Change model
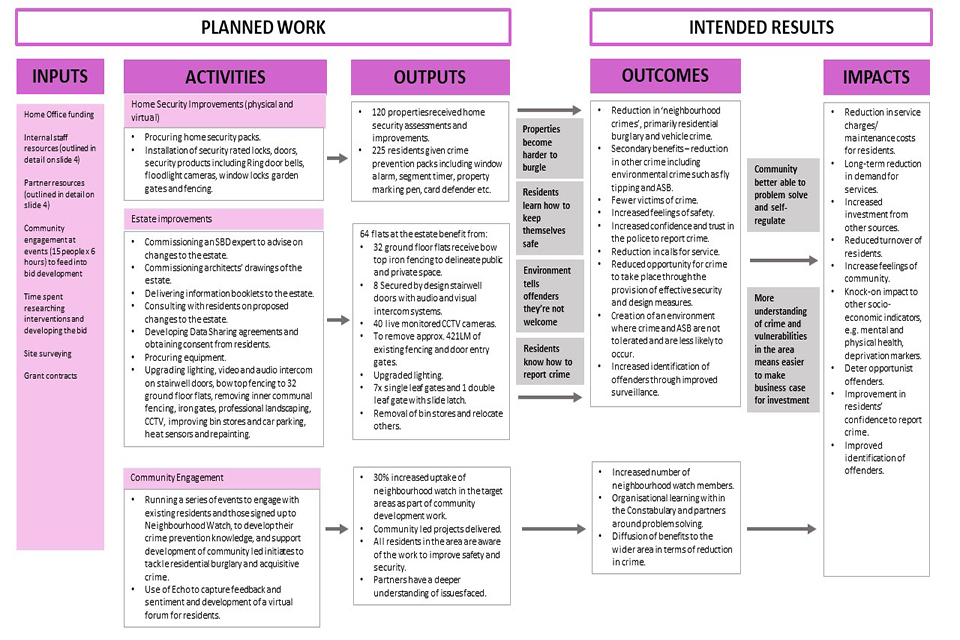
Appendix D: Evaluation design and technical methodology
The evaluation of the Safer Streets Fund (SSF) made use of multiple evidence streams to provide a nuanced and rounded account of the process and impact of the fund. It explored the process of implementing the fund, as well as measuring its preliminary impact. The Home Office has planned further work to assess the long-term impact of SSF1 and its economic costs and benefits.
This Appendix presents the technical details of Kantar Public’s evaluation approach and associated methodology. It documents their design choices and the practical procedures that the team adopted iteratively, building on the original research proposal, the project initiation document and the evaluation design framework. As with implementing the SSF interventions, the disruption of the COVID-19 pandemic also affected this evaluation effort. The team, therefore, had to be flexible in its approach and collaborate very closely with research colleagues in the Home Office.
D.1 Process evaluation
The process evaluation addresses the Home Office’s research questions by gathering information about:
- factors for and barriers to successful implementation of the SSF
- consequences for police resource
- intended and achieved community engagement and its contribution to the intervention (including forms of engagement, target audience, response measurement)
- which central resources were most useful for PCCs planning intervention and what further resources might have been useful
- how did expectations/requests from the Home Office affect PCC activity
- contributors and obstacles to effective partnership working
- lessons for Home Office commissioning to PCCs in future
The research also covered how PCCs have adapted to COVID-19 related restrictions, including any limitations of local lockdowns. This part of the evaluation comprised a preparation stage and 3 subsequent tasks.
Bid reviews
The Home Office provided Kantar Public with all bid documentation for successful and unsuccessful bids. Kantar Public reviewed these documents and noted the key inputs, activities, outputs and outcomes that bid areas were intending to implement. In this way, Kantar Public avoided the need to ask bid areas to complete their own logic model, preventing delays in the project timetable. Instead, Kantar Public developed Theory of Change (ToC) models in conjunction with delivery leads in case study areas only.
Task 1: Initial telephone exercise
In September, Kantar Public conducted telephone in-depth interviews with all 35 SSF-funded areas during their set-up stage, covering:
- an overview of the project activities, outcomes, impacts and mechanisms
- the bid application and project design process
- project set-up and delivery
- plans to track outcomes and impacts
Kantar Public conducted 35 interviews covering 52 successful bid areas with the area teams. Each interview lasted for 30 to 40 minutes. The data was digitally recorded and captured in an Excel spreadsheet to provide a comprehensive overview of the funded sites. Kantar Public also conducted 6 interviews with the 11 unsuccessful areas to gain a fuller picture of the bid development, the application process and future intentions (regarding continuation of the proposed intervention despite not receiving funding).
Task 2: Case studies
Kantar Public brought together 12 case studies of SSF-funded areas to explore implementing funded interventions in depth and to understand PCCs’ current experiences of implementation from the perspective of multiple stakeholders. Where evidence of intermediate outcomes was available, Kantar Public and UCL analysed them in the context of the academic literature about these sorts of interventions.
A long list of case study areas, with 12 preferred, was selected in discussion with the Home Office to reflect the overall sample of SSF areas and to cover characteristics of interest. These areas were selected based on:
- geographical location
- acquisitive crimes targeted by the interventions
- whether reduction anti-social behaviour (ASB) is a target outcome
- types of interventions applied (for example, alleygating, CCTV)
- Index of Multiple Deprivation (IMD)
- working to residential population ratio
Kantar Public developed an analysis of each SSF case study area. To achieve this, they engaged a range of individuals involved in the fund in each area and analysed both primary data (collected through telephone interviews and groups) and any secondary information available. Kantar Public also developed ToC models for the case study areas. The following list sets out the steps of data collection, with fieldwork running from December 2020 to March 2021.
- Preparatory research and planning: Kantar Public brought together relevant information for case study area from Task 1 and bid review, including mapping stakeholders identified in Task 1 interviews as sources of information around key topics. (1 hr)
- ToC training and information session: Kantar Public hosted an online training session inviting delivery leads for each of the case study areas to attend. This session explained Kantar Public’s approach to constructing a ToC, introduced delivery leads to a self-completion ToC document and provided them with guidance on how to complete it. Delivery leads were asked to complete a ToC as best they can before their ToC workshop (see activity 4). (1 hr)
- Internal ToC meeting: Kantar Public evaluators held a meeting to compare ToCs for each of the case study areas. An agenda was developed for ToC stakeholder workshops with each SSF-funded area, and a discussion guide drafted. (1.5 hrs)
- ToC stakeholder workshops with each area: In this workshop, Kantar Public evaluators moderated discussion to flesh out self-completed ToCs, focusing on mechanisms and behavioural consequences. Evaluators drew on resulting ToC output to add prompts/nuance to discussion guide. At the end of this session, Kantar Public asked delivery and PCC leads for a long list of suggested contacts for interview and merged it with its own stakeholder mapping preparation to limit the risk bias in interview selection. (1.5 hrs)
-
In-depth interviews / groups to explore roles and elements within intervention: These interactions covered the following themes to understand each element of the intervention lasting 7 hrs in total:
- delivery (45 mins)
- project oversight/accountability (45 mins)
- communications and community engagement (1.5 hrs)
- resident experience (1.5 hrs)
- partnership working / external expertise (1.5 hrs)
- monitoring and evaluation (30 mins)
- procurement and finance (30 mins) -
Document review: (4 hours approx.) Included:
- plans – project timetables/delivery plans, comms strategy, community engagement plans
- outputs and outcomes monitoring / self-evaluation
- spending and budget
- self-completed ToC
- procurement process for each lead organisation
Researchers reviewed relevant documentation ahead of interviews. - Virtual walkaround of local area: Where possible, it was intended that researchers be shown where changes have been made to the physical environment. Due to COVID-19 restrictions, Kantar Public instead asked for relevant photos to be shared. (30 mins)
- Final delivery lead interview: In this interview, researchers tested or corroborated findings from other interviews, discussed any progress in intervention since the inception meeting and any perceived early impacts. (45 mins)
Kantar Public recorded interviews with detailed notes and included quotations, then analysed them systematically. Each case study area also received a ToC template to complete themselves and requests for additional documentation or management information from Kantar Public.
Task 3: Follow-up research
From May to August 2021, Kantar Public undertook a final qualitative exercise to reflect on all the bid areas’ experiences, including a review of progress against objectives (against local logic models and project plans), key experiences of delivery, perceived impacts, lessons learnt and future intentions. The team revisited all the SSF areas that took part in Task 1 and conducted 30-minute interviews with the areas’ leads (senior or delivery leads). The data was recorded and captured in the framework and incorporated into the main evaluation findings.
D.2 Impact evaluation
D.2.1 Police recorded crime outcomes
Kantar Public used the synthetic controls method to estimate the preliminary impact of the fund on police recorded crime for the period April to June 2021.
For each bid Lower Layer Super Output Area (LSOA), Kantar Public considered either police recorded acquisitive crime or police recorded burglaries, depending on the focus of the bid. The team used data as recoded in DataHub for all police force areas where the ‘completeness’ of the geotagged data (as determined by the Home Office) is at least 80% for each of the years ending March 2017 to 2020. For areas where the completeness falls below 80% at any point, Kantar Public used the data downloaded from police.uk instead.
For one police force area (Cleveland), the completeness of the data prior to the period April to June 2021 is above 80%, but the completeness of the data for the period itself is below 80%. In this case, as previously agreed with the Home Office, Kantar Public used data as recorded in DataHub up until year ending March 2020, and then used data from police.uk for April to June 2021.
We understand that Greater Manchester Police have not returned data to DataHub or police.uk since 2019. Kantar Public therefore excluded LSOAs in the Greater Manchester police force areas from this analysis.
The synthetic controls method takes a ‘treatment area’ where an intervention was implemented and tries to find a weighted average from a set of ‘comparison areas’ such that the historic trends closely match those of the treatment area. The rationale is that if the historic trends are closely matched, it is more reasonable to think that this weighted average of the comparison areas can provide a good counterfactual estimate, meaning, a good estimate of what would have happened in the treatment area without the intervention.
Figure 7: Illustrative example of estimating impact using the synthetic control method (using dummy data)
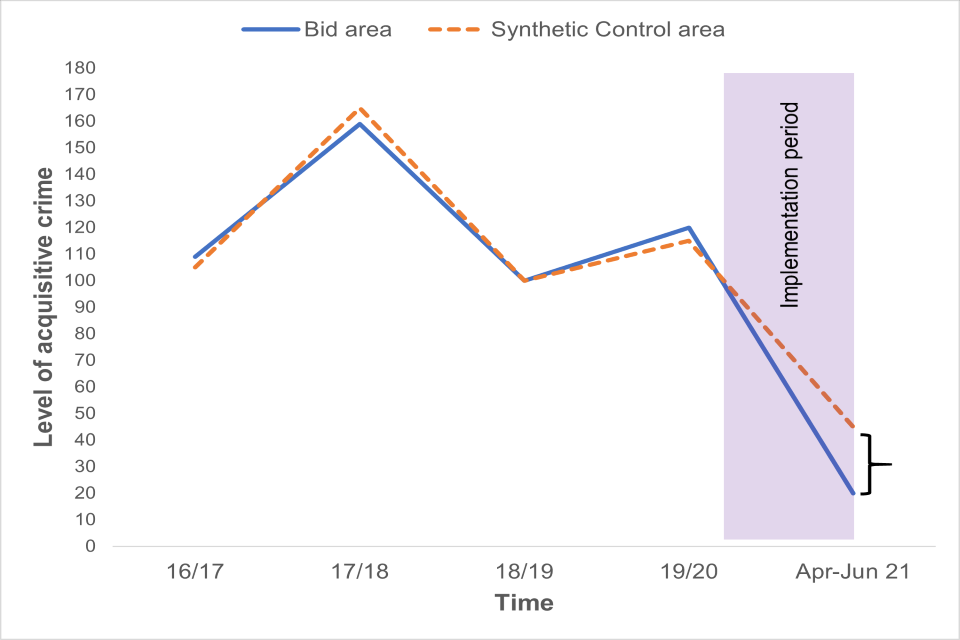
Kantar Public fitted a synthetic controls model for each bid LSOA in turn. This provided an estimate of the impact of the SSF for each LSOA. To make sure the team was comparing bid LSOAs against other similar LSOAs, they limited the pool of comparison LSOAs in the following way:
-
Kantar Public first limited the potential comparison pool based on data source. For example, if a given bid LSOA was in a police force area where the team was using DataHub, this also limited the pool of potential comparison areas to LSOAs in police force areas where the teams was using DataHub.
-
The team excluded all LSOAs within 5 miles of any SSF1 or SSF2 bid LSOA. This was to reduce the risk of any spill over or displacement between areas. Although it should be noted, this was relaxed to 3 miles for a few LSOAs to obtain a good match.
-
Kantar Public excluded LSOAs which would not be eligible for the bid LSOA’s focus (for example, if the bid LSOA’s focus was acquisitive crime, the team excluded areas which would only be eligible for the burglary focus).
-
They excluded LSOAs with missing outcome data. This generally affected only a very small number of areas.
-
They excluded LSOAs which were outside a specified window of COVID-19 cases and (where the data were available) deaths. The team used a window of one standard deviation, meaning, the potential comparison LSOAs all have several COVID-19 cases (and deaths, where data were available) within one standard deviation of the bid LSOA. This step helped to protect against the risk that the pandemic had affected the outcome measures across areas differently.
-
The team calculated a distance metric (specifically, the Mahalanobis distance[footnote 17]) between the bid LSOA and each potential comparison LSOA based on the following area characteristics:
- population
- proportion of the population aged 10 to 15
- proportion of the population who are students
- proportion of the population of an ethnic group other than white
- size of the LSOA (in hectares)
- housing density (number of properties per hectare)
- workday to resident population ratio
- proportion of the population that work in an industry where working from home is more likely to be feasible
- proportion of homes which are flats
-
They then limited the potential comparison pool to the closest 250 LSOAs based on this distance metric. This means that each bid area was only being compared against other areas with reasonably similar characteristics.
For each bid LSOA, Kantar Public then fitted the synthetic controls model using these 250 comparison LSOAs. This approach ensured that the synthetic control generated for each treatment LSOA was a close match on quarterly historic crime data for years ending March 2017 to 2020.
Note that a challenge of measuring impact in this way relates to situations where many observed data points in the police recorded crime data are very or extremely low. This is called a statistical floor effect, meaning there is often very little variation across treatment and control areas and/or any detectable change over time. This could potentially be hiding a possible effect of the SSF interventions; however, Kantar Public’s initial impact analysis cannot confirm it at this stage.
D.2.2 Data collection of resident perceptions
The impact of the fund on residents’ perceptions was measured through a difference-in-differences design (DiD). Kantar Public measured the change in intermediate outcomes for local residents between 2 points in time through 2 waves of surveying. Residents in SSF-funded areas and residents in control areas were surveyed at the start and end of the SSF intervention period, and the differences between the 2 groups analysed.
Using this approach, the team could estimate the impact of the various interventions by taking advantage of the time dimension of the data. This feature enabled control for unobservable and time-invariant area fixed effects (that is, characteristics of an area likely to influence the effectiveness of the interventions). This approach also allowed Kantar Public to potentially disentangle the impact of various individual-level demographics and time-variant area-level characteristics (including an indicator of the COVID-19 pandemic prevalence) from the effect of the programme on acquisitive crime. This design enabled the team to group the bid areas to gain some understanding of how impact may vary according to intervention type(s) and area characteristics.
The DiD analysis rested on several assumptions requiring consideration when interpreting the impact estimates. These were that:
- The control areas were good matches to the treatment areas. To achieve this, the control areas were sampled and weighted to be as similar as possible to the treatment areas. However, it was not possible to remove all differences between areas. It is possible that some findings were due to remaining differences between areas rather than the effects of the interventions.
- The DiD analysis relied on the assumption that if the SSF1 programme had not taken place, the change from baseline to follow-up in the treatment areas would have been the same as the equivalent change in the comparison areas.
- For some outcome measures, there was a noticeable difference between the treatment and comparison areas at the baseline, even after weighting. In these cases, there is arguably a greater risk that the remaining differences between areas could also reflect differences in the expected trends in those areas. However, strictly speaking, a DiD does not require the baseline scores to be close. In any case, for the most part, the baseline scores were reasonably similar between the treatment and comparison areas.
Kantar Public primarily used the survey data for the overall analysis of the scheme, rather than for bid-level analysis, as the sample sizes would not allow for robust bid-level estimates.
Control area selection
For the survey analysis, Kantar Public employed the Coarsened Exact Matching (CEM) method (Iacus et al., 2009) to match each successful bid area to 2 control LSOAs. They selected 2 control LSOAs for each bid area to minimise any local area effects. This approach involved identifying important matching variables and coarsening their values, so they were coerced in broader categories or bands. The underlying distribution of the data and any theories in the literature informed this categorisation. The bid areas and potential comparison areas were then sorted into strata – with all areas within a stratum sharing the same coarsened values for each of the matching variables. The bid areas were then matched to comparison areas within their strata. In some cases, more than one bid area was matched to a single stratum. Appendix F shows the matching bid areas, split by those focused on acquisitive crime Table 5 and those that focused on burglaries Table 6.
The team classified the successful bid areas based on the following information:
- trajectory in acquisitive crime or burglary rates over 5 years (police.uk data for years ending March 2015 to 2019)
- Index of Multiple Deprivation (IMD)
- ONS urban/rural classification
- percentage of homes that are flats (Valuation Office Agency (VOA) data)
- working to residential population ratio (2011 Census)
- a geographical indicator
For the survey, the team selected a comparison sample from the list of LSOAs eligible for the fund (based on their rates of acquisitive crime (or burglary) over the last 3 years) but which were not awarded funding. This would also ensure that comparison areas had a similar level of crime to the successful bid areas. To help ensure that potential spill over effects did not affect these comparison areas, the team excluded any LSOA within 5 miles of a successful bid area.
The team segmented these eligible LSOAs in the same way as they had segmented the successful bid areas. The team then randomly selected 2 LSOAs from each of the 52 strata. This ensured that the comparison areas selected for the study reflected the area profile of the successful bid areas. They drew a sample of addresses from this pool of comparison LSOAs to be included in the survey.
Within each treatment and common control area, the team randomly sampled addresses (with equal probability) from Royal Mail’s database of delivery points (PAF).
Survey fieldwork
In the selected treatment and control areas, Kantar Public conducted surveys at pre- and post-intervals using its Address-Based Online Surveying (ABOS) methodology (William, 2016). They sent an advance letter to sampled addresses and directed residents to a website to take part in the survey. The letter included login details for up to 4 adults in each household. To maximise response rates and minimise the risk of non-response bias, Kantar Public offered a conditional incentive of £5 and sent up to 2 reminders to addresses where any residents had not responded. To ensure the survey was inclusive (and covered the offline population), paper questionnaires were included in the final reminder. Residents were also able to request a paper questionnaire from Kantar Public, by emailing or calling the project freephone number.
The baseline survey took place from 6 August to 9 September 2020. It achieved 4,318 completes comprising 1,834 paper completes and 2,484 online completes (20.6% response rate or RR). Of these, 3,212 were in SSF areas (20.4% RR) and the remaining 1,106 were from control areas (21.1% RR).
The follow-up survey took place between 24 May to 5 July 2021. It achieved 3,630 completes comprised of 1,572 paper completes and 2,058 online competes (17.3% RR). Of these, 2,720 completes were in SSF areas (17.3% RR) and the remaining 910 were from control areas (17.4% RR).
Survey data weighting
Kantar Public used weighting to ensure that the sample achieved by the survey for the successful bid areas represented the population at the overall level.
The team weighted the survey data using reliable ONS LSOA-level population statistics for the following variables:
- age and gender (ONS Lower layer Super Output Area population estimates 2018)
- ethnicity (ONS Census data 2011)
- household structure (ONS Census data 2011)
- disability (ONS Census data 2011)
- housing tenure (ONS Census data 2011)
These LSOA benchmark population statistics were then aggregated up to the whole scheme-level.
When weighting the data, they weighted each bid area equally (regardless of the population of each area). This is because, when evaluating the success of the scheme, Kantar Public wanted to examine the mean effect it has had across the 52 successful bid areas (rather than giving more weight to schemes that covered a larger population).
Kantar Public used Propensity Score Matching[footnote 18] to weight the control area sample from each wave to match the profile of the successful bid area samples (in terms of demographic profile and the area characteristics used in the CEM). This helped ensure that any differences observed between the bid areas and control areas could be attributed to the SSF funding rather than to differences in the local population profiles.
Mitigating the effects of the COVID-19 pandemic:
Kantar Public controlled for the cumulative number of COVID-19 cases (at the lower tier local authority level) in the model specifications to try to mitigate the risk of COVID-19 influencing the impact analysis. They could not include this information in the counterfactual matching criteria, as the comparison areas had been selected in July 2020.
The logic behind including this information was that the prevalence of COVID-19 in an area was likely to influence crime outcome trajectories and, because the severity of the pandemic has varied from area to area, this step helped to protect against the risk that the outcome measures were affected differently across areas by the pandemic. While including this variable helped to mitigate this risk, it cannot expunge it. Kantar Public also conducted some sensitivity analysis to see if the results of the modelling changed significantly if this measure was excluded and they found the results to be very similar.
D.3 Economic evaluation
Once Kantar Public has conducted the longer-term analysis of police recorded crime (based on outcome data for April 2021 to March 2022), they will use the Home Office economic and social costs of crime framework (Home Office, 2018) in conjunction with the Manning cost-benefit tool (College of Policing, 2021b) to conduct the economic evaluation of the SSF. This tool will allow us to quantify the overall costs and benefits associated with the fund and therefore generate a cost-effectiveness indicator.
While bid areas will report their capital and operating costs, Kantar Public decided not to ask bid areas to collect information on intangible costs. This is because the true intangible costs of the schemes are largely unknown, and no standardised method exists to monetise these types of costs. In addition, they will only ask bid areas to collect the indirect costs relating to unpaid overtime, additional staff time and volunteer time, because these are the only indirect costs that bids can feasibly collect. As a result, the costs associated with the fund are likely to be underestimated slightly.
Appendix E: Difference-in-Difference analysis
Table 4: Difference-in-Difference analysis of residential survey data
Please see table 4 here.
Appendix F: Strata characteristics
Coarsened exact matching (CEM) was used to select comparison areas. CEM involves sorting all areas available to be a comparison area into broader categories or bands, with the bid areas and potential comparison areas sorted into strata. Kantar Public matched bid areas to comparison areas within their strata.
The tables below show more detail about the variable groupings in each strata used to classify bid areas focusing on acquisitive crime Figure 5 and burglary Figure 6:
- trajectory in acquisitive crime / burglary rates over 5 years
- Index of Multiple Deprivation (IMD)
- percentage of homes that are flats
- ONS urban/rural classification
- Working to Residential Population (WRP)
Table 5: Strata characteristics and matching bid areas – acquisitive crime
| Acquisitive crime trajectory bands | Combined IMD band | % homes that are flats band | Urban/Rural band | WRP ratio bands | Number of successful bid areas in stratum |
|---|---|---|---|---|---|
| Slight slope | Most deprived | 20-59% | Urban | Very residential | 3 |
| Flat slope | Most deprived | 20-59% | Urban | Very residential | 2 |
| High slope | Most deprived | 20-59% | Urban | More working | 2 |
| Moderate slope | Most deprived | 20-59% | Urban | Very residential | 2 |
| Negative slope | Most deprived | 20-59% | Urban | Very residential | 2 |
| Slight slope | Most deprived | 60%+ | Urban | Very residential | 2 |
| Flat slope | Averagely to minimally deprived | <20% | Urban | Averagely residential | 1 |
| Flat slope | Averagely to minimally deprived | <20% | Urban | Very residential | 1 |
| Flat slope | Averagely to minimally deprived | 60%+ | Urban | Very residential | 1 |
| Flat slope | Most deprived | <20% | Urban | Averagely residential | 1 |
| Flat slope | Most deprived | 60%+ | Urban | More working | 1 |
| Flat slope | Most deprived | 60%+ | Urban | Very residential | 1 |
| High slope | Averagely to minimally deprived | 20-59% | Urban | Averagely residential | 1 |
| High slope | Averagely to minimally deprived | 20-59% | Urban | Very residential | 1 |
| Moderate slope | Most deprived | <20% | Urban | Averagely residential | 1 |
| Moderate slope | Most deprived | <20% | Urban | Very residential | 1 |
| Moderate slope | Most deprived | 20-59% | Urban | Averagely residential | 1 |
| Moderate slope | Most deprived | 60%+ | Urban | Very residential | 1 |
| Negative slope | Most deprived | <20% | Urban | Very residential | 1 |
| Slight slope | Averagely to minimally deprived | 20-59% | Urban | Very residential | 1 |
| Slight slope | Most deprived | <20% | Urban | Averagely residential | 1 |
| Slight slope | Most deprived | <20% | Urban | Very residential | 1 |
| Slight slope | Most deprived | 20-59% | Urban | Averagely residential | 1 |
| Slight slope | Most deprived | 60%+ | Urban | More working | 1 |
Table 6: Strata characteristics and matching bid areas – burglary
| Burglary trajectory bands | Combined IMD band | Flat bands | Urban/Rural band | WRP ratio bands | Number of successful bid areas in stratum |
|---|---|---|---|---|---|
| Flat slope | Averagely to minimally deprived | 20-59% | Urban | Very residential | 5 |
| Moderate slope | Most deprived | <20% | Urban | Very residential | 2 |
| Negative slope | Most deprived | 20-59% | Urban | Very residential | 2 |
| Flat slope | Averagely to minimally deprived | <20% | Rural | Averagely residential | 1 |
| Flat slope | Most deprived | <20% | Urban | Averagely residential | 1 |
| Flat slope | Most deprived | <20% | Urban | More working | 1 |
| Flat slope | Most deprived | 20-59% | Urban | Very residential | 1 |
| Flat slope | Most deprived | 60%+ | Urban | Averagely residential | 1 |
| Flat slope | Most deprived | 60%+ | Urban | Very residential | 1 |
| Negative slope | Most deprived | <20% | Urban | Very residential | 1 |
| Negative slope | Most deprived | 20-59% | Urban | Averagely residential | 1 |
| Negative slope | Most deprived | 20-59% | Urban | More working | 1 |
| Slight slope | Averagely to minimally deprived | <20% | Urban | Very residential | 1 |
| Slight slope | Averagely to minimally deprived | 20-59% | Urban | Very residential | 1 |
| Slight slope | Most deprived | 20-59% | Urban | Very residential | 1 |
References
Abadie, A., Diamond, A. and Hainmueller, J. (2010) ‘Synthetic Control Methods for Comparative Case Studies: Estimating the Effect of California’s Tobacco Control Program’. Journal of the American Statistical Association, vol. 105(490), pp. 493-505. Available online [accessed 10/03/2022]
College of Policing (2021a) Crime Reduction Toolkit. Available online [accessed 10/03/2022]
College of Policing (2021b) Cost Benefit Tool. Available online [accessed 10/03/2022]
College of Policing (2021c) Problem-oriented policing. Available online [accessed 10/03/2022]
DCMS (2021) National Citizen Service Evaluation Report 2019. Department for Digital, Culture, Media & Sport. Available online [accessed 10/03/2022]
DLUHC & MHCLG (2021) Next Steps Accommodation Programme. Department for Levelling Up, Housing & Communities and Ministry of Housing, Communities & Local Government. Available online [accessed 10/03/2022]
HM Treasury (2020) Magenta Book: Central Government guidance on evaluation, page 48, table 3.3. Available online [accessed 10/03/2022]
Home Office (2018) The economic and social costs of crime, Home Office Research Report 99. Home Office, London. Available online [accessed 10/03/2022]
Home Office (2021) Safer Streets Fund (2021-2022) Prospectus. Home Office, London. Available online [accessed 10/03/2022]
Iacus, S.M., King, G. and Porro, G. (2009) ‘CEM: Software for Coarsened Exact Matching’, Journal of Statistical Software, vol. 30(9). Available online [accessed 10/03/2022]
Jacobson, J. Maitland, L. and Hough, M. (2003) The Reducing Burglary Initiative: investigating burglary, Home Office Research Study 264. Home Office Research, Development and Statistics Directorate. Available online [accessed 10/03/2022]
Kirchmaier, T. & Villa-Llera, C. (2020) Covid-19 and changing crime trends in England and Wales, Covid-19 Analysis Series. Centre for Economic Performance, London School of Economics and Political Science, London. Available online [accessed 10/03/2022]
Laycock, G and Tilley, N. (2018) ‘A Short History of the England and Wales National Burglary Security Initiatives.’ In A. Tseloni, R. Thompson and N. Tilley (eds.) Reducing Burglary. Springer.
ONS (n.d.) Census Geography – 6. Super Output Area (SOA). Office for National Statistics. Available online [accessed 10/03/2022]
ONS (2011) 2011 Census data. Office for National Statistics. Available online [accessed 10/03/2022]
ONS (2018) Dataset: Lower layer Super Output Area population estimates (National Statistics). Mid-2018. Office for National Statistics. Available online [accessed 10/03/2022]
ONS (2020) Crime in England and Wales: year ending March 2020. Office for National Statistics. Available online [accessed 10/03/2022]
ONS (2022a) Crime in England and Wales: Appendix tables. Office for National Statistics. Available online [accessed 10/03/2022]
ONS (2022b) Labour Force Survey. Office for National Statistics. Available online [accessed 10/03/2022]
William, J. (Kantar Public) (2016) ‘An introduction to address-based online surveying’, Social Research Practice, Issue 3, Winter 2016/17. Available from [accessed 10/03/2022]
-
The 61% refers to all CSEW crime excluding fraud and computer misuse for the CSEW year to 31 March 2020. This is consistent with acquisitive crime as a proportion of all crime reported in the year to 31 March 2019 CSEW, but this decreased to 54% in the year to 31 March 2021 (TCSEW). ↩
-
For one of the several RBI evaluation reports, see Jacobson et.al. (2003) ↩
-
Full details of area eligibility and funded activity is outlined in the Safer Streets Prospectus (Home Office, 2021). ↩
-
A more detailed breakdown of target crimes, and intervention types, is provided in Appendix A, Table 1 and Table 2. ↩
-
A more detailed breakdown of SSF1 spending by area is provided in Appendix B, Table 3 ↩
-
A more detailed breakdown of underspend is provided in Appendix B, Table 3. ↩
-
For an example of one of the local ToC models, please see Appendix C, Figure 6. ↩
-
For further details of the synthetic control method, see (HM Treasury, 2020). ↩
-
A Lower Layer Super Output Area (LSOA) is a standard unit of geography primarily designed to improve the reporting of small area statistics for the publication of the Census. For more information, see Census geography - Office for National Statistics. ↩
-
For each bid LSOA, Kantar Public considered either police recorded acquisitive crime or police recorded burglaries, depending on the focus of the bid. The team used data as recoded in DataHub for all police force areas where the ‘completeness’ of the geotagged data (as determined by the Home Office) is at least 80% for each of the years ending March 2017 to 2020. For areas where the completeness falls below 80% at any point, the team used the data downloaded from police.uk instead. ↩
-
This method was chosen rather than a longitudinal study due to previous research showing low response rates in follow-up surveys. For example, the most recent National Citizen Service Evaluation (DCMS, 2021) response rate for a longitudinal follow-up survey fell between 25 to 29%. To get a sufficiently large sample at the follow up wave, the initial baseline wave would have had to be much larger to allow for attrition. The response rates cited does not include the Panel sample as this group were incentivised to do surveys regularly so were more engaged with the research than the Participants group and Expression of Interest sample. ↩
-
As the surveys were only for eligible adults (aged 16+) living at the randomly selected addresses, the team had to make assumptions to calculate the estimated response rate for individuals. Using data from the Labour Force Survey (ONS, 2022b), the expected number of eligible individuals per residential address was expected to be 1.9 per address. Furthermore, based on face-to-face surveys that also use the Royal Mail PAF database as their sample frame (such as, the CSEW), it can be assumed that 8% of the addresses in the sample were not residential and were therefore ineligible to complete the survey. The calculation for the response rate is: N complete interviews / (N issued addresses * 0.92 * 1.9), which is consistent with how other response rates are calculated for other ABOS studies. ↩
-
The regression modelling used for the DiD analysis also included a term to help control for the different impact which COVID-19 had in each area. This variable was the number of COVID-19 cases per 100,000 of the population for the local authority in which each LSOA is situated. ↩
-
The acronym SARA stands for scanning, analysis, response, and assessment. This model has become the basis for many police agencies’ training curricula and problem-solving efforts (College of Policing, 2021c). ↩
-
Police Crime Prevention Initiatives are a police-owned organisation that works on behalf of the Police Service throughout the UK to deliver a wide range of crime prevention and police demand reduction initiatives. ↩
-
Geotag is an online tool which allows users to match geographic location information with date/time information on media. ↩
-
The Mahlanobis distance is a metric which measures the distance between a point and a distribution, often used to detect outliers in multivariate analysis. ↩
-
Propensity score matching (PSM) is a method used to construct an artificial control group by matching a unit in an evaluation treatment group with a non-treatment unit of similar characteristics. ↩