Road fuel review
Updated 12 October 2022

© Crown copyright 2022
This publication is licensed under the terms of the Open Government Licence v3.0 except where otherwise stated. To view this licence, visit nationalarchives.gov.uk/doc/open-government-licence/version/3 or write to the Information Policy Team, The National Archives, Kew, London TW9 4DU, or email: psi@nationalarchives.gov.uk.
Where we have identified any third party copyright information you will need to obtain permission from the copyright holders concerned.
This publication is available at https://www.gov.uk/government/publications/road-fuel-review/road-fuel-review
Executive summary
The price of a litre of both petrol and diesel has gone up by over 60p in the last year. Households now pay on average more than £500 per year extra to run a medium-sized petrol car,[footnote 1] and for those living in rural areas, the impact will generally be greater.[footnote 2] More than half of motorists have changed their behaviour in response to this increased cost.
Against this backdrop, on 11 June the Secretary of State for Business, Energy and Industrial Strategy requested that the CMA carry out an “urgent review” of the fuel market, reporting by 7 July. This report contains the findings of the CMA’s review. The CMA has now decided to initiate a formal market study into road fuel, which will examine some of the issues raised by this review in more detail.[footnote 3]
What is driving high pump prices?
The price at the pump reflects the costs incurred and profits made by businesses operating at different parts of the road fuel supply chain,[footnote 4] together with the taxes and duties that are applied to petrol and diesel.
The principal drivers of rising pump prices over the last 12 months, and particularly since the start of 2022, have been:[footnote 5]
-
crude oil prices, which reached record levels in sterling terms in March 2022, and have continued to rise since then. The dollar-terms increase in oil prices over the last year accounts for around a third of the rise in road fuel prices (20p per litre), with the fall in the value of sterling in that period adding a further 12% (7p per litre); and
-
a growing gap between the price of crude oil entering refineries and the wholesale price of petrol and diesel leaving them (the “refining spread”). This accounts for just over 40% of the growth in road fuel prices (24p per litre). Both demand-side factors (in particular, the post-COVID-19 recovery) and supply-side factors (in particular, the Russian invasion of Ukraine and the mothballing of refining capacity during COVID-19) appear to have played a role in driving up the refining spread.
Although there are concerns about fuel retailers profiting from the current situation, our review finds the gap between wholesale prices and retail prices (the “retailer spread”) has not been a significant contributor to the overall rise in pump prices. In particular, the share of the overall price accounted for by the retailer spread was lower in the 3 months after the 23 March duty cut than in the last 6 months of 2021; and in absolute terms, the spread fell from 11.2p to 9.9p.[footnote 6] The retailer spread includes not just the profits earned by retailers, but also the costs they incur.[footnote 7] Retailers told us that they have also seen increases in a range of costs, including transportation, wages and utilities.
In the weeks leading up to the publication of this review, the retailer spread has grown: in particular, pump prices have risen, while wholesale prices have fallen. In interpreting these changes, it is important to keep in mind that changes to wholesale prices are generally only reflected in retail prices after a number of weeks. This is because the fuel held by retailers at any moment will have been paid for at a different (earlier) wholesale price. During periods of falling wholesale prices, retailer spreads can therefore remain higher than average; but this does not necessarily indicate that retailers are earning higher profits, because many retailers will have paid for wholesale fuel at an earlier, higher price. Further analysis of the relationship between wholesale and retail prices – including recent increases in the retail spread, and more generally how rises and falls in wholesale prices are reflected at the pump – will be carried out as part of the CMA’s market study.
Has the fuel duty cut been passed on to consumers?
Fuel duty was reduced by 5p per litre in the Chancellor of the Exchequer’s Spring Statement, effective 6pm on 23 March 2022. In assessing how far this cut was reflected in retail prices, it is important to keep in mind that:
-
Fuel duty is charged at the point at which fuel leaves refineries or coastal terminals. It is therefore paid principally by oil companies and importing traders. Given the Secretary of State asked the CMA to focus its review on retail competition, we did not analyse in detail whether the fuel duty cut was passed on at this point of the supply chain. However, responses received during our review from both wholesale suppliers and retailers indicated that it was.
-
At the point that the duty cut took effect, fuel retailers will have had in the tanks underneath their forecourts a quantity of fuel paid for at the higher duty rate. Reflecting the duty cut in retail prices immediately after the announcement would have meant them incurring a cost on the sale of that remaining fuel.
-
Wholesale prices in the weeks leading up to the fuel duty cut were volatile: for example wholesale diesel prices rose by 53% (33p per litre) between 1 March and 8 March, before falling back 33% (31p per litre) by 15 March. It is not straightforward to disentangle the effect of the duty cut – which amounted to around 3-4% of the retail price – from such changes, and hence to determine conclusively whether prices in the weeks following the duty cut fell by as much as would be expected were it being fully passed on to consumers.
The CMA’s findings on the effect of the fuel duty cut on retail prices are based on an analysis of forecourt-level price data. This analysis shows that:
-
Supermarkets, which account for 44% of all fuel sales, cut prices by just over 5p per litre immediately following the duty cut.[footnote 8] In doing so, they likely incurred a cost for the reasons set out above. Motorists filling up at supermarket forecourts saw an immediate benefit from the decision to cut fuel duty.
-
Prices charged by other types of retailer also fell in the days following the duty cut. These reductions were less than 5p: around 3.5p in the case of oil company-operated sites, and 2.1p in the case of independently operated sites.
-
These price reductions occurred in a period where – absent the duty cut – retail prices might otherwise have been expected to rise. In particular, the internal model used by the Department for Business, Energy and Industrial Strategy had predicted retail prices to rise by around 3p-4p per litre in the week of the duty cut, on the basis of earlier crude oil price changes.
-
In the weeks that followed the duty cut, retail prices remained below levels observed on 23 March. By 7 April, they remained 3-5p per litre lower for petrol and 2-4p lower for diesel. This coincided with a period of relative wholesale price stability.
-
Looking further ahead, the price reduction that followed the duty cut was temporary, and prices resumed an upward trend from around May 2022. As discussed in section 2, these price rises were driven principally by rising crude oil prices and refining spreads, as opposed to a growing gap between wholesale and retail prices. We have seen no evidence – nor is it clear from our analysis – that retailers in aggregate have profited from failing to pass on the fuel duty cut.
Is retail competition working well across the UK?
Competition between road fuel retailers principally takes place at a local level. In particular, retailers typically set prices based on what others in their local area are charging, with some aiming to match or undercut their rivals. In places with a range of nearby retailers, competition is likely to be strong, and work to the benefit of motorists.
Motorists face higher prices in some parts of the UK than in others. These differences may reflect the higher costs of supplying retail fuel to certain areas. However, weak competition in certain parts of the UK may lead to price differences that are unrelated to costs.
A competitive retail fuel market can be particularly important to rural communities, which tend to be more reliant on cars as a means of transport. The factors driving local price variation, and any steps that could be taken to improve local competition, will be explored further as part of the CMA’s market study. However, preliminary analysis carried out for this review indicates that a number of inter-related factors influence local price variation:
-
number of local competitors – more generally, prices tend to be lower the more competitors there are in the surrounding area, and the closer they are (in terms of driving time);
-
presence of supermarkets – over the last year, supermarket prices have remained 3p-6p per litre cheaper than other types of retailer. The presence of a supermarket can also lower the price of fuel in the surrounding local area. Analysis from past CMA mergers work indicates that the presence of an Asda supermarket has had a particularly significant impact on local prices; and
-
whether an area is rural or urban – rural areas pay on average 1p-2p per litre more for road fuel (although in some areas the difference will be substantially more). This is likely in part to be because they generally have fewer competitors (including supermarkets); but it may also reflect the fact that they supply lower fuel volumes and have higher transportation costs. Higher prices may therefore enable some sites in rural areas to remain viable.
What steps will the CMA take to strengthen competition?
Taking account of the impact of the high pump prices on consumers, and some of the issues raised by this review, the CMA has decided to initiate a market study into road fuel. The study, to be launched immediately, will enable the CMA to develop a more detailed understanding of how the market is working – at all levels of the supply chain – and consider what more can be done to improve outcomes for consumers.
Among other things, the market study will consider:
-
refining, including why refining spreads are so high and what, if anything, ought to be done to bring them back down;
-
wholesaling, including the impact of long-term exclusive supply agreements between independent retailers and wholesalers; and
-
retailing, including how far local price variation is being driven by weak competition, and whether there has been a softening of competition from supermarkets.
What steps could government consider now to strengthen competition and improve transparency?
Consistent with the Business Secretary’s request, the CMA has provided advice on measures the government could consider now to further improve retail fuel price transparency. Such measures can be expected to strengthen retail competition, although given that retailer profits represent a relatively small share of the pump price, they are likely to have only a modest effect on pump prices.
An open data scheme
Effective competition relies on consumers being able to compare accurately the price and quality of products in a way that drives good decisions. Fuel prices are prominently displayed at forecourts; but consumers should not have to drive around to find cheaper fuel.
With this in mind, the government could consider an “open data scheme” through which individual forecourt prices are collected and made freely available. Although some tools already exist to help consumers shop around, such a scheme could provide commercial opportunities for innovative third- party apps and websites to offer consumers improved real-time comparisons of fuel prices. And in turn, this would encourage petrol stations to compete more intensely to attract customers.
Such schemes exist already in other countries, and in other markets in the UK. This recommendation could be taken forward in parallel to the CMA’s market study; and we stand ready to work with the government if it chooses to pursue this recommendation.
Motorway pricing
There are long-standing concerns about the higher price of fuel on motorways. Better information on motorways about pump prices, including those at nearby off-motorway petrol stations, could help consumers make better decisions about whether and where to buy, and trade-off between the convenience of staying on the motorway and prices available elsewhere. However, the government would have to weigh up any potential benefits against other important public policy considerations, such as the impact on local road traffic volumes.
Introduction and scope
Background to our work
The Secretary of State for Business, Energy and Industrial Strategy (the “Business Secretary”) wrote to the CMA on 11 June requesting that it carry out an urgent review of the fuel market, as well as a longer-term market study into whether the retail fuel market has adversely affected consumer interests.[footnote 9]
The request followed the Chancellor of the Exchequer’s 23 March announcement in his Spring Statement that there would be a 5p reduction in the rate of fuel duty which would take effect from 6pm that evening.[footnote 10] The Business Secretary wrote to road fuel retailers on 23 March and again on 17 May 2022 asking them to ensure that the fuel duty cut was passed through to consumers. Many retailers and their representative bodies have stated that retailers have passed through the reduction in fuel duty.[footnote 11]) Motoring organisations have however raised concerns that the fuel duty cut has not been passed through and that more generally retail prices do not consistently follow wholesale prices.[footnote 12]
The CMA is the UK’s competition authority and its mission is to make markets work well for consumers. For the last 2 -and-a-half years the CMA has been monitoring volatility in the UK’s supply chains arising first from COVID-19 and now in the wake of the global economic recovery and the impact of Russia’s invasion of Ukraine. The CMA has, for example, collaborated with its “Five Eyes” partners to share intelligence to address the risk of anti-competitive collusion between businesses.[footnote 13] The CMA has been clear that it stands ready to take action should there be evidence that competition or consumer protection law has been broken, including in the road fuel retail market.
The Department for Business, Energy and Industrial Strategy (“BEIS”) is the UK government department with responsibility for energy policy, including the supply of road fuels. BEIS collates pricing data on road fuels and publishes this on a weekly basis.[footnote 14] The Business Secretary also has the ability to activate the Downstream Oil Industry Protocol that allows industry participants to cooperate to ensure continuity of supply. The Protocol has been activated twice in the last year in response to driver shortages and disruption arising from fuel protests.[footnote 15] HM Treasury has responsibility for UK fiscal policy, including setting the rates of both fuel duty and Value Added Tax (VAT). Local trading standards services have an additional role in ensuring that road fuel pumps dispense fuel within a tolerance of -0.5% to +1.0% and can prosecute any retailer whose pumps are not compliant.[footnote 16]
The impact on consumers
Against this backdrop motoring groups such as the AA Ltd and RAC Ltd have raised concerns that the 5p cut in fuel duty was passed on too slowly or not passed on in full. As noted above, they have also suggested that retail prices do not follow trends in crude and wholesale pricing and furthermore that supermarkets no longer use low petrol prices as a way of attracting grocery shoppers into their stores.[footnote 17]
We have also received correspondence from MPs and members of the public who are concerned by the variation in prices between Petrol Filling Stations (“PFS”) owned by the same company or operating under the same brand, and significant differences in retail prices in their local area.
Which? estimated that over the 12 months to June 2022 the increase in the cost of fuel means that the average motorist driving a medium car will now spend £1,787 over the course of the year to ‘fill-up’ with petrol (an increase of £506) and £1,362 for diesel (a £400 increase).
Price increases appear to have affected motorists’ driving behaviour. The AA and RAC both conducted research which indicates that motorists are driving less – either reducing the length or the number of journeys. Research by Opinium found that more than half (54%) of people had changed their behaviour with around 1 in 5 people (18%) having taken public transport as a result of fuel costs with paid and unpaid carers the most likely to change behaviour.[footnote 18] Citizens Advice has reported that the people it provides debt advice to are showing patterns of increasing expenditure on fuel, suggesting they have not been able to reduce car usage in line with price rises.
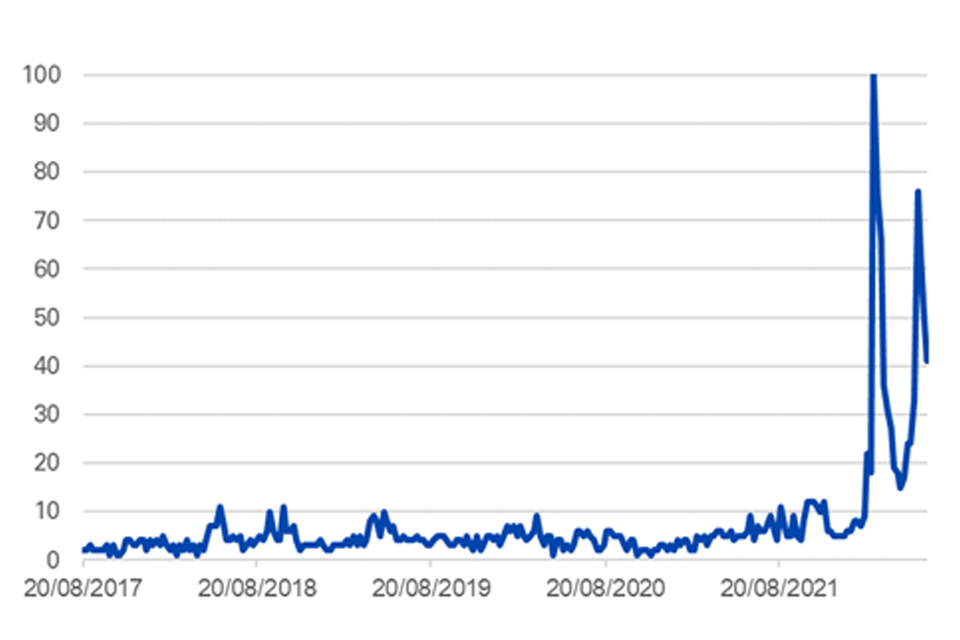
Consumers also appear to be looking for price information, for example the search “cheapest petrol near me” on Google increased ten-fold in the weeks after Russia’s invasion of Ukraine (Figure 1).
Figure 1 Google search trend for “cheapest petrol near me” 2017-2022
"
Source: Google Trends. 100=maximum interest for relative timescale.
The graph shows magnitude of Google searches for the phrase “cheapest petrol near me” from August 2017 to June 2022 in the UK. The trend is measured from 0 to 100, with 100 being the maximum interest shown for the phrase in the given time and geographical area. This index fluctuates between 0 and 10 from August 2017 to early 2022, then spiked to 100 at the beginning of March 6, 2022.
Trade bodies and businesses providing revenue protection services[footnote 19] for petrol stations have reported significant increases in alleged theft, either through driving-off without paying or claiming not to have means to pay (and not subsequently returning to pay) (sometimes called “bilking”).[footnote 20],[footnote 21],[footnote 22] The Petrol Retailers Association (“PRA”) has estimated that at the current rates of failure to pay for fuel, revenue loss to the retail sector would reach £41 million each year.[footnote 23]
As set out below our review has focused on those filling up at PFSs, but we recognise the increased cost of road fuel has also had impacts on haulage, bus and rail operators and agricultural businesses.
The scope of this review
Given the request made of the CMA by the Business Secretary (“the commission”) was to explore whether the road fuel market has adversely affected consumer interests, we have considered:
-
the health of competition in the market including “geographical factors and localised competition”;
-
the extent to which competition has resulted in the fuel duty cut being passed on to consumers;
-
the reasons for local variations in the price of road fuel; and
-
any further steps that the government or the CMA could take to strengthen competition, or to increase the transparency that consumers have over prices.
The commission focused on the retail road fuel market so we have focused on the price charged to consumers at the pump. In understanding the retail price, we have considered whether retail prices have tracked wholesale prices and whether the “spread” between different actors and stages in the supply chain has changed. In the limited time available we have not considered deliveries to business premises or sold from specialist distribution terminals such as for agricultural red diesel or the market for diesel used as heating oil. Furthermore, we have not reviewed the impact of fuel cards as a means of payment or their impact on competition.
Our review has been conducted under the CMA’s function to provide advice and information to ministers.[footnote 24] As a result the CMA has not been able to compel industry participants to give us information (unlike in market studies where we have the power to do so), and instead has been dependent on stakeholders voluntarily responding to our requests for information (“RFIs”). In the course of this review, we sent RFIs to 2 motoring organisations, 3 trade associations, 10 road fuel retailers, including supermarkets, independent groups and vertically integrated retailers with refining capacity in the UK and 2 further wholesalers.
We have acquired 2 key datasets – 1 from Experian Ltd (Experian) that provides forecourt-level pump prices, based on fuel card transactions; and another from BEIS that provides weekly data on the wholesale and retail cost of road fuel and its components.[footnote 25] We have used these to conduct the majority of our analysis into pricing trends and movements. The data provided by Experian covers a 12-month period to 12 June 2022. The most recent weekly BEIS data used for the purposes of this review covers the 7 days to 27 June 2022.
All but 1 stakeholder responded to our RFIs. We would like to thank all those who provided information or evidence, particularly for their willingness to supply it to very tight timescales.
In addition to the information, data and evidence provided in responses to our RFIs and the data we have independently acquired, we have collected and analysed information from a variety of sources, including consumer groups, industry data, market reports, our own past merger analysis, as well as other government departments’ reports and statistical publications, and academic literature. We have considered the views of stakeholders and concerns raised by members of the public as we have conducted this review.
Due to the short time-frame we have had to conduct this review and the lead-time needed to acquire data, we have not exhausted the possible analytical approaches which could further contribute to an assessment of how competition is working in the road fuel market. We have not, for example, conducted detailed econometric assessment of the range of factors that determine price, or pass-through. However, drawing on the information and evidence provided by stakeholders and the CMA’s own experience of the sector including through road fuel retail merger assessments, we are confident in the analysis we have conducted and the conclusions we draw at this stage. As part of our market study we will consider how to extend the nature and depth of our analysis with additional datapoints.
The road fuel supply chain
Overview
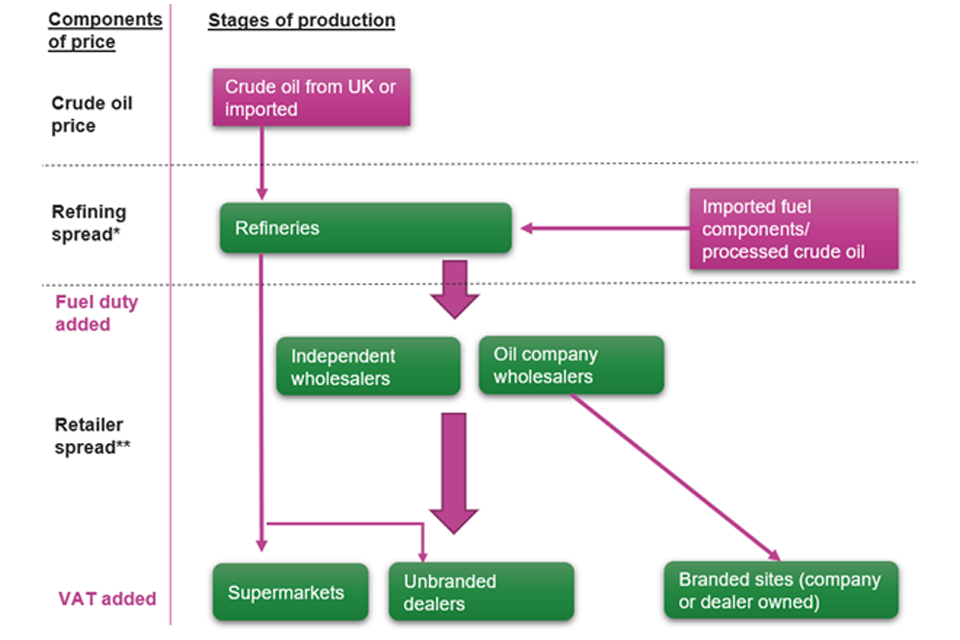
The supply of road fuel involves a number of stages, which are shown in simplified form in Figure 2. This section briefly describes the different stages of supply, and the contribution of each to recent changes in pump prices over the last 12 months.
Figure 2 Simplified illustration of road fuel supply chain and components of price
"
The infographic illustrates the fuel supply chain. In the first stage of production, crude oil is extracted in the UK or imported from overseas. In the second stage, refineries process crude oil into petrol and diesel, alongside imports of some fuel components and processed crude oil. In the next stage, refineries sell wholesale fuel either directly to retailers or through wholesalers. The fuel duty is added at this stage. In the final stage, retailers (supermarkets, unbranded dealers and branded sites) sell the fuel to consumers, adding VAT.
- Refining spread is the difference between the price of crude oil (in sterling) and the wholesale price of petrol and diesel
** Retailer spread is the difference between the wholesale price of petrol and diesel, and the price at the pump
Figure 3, Figure 4 Figure 5 provide an overview of these changes. In short, the principal drivers of rising pump prices over the last 12 months have been:
-
crude oil prices, which reached record levels in sterling terms in March 2022, and have continued to rise since then; and
-
a growing wedge between the price of crude oil entering refineries and the wholesale price of petrol and diesel leaving them (the “refining spread”).
Figure 3 Change in components of retail price for diesel – pence per litre, weekly averages, 7 days to 7 June 2021 through to 7 days to 27 June 2022.
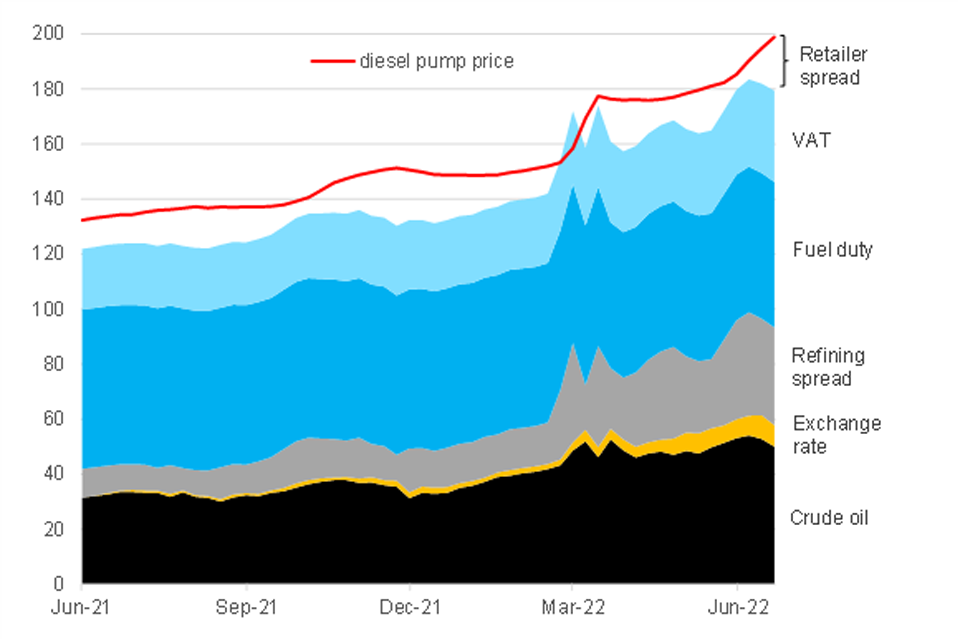
"
The graph shows the weekly average components of retail price of diesel from June 2021 to June 2022. In June 2021, the price of diesel was around 130 pence per litre. Of this, crude oil constituted around 30 pence per litre, refining spread around 10 pence per litre, fuel duty around 60 pence per litre, VAT 20 pence per litre, and the retail spread was a little more 10 pence per litre. Since then, the price increased, with the fastest speed of increase in March 2022. By June 2022, the retail price was close to 200 pence per litre. All components generally increased during the whole period, with refining spread gradually constituting a higher proportion of fuel price. Of this, crude oil constituted around 50 pence per litre, high exchange rate contributing 10 pence per litre to crude oil price, refining spread around 35 pence per litre, fuel duty around 55 pence per litre, VAT 30 pence per litre, and the retail spread was around 20 pence per litre, albeit with significant volatility in the last 3 months.
Source: CMA analysis of BEIS response to request for information
Figure 4 Change in components of retail price for petrol – pence per litre, weekly averages, 7 days to 7 June 2021 through to 7 days to 27 June 2022.
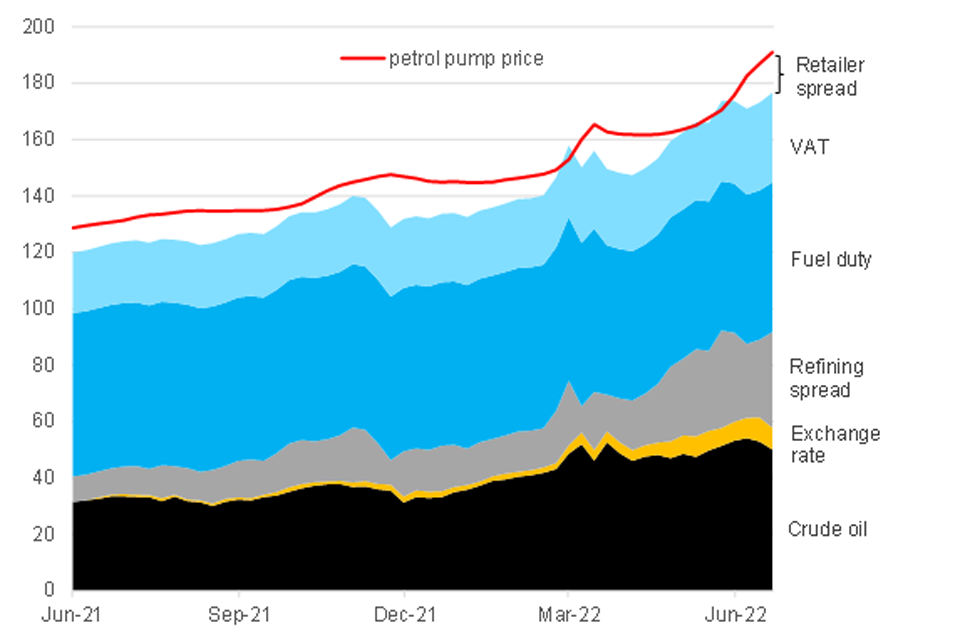
"
The graph shows the weekly average components of retail price of petrol from June 2021 to June 2022. In June 2021, the price of petrol was a little less than 130 pence per litre. Of this, crude oil constituted around 30 pence per litre, refining spread a little less than 10 pence per litre, fuel duty around 60 pence per litre, VAT 20 pence per litre, and the retail spread was a little more 10 pence per litre. Since then, the price has been consistently increasing, with a high rate since March 2022. By June 2022, the retail price was close to 190 pence per litre. All components generally increased during the whole period, with refining spread gradually constituting a higher proportion of fuel price. Of this, crude oil constituted around 50 pence per litre, high exchange rate contributing 10 pence per litre to crude oil price, refining spread around 35 pence per litre, fuel duty around 55 pence per litre, VAT 30 pence per litre, and the retail spread was a little less than 20 pence per litre.
Source: CMA analysis of BEIS response to request for information
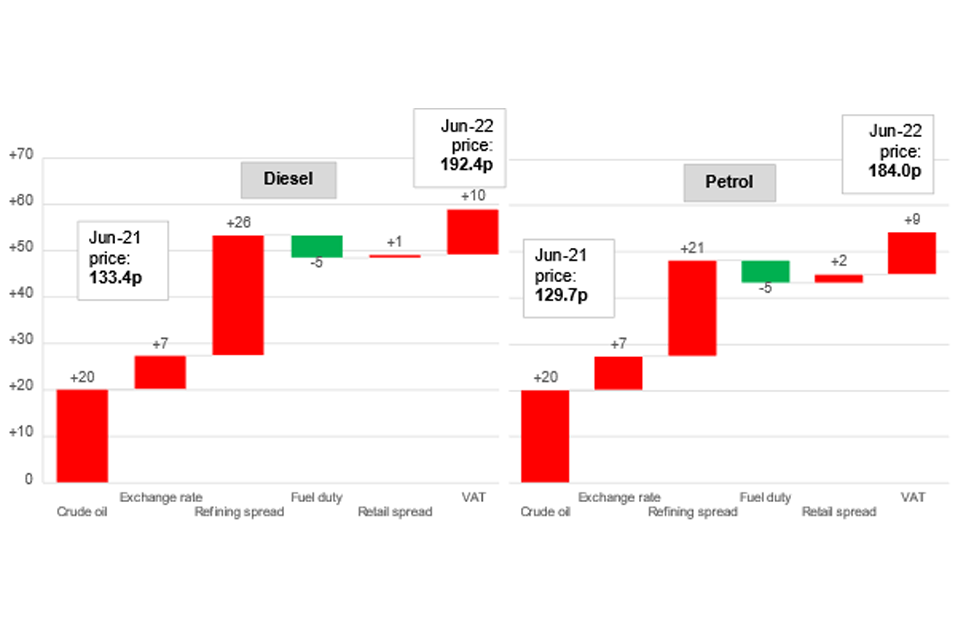
Figure 5 Contributions to change in petrol and diesel pump prices – pence per litre, June 2021 vs June 2022*
"
The graph decomposes the change in petrol and diesel pump prices in the one year between June 2021 and June 2022. In June 2022, the price of diesel was 192.4 pence per litre compared to 133.4 pence per litre in June 2021. The contributions to this change are from the following: crude oil price increased by 20 pence per litre, higher exchange rates led to an increase of 7 pence per litre, refining spread increased by 26 pence per litre, fuel duty decreased by 5 pence per litre, retail spread increased by 1 penny per litre, and finally the VAT increased by 10 pence per litre. The corresponding price of petrol in the same periods are 129.7 pence per litre in June 2021 compared with 184 pence per litre in June 2022. The contributions to this change are from the following: crude oil price increased by 20 pence per litre, higher exchange rates led to an increase of 7 pence per litre, refining spread increased by 21 pence per litre, fuel duty decreased by 5 pence per litre, retail spread increased by 2 pence per litre, and finally VAT increased by 9 pence per litre.
- Comparisons are based on four-week averages of relevant data – specifically 4 weeks to 28 June 2021 vs 4 weeks to 27 June 2022
Source: CMA analysis of BEIS response to request for information
Crude oil extraction
During this stage, crude oil is extracted and transported to the location where it is refined or processed. Around 26% of the crude oil used by the UK in 2021 was imported, either by ship or by undersea pipeline.[footnote 26]
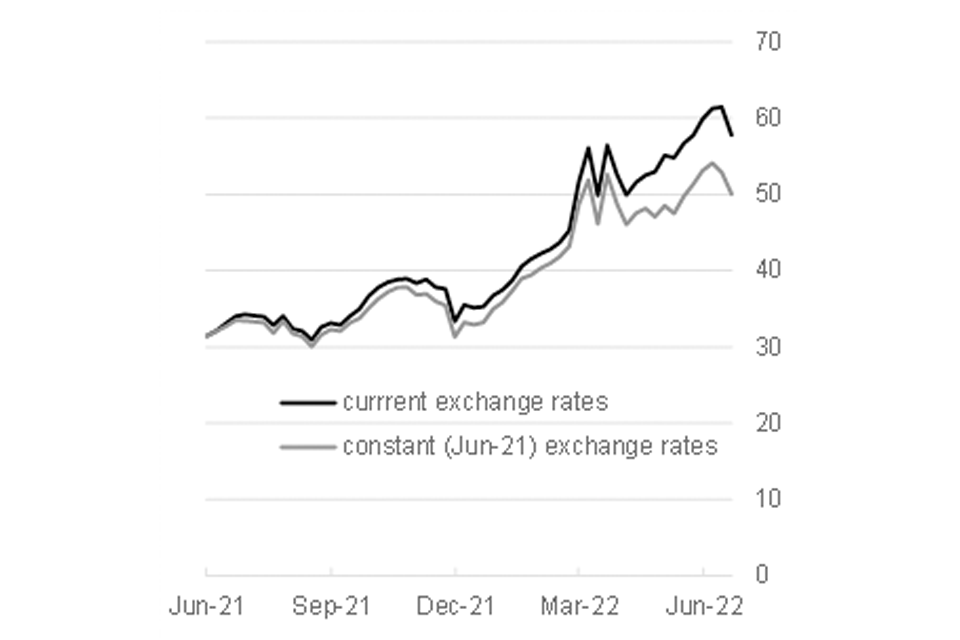
Crude oil is a globally traded commodity and its price is determined by current, and expected future, world demand and supply. Global crude oil prices have risen materially over the last year (with most of the rise happening in the last 6 months), adding around 20p per litre to the price of petrol and diesel paid by consumers. Because oil is priced in US dollars, changes in the value of sterling against the US dollar will also affect UK pump prices. In particular, the depreciation of sterling in recent months has added a further 7p per litre to the price of petrol and diesel. Figure 6 illustrates these changes – the gap between the lines shows the effect of sterling depreciation.
Figure 6 Crude oil prices. Brent 1-month, weekly average; pence per litre, Jun 21 to Jun 22
"
The graph shows the weekly average prices of Brent 1-month crude oil in pence per litre (pence per litre) from June 2021 to June 2022. One line shows the index using current exchange rates, and another line the same index using constant (June 2021) exchange rates. From June 2021 till December 2021, the price was fluctuating between 30 and 40 pence per litre. Since December 2021, the price started to increase, with a sudden surge and high volatility in March 2022. Since then, crude oil price had an increasing trend. The index using current exchange rates increased more than that using fixed exchange rates. In June 2022, crude oil was close to 60 pence per litre, but at June 2021 exchange rates it was around 50 pence per litre.
Source: CMA analysis of BEIS response to request for information
Refining
Petrol and diesel are produced by refining crude oil. Refining can happen domestically, at 1 of the 6 refineries in the UK; or it can happen overseas, with petrol and diesel being imported. Around a quarter of petrol and 57% of diesel used for road fuel in the UK in 2021 was imported.[footnote 27]
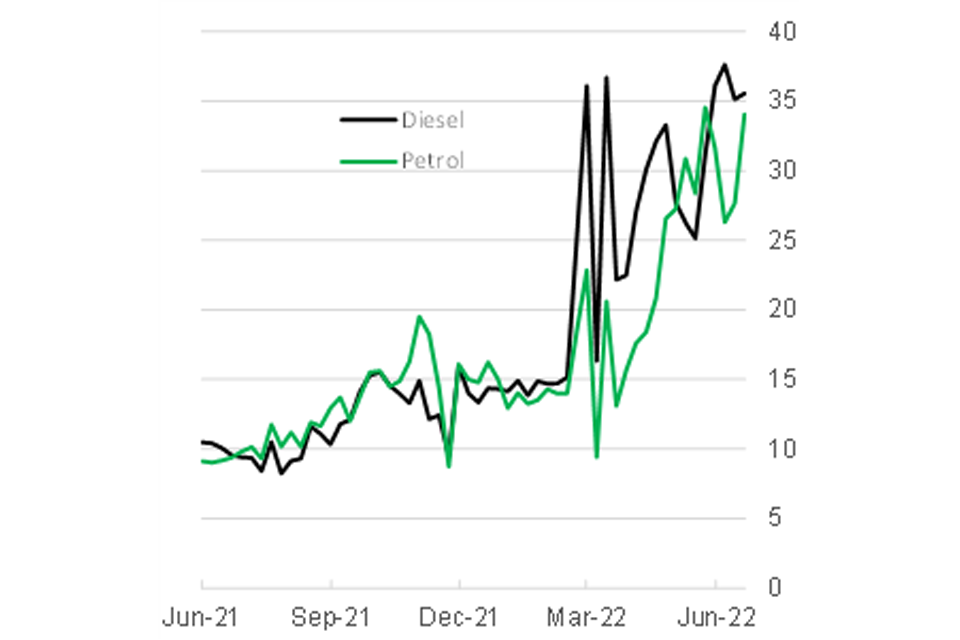
The costs incurred and profits taken by refiners at this stage of the process will influence the price of petrol and diesel paid by consumers. An illustration of the contribution of the refining process to the final pump price is provided by the “refining spread” (Figure 7), which is the difference between the price of crude oil and the wholesale price of petrol and diesel (whether refined domestically or imported).
Figure 7 Refining spread
Brent 1-month, weekly average; pence per litre, Jun-21 to Jun-22
"
The graph shows the weekly refining spread in pence per litre for petrol and diesel from June 2021 to June 2022. The refining spread of petrol was less than 10 pence per litre in June 2021 around 15 pence per litre in December 2021. Since March 2022, it has been increasing at a rapid pace, reaching 35 pence per litre in June 2022. For diesel, the price in June 2021 was around 11 pence per litre, with a sharp rise amid high volatility since March 2022 to around 36 pence per litre in June 2022.
Source: CMA analysis of BEIS response to request for information
In recent months, the refining spread has grown substantially, to account for around 30p-35p (15-20%) of the pump price, compared with an average of 10p (7.5%) in 2021.
Further work is required to assess what is driving these very high spreads. We also need to increase our understanding of how long they are likely to persist, and to assess whether there are measures that could help to address or guard against future spikes. This will be a major focus of our market study. However, a short assessment of the potential causes of rising refining spreads is given in the road fuel supply chain.
Transportation
Petrol or diesel is transported from refineries (in the case of domestic production) or coastal terminals (in the case of imported road fuel) to PFSs (often via a distribution terminal). The costs of transportation cannot be disaggregated from the overall retail price in a straightforward way and for the purposes of this review form part of the “retailer spread” (see below). However, evidence received from retailers during this review suggests that inland transportation costs have risen (see The road fuel supply chain) both as a result of increases to drivers’ wages and the cost of fuel itself. This is supported by other evidence[footnote 28] and reports of wage rises.[footnote 29]
Wholesaling
While some retailers are supplied direct by a refinery, others purchase fuel via a wholesaler. For the purposes of this review, the margin applied by independent wholesalers forms part of the “retailer spread” (see below), enabling us to compare the difference between refinery gate price and pump price across retailers who do and do not purchase via independent wholesalers. We have not examined the independent wholesale segment of the supply chain during this review, but we intend to look more closely at this during our market study.
Retailing
Petrol or diesel is sold at PFSs to the end consumer. The costs incurred and retailers’ profit margins at this stage of the process will necessarily influence the pump price. An illustration of the contribution of fuel retailing to the final pump price is provided by the “retailer spread”, which is the difference between the wholesale price of petrol or diesel, and the price charged to motorists (excluding taxes and duties). As with the refining spread, the retailer spread is not a measure of the profits earned from this stage in the supply chain (though it may include such profits). In particular:
-
The retailer spread will include recovery of costs that retailers incur. These include the operating costs of running a forecourt, and – because they are not separately measured in the available data – any transportation costs between the refinery and the forecourt, together with any additional payments made to independent wholesalers (see above). Petrol retailers told us that many of these costs have risen over the past 12 months. Several retailers drew particular attention to rises in fuel transportation costs (driven by the high price of diesel, together with driver shortages and resulting salary increases),[footnote 30] wages for forecourt staff (driven by increases to the National Minimum Wage and National Living Wage), utility bills (driven by high gas and electricity prices), rising theft from forecourts, and higher interchange fees levied by debit and credit card scheme operators.
-
Retailers may earn profits on other parts of their business that do not involve selling fuel, such as forecourt shops or car washes. These are not captured by the retailer spread.
-
The retailer spread measures the difference between wholesale and pump prices at the same point in time, but in practice, retailers will have paid for wholesale fuel at a different (earlier) price. Thus, changes to wholesale prices are only likely to be reflected in the retailer spread after several weeks. The “pass-through” of wholesale cost changes to retail prices is discussed further in section 4.
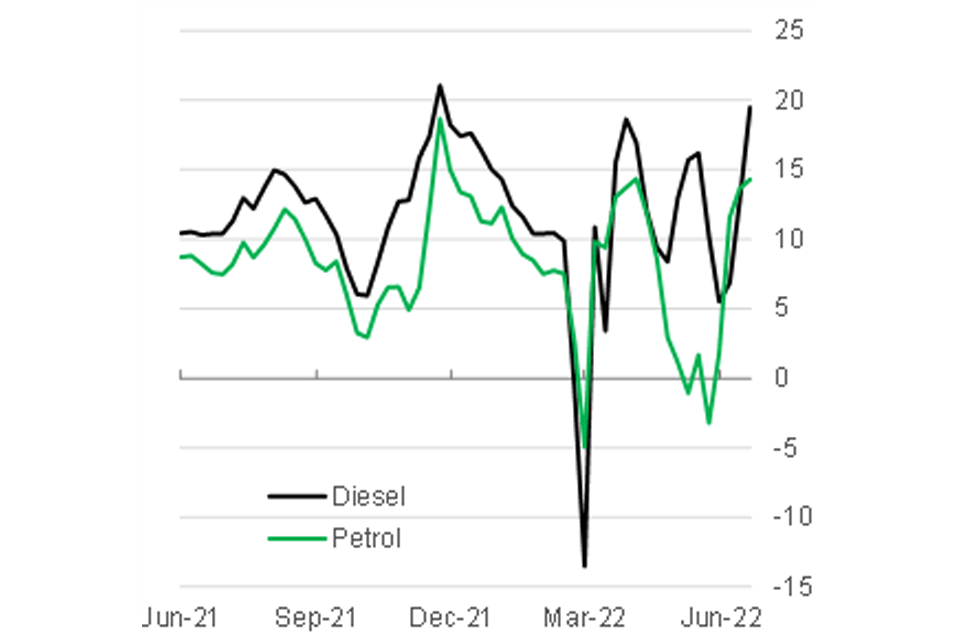
The retailer spread (Figure 8) has averaged around 10p per litre over the past year; but it can be volatile from week to week (particularly so in recent months). At times – for instance at the end of November 2021 and the 7 days to 27 June 2022 – it has reached 15p-20p per litre. These spikes typically occur when wholesale prices fall, having previously been on an upward trend.[footnote 31] As discussed above, it can take a number of weeks for such changes to be reflected in prices at the pump. During these periods, retailer spreads can remain higher than average; but this does not necessarily indicate that retailers are earning higher profits.
Figure 8 Retailer spreads Weekly average; pence per litre; Jun-21 to Jun-22
"
The graph shows the weekly averages of retailer spreads for diesel and petrol from June 2021 to June 2022. Both spreads are characterised by high volatility, with petrol retailer spreads being generally slightly lower than that of diesel. Diesel retailer spreads fluctuated between 5 pence per litre and 15 pence per litre from June to September 2021, followed by reaching a peak of 20 pence per litre in December 2021. Since then, there was a downward trend, with a sharp fall in March 2022 to -15pence per litre. From March, retailer spreads have been highly volatile for diesel and petrol, ranging from 5 pence per litre to 20 pence per litre for diesel and -3 pence per litre to 15 pence per litre for petrol.
Source: CMA analysis of BEIS response to request for information
In relation to the most recent spike in retailer spreads, the CMA will be looking closely, as part of its market study, into how far and how fast these fall back to reflect recent declines in wholesale prices.
There is no strong indication that the rising retailer spread has driven the significant rise in pump prices seen in recent months. For example, the share of the pump price accounted for by the retailer spread in the 3 months since the 23 March fuel duty cut (5.5%, or 9.9p per litre) is similar to the share in the 3 months preceding it (5.8%, or 8.7p per litre), and lower than in the second half of 2021 (7.9%, or 11.2p per litre).[footnote 32] There is thus no cause – from this indicator alone – to conclude that rising pump prices are being driven by higher retailer profits.[footnote 33]
Taxes and duties
Road fuel is subject to an excise duty, normally referred to as “fuel duty”, which currently stands at 52.95p per litre, having been cut by 5p at the Spring Statement on 23 March. It is also subject to VAT at the standard rate of 20%.
Fuel duty is charged when petrol or diesel leaves the refinery or importing terminal. It is applied on a per litre basis. As such, the absolute (pence per litre) contribution of fuel duty to pump prices will remain constant at the rate set by government, but its relative (percentage) contribution will change as prices rise and fall.
VAT is charged at the point of sale, as a percentage of the pump price (including fuel duty). As such, its absolute (pence per litre) contribution to pump prices will change as pump prices rise and fall, but its relative contribution will stay constant at a level reflecting the rate set by government.[footnote 34]
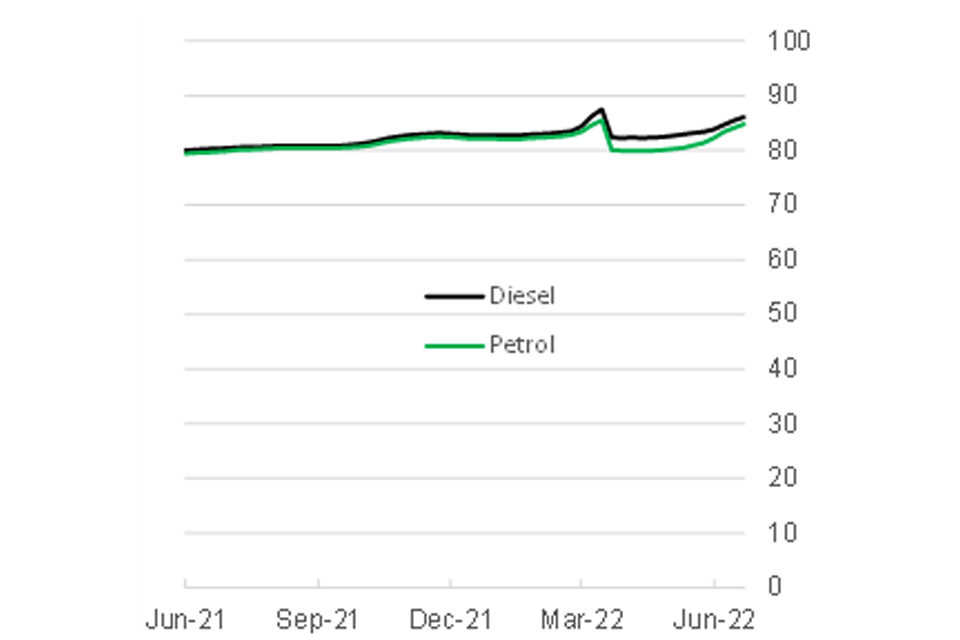
Figure 9 shows the combined contribution of VAT and fuel duty to pump prices. In short, the one-off effect on prices arising from the cut to fuel duty on 23 March was gradually offset in the months that followed by the additional VAT paid as a result of higher pump prices. By 27 June, the rise in VAT had offset around 4.8p of the 5p duty cut for petrol, and 3.8p for diesel.[footnote 35]
Figure 9 Duty and VAT paid on a litre of road fuel. Weekly average; pence per litre; Jun-21 to Jun-22
"
The graph shows the duty and VAT paid on a litre of diesel and petrol from June 2021 to June 2022. From June 2021 to March 2022, the lines have been gradually increasing from 80 pence per litre to around 82 in March 2022. In March 2022, the lines go up sharply to nearly 90 and immediately drops back to just over 80. After March, the lines continue to increase again.
Source: CMA analysis of BEIS response to request for information
Assessment of refining spreads
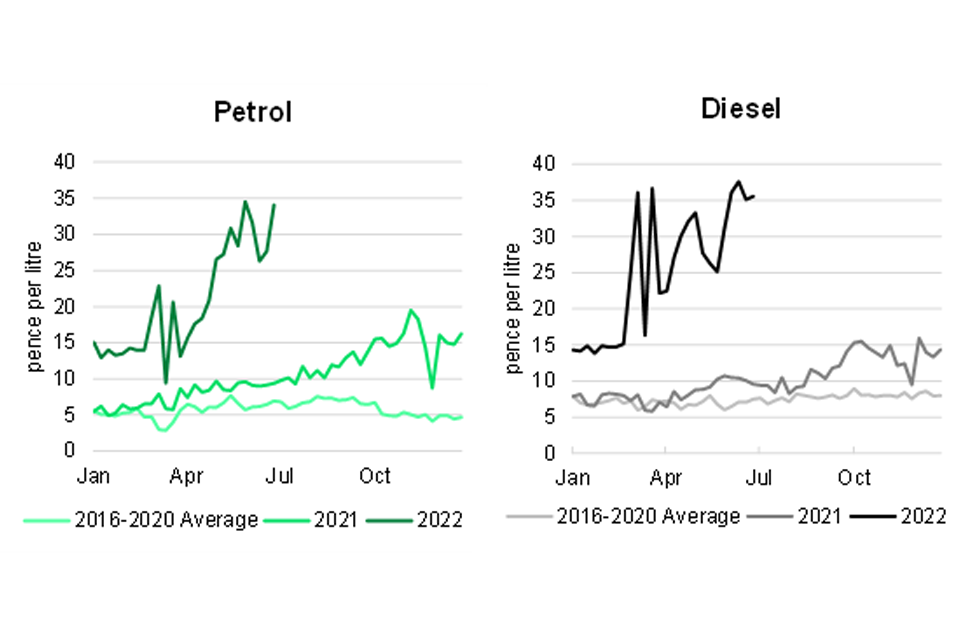
This section considers in more detail the reasons for the sharp rise in refining spreads that have been observed in recent months. As can be seen in Figure 10 refining spreads are currently significantly above their long-term trend for both petrol and diesel and have risen sharply since February 2022.
Figure 10 Petrol and diesel refining spread: annual comparisons
"
The graph shows the weekly average pence-per-litre refining spread of petrol and diesel separately over the calendar years 2022 (up to June), 2021, and average from 2016 to 2020. For petrol, the average refining spread from 2016 to 2020 fluctuated between 5 and 8 pence per litre, with a sharp increase since the middle half of 2021 to around 15 pence per litre in the end of 2021. Since March 2022, it has been increasing at a rapid pace, reaching 35 pence per litre in June 2022. For diesel, the 5-year average from 2016 and 2020 was fluctuating between 5 pence per litre and 10 pence per litre. Similar to petrol, there was a sharp increase since mid-2021, reaching around 15 pence per litre by the end. In March 2022, there was a surge of diesel refining spread, with very high volatility since then, moving between 25 and 35 pence per litre, with an increasing trend.
Source: CMA analysis of BEIS response to request for information
Oil refining is a mature market with historically low margins, and industry profitability of 1.8% between 2017 and 2021.[footnote 36] Global capacity has been gradually declining due to lower expected demand for oil products and higher production costs, arising in part from policies and regulations to achieve net zero carbon emission goals.
However, since 2020 a number of significant supply and demand-side shocks (stemming from COVID-19 and sanctions on Russia) have affected the global market for refined petroleum products. Overall, these have led to a decrease in refinery output, whilst demand for refined petroleum products (including petrol and diesel) has increased as economic activity has begun to recover from COVID-19. These factors, together with seasonal increases in demand going into summer, have pushed wholesale prices higher, and are likely to have influenced the high refining spreads observed in recent months.
Supply-side factors
COVID-19: the COVID-19 pandemic and associated lockdowns significantly decreased demand for refined products, with UK demand declining by around 30% between 2019/20 and 2020/21. The fall in demand caused a knock-on impact on global refining capacity, with the closure or conversion of a number of refineries. This has led to a decrease in global refining capacity and output. In April 2022, the volume of global refining was around 5% lower than average pre-pandemic levels (78.1 million barrels per day, compared to 82.1 million barrels per day).[footnote 37]
We have analysed data on output of petrol and diesel from the UK’s 6 major refineries. The data shows that petrol output fell by around 20% in 2020, with a smaller decline in diesel output. Since then output has recovered with quarter 1 2022 output at pre-pandemic levels.[footnote 38] This suggests that there has been no change in UK oil refining capacity.
Russian Sanctions: Russia was the largest net exporter of refined petroleum, with net exports totalling $46.7bn in 2020, accounting for 10.6% of global exports. [footnote 39],[footnote 40] Following its invasion of Ukraine, sanctions have been imposed on Russia by a number of nations. This has significantly limited the supply and availability of Russian refined petroleum, including in the UK, US and member states of the EU. The International Energy Agency (IEA) estimates that oil exports from Russia have decreased by 2.5 million barrels per day, of which 40% is refined products.[footnote 41] For the UK, Russia was the second most important overseas source of refined petroleum products in 2021, and the most important source of diesel (accounting for 34% of imports and 20% of UK supply).[footnote 42]
Demand-side factors
Relaxation of COVID-19 restrictions: The relaxation of COVID-19 restrictions has led to a surge in demand for refined petroleum. Although UK demand for petroleum products remains around one-fifth below 2019 levels, it has been recovering, with Q4 2021 demand for petroleum products up by 12% compared to Q4 2020.[footnote 43] Globally, oil demand is forecast to average 99.4 million barrels per day in 2022, up 1.8 million barrels per day year-on-year.[footnote 44]
Seasonal factors: Demand for refined petroleum products is cyclical, with changes in behaviour in the US – the world’s largest consumer of oil – causing seasonal fluctuations in global demand.[footnote 45]) In particular, the “Summer Driving Season” (June through September) causes an increase in demand in the summer months.
Expectations for future refining spreads
Future refining spreads will be affected by 2 opposing factors, as refining capacity rises on the 1 hand, but global demand continues to recover on the other. Forecasts around both are inherently uncertain, but given that bringing capacity online needs to be planned ahead, short term supply forecasts may be more reliable than demand forecasts.
-
According to the IEA,[footnote 46] refinery capacity is set to make a recovery. The global refinery capacity is expected to increase by 1 million barrels per day in 2022, with a further expansion of 1.6 million barrels per day expected in 2023. This is due to the completion of refinery maintenance in US, Europe and Asia, and the creation of new refineries in Africa, Asia and the Middle East. This suggests that the supply side restrictions caused during COVID-19 may ease.
-
Demand may continue to expand as the global economy continues to recover from COVID-19, the IEA projection for demand growth for oil is 1.8 million barrels per day and 2.2 million barrels per day in 2022 and 2023, respectively. However, there is significant uncertainty around future economic growth due to the continuing impact of COVID-19 (particularly in China), the war in Ukraine and inflation in the West.
In the time available to carry out this review, the CMA examined only a small number of forecasts for refining spreads. These envisaged spreads falling back towards historically more normal levels over the course of this year and next, as high refining profitability provides an incentive to expand capacity.[footnote 47], [footnote 48] However, these forecasts are subject to considerable uncertainty, both in terms of how far and how fast this could happen.
Given the levels of these refining spreads, the extent to which they have contributed to fuel price increases, and the fact that they have historically been low and stable, it is important that we understand what is driving them. We also need to increase our understanding of how long they are likely to persist, and to assess whether there are measures the UK should be taking to address them or guard against future spikes. These issues will be a major focus of our market study.
Fuel retailing
Retail price development in the UK
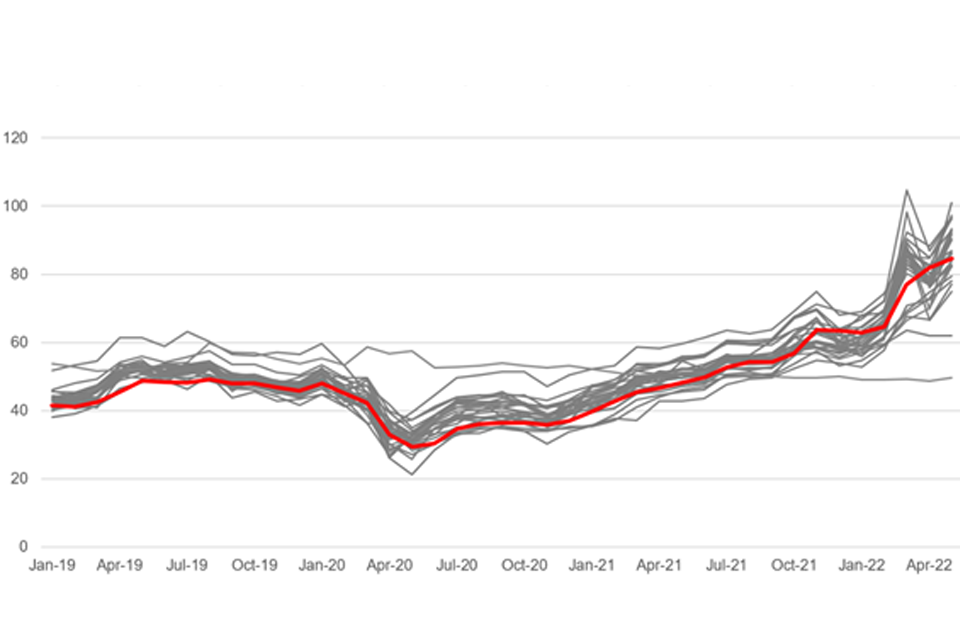
Following a drop due to the onset of the COVID-19 pandemic, retail prices have been increasing in the UK since spring 2020. This pattern is broadly in line with how prices have changed in other European countries, as the pump price is primarily driven by rising global wholesale costs. Figure 11 below shows the average petrol retail price, excluding tax and duty, for the UK (red line) against that in the 27 member states of the European Union (grey lines).
Figure 11 Comparison of average UK retail prices (premium unleaded petrol) to EU prices, before tax and duty, from January 2019 to May 2022
"
The graph shows average prices for premium unleaded petrol (before tax and duty) in the UK and EU member states from January 2019 to May 2022. Pre-tax UK retail prices were between 40-50 pence per litre from January 2019 to January 2020, among the lowest in the EU, before climbing from 30 pence per litre in May 2020 to over 80 pence per litre in May 2022, overtaking some EU members.
Source: CMA analysis of BEIS submissions (based on data from European Commission Oil Bulletin (non-UK) and BEIS Fuels Survey (UK)).
Figure 11 shows that whilst pre-tax UK retail prices tended to be amongst the lowest in 2019-2020, the UK’s ranking has dropped over the last year. This relative increase in UK prices appears to be largely explained by the fall in the value of sterling against the Euro. Fixing the exchange rate to January 2019, the ranking of the UK’s retail prices versus EU countries in the recent months would be similar to its ranking pre-COVID-19.
Market structure and concentration
Based on the information we received during this review, and our pre-existing knowledge of the sector,[footnote 49] the structure of the market for the supply of retail fuel in the UK appears to be relatively stable. There are multiple players across the UK setting prices primarily based on local competitive conditions, but sometimes taking into consideration wider elements with a national dimension.
The retail road fuel sector is served by PFSs, primarily owned and run under 1 of 3 key business models:
-
Oil-company-owned – these are owned by an oil company (such as BP, Shell, Esso or Murco) which brands the PFS. They may be operated by the company (or its retail subsidiary) or by a dealer, in which case it is the dealer setting the prices.[footnote 50]
-
Independents – these are owned and operated by independent dealers which can be branded or unbranded (see Figure 12 below).[footnote 51] They differ significantly in size with some dealers owning a single PFS – 1 stakeholder told us that this is the case for 87% of independents – and other businesses such as Rontec, Motor Fuel Group (MFG) and Euro Garages operating chains of PFSs.
-
Supermarkets – these are owned and operated by grocery retailers such as Tesco, Asda, Sainsbury’s and Morrisons and are generally located next, or close, to their supermarket.
Figure 12 Branding of PFS: forecourt and shop
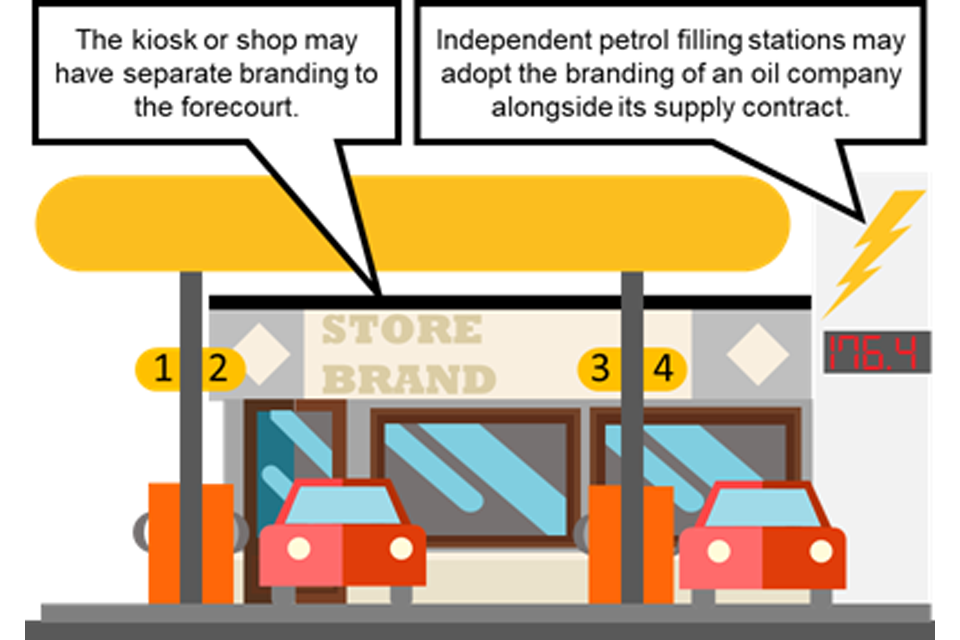
"
The infographic describes the separation between forecourt and shop branding at a petrol filling station. The kiosk or shop may have a separate branding to the forecourt. Independent petrol filling stations may adopt the branding of an oil company alongside its supply contract.
Source: CMA Analysis
As shown in Table 1 below, there were 8380 PFS sites in the UK in 2020. Independent dealers operated the most PFSs (64%) but sold the lowest average volume, and accounted for only 37% of fuel sold by volume in 2020. Supermarkets operated only around 18% of PFSs but accounted for around 44% of fuel sold by volume. Oil companies owned about the same number of PFSs as supermarkets but sold less volume (20%).
Table 1 – Market share by ownership (UK)[footnote 52]
| Ownership | Number of sites | Average volume per site (kl p.a.) | % Share of volume | % Share of PFSs |
|---|---|---|---|---|
| Oil-company-owned | 1,494 | 4,823 | 20% | 18% |
| Independents | 5,384 | 2,476 | 37% | 64% |
| Supermarkets | 1,502 | 10,608 | 44% | 18% |
| Total | 8,380 | 4,352 | 100% | 100% |
Source: Petrol Retailers Association (PRA) – Market Review 2021(PDF, 17.57MB. Numbers may not add up due to rounding.
This is consistent with the information we gathered from stakeholders as part of this review[footnote 53] and evidence from past CMA work,[footnote 54] which suggests that there has been relatively little recent change in shares by ownership over the last decade.[footnote 55]
Retailers generally buy fuel from wholesalers on what is known as a ‘Platts plus’ basis. Platts refers to a benchmark for the price of refined oil products, ‘plus’ adds the cost to the wholesaler of delivering the fuel and an additional amount that wholesalers and retailers agree, depending on their relative bargaining positions.[footnote 56] As detailed in section 2 above, road fuels are typically transported from terminals to the PFSs by road tanker, for which third party logistics are often used, and then sold to the end user from PFSs.[footnote 57],[footnote 58]
Evidence from past CMA work suggests that, given they buy higher volumes compared to independent dealers, supermarkets have a stronger bargaining position. For instance, they are able to negotiate not only lower wholesale prices but also shorter contracts, thus allowing them to renegotiate terms more frequently. They also have the ability to buy fuel on a ‘lag’ of 1 to 3 weeks, meaning that the wholesale price they pay may be based on the average Platts price in the previous week, 2 weeks ago or 3 weeks ago, depending on the negotiated lag.[footnote 59],[footnote 60] As discussed below, this structure of retailers’ costs can be expected to influence the speed at which changes in upstream prices are passed through downstream.[footnote 61]
National shares of supply
Table 2 below sets out the UK national shares of supply for the retail supply of road fuel.[footnote 62] As shown in the table, retail supply of road fuel appears to be relatively fragmented with no single retailer having more than a 20% share of supply.[footnote 63]
Table 2 UK national shares of supply for the retail supply of road fuel (2019 volume)
| Retailer | % Share of volume sold | Type of retailer |
|---|---|---|
| Asda/Eurogarage | [10-20]% | Supermarket |
| Sainsbury’s | [10-20]% | Supermarket |
| Tesco | [10-20]% | Supermarket |
| BP | [5-10]% | Oil-company-owned |
| MFG | [5-10]% | Independent |
| Morrisons | [5-10]% | Supermarket |
| Shell | [5-10]% | Oil-company-owned |
| Co-Op | [0-5]% | Oil-company-owned |
| Petrogas | [0-5]% | Oil-company-owned |
| RONTEC | [0-5]% | Independent |
| Others | [20-30]% | Smaller independents |
| Total | 100% | Not applicable |
Source: CD&R/Morrisons (2022) for the shares, and CMA analysis during review for the type of retailer.
Franchise, branding and fuel supply arrangements
As noted above, the majority of PFSs in the UK are independently owned and typically operate under a franchise model whereby they tend to adopt the branding of their fuel supplier, such as Shell and BP. Independent retailers tend to source their fuel from these suppliers under long-term supply agreements, we have been told in some cases, lasting up to 10 years. These long-term agreements ensure a secure supply of fuel for retailers and can encourage investment in the forecourt and retail offering.
However, in the course of our review, we have heard concerns that these long-term supply agreements lack the flexibility needed to respond to market forces and can bind retailers to strict terms, particularly regarding minimum volume commitments. In turn, we were told that these supply agreements may prevent independent retailers from engaging in more frequent procurement exercises aimed at securing competitively priced supplies. We were also told that these arrangements offer less flexibility than the buying practices of supermarkets.
Some stakeholders have suggested that restricting the maximum length of the fixed term of these agreements, or the introduction of break-clauses for longer contracts, would improve competition and outcomes for consumers.
Similar concerns have arisen in other countries, where legislation has been introduced to impose limits on these exclusivity provisions. For instance, in Spain we understand exclusive supply agreements between oil companies and PFSs are limited to 1 year. In Western Australia, a ’50-50’ rule was introduced which allows retailers greater flexibility in the sourcing of fuel, allowing them to purchase up to 50% of their supplies from a different supplier from their main contract supplier.[footnote 64] New Zealand has also prohibited certain restrictions in supply agreements.[footnote 65]
We plan to analyse the terms and impact of any such long-term supply agreements during our market study. In particular, we will consider whether the length of these agreements and their minimum volume commitments are harming competition.
Nature of retail competition
Most stakeholders we have engaged with in this review told us that competition remains vigorous at the retail level, whilst allowing for local variations. 2 motoring organisations submitted that supermarkets became less pressured to lower prices after the pandemic. They attributed this partly to the change of ownership in 1 big supermarket but also acknowledged the possibility that supermarkets may be less inclined to attract consumers through lower pump prices, given the tendency of consumers to increasingly shop from home, post pandemic.
The evidence received during this review, and our analysis of prices presented below (showing the differences between supermarket and other retailers), suggest that supermarket pricing strategies are likely to have remained broadly the same as they were when the CMA reviewed this market in recent merger inquiries. In particular, the supermarkets that responded to our RFIs told us that they have not substantively changed their pricing strategies since January 2020. Furthermore, our data analysis shows that supermarkets tend to have lower prices than other retailers, and we can also infer from this evidence, and the analysis of retail spreads, that the spread between retail margins and wholesale costs has not increased following the duty cut in March 2022 or in the past year (see Figure 8).
As outlined above, evidence received as part of this review and in past CMA work suggests that prices of fuel vary locally, and consumers consider nearby options when deciding where to purchase fuel. Therefore, retailer competition is primarily local. By which we mean retailers set their prices in relation to areas which typically include PFSs that are 10-20 minutes’ drive-time apart from each other. Retail prices at individual PFSs may also be informed by overarching elements such as constraints to cover wholesale costs or to avoid too wide a gap across 1 retailer’s local sites.
To a lesser extent, retailers also compete at the national level. Some parts of a retailer’s offering can be set uniformly across its entire fuel business.[footnote 66] For instance, in Bellis/Asda (2021) the merger parties submitted that certain aspects of Asda’s retail fuel business model are set nationally.[footnote 67] In MFG/MRH (2018), the CMA noted that there may be some scope for the merging parties to adjust their prices nationally.[footnote 68] The presence of a national dimension in the way retailers set prices was confirmed by submissions from retailers received during this review.
We set out below the main parameters of local competition.
Factors influencing consumer choice of petrol filling station
Price and location of the PFS are the 2 most important factors influencing consumer choice. Other factors such as fuel brand or having a convenience grocery store on the premises are less important.[footnote 69] Given that consumers tend to consider options which are typically only a short drive-time away, we would expect that location generally drives their choice in the first instance, then price is considered within that location.
How retailers set prices
Road fuel retailers set prices based on local competition, with some aiming to match or undercut rivals in a given local area.[footnote 70] Information received during this review shows that pricing strategies differ between supermarkets and non-supermarket retailers (see further below). This is also consistent with recent merger assessments.[footnote 71]
Further, past CMA work suggests that Asda has been the price leader. For instance, evidence from third parties in Sainsbury’s/Asda indicated that while supermarkets have the lowest prices, Asda was the price leader and was perceived to be the first to cut prices.[footnote 72] This is consistent with other evidence and analysis from past CMA work.[footnote 73] Our analysis of retailer prices over the last year, as reported by Experian, confirms that Asda’s prices have continued to be the lowest amongst all retailers.
Finally, past CMA work considered that motorway PFSs competed only to a limited extent with non-motorway ones (and vice versa), and motorway PFS prices tended to be higher.[footnote 74] They were more likely to compete with others on the same side of the same motorway, even 20 or 30 miles away, rather than necessarily facing a strong constraint from PFSs within a 5 or 10-mile radius that are off the motorway. This is because drivers are unlikely to interrupt their journey and leave the motorway in order to look for cheaper fuel. Evidence we have received from stakeholders as part of this review as well as our analysis of local price variation over the past year confirms that prices at motorway PFSs tend to be higher than those charged by off-motorway sites.
Factors affecting local prices
Past CMA analysis found that the number of competitors in a given local area and whether there is a supermarket present have a significant effect on retail fuel prices at an individual PFS.
In particular, our analysis found a positive and significant relationship between local prices and concentration with prices being higher in areas with fewer competitors.[footnote 75] The analysis also found that the presence of supermarkets and, to a lesser extent, of oil-company branded sites, exerted more downward pressure on prices in a local area, once other factors were controlled for.
An analysis conducted in Sainsbury’s/Asda suggested that prices at a given PFS will be lower in the presence of an additional supermarket competitor when located 20 minutes away in terms of drive-time. Prices will also be lower in the presence of an additional non-supermarket competitor, but only when located within 5 minutes’ drive-time, meaning that supermarkets constrain prices at a given PFS even when they are located further away than non-supermarket competitors.[footnote 76] Further, supermarket PFSs had a larger effect on fuel prices than non-supermarket PFSs. For example, within a 5-minute drive-time, the impact of 1 additional supermarket PFS was around 13 times that of an additional non-supermarket PFS, with the former lowering fuel prices at the PFS under consideration by 0.75%, and the latter only 0.06%.[footnote 77] Characteristics such as site location and region may be associated with different average prices.[footnote 78] The fact that prices in rural areas tend to be higher than those in urban areas is consistent with our analysis of local price variation over the past year (see below).
Local price variations over the past year
We have obtained site-level data from Experian and conducted an analysis of local price variations of the past year. The results illustrate local price variations that are consistent with our understanding of how competition works as set out above. In particular:
-
prices of supermarkets have been consistently lower than other retailers;
-
prices in rural areas tend to be higher than in urban areas. Some of the reasons for this may be that these areas have generally fewer supermarkets and supply lower fuel volumes compared to more urban ones, and they may experience higher transportation costs as well. Higher prices may enable some lower volume sites to remain viable in sparsely populated/rural areas; and
-
prices in England have been higher than in other nations, and prices at an individual PFS tend to be lower the more local competitors there are in the surrounding area.
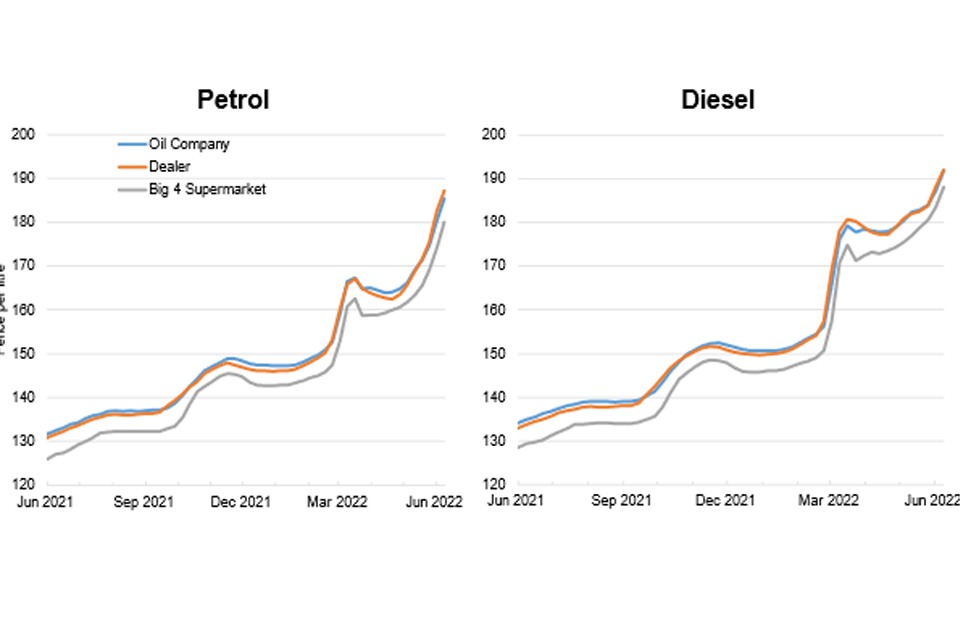
Figure 13 below shows weekly average prices by type of retailer (supermarkets, oil companies and independent dealers). It shows that prices have gone up in a similar pattern, with supermarkets consistently pricing below other types of retailers.
Figure 13 Weekly average prices (pence per litre) by type of retailer
"
Two graphs, one for petrol and one for diesel, show weekly average prices in pence per litre, split by oil company, dealer and big 4 supermarket from May 2021 to May 2022. Supermarket petrol prices are consistently cheaper than the other types but have risen from 125 pence per litre to 180 pence per litre in the given timeframe. The same is true for diesel prices, rising from just under 130 pence per litre to roughly 190 pence per litre, with a steep rise in February 2022. Oil-company and dealer prices are the consistently higher than supermarkets, at just under 190 pence per litre for petrol and just over 190 pence per litre for diesel.
Source: CMA analysis of Experian data
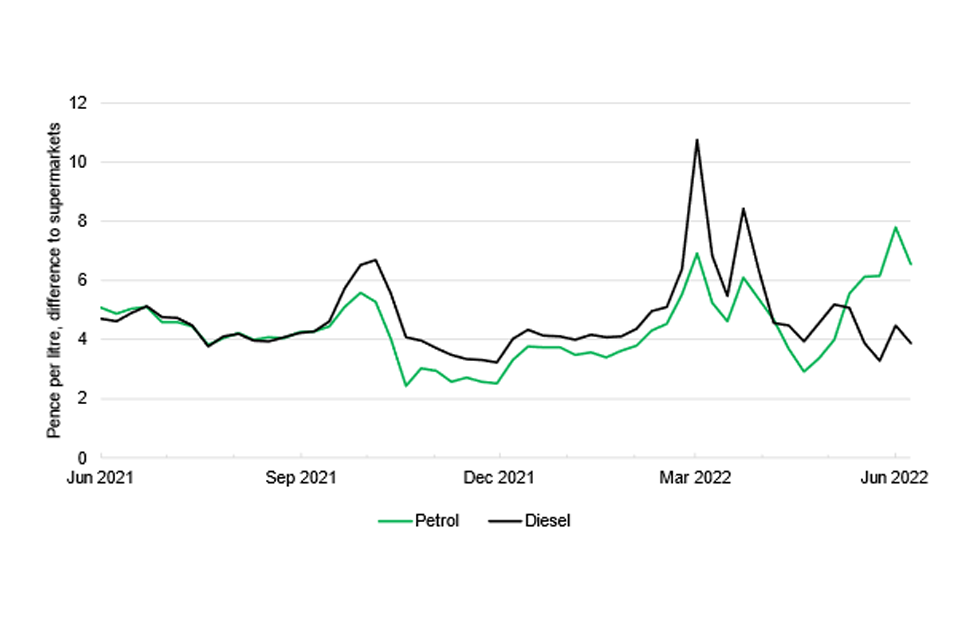
Figure 14 shows the weekly difference in pence per litre between supermarkets’ retail prices and those charged by other types of retailers, for diesel and petrol. In this chart, the higher the line, the bigger the discount at the supermarkets relative to other retailers.
Figure 14 Difference in weekly average price (pence per litre) charged by other retailers relative to supermarkets (supermarkets = 0)
"
The graph shows the difference in the weekly average price (in pence per litre) charged by non-supermarket retailers relative to supermarkets from May 2021 to May 2022. For both petrol and diesel, prices are 5-6 pence per litre higher at non-supermarket retailers before falling to 2 pence per litre higher for petrol and 4 pence per litre higher for diesel in October 2021. The difference returns to roughly 4 pence per litre in November 2021 until February 2022, where petrol price differences climb to over 6 pence per litre, while diesel price differences rise to almost 11 pence per litre. Petrol then climbs further to 8 pence per litre in May 2022, while diesel falls back to 4 pence per litre.
Source: CMA analysis of Experian data. Weekly averages based on Wednesday and Sunday.
As Figure 14 shows, over the last year supermarket prices have remained consistently below non-supermarket prices, by between around 3p to 6p per litre. There is some variation in this gap. Notably, the gap increased temporarily around March 2022, when retail prices first went up in response to wholesale cost increases, and then adjusted to account for the fuel duty cut towards the end of March. The temporary increase in the difference between supermarket and other retailer prices appears to be due to different timings of price changes. We discuss this adjustment of prices in response to the fuel duty cut in the section 4. We also note that the supermarket discount has at times developed differently for diesel and petrol, which may be explained by different developments in the underlying wholesale price for petrol and diesel.
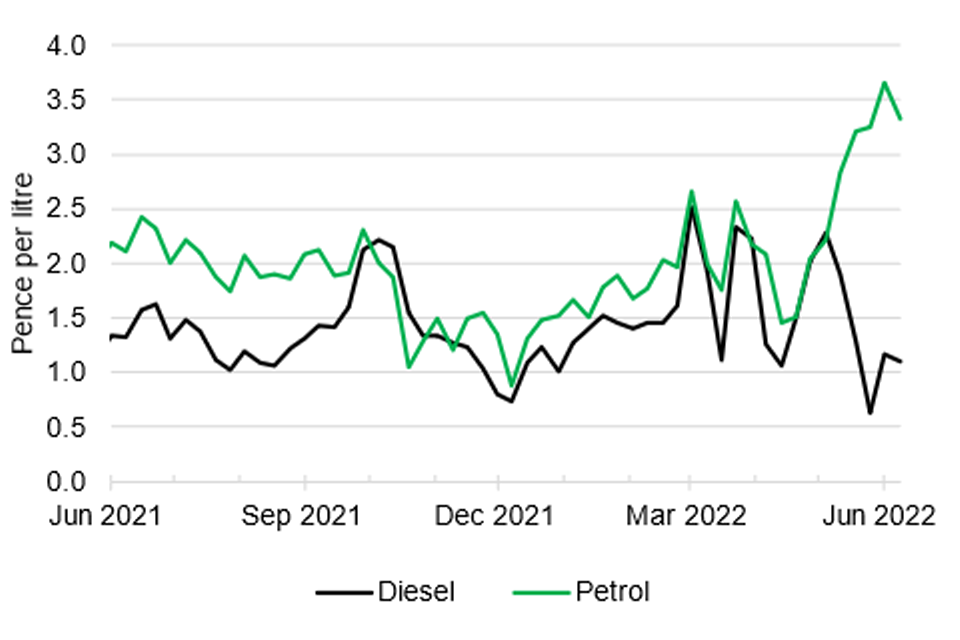
Figure 15 shows that we have found rural prices to be consistently higher than those in urban areas. In our market study we intend to conduct further analysis to better understand the factors driving these and other local and regional variations in prices.
Figure 15 Differences in weekly average rural and urban price (pence per litre) (urban = 0)
"
The graph shows the difference in weekly average rural and urban prices in pence per litre from May 2021 to May 2022. Petrol prices stay around 2-2.5 pence per litre higher in rural areas from May to September 2021, before falling to 1 penny per litre higher from October to December 2021. It then steadily climbs to just over 2.5 pence per litre higher in February and March 2022, before steeply rising to 3.5 pence per litre higher in rural areas in May 2022. Diesel follows a similar pattern but is largely closer to urban prices than petrol, with a difference of only 1-1.5 pence per litre from May to September 2021 and a fall from April to May 2022 from 2.25 pence per litre to just over 1 penny per litre.
Source: CMA analysis of Experian data. We allocated sites to rural and urban categories based on the ONS classification.
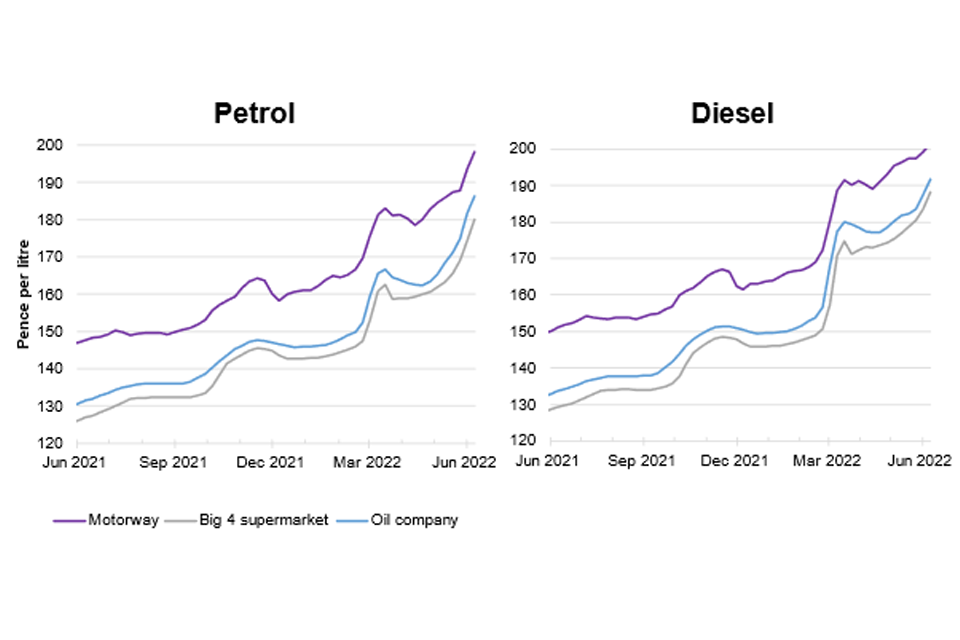
We also found that motorway station prices, as shown in Figure 16, have continued to be more expensive than non-motorway.
Figure 16 Weekly average price (pence per litre) for motorway and other types of sites
"
Two graphs, one for petrol and one for diesel, show the weekly average price in pence per litre for petrol and diesel from May 2021 to May 2022, split by type of retailer (motorway, big 4 supermarket, non-motorway oil company/dealer). Motorway petrol prices rise from just under 150 pence per litre in May 2021 to 200 pence per litre in May 2022. They are consistently 15-20 pence per litre higher than the other types, which go from roughly 130 pence per litre in May 2021 to 180 pence per litre in May 2022. Diesel prices follow the same pattern, but the difference between motorway retailers and the other types is 10-15 pence per litre and there is a steep rise in all prices in February 2022.
Source: CMA analysis of Experian price data.
Our further analysis found other price patterns consistent with previous CMA work, in particular:
-
that prices in local areas with only 1 PFS are highest, but decrease in areas with more competitors;
-
that fuel in England has generally been more expensive than in other nations; and
-
that Asda’s prices have continued to be the lowest amongst all retailers.
Pass-through analysis
This section considers evidence on the pass-through of wholesale price changes to retail prices of road fuels, including the extent to which the 5p per litre cut in fuel duty on 23 March was reflected in retail prices. We draw on economic theory, past work done by the CMA, OFT and the academic community, as well as our own analysis of recent price developments.
We note at the outset that caution is required when interpreting analyses of the ‘retailer spread’ whereby the retail price is compared to the wholesale cost at the same point in time. We have indicated this above but explain further below that stocks of fuel, and the time it takes for the changed upstream costs to filter through to downstream prices, mean that the cost actually incurred by a retailer in supplying fuel at a given point in time is not the same as the observed wholesale cost of fuel at that point in time.
What do we know about cost pass-through in road fuels?
The term ‘cost pass-through’ describes a firm changing the prices of the products or services it supplies to customers following a change in its costs. The CMA has looked at cost pass-through both from a theoretical perspective and specifically in road fuel as part of its analysis of mergers.[footnote 79]
Economic theory predicts the following:[footnote 80]
-
the extent to which a firm will pass-through a change in its own costs to the final price its customer pays depends on a number of factors, including the relative degree of responsiveness of demand and supply to changes in price,[footnote 81] the structure of the product market where it operates, and the type of cost change it faced;[footnote 82]
-
many theoretical models and empirical research indicate that pass-through of industry-wide cost changes tends to be higher in more competitive markets;[footnote 83],[footnote 84]
-
a cost shock that affects an upstream stage in the supply chain may take time to filter down to retail prices and the extent to which it will be passed through depends on upstream and downstream pass-through rates. The nature of contracts between upstream suppliers and retailers and their respective bargaining power, as well as any difference in how quickly prices adjust to cost change at each level, may also affect the extent of pass-through;[footnote 85] and
-
there is no clear link between vertical integration (where a company operates in different levels of a supply chain[footnote 86] as described above) and pass-through, and empirical studies confirm that there is an ambiguous relationship between the 2 . The effect of vertical integration of eliminating separate margins between different firms within the same supply chain (for example, between oil company and dealer) may boost pass-through in some cases but have the reverse effect in other cases.[footnote 87]
Past OFT work estimated the speed at which changes in upstream prices were passed through the supply chain, both for crude oil to wholesale prices and for wholesale prices to pump prices for diesel and petrol. It also tested whether upstream price increases were passed through more quickly than price decreases (so-called ‘rocket and feather pricing’). It found that:
-
changes in crude oil prices were passed through to wholesale prices, with 70-80% of a change in crude oil price being passed through in the same week and all the change being passed through within 2 weeks. It did not find evidence of ‘rocket and feather pricing’; and
-
changes in wholesale prices were passed through to retail prices much more slowly, with only about 50% of wholesale price changes being passed through to retail prices after 2 weeks and pass-through still being incomplete after 5 weeks. It found no evidence of ‘rocket and feather pricing’ at this level of the supply chain either.[footnote 88]
We note that the above analysis was conducted almost 10 years ago so might not necessarily reflect the current extent and speed of pass-through at each level of the supply chain. In our market study, we intend to assess the relationship between wholesale and retail prices for fuel, including how rises and falls in wholesale prices are reflected at the pump.
The structure of retailers’ contracts with wholesale suppliers can also be expected to influence the speed at which changes in upstream prices are passed through downstream. For example, past CMA work also found that supermarkets may pay a wholesale price based on the average price index in the previous week, 2 weeks ago or 3 weeks ago, depending on the negotiated lag. Evidence submitted to this review confirms this, showing supermarkets paying prices on up to a 3-week average lagged basis.[footnote 89] Further, stock turnover driven by sales will affect retailers’ frequency of purchase which in turn will impact how long the upstream price takes to filter down.
Academic empirical analyses confirm that cost pass-through is influenced by the level of competition and the elasticity of demand relative to supply. In particular, they consistently find that cost pass-through in the retail road fuel sector may be gradual but tends to be significant,[footnote 90] and that it tends to be higher under more competitive conditions[footnote 91] and lower when the supply chain is constrained (for example, when refinery capacity utilisation is high or wholesale inventory levels are low).[footnote 92]
In Shell/Rontec (2012), the OFT found that costs are eventually passed through at a level of around 100%.[footnote 93] Similarly, evidence considered by the CMA in MFG/MRH (2018) indicated that MFG-supplied dealers were likely to pass on any wholesale price increases to their customers to a significant extent.[footnote 94]
Interpreting recent cost pass-through in road fuels
Figure 16 below shows the evolution of average retail and wholesale petrol (left axis) and diesel (right axis) prices since January 2019. The chart suggests that retail prices follow wholesale prices, and, consistently with the assessment above, there appears to be a lag, both when the cost is increasing and when it is decreasing. For example, the reduction in costs around April 2020 was followed by a delayed reduction in prices; sharp rises in costs in November 2021, March 2022 and May 2022 also increased prices with a delay.
Figure 17 Average weekly retail and wholesale prices (including fuel duty and VAT) from January 2019 to June 2022
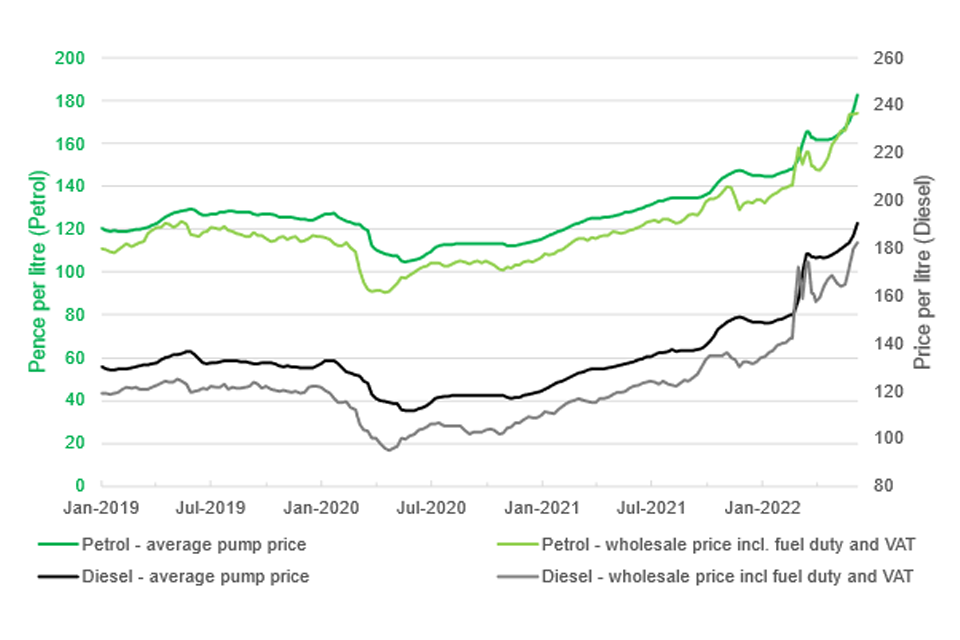
"
The graph shows average weekly retail and wholesale prices in pence per litre (including fuel duty and VAT) from January 2019 to June 2022. Petrol retail prices are marginally higher than wholesale prices throughout and fall from 120 pence per litre to just over 100 pence per litre in May 2020, before rising again to just over 180 pence per litre in June 2022. Diesel prices follow a similar pattern, falling from 140 pence per litre January 2019 to 120 pence per litre in May 2020, before rising again to just under 200 pence per litre in June 2022. The difference between retail and wholesale prices is consistent for the majority of the time period, at around 15 pence per litre until January 2022 when it shrinks to zero.
Source: CMA analysis of data submitted by BEIS.
Note: Diesel is presented on the right-hand axis which is truncated and offset and should not be compared directly against petrol.
Media reports and statements from some motoring organisations have suggested that price and cost behaviour observed in recent months exhibits ‘rocket and feather’ characteristics, with retailers not passing through reductions in wholesale costs in a timely manner. However:
-
as explained above, pass-through normally occurs with delay (of a few weeks), and the delay can be consistent with a competitive market. A reduction of wholesale cost in 1 week should not be expected to be immediately reflected in the retail price;
-
this means that where the wholesale cost has been increasing for several weeks in a row, a temporary decrease in wholesale costs for 1-2 weeks may well not lead to price reductions. Where the wholesale cost is on a long-term upward trend (as has been the case since May 2020), short-lived drops in wholesale cost for 1-2 weeks before a return to the long-term upward trend may only slow the growth of the retail price rather than reverse it;
-
for the reasons set out above, care should be taken when comparing week by week movements in wholesale costs and retail prices, and therefore the calculated ‘retailer spread’. A robust assessment of the degree of pass-through needs to take account of changes in wholesale costs in preceding weeks, and control for changes in other costs incurred by the retailer that may have occurred at the same time. Such modelling has been done in the past (as set out above) and, once the relevant factors have been controlled for, no evidence of ‘rocket and feather’ behaviour was found at that time; and
-
even if a pattern of asymmetric pass-through (‘rockets and feathers’) was to be found, it is not immediately clear that this would necessarily imply a lack of, or lessening of competition between retailers. The profit margins earned by retailers over time would be more informative of their ability to charge above competitive prices.
Analysis of March fuel duty cut pass-through
On 23 March 2022 the Chancellor of the Exchequer, in his Spring Statement, announced a temporary cut in the rate of fuel duty for petrol and diesel by 5p per litre, with effect from 6pm on 23 March 2022 for a period of 12 months.[footnote 95] Taking into account the accompanying reduction in VAT charged, the total direct effect on the cost of fuel due to this announcement amounted to 6p per litre.[footnote 96]
On the day of the announcement, petrol was averaging £1.67 per litre and diesel £1.80 per litre across the UK. The 6p per litre reduction therefore amounted to 3-4% of the pump price at the time. The relatively small size of this cost reduction makes it difficult to quantify with precision the extent to which it was passed through to retail prices (all else equal), particularly given the volatility of wholesale prices around that time. Weekly changes in average wholesale price in the 4 weeks before, and 4 weeks after, the week the duty was cut ranged between reductions of over 15p per litre to increases of over 17p per litre across any given week.[footnote 97]
As explained above, fuel duty is levied at the time fuel leaves the refinery and is paid before the retailer receives the fuel. Therefore, the fuel duty reduction does not reduce the retailers’ costs directly:
-
first, the fuel duty cut needs to be passed through by wholesalers and reflected in wholesale prices before it could be reflected in retailers’ costs. We did not examine in detail whether the cut was passed through at this point of the supply chain, but a number of wholesale suppliers and retailers told us that it was reflected in wholesale prices immediately, and 1 oil company commented that fuel duty cuts must be fully applied to wholesale price according to contract terms between retailers and wholesalers; and
-
assuming the spot price of wholesale fuel reduced by 5p per litre as of 6pm on the 23 March, stocks of fuel already held by retailers at that time had been purchased at the higher duty rate. Therefore, in principle, we would expect the change in fuel duty to only have an impact on the retailer’s costs, and therefore be factored into the retail price, with a delay corresponding to when existing stocks of fuel (and those in transit at the time of the cut) were depleted. This will vary by retailer and by PFS, depending on the volume of stock held and the degree of turnover.
To inform our review, we asked retailers to describe their response to the duty cut. In terms of speed of price adjustment, all 9 major retailers who responded submitted that they reduced prices at the pump very quickly after the duty cut was announced, in most cases either the same evening or the next day. These 9 retailers account for over 80% of the UK market share by volume. Some respondents mentioned incurring a loss because they reduced prices immediately while the actual costs reduced only later (consistent with our understanding as set out above). In terms of the magnitude of the price reduction:
-
7 of the 9 large retailers we spoke to indicated that they reduced the price at the pump by around 6p per litre; and
-
the other 2 retailers explained that the price reduction was less because the fuel duty cut was offset by simultaneous increases in other wholesale costs.
We used daily Experian data on site-level prices in the 2 weeks before and after the duty cut to examine how prices reacted. We note that pass-through depends on a number of things. Our analysis comments on some of these but does not control for all factors to allow a causal, ‘all-else-equal’ determination of the degree of pass-through for the duty cut (or the degree of pass-through more generally).
Results of our analysis of pricing before and after the duty cut are consistent with a UK-wide reduction of retail prices soon after the duty cut took effect. The figure below shows daily average prices between 16 March and 9 April, across the UK.
Figure 18 Average daily price before and after fuel duty cut (pence per litre)
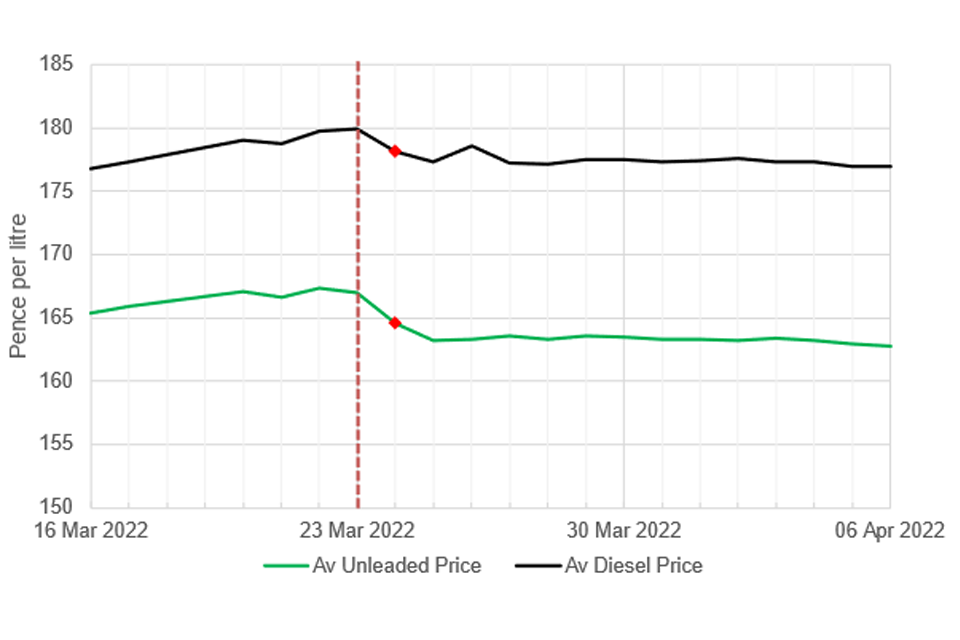
"
The graph shows the average daily price before and after the fuel duty cut in pence per litre, from 16 March 2022 to 6 April 2022. The date of the duty cut (23 March) is marked on the graph. Petrol prices rise from about 165 pence per litre on 16 March to 167 pence per litre on 23 March, after which they fall back to roughly 163 pence per litre over the next two days, remaining constant afterwards. Diesel prices rise from 177 pence per litre on 16 March to 180 pence per litre on 23 March, before falling back to about 177 pence per litre over the next couple of days and staying relatively constant thereafter.
Source: CMA analysis of Experian data. Vertical line represents prices the day the duty was cut, red dot marks the first price observation after duty cut took effect.
As Figure 18 shows, average prices were on an upward trend up to 23 March, dropping on both 24 March and 25 March. By 25 March, average prices were around 3.8p per litre and 2.6p per litre lower, for petrol and diesel respectively, relative to the prices on 23 March. This corresponds to an average price reduction of around 2.2% and 1.4% for petrol and diesel respectively. The prices remained relatively unchanged in the 2 weeks after.
We note that the observed average reductions of 3.8p per litre and 2.6p per litre are less than what the retailers who responded to our RFIs told us, as the majority submitted cutting their prices by around 5p per litre (plus 1p per litre of VAT reduction). This could be because the average includes a long tail of smaller independents that were not subject to our information gathering at this stage, and which may not have cut their prices in a similar way to the large retailers.[footnote 98]
We expanded our analysis to show pricing by type of retailer. The results show that there was some variation to the speed and extent to which retail prices were cut after 23 March.
Figure 19 below shows the price of the 4 large supermarkets, independents and oil company-owned sites, on a daily basis for 2 weeks before and after the duty cut, relative to the price on 23 March 2022. The price of each type of retailer is shown as 0 on 23 March 2022. The level of the line (as marked on the vertical axis) therefore shows the price change (in pence per litre) relative to the price observed on 23 March.
Figure 19 Difference in average daily price of petrol (left) and diesel (right) relative to 23 March 2022, by supermarkets (purple), oil companies (blue), and dealers (light blue) (23 March 2022 = 0)
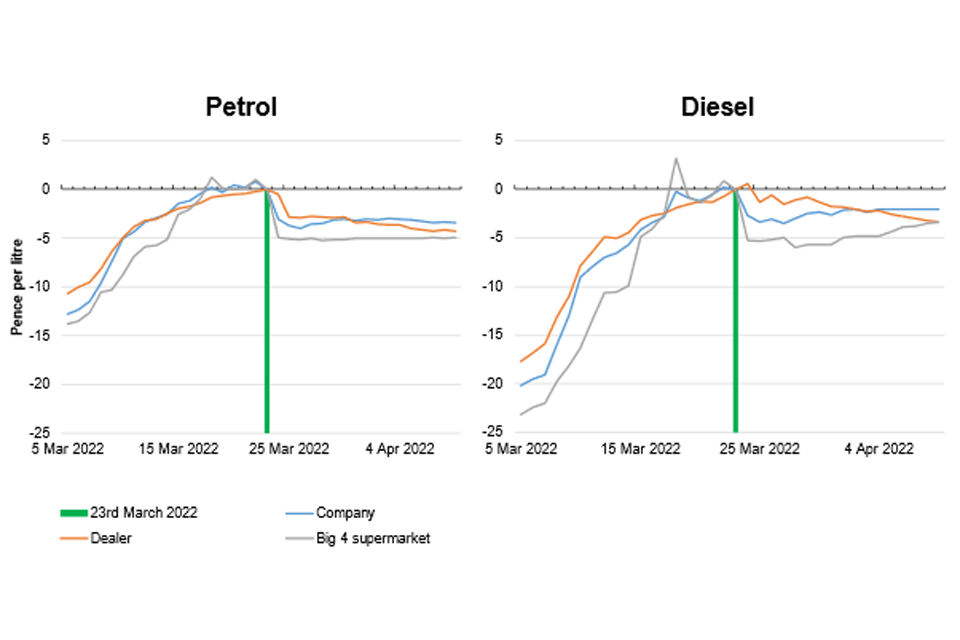
"
Two graphs show the difference in average daily price (in pence per litre) of petrol and diesel relative to 23 March 2022, split by supermarkets, oil companies, and dealers, from 5 March 2022 to 7 April 2022. Petrol prices for all three types of retailers start between 10 and 15 pence per litre lower than 23 March prices, before all gradually climbing to their peak on that date. Once the duty cut is implemented, all prices fall to between 1.5 pence per litre (dealers) and 5 pence per litre (supermarkets) lower than prices on 23 March. Diesel prices start off much lower, between 18 and 23 pence per litre cheaper than on 23 March before climbing to 2 pence per litre higher for supermarkets about a week prior to the 23 March. Prices then fall relative to those on this date in a way similar to those of petrol.
Source: CMA analysis of Experian data.
As Figure 19 shows, consistent with information submitted to us during our review, supermarkets (purple line) cut prices immediately after the duty cut, both for petrol and diesel. This amounted to a price reduction of around 5p per litre.[footnote 99] In contrast, prices of other retailers reduced by a smaller amount (for petrol) and/or more gradually (for diesel) after the duty cut. Therefore, there is an initial difference in the relative changes in pump price between the supermarkets and other retailers, but this gap decreases over the 2 weeks after the duty cut.
As shown in Figure 20 below, which plots the average daily petrol and diesel pump prices over a longer time period (2 January to 20 June 2022), the price reduction after the duty cut was temporary and prices resumed an upward trend from around May 2022.
Figure 20 Average weekly pump price in 2022
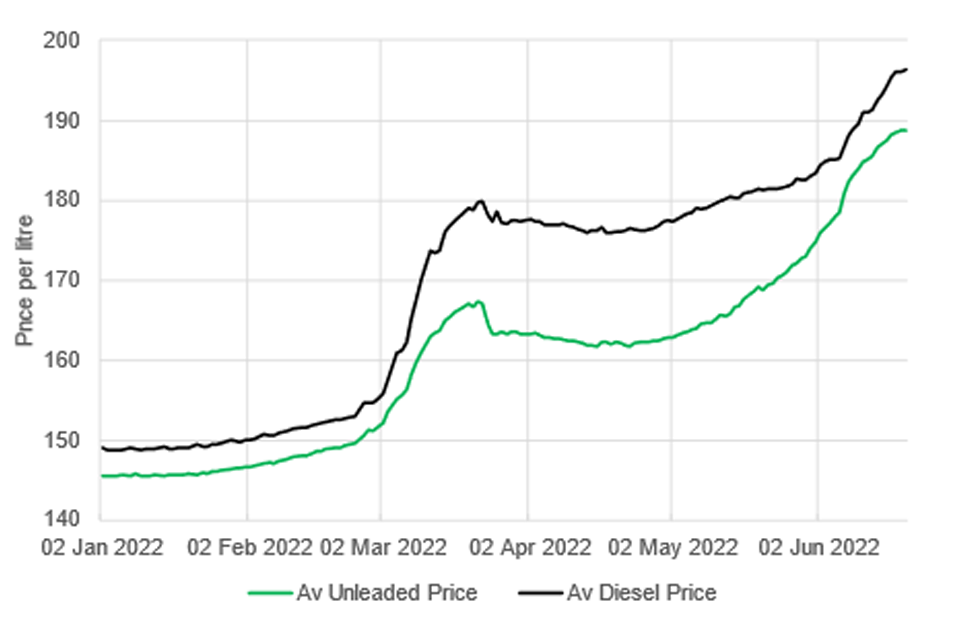
"
The graph shows the average weekly pump price in 2022 in pence per litre for petrol and diesel from 2 January 2022 to mid-June 2022. Petrol prices rise from just over 145 pence per litre on 2 January to roughly 167 pence per litre on 23 March, before falling to just over 160 pence per litre and staying constant here until the start of May, where price begins to rise, reaching 190 pence per litre most recently. Diesel prices rose from just under 150 pence per litre on 2 January to 180 pence per litre on 23 March, before falling to around 177 pence per litre at the duty cut and staying there until the start of May, where price begins to rise, reaching roughly 197 pence per litre most recently.
Source: CMA analysis of Experian data.
Assuming that wholesalers reflected the duty cut in prices of fuel leaving the terminal immediately, why did retailers decrease prices by less than the 6p per litre, and what lead to the continued increase in prices afterwards?
As discussed in section 2, the fuel duty cut took place in the context of increasing wholesale costs, which had been on an upward trend since the start of 2021, with some temporary periods of cost reductions between longer periods of growth (see Figure 3). The price rises have been driven principally by rising crude oil prices and refining spreads, as opposed to a growing gap between wholesale and retail prices. In this context and given that wholesale cost changes are passed through to retail prices with a lag, and thus smoothing any short-term reductions, it can be expected that the duty cut only led to a temporary reduction in prices at the pump, and that this reduction appears to be not full because it is simultaneously offset by other components of the wholesale cost.
To further inform our assessment, we have compared the price evolution around the time of the duty cut with cost indicators at the same time. We looked at 2 types of cost metrics:
-
BEIS maintains an econometric cost pass-through model (which predicts prices for next week based on the retail price in previous week and input costs over a number of preceding weeks). The model thus has the capability to account for the lagged effect of wholesale cost increases over preceding weeks on the next week’s prices, and is an improvement over simple comparisons of retail and wholesale prices at a single point in time. For the week commencing 21 March 2022, this model predicted a retail price increase of over 3p per litre,[footnote 100] on the basis of crude oil price changes in the preceding weeks. In other words, at the time of the duty cut crude oil prices had been rising for several weeks at such a rate that, due to the time it takes for crude oil price changes to filter through to retailer costs, the retailers were likely subject to increases in other components of wholesale costs of a magnitude of over half the amount the duty was cut. We also note that this is before accounting for any cost pressure due to increasing refinery margins, which are not accounted for by the BEIS model; and
-
the wholesale cost index obtained from BEIS allows calculation of the ‘retailer spread’ (see section 2 above). As explained above, care should be taken when interpreting short term (week-by-week) developments of retailer spreads, due to the time it takes for wholesale price changes to have an impact on retailer costs, and because there may have been changes to other costs retailers incur on top of the cost of buying fuel. However, trends in the longer-term development of the spread over several months can be a useful way to assess the drivers of retail prices. As shown in Figure 21, this comparison of average retail prices to the wholesale cost since the beginning of 2022 confirms that the retailer spread has not increased in a sustained way following the duty cut. Whilst there was some volatility in the spread between retail price and wholesale cost in March and April, with a temporary increase in this metric in the 2 weeks following the duty cut, the spread decreased thereafter, while the refining spread at the refinery level increased. On average, the retailer spread for petrol accounted for an average of 3% of the pump price in the month preceding the duty cut, an average of 8% of the pump price in the month following the duty cut, and 2% in the month following that.
Figure 21 Retail and refining spreads for petrol (pence per litre))
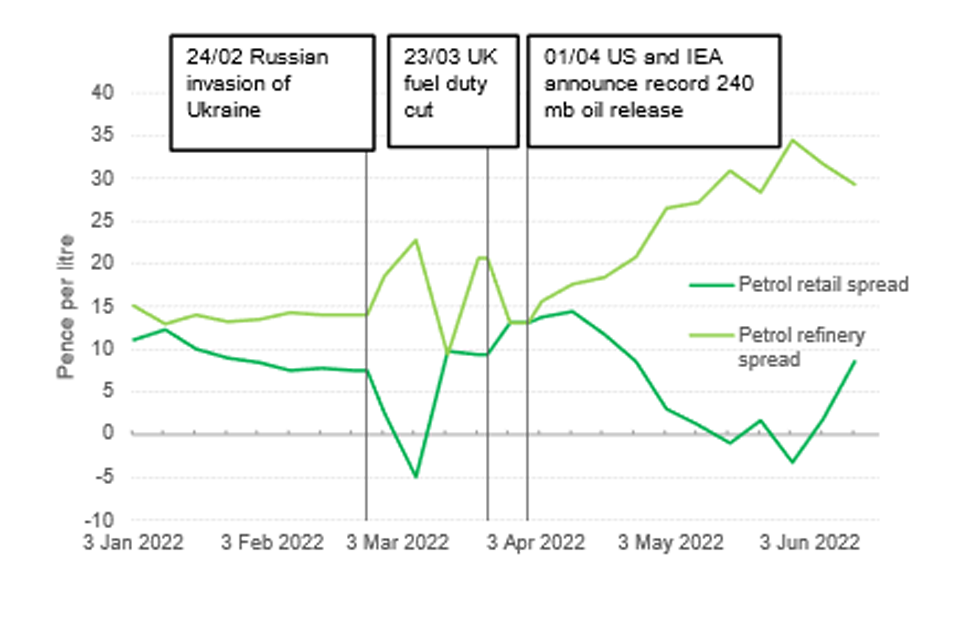
"
The graph shows retail and refining spreads for petrol from 3 January 2022 to 17 June 2022, in pence per litre. The Russian invasion of Ukraine (24 February), UK fuel duty cut (23 March) and US and IEA announcement of a record 240mb oil release (1 April) are all marked with vertical lines. Retail spread stays close to 10 pence per litre from 3 January to 24 February, where it falls sharply to -5 pence per litre by mid-March. It then quickly recovers back to 10 pence per litre, climbing to roughly 12 pence per litre after the 23 March duty cut and staying there for a period after the 1 April US and IEA announcement. From early April the retail spread gradually falls to a low of about -2 pence per litre in early June, before climbing steeply back to just under 10 pence per litre by 17 June.
Petrol refinery spread stays constant at just under 15 pence per litre from 3 January to 24 February, where it rises to just over 20 pence per litre by mid-March. It then falls to 10 pence per litre, before climbing back up to 20 pence per litre in time for the 23 March fuel duty cut where it falls to roughly 12 pence per litre. The 1 April US and IEA announcement marks the start of refinery spreads gradually rising to roughly 30 pence per litre by 17 June.
Source: CMA analysis of BEIS submissions (based on BEIS’ weekly fuel price survey and data from Argus). Fuel duty and VAT are not included in either spread.
This means that over the last few months, and since the fuel duty cut, retailers appear unlikely to have increased their profits, since the retail spread (which includes profits as well as costs) has not increased. We intend to conduct further analysis of the relationship between retailer prices and costs in the market study.
International comparisons
Road fuel prices have increased around the world. We have looked at global experiences of both the scale of increases and the actions that governments, regulators and competition authorities have taken in response and summarise some noteworthy examples below. Some interventions were in place in some countries ahead of the most recent spikes in road fuel prices.
We first looked at whether the price of road fuels in the UK is notably different to other countries and particularly across mainland Europe, as the UK’s closest geographic neighbours. Some of this analysis is set out in Figure 22, which shows the variation in retail price across much of Europe and the amount of which is collected in tax. It indicates there is no clear, obvious geographic driver of the price of road fuel and that the UK sits within this range.
This data shows significant variation in the cost per litre of road fuels, even between neighbouring countries. We looked at the cost of a litre of fuel across Europe on 1 day (20 June). In the data average retail prices in EU member states ranged from £1.05 per litre (Hungary) to £2.18 per litre (Finland) for petrol, and from £1.04 per litre (Malta) to £2.17 per litre (Sweden) for diesel – a more than 100% difference for both petrol and diesel.[footnote 101] Examples of price differences between neighbouring countries (for petrol) include Belgium (£1.81 per litre) and Netherlands (£2.02), or Denmark (£2.09) and Germany (£1.69).
Prices paid by consumers in different countries are affected by tax policy. The impact of taxation on retail price varies according to the pre-tax cost (and thus the relative scale of VAT[footnote 102] and duty), but in the EU the proportion of the retail cost of a litre of road fuel that is collected as tax varies across member states:
-
petrol – the amount of tax and duty collected varies between 27% and 56% (£0.43 to £1.04 per litre) (median[footnote 103]: 41%; for comparison: UK 45%); and
-
diesel – the amount of tax and duty collected varies between 26% and 54% (£0.45 to £0.84 per litre) (median: 36%; for comparison: UK 44%).
Even when taxes are removed from the retail price, there is significant variation in the underlying (i.e., pre-tax) price of road fuel:
-
petrol – a litre of petrol costs £0.50 in Malta but £1.14 per litre in Finland [for comparison: UK £1.03 per litre]; and
-
diesel – a litre of diesel costs £0.47 in Malta but over 3 times more in Sweden at £1.50 per litre [for comparison: UK £1.09 per litre].
Figure 22 shows the variation in the retail price of road fuels across the EU. Showing how much of the pump price is attributable to taxation. It indicates that there is no clear, obvious geographic driver of the price of retail fuel.
Figure 22 Impact of taxation on average EU member states road fuel prices (GBP)
Petrol on the Left - Diesel on the right
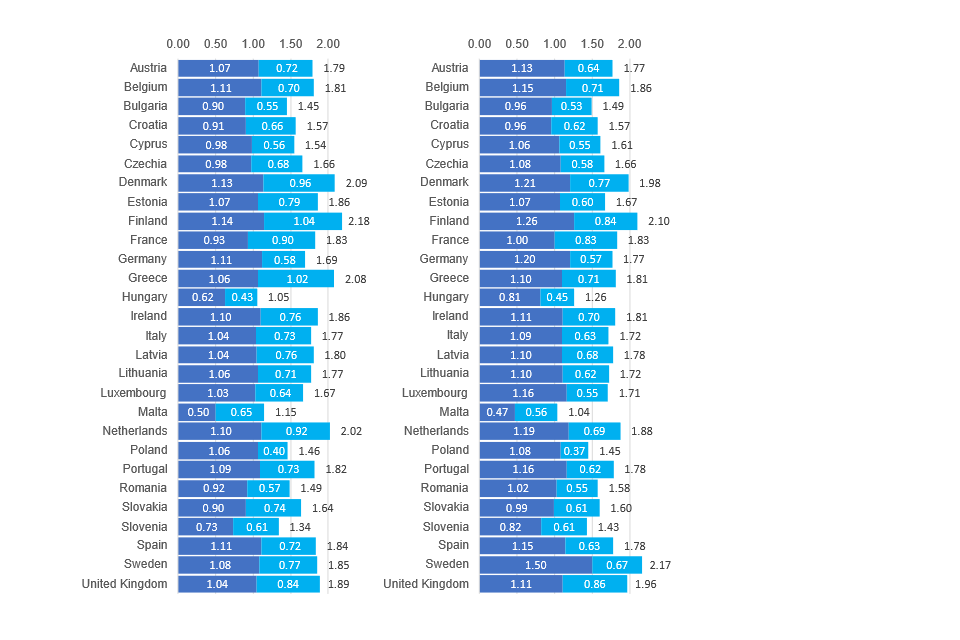
"
Two charts show the fuel prices on 20 June 2022 across member states of the European Union and the United Kingdom, decomposed into the per-litre fuel price, the tax, and the resulting total. The left-hand chart shows the values for petrol. The right-hand chart shows the values for diesel. For instance, in the United Kingdom, the price of petrol was £1.89 per litre, of which £1.04 was the fuel price and 84 pence was the tax.
Source: EU, Experian Catalist. CMA analysis. Prices at 20/06/22
Government actions around the world
We looked at a range of jurisdictions, focusing on those most comparable with the UK and including those identified by stakeholders. Governments have a range of tools they can use to influence the price of fuel, including duty cuts, and several around the world have taken action to address increased road fuel prices and the cost of living more generally (see Figure 23):
-
reducing fuel tax has been widespread (including as noted the UK’s fuel duty cut), for example, in the EU Germany (25p per litre), Netherlands Spain (both 17p per litre) and Ireland (14p per litre) and elsewhere round the world including, for example India (8p per litre)[footnote 104]. In the USA some states such as New York and Connecticut have temporarily removed local ‘gas taxes’ in their entirety;[footnote 105]
-
reductions to VAT or sales tax which in many countries are levied in addition to fuel duty; for example in Poland, VAT was reduced by 15 percentage points to 8%[footnote 106] and in India, several states have reduced their local sales tax;[footnote 107]
-
rebates to retailers have been used with a similar effect, whereby the government reimburses retailers for a price reduction, for example in France[footnote 108] (13p per litre) and Spain (17p per litre, of which 13p per litre is funded by oil companies);[footnote 109]
-
targeted direct support to certain groups including workers, for example, Austria has increased its ‘Commuter Allowance’[footnote 110] by 50% and has proposed £130 million of public transport support, Singapore (one-off £90 relief payment to taxi drivers),[footnote 111] Germany (a £8 monthly local/regional rail ticket)[footnote 112] and New Zealand (halving the price of public transport for 4 months);[footnote 113] and
-
restrictions on sales, for example in Sri Lanka, all non-essential sales of petrol were suspended for 2 weeks due to the cost of importing petrol and shortage of foreign exchange reserves.[footnote 114]
Actions taken by other competition authorities
Competition authorities have also responded, in a variety of manners to the current increase in petrol prices. These include:
- statements on anticompetitive behaviour: the US Federal Trade Commission announced it is redoubling its commitment on unfair competition,[footnote 115] and the Italian Autorità Garante della Concorrenza e del Mercato has issued requests for information to leading oil companies;[footnote 116] and
- announcing sector inquiries: the German Federal Cartel Office has announced an ‘ad hoc examination’ of the mineral oil sector, focused on the refinery and wholesale level,[footnote 117] and Austria has also opened a market inquiry looking at whether, leaving other current developments aside, the current prices are also due to a lack of, or restricted, competition.[footnote 118]
Ongoing monitoring and oversight
Some jurisdictions have institutions specifically established to monitor and promote lower fuel prices. For example:
- Germany established a Market Transparency Unit for Fuels in 2013 in the Federal Cartel Office to identify potential violations of cartel law and to share price data with private providers of consumer information;[footnote 119]
-
the Australian Competition and Consumer Commission (ACCC) has monitored road fuel prices since 2019 and published monitoring reports every 3 months.[footnote 120] The ACCC has also monitored the pass-through of a cut in fuel duty which it assessed over a 6-week period, alongside its ongoing monitoring across Australia’s major cities; and[footnote 121]
- the New Zealand Competition Commission (NZCC) conducted a market study in 2019 which identified competition problems in the wholesale market and led to the Fuel Industry Act which compelled companies to provide information to facilitate ongoing monitoring as well as provisions to reduce restrictive provisions in contracts.[footnote 122] The New Zealand Ministry of Business, Innovation and Employment monitors ‘importer margins’ and publishes on an ongoing basis a breakdown of the cost of road fuels.[footnote 123]
Figure 23 Selected government interventions around the world
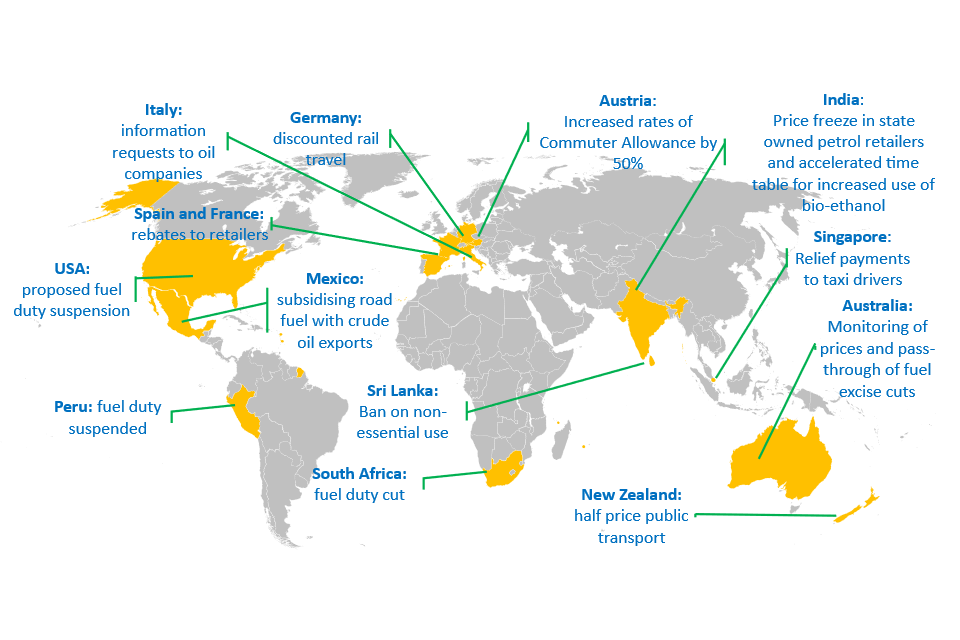
"
The infographic shows selected global government interventions in response to the fuel crisis. The USA have proposed a fuel duty suspension; Mexico are subsidising road fuel with crude oil exports; Peru have suspended fuel duty; Spain and France are offering rebates to suppliers; Italy have sent information requests to oil companies; Germany have discounted rail travel; Austria have increased rates of Commuter Allowance by 50%; South Africa have cut fuel duty; Sri Lanka have banned non-essential fuel use; India have frozen prices in state-owned petrol retailers and implemented an accelerated timetable for increased use of bio-ethanol; Singapore have offered relief payments to taxi drivers; Australia are monitoring prices and pass-through of fuel excise cuts; New Zealand are offering half price public transport.
Conclusions, advice and next steps
The commission from the Business Secretary asked the CMA to consider the health of competition in the retail fuel market; steps the UK Government or CMA could take to strengthen competition or to increase price transparency; and the extent to which the 5p cut to fuel duty was reflected in retail prices.
Overall, the market for the supply of retail fuel in the UK appears relatively competitive. There are local variations in the price of road fuel, including pricing disparities between urban and rural areas. These outcomes may reflect the fact that these sites supply lower fuel volumes and have higher transportation costs. They may also, to an extent, reflect weaker competition in some parts of the UK. Further work is required to assess how far weaknesses in competition might be driving higher retail prices in certain parts of the UK.
There have been concerns in recent weeks about retail prices not falling in response to declines in the wholesale price of fuel. The CMA is monitoring this closely. Overall, however, the retailer spread – the difference between wholesale and retail fuel prices – is a relatively small component (around 10p per litre) of the pump price (and only a fraction of this will reflect profits that could theoretically be reduced through stronger retail competition).[footnote 124]
Effective competition depends on consumers being able easily to compare prices. Consistent with the Business Secretary’s request, the CMA has provided advice on measures to further improve retail fuel price transparency (see below). In particular, an open data scheme for pump prices could strengthen retail competition and create new commercial opportunities for developers. However, given that retailer profits represent a relatively small share of the pump price, such measures are likely to have only a modest effect on prices.
In respect of the fuel duty cut, we found that supermarkets cut pump prices by just over 5p immediately following the change. In doing so, they likely incurred a cost because the fuel held in their tanks at the time of the announcement would have been paid for at the higher duty rate. Other retailers also cut their prices, albeit by a smaller amount. These price reductions occurred in a period of where – absent the duty cut – retail prices might otherwise have been expected to rise as a result of earlier increases in the crude oil price. We have seen no evidence – nor is it clear from our analysis – that retailers in aggregate have profited from failing to pass on the 5p fuel duty cut.
Alongside VAT and fuel duty, the bulk of the price paid by consumers at the pump is made up of crude oil prices and the refining spread (the gap between price of crude oil entering refineries and the price of petrol and diesel leaving them). These 2 factors have been the principal drivers of the significant increases in retail fuel prices over the last year, with the rise in crude oil prices being exacerbated in the UK by the depreciation of sterling. The commission did not specifically ask the CMA to consider competition in the “upstream” parts of the road fuel supply chain. However, given the significant impact of the refining spread in particular on the price of road fuels, we need to understand more about what is driving recent sharp increases.
With this in mind, and taking account of the significant impact of fuel price rises on consumers and businesses the CMA has decided to launch a market study into road fuel. In this study we will develop a more detailed understanding of how the fuel market is working, and consider any actions that may be available, and necessary, to improve outcomes for consumers. Our study will cover the upstream (wholesaling and refining) elements of the supply chain. It will also consider further specific concerns in the retail market that we have not been able to fully analyse within the time available to complete this review.
The remainder of this section provides further detail on the CMA’s advice to government on retail price transparency measures, and on the focus of its market study. The CMA stands ready to work with the government if it chooses to take price transparency measures forward.
Transparency
Open data
Effective competition relies on consumers being able to accurately compare the price and quality of products in a way that drives good decisions. Open data schemes can facilitate this process by collecting data and presenting information to consumers to help them make more informed choices, often through the use of intermediaries, such as third-party apps or websites. Fuel prices are already typically prominently displayed on PFSs and visible from the roadside, but consumers should not have to drive around to find cheaper fuel. There are currently a range of digital comparison tools which help consumers compare the price of fuel at their local PFSs. For instance:
-
the Consumer Council for Northern Ireland provides a Fuel Price Checker which enables consumers to compare fuel prices across Northern Ireland.[footnote 125] This tool discloses the highest, lowest and average petrol and diesel prices in each town in Northern Ireland and is updated on a weekly basis;
-
price comparison websites, such as Confused.com and GoCompare, and other specialised providers, such as petrolprices.com, allow consumers to identify their nearest PFS and compare petrol and diesel prices in their local area. Other services, such as emails with a weekly update of the cheapest local fuel suppliers, are also available; and
-
some route navigation apps and physical satnavs incorporate pricing data when displaying PFSs close to a route.
Many of these tools, and their providers, rely upon price data provided by Experian which supplies organisations with information and analysis on PFSs. Others obtain data through crowdsourcing. Using technology, such as UK Vehicle Data‘s Fuel Price API,[footnote 126] organisations can access Experian’s price data and combine it with other datasets to provide insights and advice to consumers.
These tools give consumers valuable information, helping them make a more informed choice about where they buy their fuel. However, access to the data these tools need can be costly, and we understand that there are some limitations in the coverage of the datasets that existing tools rely upon, including how frequently prices are updated.
As a result, we think there is value in developing more formalised and comprehensive schemes, which could provide commercial opportunities for innovative third-party apps and websites to offer consumers real-time comparisons of fuel prices. This, in turn, could encourage PFSs to compete more intensely to attract consumers that have greater visibility over prices in their local area.
Legislation has been adopted in other countries to improve consumers’ access to current fuel prices. In Germany, for instance, the Market Transparency Unit for Fuels enables consumer access to current fuel prices through third party apps and websites but does not have a public facing comparison tool.[footnote 127] Companies operating PFSs, or which have the power to set their prices, are required to report price changes for certain fuels in real time. This data is provided to over 50 authorised consumer information service providers, enabling consumers to find the cheapest fuel prices locally, via smartphone applications, in-car navigation systems and the internet. According to the German Federal Cartel Office, this scheme helps inform consumers about price fluctuations, including when and where cheaper fuel is usually available, and provides real life examples of the savings that consumers can make.[footnote 128]
Similar schemes exist elsewhere. In Austria, fuel retailers have to provide fuel price data within 30 minutes to E-control, the Austrian Energy Regulator, which makes prices available to consumers via a free internet tool as well as via an API.[footnote 129] The service experienced an 8-fold increase in usage in early March 2022 compared to the previous year.[footnote 130] In Queensland, Australia, all fuel retailers are required to report their fuel prices as part of the Queensland fuel price reporting scheme to help motorists identify the cheapest fuel prices. Initial reviews of this scheme suggest that the utilisation of these apps and websites has contributed towards consumer savings.[footnote 131]
An open data solution would also be aligned with what we understand to be the objectives of initiatives, such as Fair Fuel UK’s campaign,[footnote 132] to improve price transparency in the road fuel sector. By monitoring, collecting and reporting retail fuel prices, or sharing this data with approved third-party providers, organisations could provide helpful insights and advice to consumers.
Open data schemes already exist in other markets in the UK, helping consumers make more informed decisions. For instance, Transport for London has provided free, real-time open data to developers since 2009. Developers use these “feeds” to present customer travel information in innovative ways.[footnote 133],[footnote 134] To be fully effective, the administrator of any scheme would need powers to gather pricing data or compel retailers to provide the data with appropriate frequency or within a short period after amending prices.
This type of scheme would be unlikely to give rise to concerns regarding the disclosure of personal data. Whilst it is possible that the disclosure of this data could facilitate coordination between firms, we think this risk will generally be low as pricing information is already publicly available. An open data scheme would also provide consumers with simpler access to pricing data which is already available to retailers, thereby reducing information asymmetries.
Whilst implementing and maintaining an open data scheme for fuel prices at UK PFSs would introduce new costs, they may be justified given the size and significance of this market for UK consumers and the economy as a whole. As such, we recommend that the government considers introducing an open data scheme of this type.
As set out above, other countries have adopted different models to deliver this type of scheme, with varying levels of regulatory involvement. For example, the operation of the scheme could be outsourced to a fuel price aggregation services provider with responsibility for collecting fuel prices and providing third party websites and apps with access to this pricing data via APIs, as is currently the case in Australia. We note that the government’s plans to legislate to enable the development of Smart Data Schemes may provide a vehicle through which this scheme could be delivered.[footnote 135] The CMA has experience of open data schemes in other markets, and we stand ready to work with the government if it chooses to pursue this recommendation.
Motorway pricing
Particular concerns have also been raised regarding the higher price of road fuel on motorways. While these higher prices may reflect higher underlying costs, [footnote 136] with some consumers willing to pay more for the convenience of refuelling without leaving the motorway, it is important that consumers have access to the information they need to make good trade-offs between convenience and price.
There is evidence that a scheme of mandatory price posting of competing PFSs on large electronic signs introduced along the Italian highway system contributed, at least in part, to lower petrol prices at those stations.[footnote 137] However, a UK trial to display fuel prices from upcoming motorway services along a stretch of the M5 was run by National Highways (previously ‘Highways England’) in 2018 and was not found to have increased price competition and price transparency.[footnote 138]
The CMA has previously engaged with the Department for Transport (DfT) and National Highways to explore ways of improving fuel price transparency and competition on motorways. One option could involve the installation of signs displaying fuel prices of alternative PFSs, including those just off the motorway. However, the government would have to weigh up any potential benefits against other important public policy considerations, such as its impact on local road traffic volumes.
National Highways recently gave Moto permission to display new digital price signs on motorways.[footnote 139] We will engage again with DfT and National Highways about the status and scope for progressing this initiative.
Launch of CMA Market Study into road fuel
Our review has allowed us to develop an understanding of the drivers of recent price increases in the road fuel sector and the significant concerns raised by stakeholders. Given these concerns, and the high impact of fuel price rises on consumers and businesses, we have decided that we need to investigate these more deeply by launching a market study into the supply of road fuel in the UK. In this study we will develop a more detailed understanding of how the fuel market is working, and consider any actions that may be available, and necessary, to improve outcomes for consumers.
We will cover upstream (refining and wholesale) and retail segments of the market, focusing on the following areas:
-
in relation to refining, we have found that the refining spread has grown substantially and, alongside increases in the price of crude oil, this has been a major driver of the increases in pump prices. We will carry out further work to assess what has been driving elevated refining spreads, whether we expect these levels to persist and what, if anything, ought to be done to bring them back down;
-
at wholesale level, we have identified potential concerns in relation to a lack of transparency and the impact of long-term supply agreements between independent retailers and wholesalers. We have not been able to disaggregate the element of wholesaler margin, where applicable, and we need to know more about this. We will develop our understanding of the relationships between wholesalers and retailers and their impact on market outcomes; and
-
at retail level, we have found that the average retail margin remains small as a proportion of the overall price of fuel and has not been a driver of price increases in recent months. We have not identified obvious competition problems at this level, but there are some features of how the relevant markets works that could indicate that competition is not as intense as it could be. In particular we consider that it is important to probe more deeply into the following areas:
-
reasons for local variations in the price of road fuel, including pricing disparities between urban and rural areas and across the nations of the UK. We will consider whether such variations reflect underlying cost differentials;
-
the relationship between retail and wholesale prices, including how rises and falls in wholesale prices are reflected at the pump; and
-
whether there has been a softening of competition in the light of concerns that supermarkets have changed their pricing strategies, including after recent mergers.
More detail on our market study can be found in our Invitation to Comment which is on our case page. This document also gives details on how stakeholders can share evidence with us about areas we should investigate.
Alongside our market study we will continue to engage with the government in support of the recommendation for potential action now on price transparency. We will also continue to monitor the sector closely during our study and we will provide public updates as our work progresses.
The reduced volume of refining is driven both by decreased capacity as well as reduced throughput in some refineries, particularly in China.
-
Based on annual mileage of 9,000 miles and fuel economy of 41mpg. Figures based on analysis by Which?. ↩
-
Those living in rural villages, hamlets and isolated dwellings travel on average 2.5 miles by car for every 1 mile travelled by those living in urban conurbations (Department for Transport, National Travel Survey, Table NTS9904). ↩
-
Section 5 of the Enterprise Act 2002. ↩
-
These include crude oil extraction, refining, wholesaling, transportation and retailing. ↩
-
Figures are based on four-week averages of relevant data – specifically 4 weeks to 28 June 2021 vs 4 weeks to 27 June 2022. Source: CMA analysis of BEIS response to request for information. ↩
-
Source: CMA analysis of BEIS response to request for information. Figures are combined average weekly retailer spreads for petrol and diesel for the periods: 29 March to 27 June 2022 (“3 months after the duty cut”) and 29 June 2021 to 3 January 2022 (“last six months of 2021”). ↩
-
Since the retailer spread is the difference between pump prices and wholesale prices paid on fuel leaving refineries and import terminals, it also includes the profits of any businesses (i.e., wholesalers) operating between the refinery and the retail levels of the supply chain. ↩
-
Some supermarkets stated in their response to our request for information that their price reductions also reflected the fact that VAT fell by 1p per litre as a result of the duty cut. ↩
-
https://www.gov.uk/government/publications/fuel-prices-letter-to-retailers ↩
-
This reduced the fuel duty charged on a litre of road fuel from 57.95p to 52.95p. ↩
-
For example, the UK Petrol Retailers Association https://www.ukpra.co.uk/en/bulletins/147 ↩
-
https://www.independent.co.uk/news/uk/home-news/petrol-fuel-proft-energy-crisis-b2080860.html https://www.thetimes.co.uk/article/petrol-firm-profiteers-fail-to-pass-on-duty-cut-r3s68vhhf ↩
-
https://www.gov.uk/government/news/international-agencies-put-supply-chains-on-notice-against-collusion ↩
-
https://www.gov.uk/government/statistics/weekly-road-fuel-prices ↩
-
The protocol is part of the National Emergency Plan for Fuel (NEP-F) https://www.gov.uk/government/publications/energy-emergency-plans-priority-fuel-allocation) and when activated, the protocol temporarily exempts industry from the Competition Act 1998 for the purpose of optimising supply in the event of a disruption and allows for information sharing, joint planning and co-ordinated supply action. The signatories to the protocol are the Business Secretary and industry parties, which include relevant industry associations and companies with a significant national role in fuel supply, distribution and retailing. ↩
-
https://www.independent.co.uk/business/drivers-warned-supermarket-fuel-giants-have-lost-appetite-to-cut-prices-b2113778.html ↩
-
Referenced in https://www.standard.co.uk/news/uk/opinium-competition-and-markets-authority-vat-rac-b1008023.html ↩
-
These are businesses which invoice and recover debts on behalf of retailers. ↩
-
https://www.theguardian.com/money/2022/jun/11/forecourts-attempted-fuel-thefts-petrol-prices-soar ↩
-
The PRA also notes that some users of fuel cards, used by customers buying fuel for business, may be taken unawares of the interaction of limits of spend on their card and the increased cost of fuel, such that only part of a transaction is covered by the fuel card. ↩
-
https://www.theguardian.com/business/2022/jun/29/fuel-thefts-up-61-as-uk-petrol-pump-prices-keep-climbing ↩
-
s7. Enterprise Act 2002. ↩
-
Data on wholesale prices is supplied to BEIS by Argus. Specified wholesale price data has been shared by BEIS with the CMA with Argus’ consent. ↩
-
Provisional figures based on BEIS (2022), Supply and use of petroleum products, Table 3.4. ↩
-
Ibid. ↩
-
For example, the Transport Exchange Group transport price index indicates that haulier vehicle transport costs were 20% higher in May 2022 than at the start of 2021. ↩
-
See, for instance, Union News, Win! Tanker drivers secure 27% pay rise, 5 May 2022. ↩
-
One retailer stated that, on a pence per litre basis, transport costs had risen by 17.5% since 2019. Another cited a report of a deal reached by Unite the union for a 27% pay increase for certain fuel tanker drivers employed by XPO. ↩
-
Spikes can also go in the opposite direction, in some cases producing a negative spread. ↩
-
Source: CMA analysis of BEIS response to request for information. Figures are combined average weekly retailer spreads for petrol and diesel for the periods: 29 March to 27 June 2022; 21 December 2021 to 21 March 2022; and 29 June 2021 to 3 January 2022. ↩
-
It is possible that retailers have recently been able to take a higher level of profit from a given spread than they have in the past: for example, because their costs have fallen. More work would be required to assess whether this is the case. However, retailers responding to our request for information stated that their costs had increased (see 1. The road fuel supply chain). ↩
-
Formally, the contribution of VAT to the pump price is (1-1/(1+t)), where ‘t’ is the rate of VAT. ↩
-
Based on comparison of average weekly petrol and diesel prices in the 7 days to 4 April 2022 with the 7 days to 27 June 2022. ↩
-
https://www.reuters.com/markets/commodities/why-is-there-worldwide-oil-refining-crunch-2022-06-22/ ↩
-
Analysis based on data from https://www.gov.uk/government/statistics/oil-and-oil-products-section-3-energy-trends. ↩
-
Refined Petroleum, OEC - The Observatory of Economic Complexity. ↩
-
Refined oil imports from Russia constituted 18% of total imports of refined oil into the UK in 2020 (OEC): https://oec.world/en/profile/bilateral-product/refined-petroleum/reporter/gbr. ↩
-
Oi lMarket Report page 22. ↩
-
House of Commons Library, Imports of energy from Russia, Research Briefing 9523, 14 June 2022. ↩
-
https://www.statista.com/statistics/271622/countries-with-the-highest-oil-consumption-in-2012/ ↩
-
US energy information administration (https://www.eia.gov/todayinenergy/detail.php?id=52718) ↩
-
https://seekingalpha.com/news/3840141-jp-morgan-forecasts-higher-for-longer-refining-margins ↩
-
This comes from past CMA work, which includes mergers inquiries such as CD&R/Morrisons (2022), Bellis/Asda (2021), Sainsbury’s/Asda (2019), MFG/MRH (2018), MRH/Esso (2015), MFL/Shell (2015), MFG/Murco (2014) and Shell/Rontec (2012) and work by the Office of Fair Trading (OFT) where relevant – i.e., the OFT 2013 report into the UK petrol and diesel sector. ↩
-
The former is usually known as ‘company owned, company operated’, or ‘COCO’ while the latter is usually known as ‘company owned, dealer operated’, or ‘CODO’. ↩
-
These are usually referred to as ‘dealer owned, dealer operated’ (DODO). Independently owned PFSs are usually supplied under an agreement with an oil company whose name appears on the brand sign but also include unbranded PFSs with no oil company identification. This means that when the PFS is branded ‘Shell’ for instance, it is not necessarily operated by it. ↩
-
The definition of company and dealer used by the Petrol Retailers Association (PRA) in this analysis does not correspond precisely to the definition of oil-company and independents used in the Experian database underlying our analysis presented in this report, but we do not expect these differences to be substantial enough to affect the results of our analysis. ↩
-
We engaged with a range of stakeholders, including (but not limited to) motoring groups, trade associations, road fuel retailers and suppliers. ↩
-
We note that the CMA has reviewed a number of mergers involving fuel retailers in the past few years. Notably, since 2020 2 mergers were completed (Bellis/Asda and CD&R/Morrisons) involving collectively a total of between 1500-2000 sites. These mergers have not materially increased the levels of concentration in the market. ↩
-
Some stakeholders have suggested that there has been a relatively small increase in PFSs owned by supermarkets and an overall reduction in PFSs owned by oil companies. ↩
-
Platts is one of a small number of price reporting agencies which provides estimates of prices for crude oil and refined fuel. There are other price reporting agencies, such as Argus. ↩
-
See OFT (2013) – UK petrol and diesel sector call for information (PDF, 1.59MB), Fuel retailing. ↩
-
As part of this review, we have heard that a range of costs may have increased from January 2022, including fuel distribution costs, wages, and utilities. We note that some of these may contribute to both the costs borne by the retailers and those borne by the wholesalers. ↩
-
See OFT (2013) – UK petrol and diesel sector call for information (PDF, 1.59MB), paragraphs 5.4-5.6. This was consistent with views from third parties in Sainsbury’s/Asda. See Sainsbury’s/Asda final report, paragraph 14.38. ↩
-
This was confirmed by stakeholders we have engaged with as part of this review, according to which supermarkets face prices based on up to a 3 weekly average lagged basis while prices paid by oil company PFSs may be based on weekly average lagged (i.e., last week’s average price) and independents on a daily lag, meaning that the wholesale price calculated by their wholesaler applies to deliveries of fuel the next day. ↩
-
Further, we have heard from stakeholders that stocking capability and turnover may affect retailers’ frequency of purchase of fuel and that, given they are liable for duty from the point of purchase, the need to sell existing stock (possibly purchased at a different price) might mean that any new price for replacement fuel takes time to filter down to retail prices. ↩
-
As set out in the CMA’s merger control decision in CD&R/Morrisons, available at CD&R / Morrisons - GOV.UK (www.gov.uk). The figures in the table are based on the merger parties’ actual and expected volumes. Total market volume estimates are calculated as the sum of competitor volumes from Experian Catalist and the merger parties’ own volumes. ↩
-
To ‘sense check’ this assessment, we have also computed the Herfindahl–Hirschman Index (HHI) – a common measure of market concentration – based on the national shares of supply obtained in the context of this merger. The data included shares for the largest 10 suppliers. We did not have the exact split for providers aggregated into ‘Others’ but for the purpose of the calculation we assumed that none of these providers accounted individually for a share above 5%. Based on this, we obtained an HHI value below 1000, consistent with a low level of concentration as set out in our Guidelines for market investigations (PDF, 1.10MB). ↩
-
https://comcom.govt.nz/__data/assets/image/0028/259057/Fuel-regulation-summary.jpg ↩
-
See CD&R/Morrisons, paragraph 55; Bellis/Asda, paragraphs 16-20; Sainsbury’s/Asda, paragraphs 82-85; MRH/Esso, paragraph 28; MFG/Murco, paragraph 35 and 56; MFL/Shell, paragraph 25. ↩
-
For instance, they submitted that Asda may announce a ‘national’ price ceiling or cap following reductions in wholesale fuel costs after which Asda will not price above the cap at any local PFS for at least a week. They further submitted that supermarkets operate under their own brand and therefore want to have a degree of commonality of pricing nationally to strengthen brand loyalty. See Bellis/Asda, paragraphs 68-71. ↩
-
For example, some third parties told the CMA that certain metrics of their price offering (eg the price or the target margin) are determined nationally. See MFG/MRH, paragraph 61. ↩
-
This is consistent with evidence in Bellis/Asda and Sainsbury’s/Asda. For instance, in Bellis/Asda the merger parties told us that fuel is a relatively homogeneous non-differentiated product with location being the primary driver of customer choice and, without any element of differentiation in the PFS offering, consumers would simply choose the cheapest site. See Bellis/Asda, paragraph 102. See also Sainsbury’s/Asda, paragraphs 14.32-14.34 and 14.48. Further, in response to the survey conducted in Sainsbury’s/Asda, price was mentioned as a reason for the choice of PFS by 48% of Sainsbury’s customers and 71% of Asda customers and location by 61% of Sainsbury’s customers and 60% of Asda customers. See Sainsbury’s/Asda, paragraph 14.95(c) and (d). ↩
-
This is consistent with findings from past CMA work. For instance, in CD&R/Morrisons the merger parties’ internal pricing strategies indicated that they set prices at a local level and with reference to local rivals. Similarly, in MFG/MRH (2018) the merger parties explained that, as is common in the industry, they take into account competitors’ prices in a local area when setting theirs. See CD&R/Morrisons, paragraph 55 and MFG/MRH, paragraph 49. ↩
-
For instance, in Sainsbury’s/Asda, the CMA found that supermarket PFSs have lower fuel prices than non-supermarket PFSs. Similarly, the merging parties’ submissions in CD&R/Morrisons confirmed that each Morrisons PFS will price match the cheapest competitor within a given area. See Sainsbury’s/Asda, paragraph 14.30(d) and CD&R/Morrisons, paragraph 70(a). This strategy by supermarkets was also mentioned in the 2013 OFT report, according to which supermarket PFSs price lower compared to non-supermarket ones to drive footfall into their grocery stores and monitor the prices that rivals charge within a defined radius with the aim to be the cheapest or at least match the lowest price. ↩
-
Sainsbury’s/Asda, paragraphs 14.30-14.49. ↩
-
See Bellis/Asda, paragraphs 136-140. Further, the 2013 OFT report identified the so-called ‘Asda town’ phenomenon where the presence of an Asda PFS reduced prices within a local area. In particular, the OFT’s econometric analysis indicated that the presence of at least 1 Asda PFS in a local market was associated with pump prices that were 0.7p per litre lower for diesel and 0.8p per litre for petrol, with the scale of this effect being much greater than those associated with any other retailer. See OFT (2013) – UK petrol and diesel sector call for information, paragraphs 4.11-4.13. ↩
-
See Bellis/Asda, paragraphs 141-143. See also Moto Hospitality / First Motorway Services, paragraph 24 and Shell/Rontec, paragraph 78. ↩
-
The analysis found that the relationship was non-linear, in that the addition of a competitor had a larger impact on price in more concentrated areas than in areas where there are already many competitors. ↩
-
Analysis on Sainsbury’s/Asda considered the impact of local competition on fuel prices at Sainsbury’s and Asda’s PFSs by focussing on a given ‘centroid PFS’ (i.e., a PFS taken as a starting point to define a catchment area) and looking at how the presence of competitors in the same area impacted its prices. Catchment areas are a pragmatic approach to identifying the most significant competitive alternatives available to customers of merger firms at a local level. ↩
-
Appendix K to Sainsbury’s/Asda, paragraphs 11-13. ↩
-
For example, controlling for other factors, rural forecourts tended to have on average higher prices than those located in residential or commercial areas; the East Midlands, the North, the North-West, Scotland and Yorkshire and Humber had the lowest prices, while London and the rest of the South-East had the highest. See Annexe D to OFT (2013) – UK petrol and diesel sector call for information, paragraph D.4. Similarly, past CMA cases have distinguished between urban and rural areas, with larger catchment areas applied for rural PFSs. See MRH/Esso, paragraph 28; MFG/Murco, paragraph 35 and 56; MFL/Shell, paragraph 25. ↩
-
See Cost pass-through: theory, measurement, and potential policy implications; OFT (2013) – UK petrol and diesel sector call for information; Shell/Rontec; MFG/MRH. ↩
-
Based on a report dated February 2014 and commissioned by the OFT to RBB Economics, summarising the economic theory around cost pass-through and setting out the potential policy implications. ↩
-
That is, the price elasticities of demand and supply. ↩
-
Our discussion of pass-through is framed in terms of absolute pass-through, meaning the degree to which a given absolute change in cost causes an absolute change in price. For example, a £1 increase in cost that leads to a £1 increase in the product price has an absolute pass-through rate of 1 (or 100%). ↩
-
The curvature of the demand, meaning the rate at which the responsiveness of demand to price-changes varies as price or output changes, may also impact the level of pass-through. ↩
-
This is consistent with academic papers which found that pass-through increases in markets with more competitors and that the speed of price adjustment is about 60% higher in more competitive markets. See Competition and Pass-Through: Evidence from Isolated Markets. According to the 2014 report commissioned by the OFT to RBB Economics, this result holds provided that the demand curve is not too convex. See Cost pass-through: theory, measurement, and potential policy implications, pages 18-19 and 27. ↩
-
The report found that pass-through between wholesale and retail price is typically high while a given percentage change in upstream costs appears to cause a relatively small percentage change in wholesale prices. See Cost pass-through: theory, measurement, and potential policy implications, page 28. ↩
-
An example of this would be a company active both at the wholesale and the retail level. ↩
-
See Cost pass-through: theory, measurement, and potential policy implications, pages 28, 160-164. ↩
-
See OFT (2013) – UK petrol and diesel sector call for information, paragraphs 6.28-6.32. ↩
-
We have heard that prices paid by oil company sites may be based on weekly average lagged (i.e., last week’s average price) and independents on a daily lag, meaning that the wholesale price calculated by their wholesaler applies to deliveries of fuel the next day. Further, we have also heard that stock turnover affects when deliveries of new fuel are negotiated, which means that a new price for replacement fuel may take time to filter down, taking longer in sites selling lower volumes. ↩
-
For instance, a 2022 paper looking at French gasoline prices found that a 1% change in the wholesale price translated into a 0.8% change in retail price, in line with the share of the wholesale gasoline in total costs. It also found that the adjustment was gradual with the full pass-through taking about 3 weeks. See How do Gasoline Prices Respond to a Cost Shock? ↩
-
For instance, a 2021 paper looking at pass-through of excise duties in isolated oligopolistic markets found that pass-through increased substantially with the number of competitors and the speed of price adjustment was higher in more competitive markets. See Competition and Pass-Through: Evidence from Isolated Markets; a 2020 paper looking at a temporary value-added tax (VAT) reduction to fuel in Germany estimated that pass-through was fast and substantial (although remained incomplete) and found different pass-through for different fuel types, consistent with higher pass-through for customer groups who are more likely to shop around. See Are temporary value-added tax reductions passed on to consumers? Evidence from Germany’s stimulus. ↩
-
For instance, see a 2011 paper focussing on pass-through rate of state gasoline and diesel taxes to retail prices in the US found that these were on average fully and immediately passed on to consumers and that in periods when the supply chain was constrained pass-through declined. See Fuel Tax Incidence and Supply Conditions. ↩
-
Shell/Rontec (PDF, 244KB), paragraphs 96-97. ↩
-
MFG/MRH (PDF, 425KB), paragraph 132. ↩
-
Spring Statement 2022: Fuel Duty Factsheet, GOV.UK (www.gov.uk) ↩
-
That is a 1p reduction in the amount of VAT charged at 20% on 5p of fuel duty. ↩
-
Based on CMA analysis of Argus wholesale price data. ↩
-
As the Experian price data is averaged across all sites without weighting by volume, prices of smaller independents may also have a disproportionate effect on the overall average. ↩
-
We note the observed 5p per litre drop in supermarket prices in Experian data is lower than the what the supermarkets told us, as they submitted that they reduced prices by around 6p per litre (to reflect the VAT reduction). As we use daily price data from Experian which collects information from purchases with fuel cards, and some PFS implemented the price reduction very quickly after the 6pm announcement, the price recorded on 23rd March may already include some lower priced observations in the evening of the 23 March. ↩
-
The model’s predictions were an increase in price by 3.6p per litre and 3.5p per litre for petrol and diesel respectively. ↩
-
We focus here on EU members states due to their geographic proximity to the UK and that comparisons between many member states are not affected by exchange rate movements due to use of the Euro. ↩
-
VAT is charged as a percentage of the value of goods and services and ranges between 17% in Luxembourg and 27% in Hungary. Fuel duty is typically set at a fixed cost per unit of fuel (eg €0.XX per litre). Both VAT and Fuel duty must be set above a minimum level according to the relevant directive. A full list of duty and VAT rates is published by the EC https://ec.europa.eu/taxation_customs/system/files/2021-09/excise_duties-part_ii_energy_products_en.pdf (PDF, 2.65MB). ↩
-
The median is the middle number in a set of values when those values are arranged from smallest to largest. ↩
-
Excise Duty on Petrol: Centre cuts excise duty by Rs 8 on petrol, Rs 6 on diesel to tame inflation, India Business News - Times of India (indiatimes.com) ↩
-
https://www.whitehouse.gov/briefing-room/statements-releases/2022/06/22/fact-sheet-president-biden-calls-for-a-three-month-federal-gas-tax-holiday/ ↩
-
https://www.gov.pl/web/primeminister/we-are-doing-all-we-can-to-keep-prices-lower-and-fight-raging-inflation-says-polish-prime-minister#:~:text=Starting%20from%201%20January%202022,to%20virtually%20every%20Polish%20citizen. ↩
-
https://timesofindia.indiatimes.com/business/india-business/these-states-have-reduced-vat-on-fuel-after-centres-excise-duty-cut/articleshow/91726764.cms ↩
-
France Plans $2.2 Billion Fuel Rebate in Bid to Help Motorists, Bloomberg ↩
-
Spain to approve 16 billion euros in aid to offset soaring energy costs, Reuters ↩
-
Under the Austrian tax system an allowance for commuting costs is granted as a tax credit, determined on distance travelled and whether use of public transport is a viable mode of transport. https://www.oesterreich.gv.at/en/themen/steuern_und_finanzen/pendlerpauschale_und_kilometergeld.html ↩
-
New $1.5 billion package to help vulnerable, businesses fight inflation, DPM Lawrence Wong, CNA (channelnewsasia.com); MOF, Press Releases ↩
-
New Zealand reduces fuel excise duty as petrol prices soar, Reuters ↩
-
Protecting Americans at the gas pump through aggressive antitrust enforcement, Federal Trade Commission (ftc.gov) ↩
-
Bundeskartellamt, Press releases, Annual report of the Market Transparency Unit for Fuels Bundeskartellamt launches ad-hoc examination of the mineral oil sector ↩
-
AFCA conducting market inquiry into Austrian fuel market: BWB Bundeswettbewerbsbehörde ↩
-
https://www.accc.gov.au/regulated-infrastructure/fuel/accc-role-in-fuel-monitoring ↩
-
https://www.accc.gov.au/consumers/petrol-diesel-lpg/monitoring-fuel-prices-following-the-excise-cut ↩
-
https://comcom.govt.nz/consumers/dealing-with-typical-situations/petrol-pricing ↩
-
The ‘importer margin’ is the gross margin available to fuel retailers to cover domestic transportation, distribution and retailing costs in New Zealand, as well as profit margins https://www.mbie.govt.nz/building-and-energy/energy-and-natural-resources/energy-statistics-and-modelling/energy-statistics/weekly-fuel-price-monitoring/ ↩
-
This is because the retailer spread also includes costs paid by retailers to run forecourts, the costs of inland transportation of road fuel, and any margins taken by independent wholesalers (where present). ↩
-
UK Vehicle Data - Daily Fuel Prices & Petrol Prices API. An API or “Application Programme Interface” facilitates the sharing of data between computer systems including from a source database to an app or website. ↩
-
Markttransparenzstelle für Kraftstoffe (MTS-K) (PDF, 42MB) ↩
-
Abbildung 1 (Figure 1) https://www.e-control.at/documents/1785851/1811582/Bericht_BMDW_Q1_2022_v01.pdf/a5431690-66e2-d7b3-5c8d-f0c50dffec17?t=1656322949057 (PDF, 3.93KB) ↩
-
Fuel price reporting, Department of Energy and Public Works (epw.qld.gov.au) ↩
-
For example, PumpWatch (fairfueluk.com) ↩
-
As part of its Retail Banking Market Investigation, the CMA also mandated the delivery of an open and common banking standard to allow, amongst other things, the release of reference information via Open Data APIs, to include all branch and business centre locations, opening times and all ATM locations. ↩
-
Data: a new direction - government response to consultation - GOV.UK (www.gov.uk) ↩
-
In 2018 the CMA wrote to the then Secretary of State for Transport, Chris Grayling MP. We noted research suggesting that higher prices are, at least in part, driven by higher costs associated with building and operating these PFSs, see: Motorway service area fuel prices. ↩
-
Price Transparency and Retail Prices: Evidence from Fuel Price Signs in the Italian Highway System ↩
-
Motorway fuel price sign trials failed to work PetrolPrices ↩
-
Highways Magazine, New fuel price signs cleared for roll-out ↩