The section 60 stop and search pilot: statistical analysis and review of authorisations
Published 19 June 2023

© Crown copyright 2023
This publication is licensed under the terms of the Open Government Licence v3.0 except where otherwise stated. To view this licence, visit nationalarchives.gov.uk/doc/open-government-licence/version/3 or write to the Information Policy Team, The National Archives, Kew, London TW9 4DU, or email: psi@nationalarchives.gov.uk.
Where we have identified any third party copyright information you will need to obtain permission from the copyright holders concerned.
This publication is available at https://www.gov.uk/government/publications/research-into-the-section-60-stop-and-search-pilot/the-section-60-stop-and-search-pilot-statistical-analysis-and-review-of-authorisations
Authors: Michelle Diver, Laura Dewar, Victoria Smith, Jodie Hargreaves, Rob Fulton, James Haslam and Andy Feist
Acknowledgements
We are very grateful to a number of colleagues for their support in reviewing, quality assuring, and drafting this report. Thanks go to Oscar Hinze, Patrick Allen, Alex Hicks, Ruby Forshaw, Meghan Marshman, Steve Almond, Emily Fellingham and Megan Perry. Particular thanks go to Daniel Farrugia who was key in the organisation and delivery of our data collection programme.
We would like to thank the police forces which made this project possible by providing the data and responding to our queries.
We would also like to thank our independent academic peer reviewer and members of the Steering Group for their help and advice during the course of the work.
Executive summary
Background
Section 60 (s60) stop and search powers give the police the power to stop and search persons and/or vehicles without reasonable suspicion when violence is anticipated. To enable the police to respond more effectively to serious violence, in March 2019 it was announced that 2 amendments to the Best Use of Stop and Search Scheme (BUSSS) would be piloted in 7 forces in England and Wales.[footnote 1] These forces are referred to as the ‘original’ forces. The amendments reduced:
-
the level of authorisation needed to impose a s60 stop and search, from chief officer to inspector level or above
-
the degree of certainty needed for an authorising officer to impose a s60 from believing an incident involving serious violence ‘will’ occur, to ‘may’ occur
In August 2019 this pilot was extended to all 43 police forces and the British Transport Police. The remaining forces that joined in August are referred to as the ‘later’ forces. All conditions placed by BUSSS on stop and search powers were relaxed meaning that in addition to the 2 existing amendments:
- inspector authorisations could now last a full 24 hours (as opposed to 15 hours)
-
superintendents could now extend an authorisation beyond 24 hours to 48 hours (BUSSS required this to be done at chief officer level, and limited extensions to a total of 39 hours)
- s60s do not need to be communicated publicly in advance
For all of these amendments it remained an operational decision for each police force as to how they were implemented.
This report focuses on a range of data on the operation of s60 during the pilot period[footnote 2] when conditions around authorisations were relaxed. The analysis is designed to complement the linked qualitative study (Smith et al., 2023) based on interviews with officers and community scrutiny leads to gain their views of the relaxations introduced as part of the pilot.
Aims
The main aims of the analysis were:
-
to describe the nature and pattern of s60 authorisations undertaken during the year ending March 2020 across England and Wales, and observe any trends over recent years
-
for a subset of forces, to examine in more depth any changes in authorisations between the year ending March 2019 and the year ending March 2020, including the rank of authorising officer, length of authorisation and geographical coverage
-
to improve understanding of how s60s were communicated to the public via social media, how often this was done and, if so, whether this was before, during or after the authorisation was put in place
-
to identify and describe what types of incidents typically precede a s60 authorisation and better understand what factors are considered in s60 authorisation decisions
The analysis draws on 3 main sources of data. A bespoke data collection covering all 43 forces and the British Transport Police (BTP) during the first year of the pilot (ending March 2020). Additional data were gathered for 6 pilot forces[footnote 3] covering both the years ending March 2019 and March 2020. This included information on the areas covered by authorisations and the use of Twitter to publicise them. Finally, 143 authorisation forms from 5 forces were subject to more detailed review.
Key points/findings
Statistical overview
Although it is not a pure comparison – because of the additional forces that joined the pilot in August 2019 – comparing the pilot period with the full previous year shows a 29% increase in the number of s60 searches. There were 17,267 s60 stop and searches undertaken during the pilot period.
Looking solely at the 7 ‘original’ forces allows a true year-on-year comparison and shows a 9% increase in s60 searches across the 2 years. Most forces increased their use of s60 – with West Yorkshire and South Wales increasing from zero searches in the year ending March 2019. However, West Midlands reduced their s60 volumes during the pilot.
It is not possible to assess the extent to which the relaxations may have directly or indirectly contributed to the increase in s60s during the pilot. The pilot was rolled out in a way that made it difficult to explore any discrete pilot effect on search volumes. The pilot also overlapped with another initiative that might be expected to contribute to an increase in the use of s60s. As part of the drive to combat serious violence, the Treasury agreed to allocate £100m of additional funding in the financial year 2019 to 2020 to the 18 police forces with the highest share of knife injury admissions to hospital.
These 18 forces accounted for 86% of the total increase in s60 stop and searches between the year ending 2019 and the year ending March 2020 (4,008 of an additional 4,666 searches). Despite this, force-level changes in s60 searches in the year ending March 2020 amongst the ‘18’ are far from uniform. The combination of the pilot relaxations and funding enhancements in the year ending March 2020, on top of forces’ variable use of s60, make assessing the impact of relaxations alone on s60 volumes very challenging.
Most pilot authorisations were put in place following an incident, or a previous act of serious violence. In total, 611 of the 805 authorisations (76%) mentioned some previous incident. Of these, 413 were coded as solely following an incident or incidents, while a further 198 also mentioned intelligence or an event. Authorisations linked to events alone were rare (84 were linked in some way to an event).
The vast majority of s60 searches conducted during the pilot period (91%) resulted in ‘no further action’. Of the 1,471 searches that resulted in an arrest or criminal justice outcome, 46% resulted in an arrest and 34% in a community resolution. The arrest rate for all s60 searches conducted in the pilot period was 3.9% (4.7% in the year ending March 2019).
In the pilot period, and excluding cases where the ethnicity was not known, 41% of searches were of people who either self-identified as White or, in the Metropolitan Police Service (MPS) where self-defined ethnicity was not stated, the officer recorded the person’s ethnic appearance as White. A similar proportion (40%) of searches were conducted on those who either self-identified as Black, or the officer recorded their ethnic appearance as Black. This was followed by the Asian group (12% of searches), the Chinese and Other ethnic group (4% of searches), and the Mixed group (3% of searches).
Authorising officer rank
Almost all the police forces that used s60s responded to the April rank relaxation by moving to lower ranks authorising s60s in most cases. For those authorisations where the rank of the authorising officer was known, 85% were initially authorised by an inspector. Just 5% were authorised by a chief officer (assistant chief constable or above), the majority of these being in the West Midlands.[footnote 4] Eight forces continued to have one or more s60s authorised by a chief officer during the pilot period.
Duration of the initial authorisation and extensions
The August relaxations increased the maximum length of initial duration from 15 to 24 hours. Overall, 83% of initial authorisations were for 15 hours or less from August 2019 to March 2020.
The qualitative analysis found that officers in the 7 ‘original’ forces – the biggest users of s60s – were less aware of the ‘August’ relaxations on duration and communications, than the original ‘April’ changes. The data confirm that the ‘original’ forces rarely made use of the permitted increase in durations. Whilst only 3% of the ‘original’ forces’ authorisations were 16 to 24 hours in length, more than half (52%) of the ‘later’ forces’ authorisations were this long.
The relaxations permitted superintendents to extend an authorisation beyond 24 hours to 48 hours. However, extensions were found to be rare, both before and during the pilot. In the 8 months post-relaxation from August 2019 to March 2020, a total of 10 extensions were identified, equivalent to 2% of authorisations. The majority of these extensions were for 9 hours. In the comparison period only 3 extensions were given.
Communicating s60s using Twitter
Under the ‘August’ relaxations it was no longer required for s60 authorisations to be publicly communicated in advance. Twitter data were chosen to examine public communication; based on discussions with police forces it was felt to be one of the most commonly used forms of social media for sharing information on authorisations. However, Twitter is just one of a number of channels that forces can use to communicate with the public, therefore not all communications of s60 authorisations will have been captured.
During the August pilot period the proportion of authorisations with identified tweets ranged from 15% to 85% for the 6 forces. All but one force, and all the high-volume forces, tweeted at least half of their authorisations. For all 6 forces combined, over half (54%) of the authorisations were tweeted in the August pilot period. The corresponding figure for the August comparison period was 53%. It is not possible to infer a causal relationship between the relaxations and the proportion of authorisations tweeted.
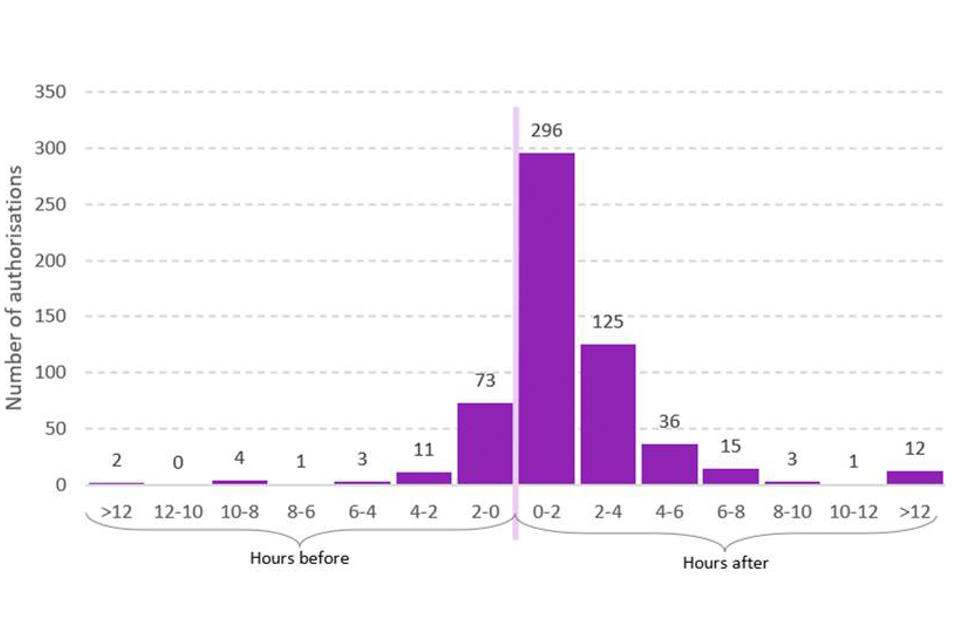
The Twitter data include time stamps, which allow the precise timing of the tweet to be established. For those authorisations that were tweeted, the vast majority were communicated during (75%) or before (23%) the authorisation period. Very few were tweeted about after the authorisation period had concluded. Details of authorisations were most commonly tweeted within the first 2 hours of the authorisation.
Authorisations and searches
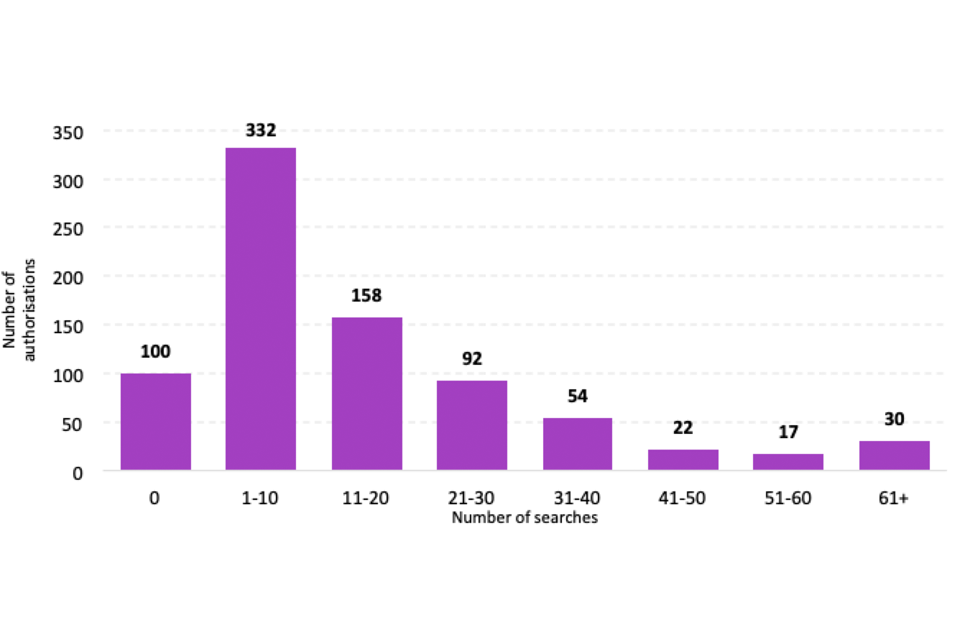
The 805 authorisations in the pilot period resulted in 17,070 searches[footnote 5] (this figure excludes Lancashire, who could not provide information on authorisations), with a mean of 21 searches per authorisation. Around 1 in 10 authorisations during the pilot period involved no stop and searches, while a further 61% involved 20 searches or less. A small number of authorisations involved in excess of 60 searches (4%).
S60s authorised by chief officers had more searches per authorisation (96 searches) than all other ranks. Those authorised by chief superintendents had the fewest searches per authorisation (8 searches) while inspectors, who were responsible for the majority of s60s, had 15 searches per authorisation on average.
When searches by authorisation were examined in relation to search outcomes, authorisations with fewer searches had a higher rate of searches resulting in an arrest or criminal justice outcome. Authorisations with between 1 and 10 searches had a success rate of 13%, compared with 7% for authorisations with between 51 and 60 searches.
The most common time of day for authorisations to be initiated was between 2pm and 5pm. Given that most lasted for less than 15 hours this meant that authorisations were in force overnight and expired early the following morning.
The geography of authorisations
The geographical coverage of authorisations was examined for 5 police forces.[footnote 6] Of just over 1,000 authorisations analysed, the typical area covered was 15km2, slightly bigger than the area covered by Heathrow Airport. The largest authorisation covered the City of Birmingham (over 270km2); 1% of authorisations were less than 0.3km2.
The median size of the MPS authorisation areas decreased between the comparison and pilot periods, from 19.1km2 to 16.0km2. This represents a statistically significant difference in the distribution of the size of authorisation areas in the year ending March 2019 and the year ending March 2020.
MPS analysis shows a high concentration of s60s in a small number of London boroughs. In the year ending March 2019, 1 borough had in excess of 126 authorisations using this measure. By contrast, there were 13 boroughs with fewer than 25 authorisations. In the year ending March 2020 the pattern shifted slightly and the number of high s60 authorisation boroughs increased with 4 boroughs having in excess of 126 authorisations.
Analysis on the relationship between locations of s60 authorisation boundaries and hospital admissions for ‘assault with a sharp object’ in London showed some correlation between sharp object assault admissions and s60 authorisations by local authority area. This shows that, to some degree, s60 authorisations are more common in boroughs where there are high knife crime admissions.
S60 ‘triggers’
The research team extracted detailed information from 143 authorisation forms supplied by 5 forces for the years ending March 2019 and March 2020. These data were drawn using opportunity-based sampling, which means that the findings cannot be generalised to all s60 stop and searches.
In total the authorisation forms made reference to 237 separate incidents that formed part of the decision to authorise (the term used here is ‘trigger incidents’). Typically, most forms cited 2 incidents, with at least one involving some type of assault. A minority cited a high number of incidents with 5 forms referencing 7 or more.
Almost all incidents that triggered a s60 involved some form of physical assault, and in a handful of cases, fatalities. Those authorisations that included reference to less serious offences – theft and weapons possession – were invariably included alongside more serious violence incidents or specific intelligence on potential future violence.
Almost 9 in 10 incidents described in the authorisation forms involved the presence or use of a weapon. Looking solely at murders, assaults and attempts or threats of assault, the most common weapon cited was a knife (59%) and over a fifth of identified weapons referred to were firearms.
This more detailed review of 143 authorisation forms suggested that, while incidents were frequently cited in the rationale for authorisations, they were often considered alongside relevant intelligence. Authorisations that relied solely on intelligence were rare within this sample – less than one in ten authorisations were intelligence-led with no specific reference to a prior incident.
Around three-quarters of forms reviewed cited intelligence related to the nature of local gangs, and the rivalries between them. Less commonly recorded was intelligence on ‘planned’ incidents or violent encounters, such as intelligence that a group of people have arranged to fight at a specific time and location. A handful of authorisations also referenced the use of data analysis as a factor in their decision making.
S60 decision making
The 3 most commonly referenced alternative approaches to a S60 were:
-
searching under section 1 of the Police and Criminal Evidence Act 1984 (s1) powers (which require specific grounds for suspicion of an individual)
-
dispersal orders
-
direct engagement with known offenders
These were considered as alternatives to s60 but sometimes were recommended as complementary measures.
Direct engagement with offenders manifested itself in a number of ways. Sometimes the approach was described in terms of simply arresting individuals where evidential thresholds could be met or making ‘home visits’ to actively dissuade them from being involved in future violence. A handful of references were made to longer term approaches to address serious violence, but the s60 was invariably considered as being necessary alongside this.
Just under half of the authorisation forms explicitly referenced community impact issues within their decision-making process, although both the specific concern, and the ‘community’, varied from form to form. Most commonly mentioned were references to the risk to the local community if the predicted serious violence took place.
Around one quarter of all forms mentioned the positive impact on public confidence that the secondary benefit of increased visible policing in the area would bring. The impact of searching individuals was mentioned less frequently in around one in ten forms.
The most commonly referenced direct community contact was with those who led on the scrutiny of stop and search, while a smaller number recorded approaching relevant MPs or local councillors. However, community contacts were generally informed about the authorisation rather than asked for their views on a s60 going ahead.
Concluding remarks
This report has drawn together data from a range of different sources to provide an insight into the s60 relaxations. The findings should be considered alongside the detailed qualitative report (Smith et al., 2023) covering police officers’ and community scrutiny leads’ views on the relaxations, and on s60 more widely.
It is possible to say with confidence that the relaxations appear to have led to a marked change in the rank profile of authorising officers. There was little evidence of a marked change in the duration of authorisations or the use of extensions although ‘later’ forces appeared to adopt these more readily.
The August relaxation on communication of authorisations took away the requirement for s60s to be communicated with the public in advance. However, from the qualitative work it is clear that awareness of this relaxation was low, and most officers felt that the communication of authorisations was critical to their execution and served multiple purposes.
Across the pilot period s60 stop and search volumes went up by around a third. This was a smaller percentage increase compared to the more voluminous s1 stop and searches – up by over a half – which were unaffected by the relaxations.
Annual force-level data on s60 volumes show that use of s60 is fluid. Some forces did increase their use of s60 during the pilot period but others remained low or non-users. Implicitly, wider force-level policy over the use of s60s can change from year to year and, it is not possible to discount the impact of changes in serious violent crime volumes as a factor in driving s60 numbers. The period covered by the relaxations also sees the introduction of the Serious Violence Fund in the financial year 2019 to 2020. This combination of factors makes any assessment of the impact of the relaxations on s60 volumes challenging, particularly given the all-encompassing coverage of the pilot from August 2019.
The qualitative analysis also provides some useful insights into the way that officers reacted to changes in the conditions that permit the use of s60 over time. The individual relaxations may play some part in encouraging the more frequent use of the power, and the near universal shift to inspector-level authorisation looks by far the most influential change. However, the interviews imply that what may be more critical is the wider messaging that the relaxations convey, by instilling greater confidence in the use of the power (Smith et al., 2023).
The qualitative and quantitative research was undertaken to help to inform the decision around the pilot relaxations in the use of s60 authorisations. In addition however, it has also shown how police forces have opted to institute internal review mechanisms alongside the lowering of the authorising rank. The extent to which all forces have an accurate overall picture of their use of s60 is less apparent. To build on this, regular reporting on the distribution of s60s in both time and in individual neighbourhoods would appear to be a useful additional component of internal force-level monitoring and review.
1. Introduction
On 31 March 2019 the Home Secretary announced that 2 relaxations to the Best Use of Stop and Search Scheme (BUSSS) would be piloted in 7 police force areas: Greater Manchester Police (GMP), Merseyside, Metropolitan Police Service (MPS), South Wales, South Yorkshire, West Midlands, and West Yorkshire (Home Office 2019a). The relaxations were announced to enable the police to respond more effectively to anticipated incidents of serious violence using section 60 (s60) stop and search and involved:
-
reducing the level of initial authorisation needed to impose a s60 stop and search power in a defined area from chief officer level down to an officer of or above the rank of an inspector (Table 1.1)
-
reducing the degree of certainty needed for an authorising officer to impose a s60 from believing an incident involving serious violence ‘will’ occur, to ‘may’ occur
Table 1.1: Officer rank structure
| UK forces | Metropolitan Police Service | City of London Police |
|---|---|---|
| Chief Constable | Commissioner | Commissioner |
| Chief Constable | Deputy Commissioner | Commissioner |
| Deputy Chief Constable | Assistant Commissioner | Assistant Commissioner |
| Deputy Chief Constable | Deputy Assistant Commissioner | Assistant Commissioner |
| Assistant Chief Constable | Commander | Commander |
| Chief Superintendent | Chief Superintendent | Chief Superintendent |
| Superintendent | Superintendent | Superintendent |
| Chief Inspector | Chief Inspector | Chief Inspector |
| Inspector | Inspector | Inspector |
| Sergeant | Sergeant | Sergeant |
| Constable | Constable | Constable |
Note:
- This rank table is only indicative of the hierarchy within each police force.
All other conditions remained as outlined in BUSSS. In this report these changes are referred to as the ‘April’ (2019) relaxations. Following this, in August 2019 the current Home Secretary extended the pilot to all 43 police forces and the British Transport Police (BTP) (Home Office 2019b). The extended pilot relaxed all conditions placed by BUSSS on s60 stop and search powers. This meant that in addition to the 2 conditions relaxed above:
-
inspector authorisations could now last a full 24 hours (as opposed to 15 hours)
-
superintendents could now extend an authorisation beyond 24 hours to 48 hours (BUSSS required this to be done at chief officer level, and limited extensions to a total of 39 hours)
-
s60s do not need to be communicated to the public in advance
For the relaxations that came into force in April and August, it remained an operational decision for each police force as to how they were implemented, and which policies were put in place. Therefore, at police force level they could adapt any of the relaxations or continue with the conditions outlined in BUSSS. At the time of writing the pilot conditions remain relaxed. Figure 1.1 sets out a timeline for the introduction of BUSSS and the relaxations. It also covers the introduction of the Serious Violence Fund – the link with the s60 relaxations is covered in Chapter 3.
Figure 1.1: Timeline of BUSSS, relaxations for s60, and surge funding

A timeline showing the changes made to section 60 guidance between April 2014 and August 2019. In April 2014, the Best Use of Stop and Search scheme (BUSSS) was introduced. In March 2019, 2 relaxations to these conditions were piloted in 7 forces. In April 2019, the serious violence fund was introduced which allocated 65 million pounds to the 18 forces in the UK with the highest share of knife related injuries. The increase in spending helped drive more stop and search. In August 2019, the BUSSS was relaxed further, returning most conditions to the pre-2014 arrangements and extended to all forces.
1.1 Background
‘Stop and search’ typically refers to the statutory police powers to stop and physically search an individual. Most types of stop and search need to be justified by ‘reasonable suspicion’. This is usually based on intelligence or the belief that the search will uncover a specific illegal activity, or the possession of a prohibited or an illegal item. However, some legislation allows stop and searches without reasonable suspicion when terrorism, football-related disorder or other forms of violence is anticipated (McCandless et al., 2016). This report focuses on s60 of the Criminal Justice and Public Order Act 1994, which allows a stop and search within an authorised locality without reasonable suspicion when violence is anticipated.
Following a period of relatively high use of stop and search, a series of reports and reviews into stop and search were published that raised questions about its effectiveness and use, such as the Her Majesty’s Inspectorate of Constabulary (HMIC) 2013 report. This contributed to a 99% drop in s60 use from around 150,000 in the year ending March 2009 to 1,061 in the year ending March 2015. In 2014 the Government committed to do more to improve stop and search and introduced new reforms to make stop and search fairer and more effective, including the introduction of BUSSS (Home Office, 2014). BUSSS was introduced in 2014 to increase transparency, foster community involvement, improve outcomes and to capture the outcomes of searches in greater detail. The following changes to help to achieve these aims were made.
-
increased data recording: recording a broader range of stop and search outcomes and the link between the object of the search and its outcome
-
policies allowing lay observation of stop and search and a community complaints trigger – a local complaint policy requiring that the police ensure that the individuals who are stopped and searched are aware of where to complain. A threshold was also introduced above which the police are compelled to explain their use of stop and search and provide that explanation to local community scrutiny groups
-
measures aimed at reducing s60 searches were:
- raising the level of authorisation from an officer of or above the rank of inspector to chief officer[footnote 7]
- the authorising officer must reasonably believe that serious violence ‘will’ take place rather than it ‘may’ take place
- limiting the duration of initial authorisations to no more than 15 hours (down from 24 hours)
- ensuring that s60 stop and search is only used where it is deemed necessary
- communicating to local communities when a s60 authorisation is in place
Force participation was voluntary but BUSSS compliance was considered in a HMIC inspection in 2015 (HMIC, 2015). This inspection led to 13 police forces that were deemed to be the least compliant being suspended from the BUSSS scheme and a further 19 being put on notice. By November 2016 the suspended forces were readmitted after further inspection and most of the forces put on notice were found to be compliant.
Following the introduction of the BUSSS scheme, s60 stops fell further to only 631 in the year ending March 2017 (Home Office, 2020). At this time there were growing concerns around increases in serious violence, and with it, expectations that the police would take stronger action to tackle it, including the more widespread use of stop and search powers. S60 use increased in the year ending March 2018 to 2,503, but this was still at historic lows (Home Office, 2020). The police argued that the conditions as set out in BUSSS were too bureaucratic and needed to be relaxed for them to better tackle serious violence. The Government announced the initial pilot relaxations in March 2019, but further extended both coverage and the breadth of the relaxations in August 2019.
In the year ending March 2020, police in England and Wales carried out 18,081 stops and searches under s60 authorisations[footnote 8], an increase of 35% (4,666 searches) on the previous year. This is the third consecutive annual increase and follows a substantial increase between the years ending March 2018 and March 2019, when the use of s60 stop and searches increased more than fivefold, from 2,503 to 13,415 searches. The increase in the year to March 2020 was driven by a handful of police forces, notably, the MPS, which accounted for 39% of the increase, followed by Essex (which accounted for 18% of the increase) and Merseyside (17% of the increase). As in previous years, most s60 stops took place in London, with the MPS accounting for around two-thirds (63%) of all s60 searches in England and Wales, followed by Merseyside (7%), and the BTP and Essex, both accounting for 5% of s60 searches (Home Office 2020). In spite of the most recent increases, s60s still only account for 3% of all stop and searches. Stops under section 1 of the Police and Criminal Evidence Act 1984 (s1) – which require reasonable grounds for suspicion – are far more common (558,973 in the year ending March 2020).
1.2 Aims of this report
This report summarises a range of quantitative data on the operation of s60 during the first year of the pilot. The analysis is designed to complement the linked qualitative study based on interviews with officers and community scrutiny leads to gain their views of the relaxations introduced as part of the pilot (Smith et al., 2023). The quantitative data summarised in this report are designed to describe in more detail the pattern of s60 authorisations and resultant searches in the year ending March 2020 and, where possible, to make comparisons with data from the previous year. For a small sample of s60s, the analysis also includes an in-depth assessment of the authorisation forms on which decisions to agree s60s were made and examines the incidents and intelligence that typically precede an authorisation. Where there are sufficient data, the analysis seeks to draw out any differences between those authorisations conducted before the pilot and those since it began.
The main aims of the analysis were:
-
to describe the nature and pattern of s60 authorisations undertaken during the year ending March 2020 across England and Wales and observe any trends over recent years
-
for a subset of police forces, to examine in more depth any changes in authorisations between the years ending March 2019 and March 2020, including the rank of authorising officer, the length of authorisation and geographical coverage
-
to improve understanding of how s60s were communicated to the public via social media, how often this was done and if so, whether this was before, during or after the authorisation was put in place
-
to identify and describe what types of incidents typically precede a s60 authorisation and better understand what factors are considered in s60 authorisation decisions
As the analysis does not describe the findings of an ‘experiment’, it is not able to assess – in almost all instances – whether any changes identified in the year ending March 2020 were directly the result of the relaxations.
1.3 Report structure
Chapter 2 summarises the main data sources and methods. Chapter 3 summarises bespoke data collected from all 43 police forces and the BTP covering the pilot period. This examines broader patterns of s60 use in the year ending March 2020, such as the number of authorisations by length and rank along with the number of searches carried out and their outcomes.
Chapter 4 focuses on the relaxations by examining the more detailed administrative dataset collected from 6 forces for both the year ending March 2019 and the year ending March 2020 and supplemented by the bespoke dataset. In addition to comparing across the 2 years, it explores in more detail the profile of authorisations (for example, the rank of officer authorising the s60, timings and extensions). Chapter 5 analyses Twitter data to examine if and how s60s are communicated to the public. Chapter 6 looks at the number of searches per authorisation and the time of day that authorisations were put in place. Chapter 7 explores the geographical coverage of s60 authorisations.
Chapter 8 looks at a subset of this 6-force dataset, based largely on an analysis of s60 authorisation forms, to consider the types of ‘trigger’ incidents that preceded a s60 and the use of intelligence. Using the same data, chapter 9 examines the factors that police officers considered when making the decision to authorise a s60. Finally, chapter 10 provides concluding remarks.
2. Methodology
2.1 S60 bespoke data collection exercise
A bespoke section 60 (s60) statistical data collection exercise was carried out with all 43 territorial police forces in England and Wales, and the British Transport Police (BTP). The period covered by these data was 1 April 2019 to 31 March 2020 for the ‘original’ 7 forces that joined the pilot on 1 April 2019. For the remaining ‘later’ forces that joined on 12 August the pilot period covers 12 August 2019 to 31 March 2020. For every s60 authorisation, forces were asked to submit data on:
-
the rank of the authorising officer
-
free text to explain the rationale and location of the authorisation
-
start date and length of the authorisation
-
the number of individual searches resulting from the authorisation
The free text for the rationale for the authorisation was then reviewed and coded by analysts into one of 4 categories: ‘following an incident’, ‘event’, ‘intelligence’, ‘other/unknown’.[footnote 9]
Forces were also asked to complete information on: the self-defined ethnicity of any person searched, the outcome of each search; and whether a knife or sharp instrument was found in the search.
A data reconciliation exercise designed to flag and resolve data quality issues was carried out with all police forces prior to the publication of this report. This included summarising forces’ returns into data tables, highlighting missing values, and querying unusual data, such as large increases in the use of s60 or lengthy authorisation periods. Data collected for this work have also been cross-referenced with stop and search data collected for the National Statistics Police powers and procedures, year ending March 2020 (Home Office, 2020) publication, to ensure that, where applicable, totals were consistent across both data collections.[footnote 10]
For a range of reasons, it has not been possible to link all s60 stop and searches to a specific authorisation. In particular, the data system used by the Metropolitan Police Service (MPS) does not link stop and searches to authorisations, so the 2 sets of data were provided separately. However, analysts ran an exercise to link MPS searches to an authorisation based on the date of the search and the London borough in which the stop and search and authorisation took place (resulting in 10,075 links). Where these attempts to link failed, analysts tried to link to an authorisation based on the day before and the day after the date of the search. This resulted in a further 327 stop and searches being linked, bringing the total linked stop and searches to 10,402 (91% of all MPS stop and searches analysed).
Additionally, there are further instances where s60 stop and searches have been carried out by an officer from one police force, but the authorisation has been made by another force. This is particularly the case for the BTP, which carried out 234 searches in the pilot period on behalf of a territorial police force. In these cases, the search was recorded against the searching officer’s police force and will not be linked to an authorisation.
2.2 Additional s60 authorisation data from 6 forces
In addition to the data collected for all police forces, 6 relatively high use forces were identified in the qualitative study (Smith et al., 2023) that were able to provide more granular data on authorisations in the years ending March 2019 and March 2020. These data were drawn from authorisation forms and forces’ administrative systems and are hereafter referred to as the 6-force dataset. Whilst care has been taken to ensure consistency between the national dataset and the 6-force dataset, data collection methods differed therefore some small inconsistencies may be present. Due to coronavirus (COVID-19) pressures some forces initially approached were not able to commit resources to the work. In these cases, forces with the next highest number of s60 searches were approached as alternatives. The following 6 police forces made up the final sample: Merseyside, the MPS, and West Midlands – which were part of the ‘original’ pilot from April 2019 – and the BTP, Kent and Cheshire, – which joined the pilot in August 2019. These 6 forces together account for 83% of all authorisations during the pilot period.
Scoping work identified a core dataset from the 6 forces on their authorisations for both the pilot period (year ending March 2020) and the preceding year (year ending March 2019). These data covered the rank of officer who authorised the s60, the date and start time of the s60, and the length and location of the authorisation. The geographical information was used to generate digital maps and calculate the size of the geographical area covered by the authorisation.
These authorisations were reviewed against 650 relevant police force Twitter accounts. Twitter was chosen to examine public communication following discussions with the police forces, because it was felt to be one of the most commonly used forms of social media for sharing information on authorisations. Analysing these data allowed the analysts to identify whether the s60s covered by the time period in this study had been communicated via Twitter to the public. The data collected included the Twitter account, the date and time stamp of the tweet, the text posted and any images, such as maps contained in the tweet.
However, Twitter is just one of a number of channels that police forces can use to communicate with the public, therefore all communications of s60 authorisations will not have been captured.
Finally, information was retrieved and coded from a selection of 143 s60 authorisation forms from 5 of the forces across the 2 years. The method of collection and coverage varied by police force, due to factors such as their volume of searches. The forms included:
-
information on what evidence had been considered when making the authorisation decision
-
the incidents that preceded an authorisation
-
what other tactics had been considered instead of, or in addition, to the s60
-
how intelligence or data informed their decision making
-
the possible impact on the community
These data were drawn using opportunity-based sampling, which means that the findings cannot be generalised to all s60 stop and searches (see Appendix A for further details).
The composition, coverage and analysis of these datasets are described in more detail in Appendix A.
2.3 Quality assurance and governance
The information that police forces extracted from their administrative datasets were compared with other sources (for example, authorisation forms where appropriate) and any discrepancies were resolved with the force. The qualitative coding of authorisation forms underwent a quality assurance process, with the coding and categorisation reviewed by a second researcher to ensure consistency.
To provide governance to the research, a Steering Group consisting of representatives from the College of Policing, Cabinet Office Race Disparity Unit and HM Inspectorate of Constabulary and Fire and Rescue Services was established. The group was asked to give views on the direction of the project, the research tools and methodology, and met at key stages during the research.
3. Statistical overview of the s60 pilot
This chapter provides a statistical overview of the use of section 60 (s60) across the 43 territorial police forces in England and Wales, and the British Transport Police (BTP). The main focus is on the pilot period but it also describes the long-term use of s60, drawing on both the bespoke data collection and the annual statistical bulletin.[footnote 11]
National Statistics on the use of s60, as well as other police powers (including searches under section 1 of the Police and Criminal Evidence Act 1984 (s1)), are published annually in the Police powers and procedures’ statistical bulletin (Home Office, 2020). While every effort has been made to reconcile figures between the 2 publications, there may still be some small discrepancies due to the nature of the administrative datasets being queried, and the different times at which the data were extracted from the systems. Furthermore, data in the annual publication provides data for the full year, whereas data in this chapter relate to searches and authorisations conducted within the pilot period only.
3.1 Historic patterns of s60 use
On 27 October 2020, the Home Office published the annual Police powers and procedures (2020) statistical bulletin. This release contains information on the number of searches conducted under s60 since the year ending March 2002.
Figure 3.1 below shows that the use of s60 fell substantially between the year ending March 2009 and the year ending March 2013, from around 150,000 searches a year, to 5,000. In the years ending March 2016 and March 2017 the number of searches under this power was just 970 and 631 respectively, with the majority of these searches being conducted by the MPS. Since the year ending March 2017, the number of searches conducted under s60 has continued to rise, to 18,081 searches in the year ending March 2020. Of these, 17,267 (95%) were conducted during the pilot period.
Figure 3.1: Stop and searches under s60 of the Criminal Justice and Public Order Act 1994, England and Wales,1 years ending March 2007 to March 2020
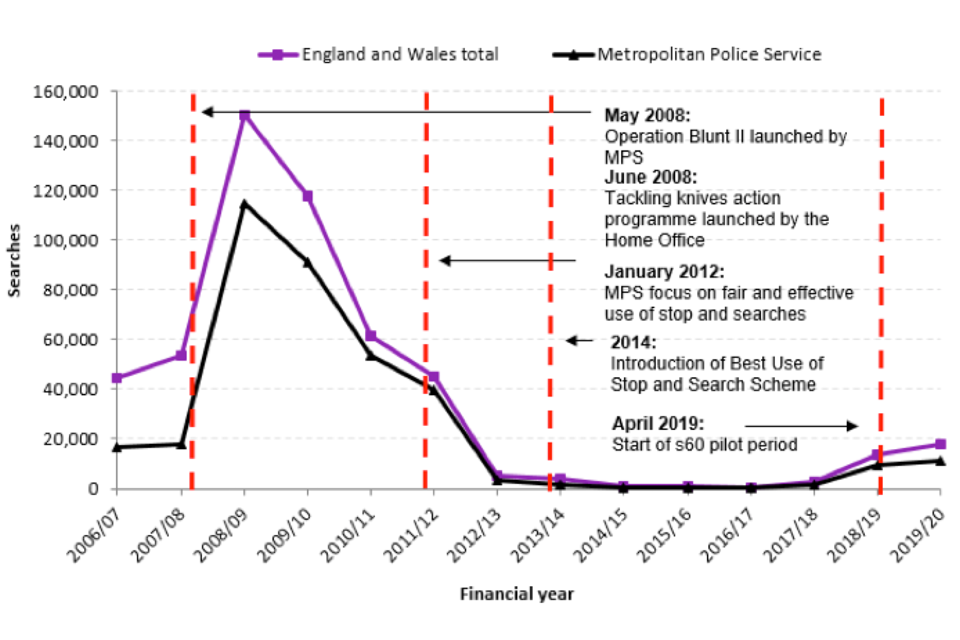
A graph showing the number of stop and searches from the year ending March 2007 to year ending March 2020. There is a sharp increase from the year ending March 2008 to a peak in the year ending 2009 followed by a steep decline until the year ending March 2013. Since the year ending March 2018 there has been a slight increase. S60 stop and searches by the MPS drive this trend.
Source: Police powers and procedures (2020), Home Office, 2020.
Note:
- Data from the year ending March 2010 onwards include the BTP. Prior to this, data are not directly comparable with more recent years.
While it is not a ‘pure’ comparison – due to the additional forces that joined the pilot in August 2019 – comparing the pilot period[footnote 12] with the full previous year shows a 29% increase in the number of s60 searches across England and Wales. This compares with a 52% increase in the more voluminous s1 stop and searches (not shown) in the year ending March 2020.[footnote 13]
Looking solely at the 7 ‘original’ forces allows a true year-on-year comparison. In this case, there was a 9% increase across the 2 years, but the pattern varied across forces. The MPS, the largest user of s60s, recorded a 19% increase during the pilot, whereas Merseyside showed a threefold increase (383 to 1,195). Small volume increases in s60 searches were recorded for GMP, South Yorkshire, West Yorkshire and South Wales. However, West Midlands recorded an 85% fall in use over the period (Figure 3.2).
Figure 3.2: Changes in the use of s60, ‘original’ 7 pilot forces, years ending March 2019 and March 2020
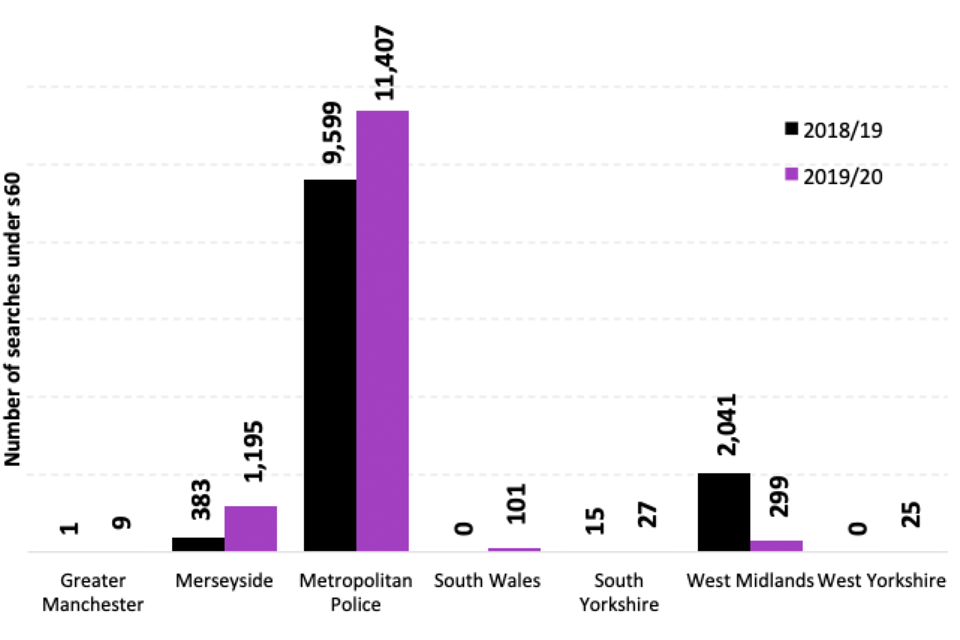
Bar chart showing changes in section 60 use between years ending March 2019 and March 2020 for 7 forces. All forces apart from the West Midlands have increased their use. The Met police are clearly the biggest users of S60.
It is not possible to assess the extent to which the relaxations may have directly or indirectly contributed to the increase in s60s during the pilot. This is partly because the pilot was rolled out in a way that made it difficult to explore any discrete pilot effect on search volumes. The pilot also overlapped with another initiative that might be expected to contribute to an increase in the use of s60s. As part of the drive to combat serious violence, the Treasury agreed to allocate £100m of additional funding to forces for the financial year ending March 2020 to help to tackle the problem, with the majority (£63.4m) allocated to ‘surge policing’.[footnote 14] This was largely expected to increase activity using the officers already employed, rather than to significantly increase officer numbers. The fund provided additional resources for the 18 police forces in England and Wales with the highest share of knife injury admissions to hospital, with force allocations scaled to reflect admission volumes. These 18 forces accounted for 86% of the total increase in s60 stop and searches between the years ending March 2019 and March 2020 (4,008 of an additional 4,666 searches).
Despite this, force-level changes in s60 searches during the year ending March 2020 amongst the ‘18’ are far from uniform (Table 3.1). Amongst forces receiving surge funds that joined the pilot in August, one (Kent) recorded large increases in s60s heavily concentrated during the pilot period. Others recorded marked uplifts in s60 searches in both the year ending March 2020 pre-pilot period and the pilot period itself (Essex, Lancashire and to a lesser extent, Hampshire and Sussex). Other forces recorded no use of s60 at all in the year ending March 2020 regardless of relaxations and access to surge funding (Bedfordshire, Leicestershire, Northumbria and Nottinghamshire). Conversely, 8 police forces that were not part of the ‘18’, did record higher numbers of s60 searches during the later pilot compared with the year ending March 2019.[footnote 15] In short, the combination of the pilot relaxations and funding enhancements during the year ending March 2020, on top of forces’ variable use of s60, make assessing the impact of relaxations alone on s60 volumes very challenging.
Table 3.1: S60 stop and searches, 18 forces receiving serious violence funding, year ending March 2019, year ending March 2020 and pilot period
| Police force | year ending March 2019 | year ending March 2020 | year ending March 2020 – pilot period only1 |
|---|---|---|---|
| Avon & Somerset | - | 1 | - |
| Bedfordshire | 1 | - | - |
| Essex | 41 | 873 | 601 |
| Greater Manchester | 1 | - | 9 |
| Hampshire | - | 279 | 230 |
| Kent | - | 586 | 584 |
| Lancashire | 236 | 357 | 197 |
| Leicestershire | 11 | - | - |
| Merseyside | 383 | 1,195 | 1,195 |
| Metropolitan Police | 9,599 | 11,412 | 11,407 |
| Northumbria | 1 | - | - |
| Nottinghamshire | 21 | - | - |
| South Wales | - | 101 | 101 |
| South Yorkshire | 15 | 27 | 27 |
| Sussex | 11 | 524 | 482 |
| Thames Valley | 1 | 674 | 665 |
| West Midlands | 2,041 | 316 | 299 |
| West Yorkshire | - | 25 | 25 |
| Total | 12,362 | 16,370 | 15,822 |
Source: Table 2 and ‘Police powers and procedures (2020)’ statistical bulletin, Home Office.
Note:
- Greater Manchester Police, Merseyside, Metropolitan Police Service, South Wales, South Yorkshire, West Midlands, and West Yorkshire were placed under pilot conditions from 1 April 2019. The remaining police forces were placed under pilot conditions from 12 August 2019.
3.2 Authorisations
As part of the bespoke data collection, information on s60 authorisations was collected for the first time. The data show that during the pilot period a total of 805 authorisations were put in place (excluding Lancashire, who were unable to provide information on authorisations). The MPS accounted for almost three-quarters of these authorisations (579, 72%), followed by Merseyside (58, 7%). Just 5 forces accounted for 90% of all authorisations during the pilot period, and also accounted for 82% of the resultant searches. Of the 19 forces that did not conduct any searches under s60 in the year ending March 2019, 8 conducted at least 1 search during the pilot period.
Figure 3.3: Authorisations, by police force area, top 5 forces, pilot period
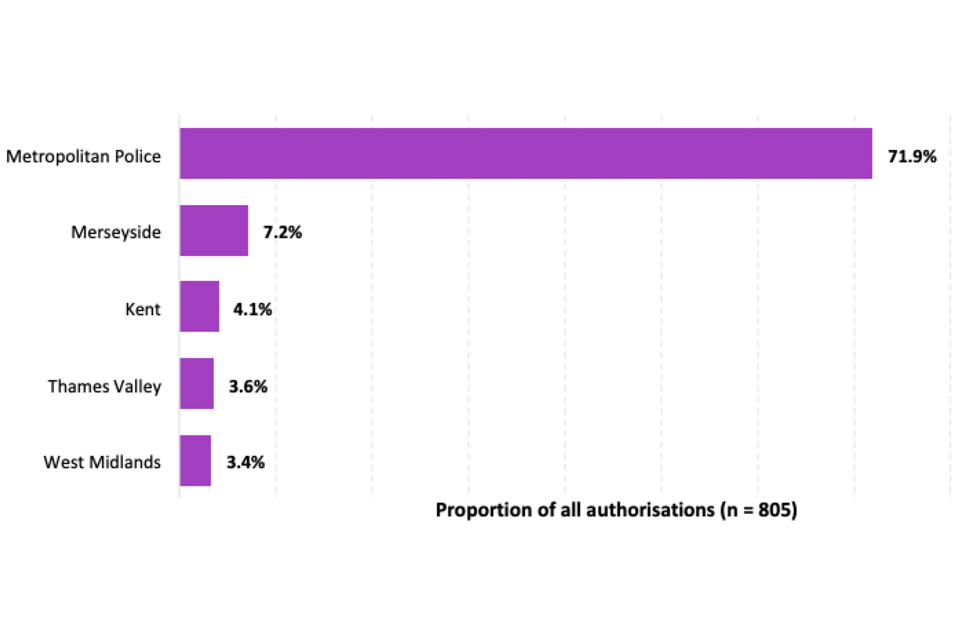
A bar chart showing the use of section 60 over the pilot period for the highest using forces. The MPS account for 72% of all authorisations.
Source: Table 3.
3.3 Grounds for authorisation
As part of the data collection, police forces provided information on the grounds for the authorisation, or the events that led to the authorisation being put in place. This information was received as free text, and then coded by analysts into one of the following categories.[footnote 16]
Following an incident or incidents: This category was used where the free text contained information on one or more specific incidents that happened prior to the authorisation being put in place. Often this included cases where serious violence had already occurred, and an authorisation was put in place to deter further acts of violence.
Intelligence: Authorisations fell into this category where the free text explanation mentioned having specific intelligence that serious acts of violence may take place. For example, where intelligence had been received that gangs were planning to meet.
Event: Where authorisations mentioned a specific event (pre-planned or otherwise), they were coded under this category. Examples included: festivals and carnivals; private parties; and funerals of gang members.
Other/not known: This category was used for all cases where there was either no explanation given, or where the explanation did not fall into any of the categories listed above.
Mixed categories: In many cases, the grounds for the authorisation fell into more than one of the above categories. These were therefore coded as mixed across 2 or more categories. For example, in cases where serious violence had already taken place (for instance, a stabbing), and the police then received intelligence of a planned retaliation attack, the authorisation would be coded as ‘Mixed – Incident/Intelligence’. Three other ‘mixed’ categories were also generated.
The data show that the majority of authorisations were put in place following an incident, or previous act of serious violence (Figure 3.4). Authorisations that followed an incident were the single biggest category (413, 51%). Authorisations that had a mixture of grounds including incidents accounted for an additional 198 authorisations so that in total, 76% of authorisations referred to some kind of previous incident. Intelligence-only authorisations were rare (13%) and event-only authorisations were the least common.
Figure 3.4: Grounds for authorisation, pilot period
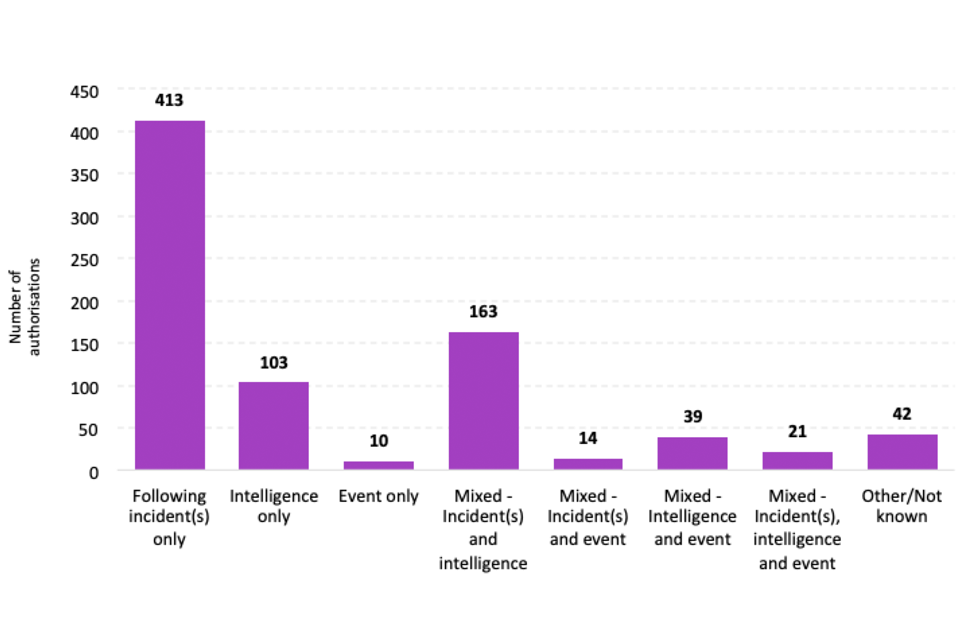
A bar chart showing the number of s60 authorisations by the grounds for their authorisation. The most frequent grounds for an authorisation was following an incident (413).
Source: Table 6.
3.4 Resultant searches
As part of the bespoke data collection, police forces were requested to link searches under s60 powers to the specific authorisation put in place. However, for a range of reasons, it was not possible to link all s60 searches to a specific authorisation.
In particular, the data systems used by Lancashire and the MPS record searches and authorisations separately. Consequently, an automatic link between a particular search and authorisation was not possible. Lancashire therefore provided data for searches only, and could not provide data on authorisations. However, given the large number of s60 authorisations and searches conducted by the MPS, both datasets were provided, and analysts ran an exercise to link MPS searches to an authorisation based on the date of the search and the London borough in which the search and authorisation took place.
In total 10,075 of the 11,407 searches conducted by the MPS were linked through this process. Where these link attempts failed, analysts relaxed the need to link on time, and instead linked only on the borough and date of the search. This resulted in a further 327 searches being linked, bringing the total linked searches to 10,402 (91%). Where a search could be linked to multiple authorisations, and analysts were unable to specify which, a link was not made.
Additionally, there were further instances where s60 searches had been conducted by officers in the BTP, but the authorisation was put in place by a territorial police force. In these cases, the search had been recorded against the searching officer’s force (BTP), and will not be linked to an authorisation. Table 3.2 summarises the magnitude of the issues.
Table 3.2: Number and proportion of searches that are linked/not linked to an authorisation
| Number of searches | % | |
|---|---|---|
| All searches conducted in pilot period | 17,267 | 100% |
| Linked searches | ||
| Data provided linked | 5,429 | 31% |
| MPS searches linked using date and borough records | 10,402 | 60% |
| Total linked | 15,831 | 92% |
| Not linked searches | ||
| MPS | 1,005 | 6% |
| Lancashire | 197 | 1% |
| BTP | 234 | 1% |
| Total not linked | 1,436 | 8% |
Where data quality issues exist, these are included in the relevant Excel data tables that accompany this report.
Findings related to the number of searches are given in Chapter 6.
3.5 Outcomes following a search
These data include the initial outcome given following the search only. The data show that the vast majority of s60 searches conducted during the pilot period (91%) resulted in ‘no further action’ (using the Best Use of Stop and Search Scheme BUSSS framework. ‘No further action’ can include a wide range of scenarios. It is therefore possible, for example, that in some cases, an outcome of ‘no further action’ could be given if an officer finds something but decides not to deal with it through formal means (arrest, cannabis/khat warning, caution, community resolutions or a penalty notice for disorder). Only 9% of searches resulted in an arrest or some type of disposal (1,471). Where there was an arrest or other outcome, 46% resulted in an arrest, and a further 34% in a community resolution. The arrest rate for all s60 searches conducted in the pilot period was 3.9% (4.7% in the year ending March 2019).
Figure 3.5: Principal outcome ‘no further action’, and any other outcome, pilot period
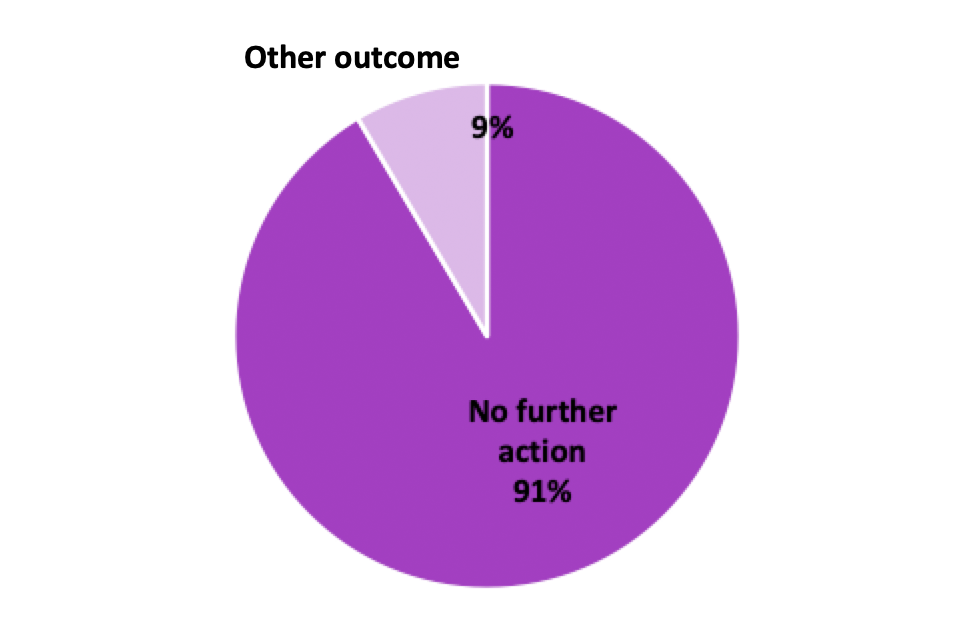
A pie chart showing the breakdown of outcomes following a search under section 60. 91% of all section 60 searches result in no further action.
Source: Table 11.
Note:
- Excludes 4 searches where the outcome was not stated.
Figure 3.6: Principal outcome, other than no further action, following a s60 search, pilot period
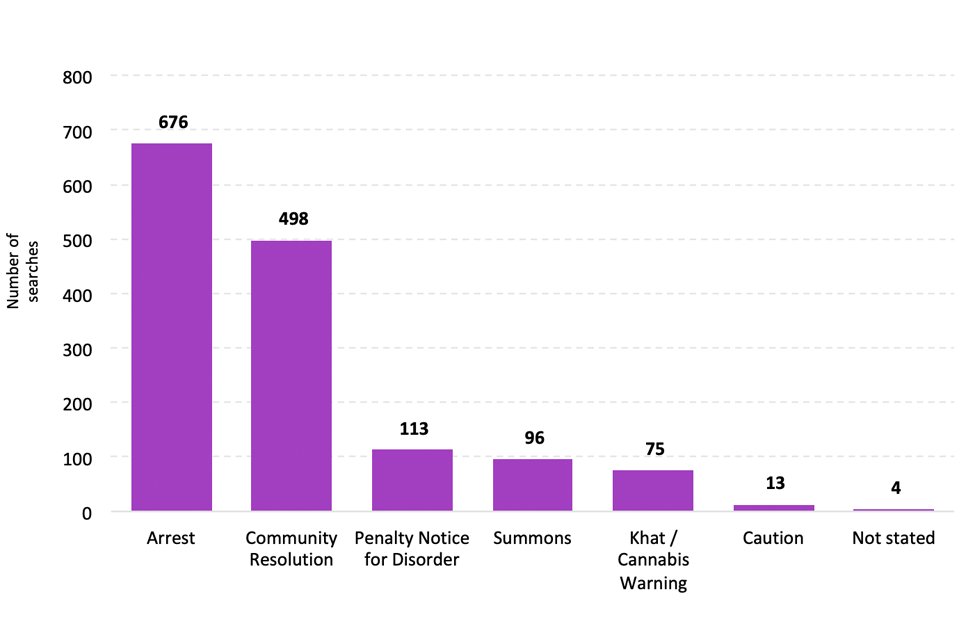
A bar chart showing a breakdown of the other outcomes of a section 60 search, excluding no further action. The majority of searches that result in an action end in an arrest or a community resolution.
Source: Table 11.
For the 17,025 searches for which it was known whether or not a knife was found (99% of all searches), a knife was found in 1.0% of searches. This is similar to the annual Police powers and procedures (2020) statistical bulletin where a knife or sharp instrument was found in 1.4% of searches in the full year ending March 2020 financial year (1.6% in the year ending March 2019 ).
This statistical bulletin provides these data for previous years.
3.6 Ethnicity of those searched
Data were provided by all police forces on the self-defined ethnicity of the person being searched. However, when the data were first received, analysis indicated that almost one in four (24%) of searches were recorded with a ‘not stated’ ethnicity. This was explored further with the MPS and it was found that for 75% of the cases where the self-defined ethnicity was not recorded (30% of all searches) the reason was that the person being searched had declined to state their ethnicity (2,551 of the 3,423 cases where the self-defined ethnicity was not recorded).
Given that the MPS[footnote 17] account for a sizeable share of the data, MPS analysts ran a second exercise and, where the self-defined ethnicity of the person was not recorded (30% of cases), the ethnic appearance of the individual as recorded by the searching officer was used. Table 3.3 and table 3.4 summarise the impact of doing so on the figures.
Table 3.3: Ethnic appearance as recorded by the searching officer, where the self-defined ethnicity of the individual was not stated, MPS only, pilot period
| Number of searches | % | |
|---|---|---|
| MPS search total | 11,407 | 100% |
| Of which, number of searches where the self-defined ethnicity is ‘not stated’ | 3,423 | 30% |
| Of which, number of searches where the self-defined ethnicity is known | 7,984 | 70% |
| Where self-defined ethnicity is ‘not stated’, officer perceived ethnic appearance recorded | 3,423 | |
| White | 571 | 17% |
| Black (or Black British) | 2,012 | 59% |
| Asian (or Asian British) | 374 | 11% |
| Chinese and Other | 274 | 8% |
| Mixed | - | 0% |
| Not stated | 192 | 6% |
| Total | 3,423 | 100% |
Table 3.4: Impact of recoding MPS ethnicity data, all forces, pilot period
| Initial data received | Initial data received | Data following MPS recoding | Data following MPS recoding | |
|---|---|---|---|---|
| Number | % | Number | % | |
| White | 6,053 | 35% | 6,624 | 38% |
| Black (or Black British) | 4,578 | 27% | 6,590 | 38% |
| Asian (or Asian British) | 1,555 | 9% | 1,929 | 11% |
| Chinese and Other | 372 | 2% | 646 | 4% |
| Mixed | 522 | 3% | 522 | 3% |
| Not stated | 4,187 | 24% | 956 | 6% |
| Total | 17,267 | 100% | 17,267 | 100% |
This resulted in 16,311 of the 17,267 (94%) searches conducted in the pilot period having an ethnicity recorded against them. Further details on the reason for a ‘not stated’ ethnicity were not collected from other police forces, so a similar exercise could not be repeated for those forces. However, since the MPS accounts for two-thirds of searches in the pilot period it is expected that the impact of recoding ethnicity data in other forces would be minimal.
Table 3.5 shows the revised figures for the pilot period, and a comparison to the year ending March 2019.[footnote 18] In the pilot period, and excluding cases where the ethnicity was not known, 41% of searches were of people who either self-identified as White or, in the MPS where the self-defined ethnicity was not stated, the officer recorded the person’s ethnic appearance as White. A similar proportion (40%) of searches were conducted on those who either self-identified as Black, or the officer recorded their ethnic appearance as Black. This was followed by the Asian group (12% of searches), the Chinese and Other ethnic group (4% of searches), and the Mixed group (3% of searches).
Table 3.5: Ethnicity of persons searched under s60, year ending March 2019 and pilot period, all forces
| Year ending March 2019 | Year ending March 2019 | Pilot period | Pilot period | |
|---|---|---|---|---|
| Number | % | Number | % | |
| White | 2,852 | 27% | 6,624 | 41% |
| Black (or Black British) | 4,870 | 47% | 6,590 | 40% |
| Asian (or Asian British) | 1,832 | 18% | 1,926 | 12% |
| Chinese and Other | 216 | 2% | 646 | 4% |
| Mixed | 644 | 6% | 522 | 3% |
| Total (known ethnicity) | 10,414 | 100% | 16,308 | 100% |
| Not stated | 3,001 | 22% | 956 | 6% |
Source: Table 11 and Police powers and procedures (2020) statistical bulletin.
An arrest or other outcome (those listed in section 3.5) was given to 12% of those searched from a Mixed ethnic group, to 9% of those from both a Black ethnic group and those from an Asian ethnic group, to 8% of White individuals, and to 7% of individuals from a Chinese and Other ethnic group. While data on outcomes other than arrest were not collected specifically for s60 searches in previous years, Table 3.6 shows how the arrest rate for each ethnic group compares with the year ending March 2019. Across all ethnic groups, the arrest rate was lower in the pilot period than in the year ending March 2019. The arrest rate was highest amongst the ‘Mixed’ ethnic group for both years, at 7.1% in the year ending March 2019 and 5.2% in the pilot period.
Table 3.6: Arrests following a search under s60, by ethnic group, year ending March 2019 and pilot period
| Year ending March 2019 | Year ending March 2019 | Pilot period | Pilot period | Pilot period | Pilot period | Pilot period | ||
|---|---|---|---|---|---|---|---|---|
| Number resulting in arrest | Arrest rate | Number resulting in arrest | Arrest rate | Number of other CJS outcomes | Other CJS outcome rate | Combined arrest and other CJS outcome rate | ||
| White | 147 | 5.1% | 243 | 3.7% | 280 | 4.2% | 7.9% | |
| Black (or Black British) | 273 | 5.6% | 287 | 4.4% | 330 | 5.0% | 9.4% | |
| Asian (or Asian British) | 67 | 3.7% | 70 | 3.6% | 107 | 5.5% | 9.2% | |
| Chinese and Other | 14 | 6.5% | 21 | 3.3% | 22 | 3.4% | 6.7% | |
| Mixed | 46 | 7.1% | 27 | 5.2% | 34 | 6.5% | 11.7% | |
| Not stated | 89 | 3.0% | 28 | 2.9% | 22 | 2.3% | 5.2% | |
| Total | 636 | 4.7% | 676 | 3.9% | 795 | 4.6% | 8.5% |
Source: Table 11 and Police powers and procedures (2020) statistical bulletin.
Note:
- CJS = Criminal justice system.
4. Authorisations: rank, duration and extensions
This chapter covers data on 3 of the relaxations on section 60 (s60) stop and search:
-
the lowering of the level of initial s60 authorisations from chief officer down to an officer of or above the rank of an inspector
-
the maximum length of initial authorisations extending from 15 to 24 hours
-
lowering the authorisation level needed to impose an extension from chief officer to superintendent and increasing the time of an extension from 39 hours to 48 hours
It was not feasible to collect data on the change in degree of certainty from a belief that serious violence ‘will’ occur to ‘may’ occur.
4.1 Authorising officer rank
Nationally, almost all police forces that used s60s responded to the April rank relaxation by moving to lower ranks authorising s60s in most cases (Figure 4.1). The rank of the authorising officer was known for the vast majority (99%) of the authorisations in the pilot period[footnote 19]; 85% were initially authorised by an inspector, and just 5% were authorised by a chief officer, the majority of the latter being in the West Midlands. Eight forces continued to have one or more s60 authorised by a chief officer during the pilot period. However, the overall trend was a switch away from chief officer-led authorisations in the pilot period.
Figure 4.1: Authorisations, by rank of initial authorising officer, pilot period
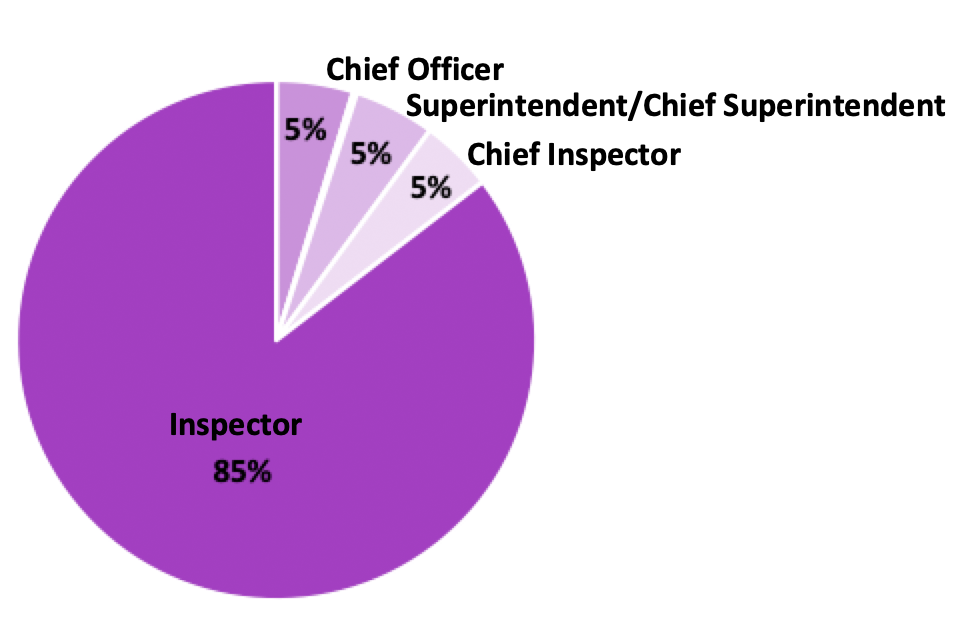
A pie chart showing the rank of the authorising officer. 85% of all s60s were authorised by an inspector.
Source: Table 5.
Notes:
- For the ‘original’ forces the pilot period is 1 April 2019 to 31 March 2020. For the remaining ‘later’ forces the pilot period is 12 August 2019 to 31 March 2020. N = 795.
- Excludes 10 authorisations where the authorising officer was not stated.
For 6 forces[footnote 20] more data were collected to allow a comparison with the previous year. Three of these forces joined the pilot in April 2019, and so data across 2 full years are compared. For the 3 forces that joined the pilot later (August 2019), data for the equivalent 8 months[footnote 21] are compared.
Figure 4.2 confirms the general shift in these 6 forces from chief officer to inspector-led authorisations. Whilst the majority were authorised below the rank of chief officer, the forces that joined the pilot in August 2019 had a higher proportion of chief inspector to chief superintendent-led authorisations compared to the ‘original’ forces (13% compared with 6%). The West Midlands accounted for the majority of chief officer authorisations during the pilot period.
Figure 4.2: Authorisations, by rank of initial authorising officer in the 6 forces
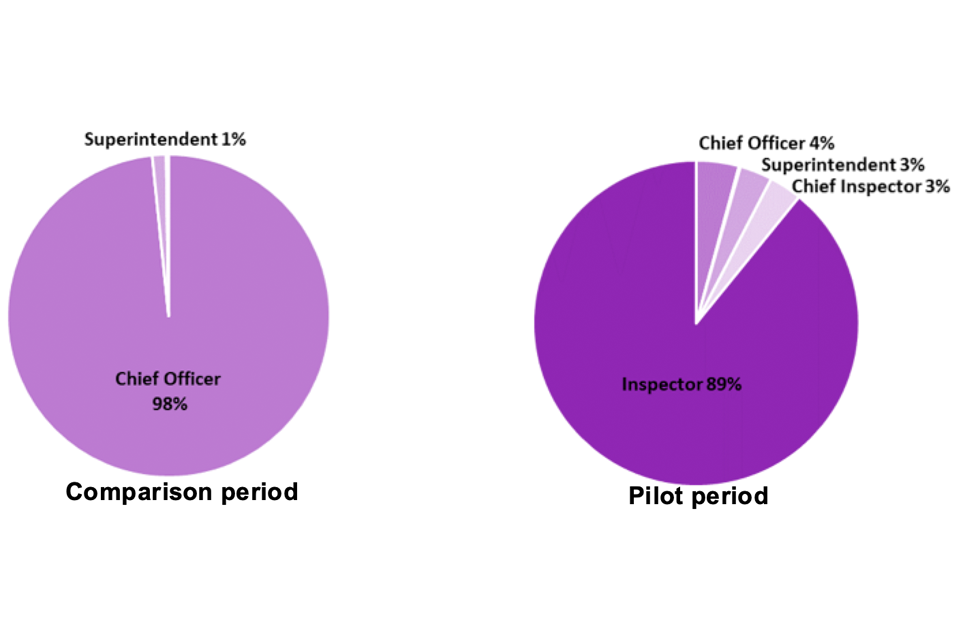
Two pie charts comparing the authorisations by rank for the comparison period and the pilot period. In the comparison period, 98% of all authorisations were undertaken by a chief officer. In the pilot period, this fell to 4%.
Notes:
- For the ‘original’ forces (Merseyside, the MPS, West Midlands) the pilot period is 1 April 2019 to 31 March 2020 and the comparison period is 1 April 2018 to 31 March 2019.
- For the ‘later’ forces (BTP, Cheshire, Kent) the pilot period is 12 August 2019 to 31 March 2020 and the comparison period is 12 August 2018 to 31 March 2019.
- Pilot period n = 709.
- Comparison period n = 431.
- Excludes 3 authorisations where the authorising officer rank was not stated.
4.2 Duration of the initial authorisation
The ‘August’ relaxations increased the maximum length of initial duration of a s60 (not including extensions) from 15 to 24 hours. Overall, 83% of initial authorisations were for 15 hours or less in duration from August 2019 to March 2020. However, the pattern varied markedly between the ‘original’ and ‘later’ forces (see Figure 4.3). Whilst only 3% of the ‘original’ forces’ authorisations were between 16 and 24 hours in length, more than half (52%) of the ‘later’ forces’ authorisations were this long. The qualitative analysis (Smith et al., 2023) found that officers in the 7 ‘original’ pilot forces – the biggest users of s60s – were less aware of the ‘August’ relaxations, on duration and communications, than the original ‘April’ changes. By contrast, the forces that joined the pilot in August 2019 received all 5 relaxations as a single package, and awareness of all the relaxations appeared to be higher amongst these interviewees.
Figure 4.3: Total length of authorisation, pilot period
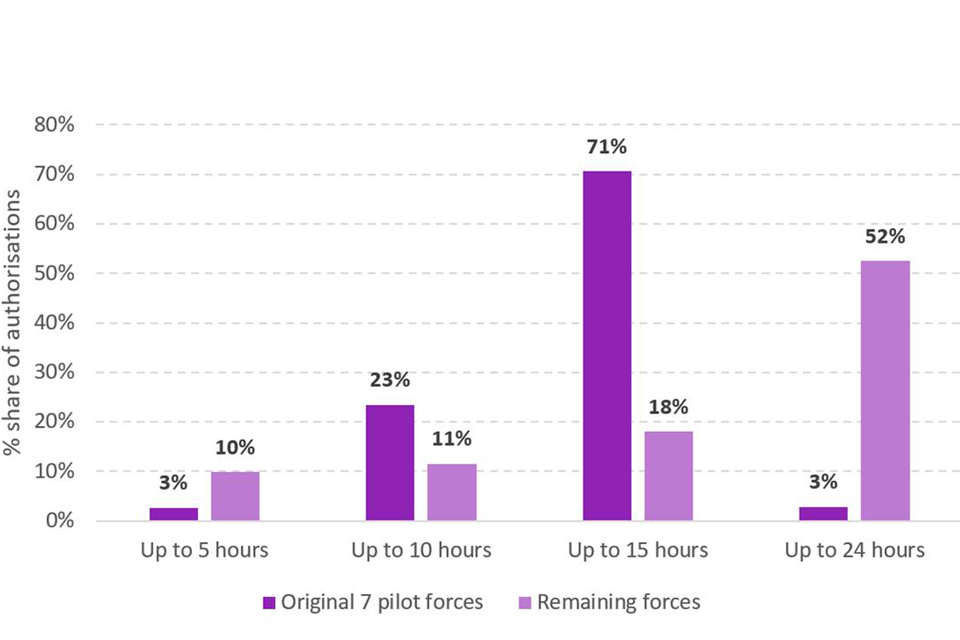
A bar chart comparing the length of authorisations for the original pilot forces and other forces. Most authorisations by the pilot forces were up to 15 hours long.
Source: Table 4b.
Notes:
- 12 August 2019 to 31 March 2020 only.
- Original 7 pilot forces (n = 384) – Greater Manchester, Merseyside, the Metropolitan Police Service, South Wales, South Yorkshire, West Midlands and West Yorkshire.
- Remaining forces and BTP (n = 122).
The 6-force data allow an analysis of the durations during the comparison period and the pilot period (the 43-force data only cover the pilot period).[footnote 22] Figure 4.4 shows average initial authorisation durations per month before and after the August relaxations were introduced. The average monthly duration is relatively stable between 10 and 12 hours. The impact of the longer durations for the ‘later’ forces is masked due to their lower volumes.
The mean average length of initial authorisation duration was similar regardless of rank of authorising officer (12 hours for both inspectors and chief officers in the ‘original’ forces, and 16 hours for both ranks among the ‘later’ forces).
Figure 4.4: Average length of initial duration, by month, 6 forces
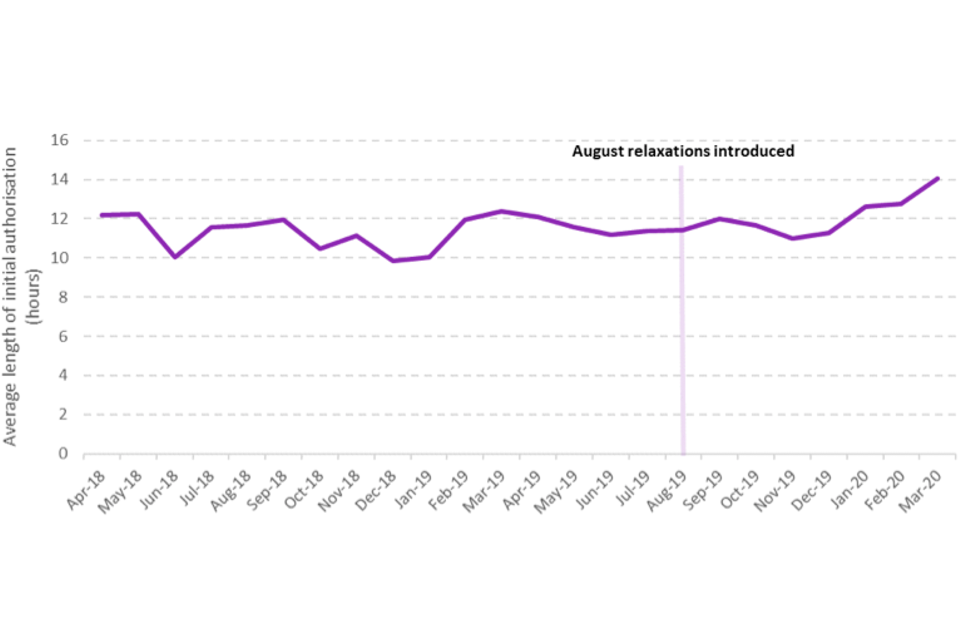
A line graph showing how the average duration for a s60 has changed between April 2018 and March 2020. It has been broadly stable for most of the period, fluctuating between 10 and 12 hours, but increased slightly in the months to March 2020 (up to 14 hours).
4.3 Extensions
In the 8 months post-relaxation from August 2019 to March 2020, 10 extensions were identified across the 6 forces, equivalent to 2% of their authorisations. The majority of these extensions were for 9 hours. In the comparison period only 3 extensions were given.
Thus, the use of extensions was rare, both before and after the relaxations were introduced. Generally, police forces seemed to prefer a series of new sequential authorisations rather than using an extension (see for instance Chapter 6).
5. Communication of s60s using Twitter
As part of the Best Use of Stop and Search Scheme (BUSSS), police forces were required to communicate with the public about section 60s (s60s). In August 2019, when the pilot was extended to all forces and the relaxations expanded, s60s no longer had to be communicated publicly in advance. It was not possible to collect comprehensive data on the extent to which individual authorisations were communicated. However, some insight into the publicising of s60 authorisations can be gleaned by analysing data on forces’ use of social media. Twitter was chosen for this as based on discussions with forces it was felt to be one of the most commonly used forms of social media for sharing information on authorisations. Twitter also allows for accurate analysis of when the s60 was communicated as each tweet is time stamped.[footnote 23] This section sets out:
-
how often the 6 forces communicated s60s using Twitter
-
what was communicated
-
when this occurs in relation to the authorisation
Data were gathered from relevant Twitter accounts for the 6 forces[footnote 24] (see Table 5.1 and Appendix A for further details). A large number of accounts were searched in this process (650) using appropriate key words. The volume and diversity of police Twitter accounts is considerable and poorly mapped so some accounts might not have been identified. The majority of accounts identified as being relevant (78%) were at the neighbourhood and local level but these generated only 5% of all identified tweets. Most tweets were generated by London borough or district-level accounts (86%). It is possible that some instances of an authorisation being tweeted have not been located, principally because older tweets are at risk of being deleted.
Table 5.1: S60 tweets, by account, years ending March 2019 and March 2020
| Account type | Number of accounts | Number of tweets relating to s60s |
|---|---|---|
| Main police force accounts | 6 | 51 |
| Other central accounts1 | 22 | 4 |
| London borough and district accounts2 | 116 | 500 |
| Neighborhood and local accounts3 | 506 | 27 |
| Total | 650 | 582 |
Notes:
- Examples include the Metropolitan Police Service Taskforce and British Transport Police (BTP) Specials account.
- Includes BTP regional accounts.
- Includes local station accounts.
5.1 Proportion of authorisations tweeted
During the August pilot period[footnote 25], the proportion of authorisations with identified tweets ranged from 15% to 85% across the 6 police forces (see Figure 5.1). All but one force, and all the high-volume forces, tweeted details of at least half of their authorisations. The force that used Twitter the least for this purpose (Kent, 15%) indicated that they tended to use a more targeted communications strategy, for example, providing details via key community leaders. For all 6 forces combined, over half (54%) of the authorisations were tweeted in the August pilot period. The corresponding figure for the August comparison period was 53%. The pattern across individual forces varied.
It is hard to draw any clear inferences about the relationship between the relaxation on communications and the change in the proportion of authorisations tweeted. Patterns of use across forces were found to vary markedly. Moreover, the qualitative research (Smith et al., 2023) highlighted that awareness of the ‘August’ relaxations among the ‘original’ 7 police forces in the pilot, including on communication with the public, was low. This analysis also found that those forces which were aware of the change remained positive about the value of communicating authorisations. Finally, Twitter is just one of a number of channels that forces can use to communicate with the public, therefore this analysis will not have captured all communications of s60 authorisations.
Figure 5.1: Use of tweets, percentages of tweets identified for authorisations in the August pilot period, by force
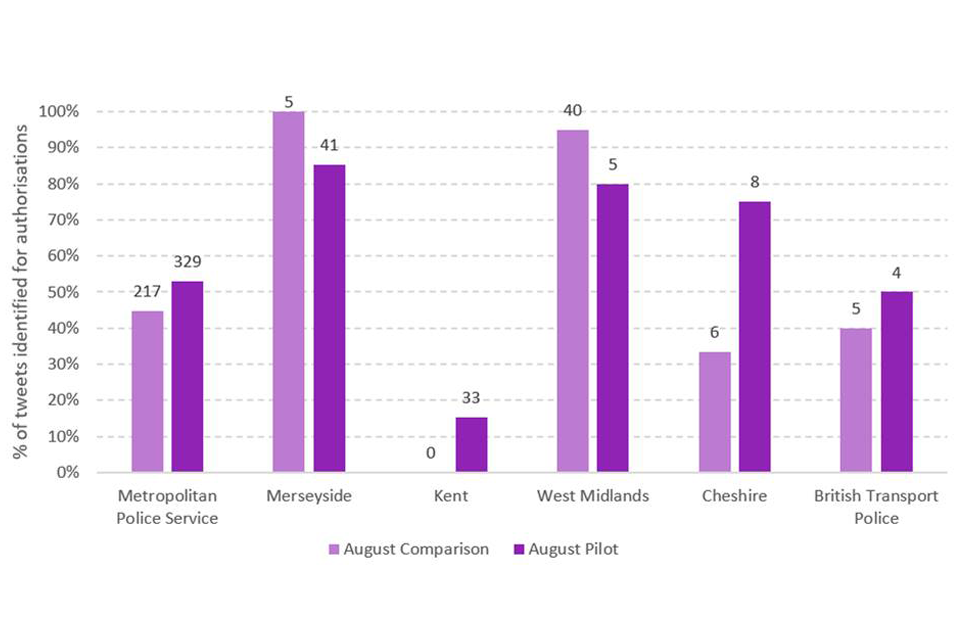
A bar chart showing the use of twitter for communicating s60 authorisations in the pilot and comparison periods. Merseyside and West Midlands tweeted the highest proportion of their authorisations.
Note:
- The figures displayed above the bars represent the total number of authorisations in that police force for each period.
Because all tweets include a time stamp it is possible to analyse when details of authorisations were tweeted. Forces tended to tweet about the s60 during the authorisation period (just over three-quarters). Pre-authorisation tweets were less frequent (almost one in four) while post-authorisation tweets were rare (see Figure 5.2). Where there were tweets after the authorisation period had ended, these sometimes included information on the outcome of searches.
Figure 5.2: Time profile of tweets, years ending March 2019 and March 2020 combined, 6 forces
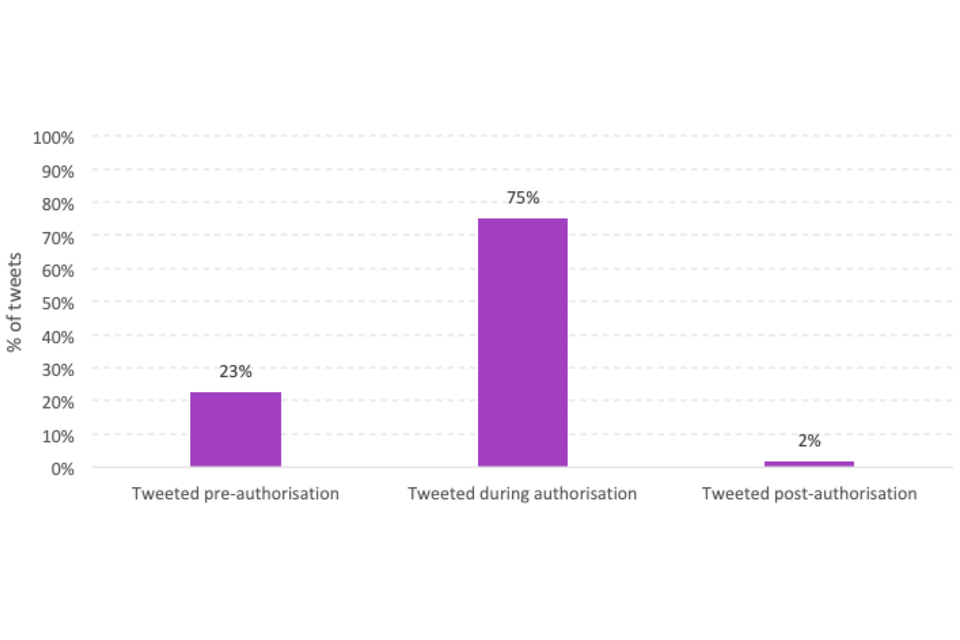
A bar chart comparing the time an authorisation is tweeted in relation to when it is authorised. Three-quarters of tweets are shared during the period covered by the authorisation, while just less than a quarter are shared before the authorisation.
Figure 5.3 gives a more detailed picture of the timing of the tweets and shows that, within the authorisation period, they were most commonly tweeted within the first 2 hours.
Figure 5.3: Distribution of tweet timings years ending March 2019 and March 2020 combined, 6 forces
A bar chart showing a detailed breakdown of the distribution of tweet timings. Most of the tweets are concentrated in the 2 hours after an authorisation begins.
Note:
- ‘After’ may include some tweets that took place after the authorisation had concluded.
Limited analysis was undertaken on the content of the tweets. Other research in the policing field (Nikolovska et al., 2020) has shown that tweeting images was positively associated with whether a tweet was retweeted and the number of times it was retweeted, which provides an indication of the extent to which people engage with messages. During the pilot period, across the 6 police forces the proportion of tweeted authorisations that included maps ranged from 0% to 85% with Merseyside having the highest number of tweets that contained maps.
6. Authorisations and searches
This chapter considers the relationship between authorisations, section 60 (s60) stop and search volumes, and outcomes. Although this was not directly covered by the relaxations, it is nonetheless an important dimension of how s60s are undertaken. Officers interviewed in the qualitative research suggested a number of ways in which s60s might help to disrupt serious violent crime. Not all of these depended on the execution of searches – some suggested that it was the s60 authorisation itself that operated as a deterrent, sometimes in conjunction with increased police visibility.
This chapter explores in more detail the year ending March 2020 national data on authorisations and searches. It then goes on to examine the 6-force data to explore change over time and the timing of individual authorisations.
6.1 Authorisations by number of searches: national data
The 805 authorisations in the pilot period[footnote 26] resulted in 17,070 searches (excluding Lancashire[footnote 27]), with a mean of 21 searches per authorisation. Around one in ten authorisations during the pilot period involved no stop and searches, while a further 61% involved 20 searches or less (Figure 6.1). A small proportion of authorisations (4%) involved in excess of 60 searches.
Figure 6.1: Number of searches per authorisation, pilot period
A bar chart showing the number of searches done per authorisation. Most authorisations have 1 to 10 searches, few have more than 60.
Notes:
- Based on all forces.
- For all searches that could be linked to an authorisation.
S60s authorised by chief officers had more searches per authorisation (96 searches) than those authorised by all other ranks. Chief superintendents had the fewest searches per authorisation (8 searches) while inspectors, who were responsible for the majority of s60s, had 15 searches per authorisation on average (see Figure 6.2). The high figure for chief officers partly reflects the fact that chief officers often authorise event-based s60s, which typically involved a markedly higher number of searches per authorisation, 62 searches compared with the overall mean average of 21 searches (see Figure 6.3).
Figure 6.2: Average number of searches per authorisation, by authorising officer rank, pilot period
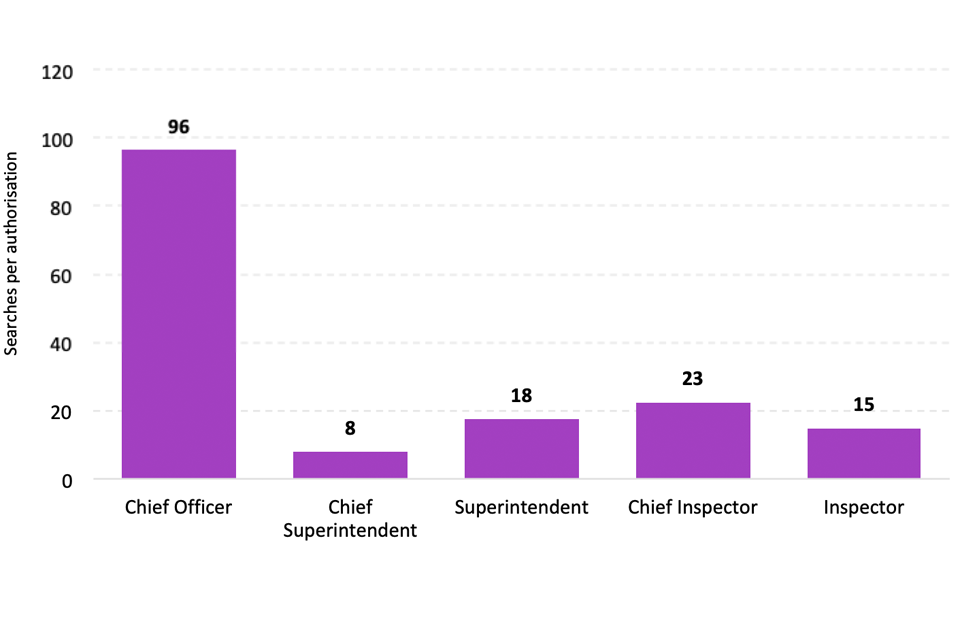
A bar chart showing the average number of searches per authorisation by rank of authorising officer. Chief officer - authorised s60s result in the most searches (an average of 96 per authorisation). The equivalent figure for inspector authorised s60s was 15.
Note:
- Excludes 1,436 searches that were not stated/not linked.
Figure 6.3: Number of searches per authorisation, by rationale, pilot period
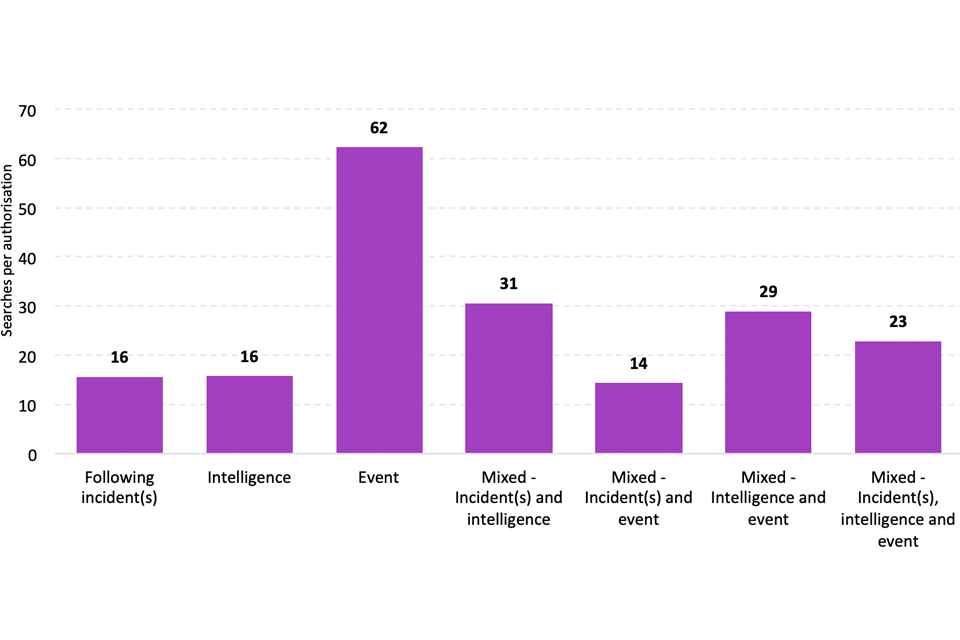
A bar chart showing the average number of searches per authorisation by the rationale for the authorisation. S60s authorised for an event result in the most searches (an average of 62). S60s following incidents on average generated 15 searches.
Note:
- Excludes 1,764 searches that were other/not known/not linked.
It has been well-established that the majority of s60s do not result in a criminal justice system (CJS) outcome (Home Office 2020). When searches linked to an authorisation in the pilot were examined in relation to search outcomes, authorisations with fewer searches had a higher success rate in terms of the proportion of searches resulting in an arrest or CJS outcome, see Table 6.1. Authorisations with between 1 and 10 searches have a success rate of 13%, compared with 7% for authorisations between 51 and 60 searches.
Table 6.1 Searches per authorisation, by outcome
| Number of searches within authorisation | % No further action | % Arrest | % Other CJS outcome |
|---|---|---|---|
| 1 to 10 | 87% | 7% | 6% |
| 11 to 20 | 91% | 4% | 5% |
| 21 to 30 | 92% | 4% | 4% |
| 31 to 40 | 91% | 4% | 5% |
| 41 to 50 | 94% | 2% | 4% |
| 51 to 60 | 93% | 3% | 4% |
| over 60 | 92% | 3% | 5% |
| Total | 91% | 4% | 5% |
Notes:
- Based on all pilot forces.
- For all searches that could be linked to an authorisation.
6.2 Authorisations, by day and time: 6-force data
Analysis of s60 authorisations, broken down by hour of day and day of week in which they were issued, was conducted for the 6-force data for both years ending March 2019 and March 2020.
Figure 6.4 shows the start time of authorisations for the pilot and comparison periods. It shows a cluster of hourly peaks between 2pm and 5pm. Given that most authorisations for the 6 forces lasted less than 15 hours this would mean that authorisations would be in force overnight and expire early the following morning. It is helpful to set this in the context of what is known about the timing of knife assaults. In their study, Vulliamy et al. (2018) conducted an analysis of the timing of hospital admissions for stab injuries to a major urban trauma centre in the UK. Their study focused on those aged 24 and under, but they found that there was a peak in the late afternoon (4pm to 6pm) for the younger victims (those aged 15 and under) and a later peak for young adults (16 to 24 years old). Both of these peaks overlap with concentrations in the timing of s60 authorisations and hence may in part explain their distribution.
Figure 6.4 Number of authorisations, by time of day, 6-force data
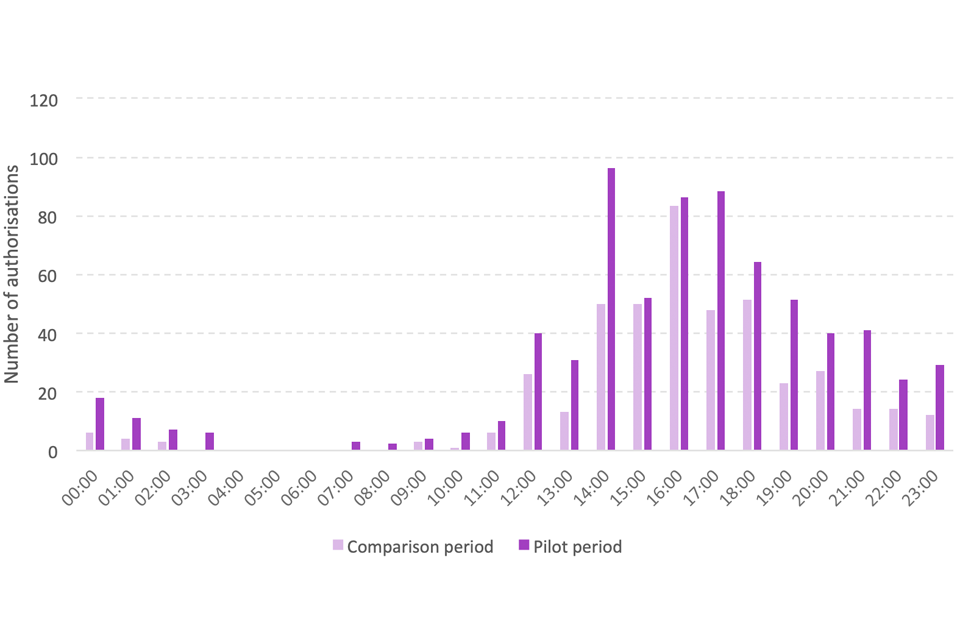
A bar chart showing the distribution of authorisations by the time of day. The distribution of authorisations by the time the authorisation commences is similar for the pilot and comparison periods. Both see a peak in authorisations during afternoons.
Notes:
- For the ‘original’ forces (Merseyside, the MPS, West Midlands) the pilot period is 1 April 2019 to 31 March 2020 and the comparison period is 1 April 2018 to 31 March 2019.
- For the ‘later’ forces (BTP, Cheshire, Kent) the pilot period is 12 August 2019 to 31 March 2020 and the comparison period is 12 August 2018 to 31 March 2019.
- Pilot period n = 709.
- Comparison period n = 434.
Figure 6.4 shows the pattern of authorisations by day of week. This peaks towards the end of the working week, with the highest number of authorisations taking place on Fridays in both the pilot and comparison periods. This is in line with a well-established pattern of increased levels of serious violence towards the latter part of the week and weekend.
Figure 6.5 Number of authorisations by day of the week, 6-force data
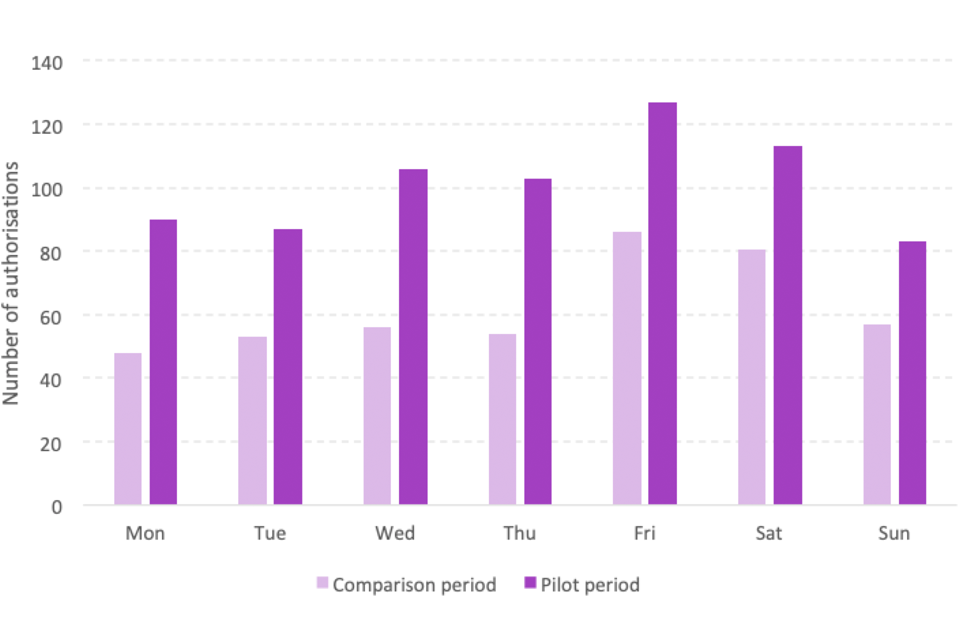
A bar chart showing the distribution of authorisations by the day of the week. There is a modest increase in authorisations on a Friday and Saturday compared to the rest of the week.
Notes:
- For the ‘original’ 7 forces the pilot period is 1 April 2019 to 31 March 2020 and the comparison period is 1 April 2018 to 31 March 2019.
- For the ‘later’ forces the pilot period is 12 August 2019 to 31 March 2020 and the comparison period is 12 August 2018 to 31 March 2019.
- Pilot period n = 709.
- Comparison period n = 434.
6.3 Factors affecting search volumes and arrests
Some exploratory analysis of s60 stop and search volumes and arrests was undertaken using regression modelling on both the bespoke dataset and data from 5 of the 6 forces for the year ending March 2020 pilot period.
For search volumes, the bespoke data analysis found that, controlling for other factors for which data were available[footnote 28], duration of authorisation was a significant predictor of search volumes. The 5-force data search volumes model found that in addition to duration, the size of area and start time were significantly associated with search volumes.
For arrests, the bespoke data analysis suggests that, controlling for other factors for which data were available, volumes of searches were significant predictors of the likelihood of at least one arrest being made during the authorisation.[footnote 29] The 5-force data model also found volume of searches to be a significant predictor.
In most of the models officer rank was not found to be a significant predictor of searches/arrests. Appendix C provides fuller details on the analysis and specific findings.
7. The geography of s60 authorisations
This chapter focuses on the geography of section 60 (s60) authorisations. Although the geographical parameters of s60s were not directly affected by either the April or August relaxations, some interviewees suggested that the move to inspector rank had led to more focused geographical targeting of authorisations. Detailed geographical analysis is also an important evidence gap around the use of stop and search (Weisburd et al., 2015).
The following analysis is based on 1,002 s60 authorisation boundaries for 5 out of the 6 forces’ data, for the years ending March 2019 and March 2020. The sixth force, the British Transport Police (BTP) was not included as all of the authorisations were linked to rail-based locations and were therefore markedly different to those in territorial forces.[footnote 30] In total, areas were calculated for 88% of the 5-force sample (see Appendix A for details).[footnote 31]
Police forces used a variety of area classifications to set boundaries for their authorisations including local authority areas, postcode areas and wards. Geographical breakdowns unique to individual forces were also used, for example ‘neighbourhoods’ in the West Midlands. Occasionally, bespoke areas were created using local roads as boundaries.
As shown in Figure 7.1, authorisations showed a heavily skewed distribution in terms of the size of area, with a small number of very large areas. Of the 1,002 authorisations, around 5% covered an area greater in size than Middlesbrough (54km2). Around half of authorisations were under 15km2, similar to the area covered by Heathrow Airport and 1% were less than 0.3km2, similar to the size of St James’s Park in London. The single largest s60 boundary covered an area just over 270km2, covering the City of Birmingham, which was used on several occasions by West Midlands Police.[footnote 32]
Figure 7.1: Authorisations, year ending March 2019 and year ending March 2020, ranked by area size in square kilometres
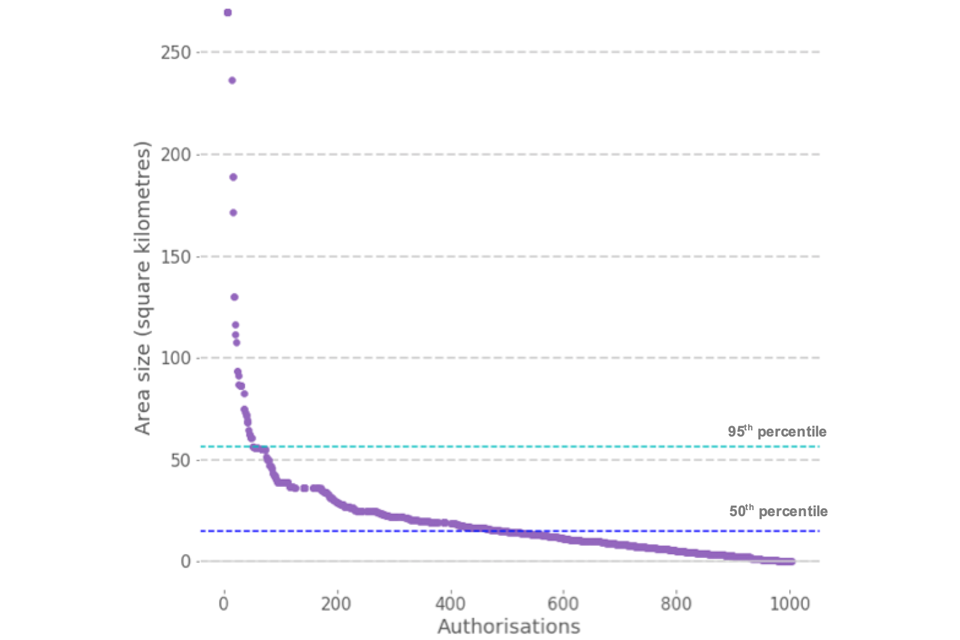
A scatter plot showing the size of the authorisation areas in square kilometres. The graph is heavily skewed with most authorisations covering relatively small areas and a handful of authorisations covering large areas in excess of 50 square kilometres.
Note:
- n = 1,002.
Table 7.1 compares the s60 areas for the pilot and comparison periods. The median size of the MPS search area was smaller for the pilot period (16.0km2) relative to the comparison period (19.1km2). This represents a statistically significant difference in the distribution of the size of authorisation areas in the year ending March 2020 compared with the year ending March 2019.[footnote 33] The table also includes figures for the other forces in question (excluding the BTP). These forces typically had much smaller authorisation areas than the MPS. All except the MPS saw an increase in median size between the comparison period and pilot period. No statistical tests were undertaken on non-MPS data due to small sample sizes. Kent had no authorisations in the comparison period.
Table 7.1: Relationship between s60 authorisation area size, by force between pilot period and comparison period
| Force | Median s60 authorisation area size (km2): comparison period | Median s60 authorisation area size (km2): pilot period |
|---|---|---|
| Cheshire | 0.7 (n=6) | 2.4 (n = 8) |
| Kent | - | 0.8 (n = 32) |
| MPS | 19.1 (n = 304) | 16.0 (n = 542) |
| West Midlands | 6.2 (n = 28) | 6.4 (n = 11) |
| Merseyside | 1.3 (n = 6) | 9.6 (n = 56) |
Note:
- Nine boundaries were not included in the table counts, which were recorded outside of the time period of comparison for Kent (one boundary) and Cheshire (8 boundaries).
For the comparison period, 2 time periods were used, depending on when the pilot was introduced for each police force. Cheshire and Kent had a comparison period from 12 August 2018 to 31 March 2019 and a pilot period from 12 August 2019 to 31 March 2020. The MPS, Merseyside and West Midlands had a comparison period comprising the year ending March 2019 and a pilot period the year ending March 2020.
One way of measuring the geographical concentration of authorisations is to count how many were wholly or mainly located within each local authority (LA) area. Table 7.2 presents data on authorisations by LA area. The first 2 columns of Table 7.2 apply a strict definition of overlap, such as any authorisation that extended into another LA, no matter how small the overlap, would be classified as covering 2 LAs.[footnote 34] Using this rule, 26% of authorisations took place within a single LA in the year ending March 2019, compared with 35% in the year ending March 2020. However, this approach ignores the fact that a substantial number of authorisations that overlapped neighbouring LAs were actually predominantly located in a single LA area. To allow for this, the data were re-coded. If no more than 5% of an authorisation’s total area was located within a neighbouring LA it was coded to a single authority.[footnote 35] Applying this ‘5%’ rule showed that 62% of authorisations were wholly or predominantly concentrated in a single LA in the year ending March 2019. The equivalent figure for the year ending 2020 was 67%.
Table 7.2: Proportion of s60 authorisations that covered one or more local authority areas (5 police force data1), year ending March 2019 and year ending March 2020
| Number of local authority areas covering s60 authorisations | Proportion of all authorisations: no adjustment | Proportion of all authorisations: no adjustment | Proportion of all authorisations: applying a 5% adjustment2 | Proportion of all authorisations: applying a 5% adjustment2 |
|---|---|---|---|---|
| Year ending March 2019 | Year ending March 2020 | Year ending March 2019 | Year ending March 2020 | |
| 1 | 26% | 35% | 62% | 67% |
| 2 | 11% | 22% | 24% | 25% |
| 3 | 17% | 14% | 8% | 5% |
| 4 | 12% | 11% | 3% | 2% |
| 5 | 12% | 10% | 3% | 0% |
| 6 | 17% | 5% | 0% | 0% |
| 7 | 5% | 2% | 0% | 0% |
| Total number of authorisations | 344 | 658 | 344 | 658 |
Notes:
- Cheshire, Kent, Merseyside, MPS and West Midlands.
- No more than 5% of the total area of an authorisation was in a neighbouring LA area or areas.
Figure 7.2 draws on the adjusted (‘5%’) data for the MPS area and shows the high concentration of s60s taking place in a relatively small number of boroughs. In the year ending March 2019, one borough had over 50 authorisations using this measure. By contrast, there were 24 boroughs with fewer than 20 authorisations. Three outer London boroughs had no s60 authorisations in the year ending March 2019. In the year ending March 2020 the pattern shifted slightly, with 4 boroughs having more than 50 authorisations. Every borough within the MPS area contained at least one s60 authorisation in the year ending March 2020. The equivalent combined figures for Cheshire, Kent, Merseyside and West Midlands police force areas are shown in Figure 7.3. Overall, the count of authorisations per local authority were lower than the MPS.
Figure 7.2: Number of authorisations that were wholly or largely within local authority areas, year ending March 2019 and year ending March 2020: MPS
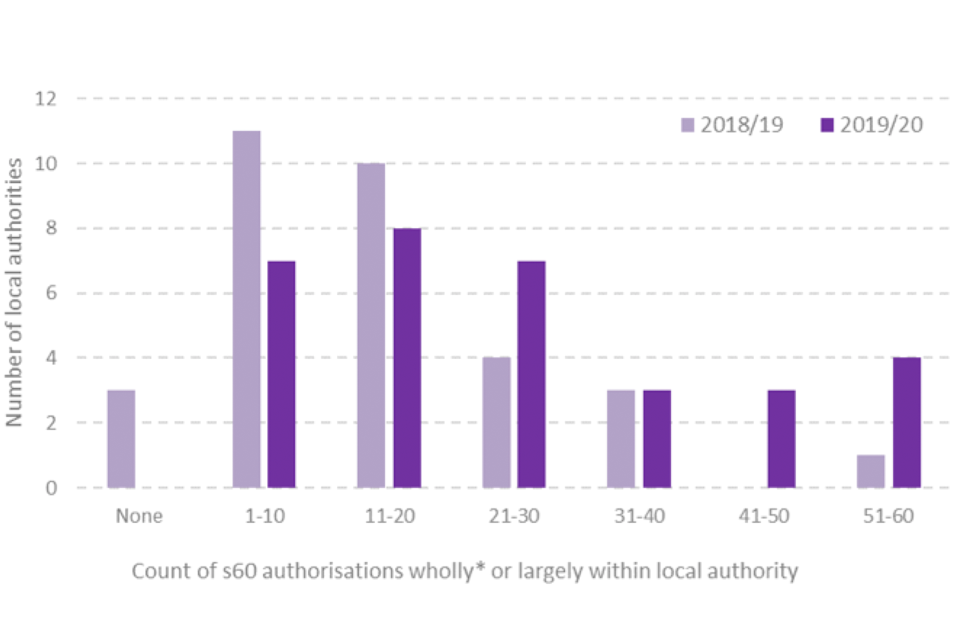
A bar chart showing 2 years of data on the local authorities where authorisations take place in London. A relatively small number of boroughs in the MPS area account for heavy concentrations of s60s.
Note:
- A s60 authorisation was wholly attributed to a single LA if no more than 5% of the total area covered by the authorisation was in a neighbouring LA area (or areas) n = 846 authorisations, 32 local authorities.
Figure 7.3: Number of authorisations that were wholly or largely within local authority areas, year ending March 2019 and year ending March 2020: Cheshire, Kent, Merseyside and West Midlands police force areas, combined
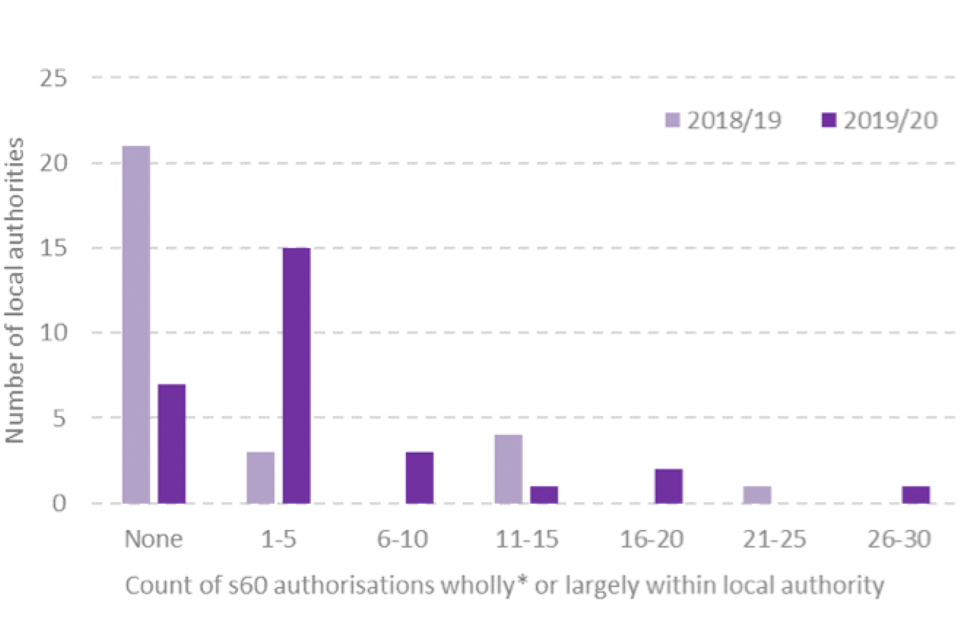
A bar chart showing 2 years of data on the local authorities where authorisations take place in Cheshire, Kent, Merseyside and West Midlands police force areas. Most local authorities have none or few authorisations.
Notes:
- A s60 authorisation was wholly attributed to a single LA if no more than 5% of the total area covered by the authorisation was in a neighbouring LA area (or areas).
- n = 156 authorisations, 23 local authorities.
The next section examines the relationship between search volumes and size of authorisation area, and draws on data for both year ending March 2019 and year ending March 2020, for all 5 forces. Figure 7.4 plots this relationship graphically. The analysis suggests that there is a very weak relationship between s60 area size and search volumes. In other words, large authorisation areas do not necessarily equate to high search volumes, and vice versa. Figure 7.4 also reveals the use of identically sized areas being used for multiple separate authorisations, implying the same location is being used on multiple occasions. These are shown through the existence of several distinct vertical lines of individual authorisations, for example, between 35km2 and 40km2.
Figure 7.4: Count of resulting stop and searches compared to the s60 authorisation area size (km2), with extreme outliers removed (n = 967)[footnote 36]
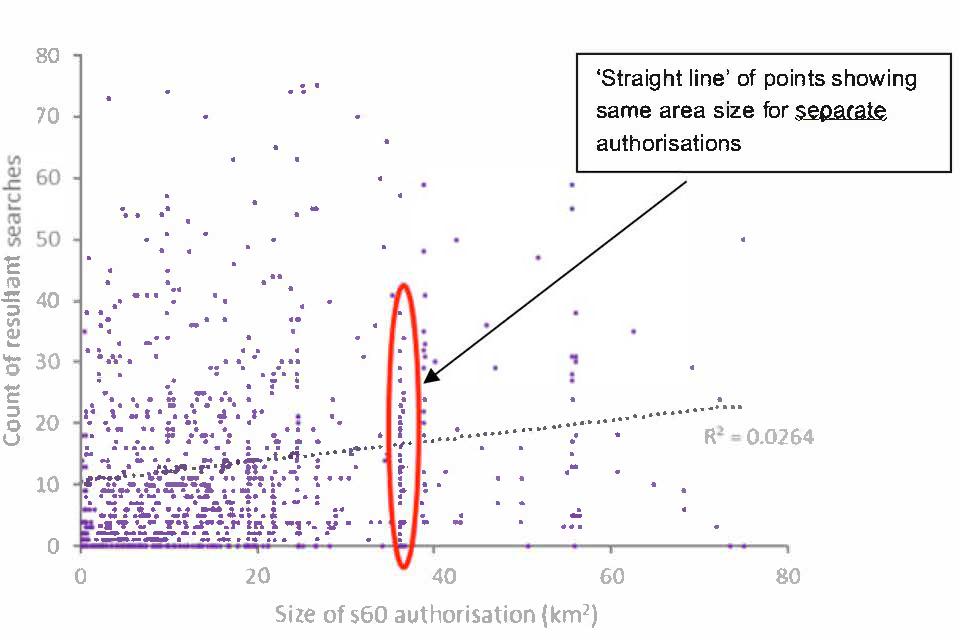
A scatter plot showing a weak relationship between the number of searches and the size of the authorisation area.
Note:
- n = 156 authorisations.
Finally, the relationship between locations of s60 authorisation boundaries and hospital admissions for ‘assault with a sharp object’[footnote 37] are grouped by LA area. This analysis is also based on data where a s60 authorisation was wholly attributed to a single LA if no more than 5% of the total area covered by the authorisation was in a neighbouring LA area (or areas). Figure 7.5 and Figure 7.6 below show the relationship between LA hospital admissions and s60 authorisation counts in the years ending March 2019 and March 2020 respectively in the MPS area. Figures are expressed as rates per 100,000 population rather than counts, to account for variations in populations between the LAs. The analyses show a medium (year ending March 2019) and small correlation (year ending March 2020) between sharp object assault admissions and s60 authorisations, by local authority area. This implies that, to some degree, authorisations are located in areas where there are high knife crime admissions[footnote 38]. Using ‘sharp object assault admissions’ has advantages over police recorded violent crime measures, given the lack of published local knife crime data. However, it has limitations. It will include offences which the police are unaware of, and those which they are aware of but where s60 would not be an appropriate operational response (for example, sharp implement domestic offences). It is not possible to say whether the change in the distribution across the 2 years is related to the introduction of the relaxations.
Figure 7.5: Hospital finished admission episodes (FAEs) for ‘assault with a sharp object’ compared with S60 authorisation counts by local authority, year ending March 2019, MPS area
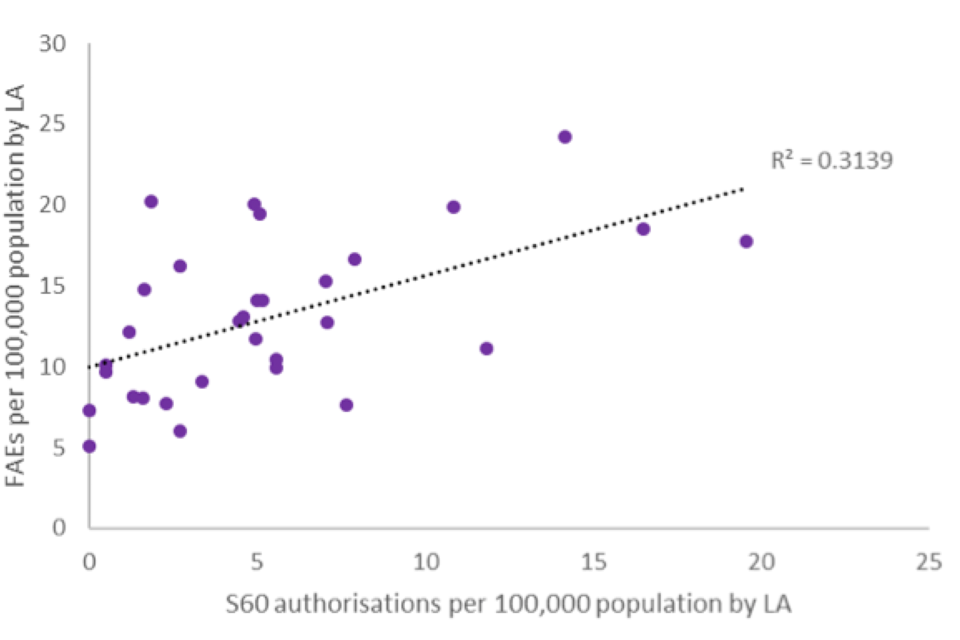
A scatter plot showing the relationship between hospital admissions and the number of s60 authorisations in the MPS area (year ending March 2019).
Note:
- A s60 authorisation was wholly attributed to a single LA if no more than 5% of the total area covered by the authorisation was in a neighbouring LA area (or areas).
Figure 7.6: Hospital finished admission episodes (FAEs) for ‘assault with a sharp object’ compared with S60 authorisation counts by local authority, year ending March 2020, MPS area
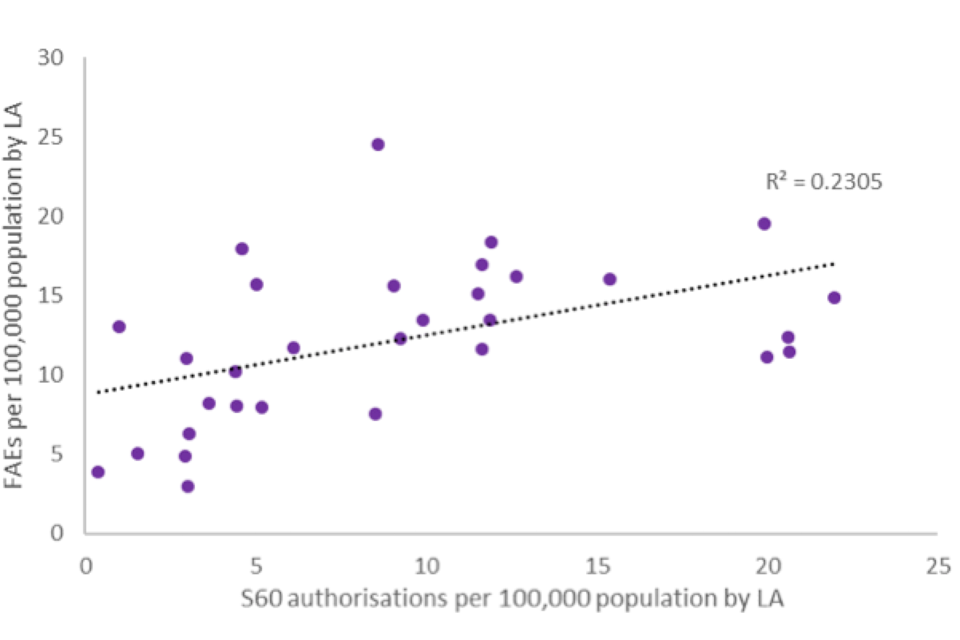
A scatter plot showing the relationship between hospital admissions and the number of s60 authorisations (year ending March 2020).
Note:
- A s60 authorisation was wholly attributed to a single LA if no more than 5% of the total area covered by the authorisation was in a neighbouring LA area (or areas).
8. S60 ‘triggers’
This chapter focuses on the most detailed dataset, extracted from 143 section 60 (s60) authorisation forms supplied by 5 of the 6 police forces for years ending March 2019 and March 2020. These data were drawn using opportunity-based sampling, which means that the findings cannot be generalised to all s60 stop and searches (see Appendix A for further details). However, the analysis provides a greater degree of insight into the range of factors that authorising officers take into consideration when making a s60 decision and complements the qualitative analysis (Smith et al., 2023). First this chapter examines references to incidents and intelligence and then moves on to consider wider issues in the authorisation decision-making process.
8.1 Incidents ‘triggering’ a s60
In total the authorisation forms made reference to 237 separate incidents that formed part of the decision to authorise (the term used here is ‘trigger incidents’). Fewer than one in ten forms did not refer to any specific incident, relying solely on intelligence. Typically, most forms cited 2 incidents, with at least one involving some type of assault. A minority cited a high number of incidents with 5 forms referencing 7 or more.
Figure 8.1: Number of incidents per authorisation
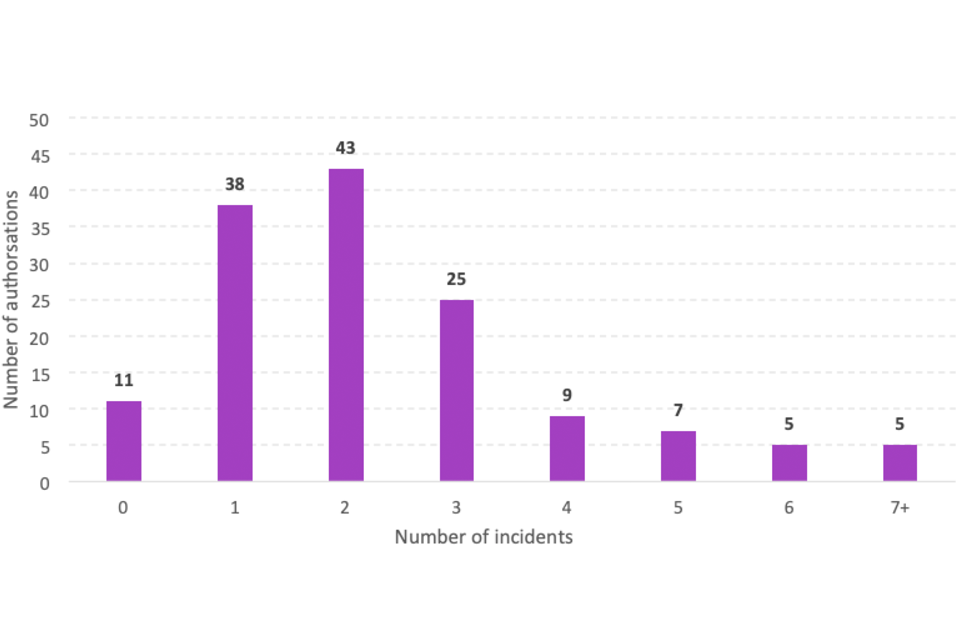
A bar chart showing number of incidents per authorisations. Most authorisations resulted from incidents which involved no more than 2 offences.
Incidents were coded with reference to Home Office Counting Rules for crime (Home Office 2019c). The term ‘incident’ is used, as triggers were not necessarily crimes that were formally recorded by the police. Some came from calls to the police by eye witnesses or third-party reports made by medical practitioners after providing treatment at a hospital.[footnote 39] Most incidents (71%) were only referenced on one authorisation form, but sometimes incidents were mentioned in the rationale of multiple authorisations.
Figure 8.2 shows the types of incident cited in the authorisation forms. Almost all incidents that triggered a s60 involved some form of physical assault, and in a handful of cases, fatalities. Those authorisations that included reference to less serious offences – theft and weapons possession – were invariably cited alongside more serious violent incidents, or specific intelligence on potential future violence. Criminal damage often involved the use of a firearm.
Figure 8.2: Types of incident triggering a s60
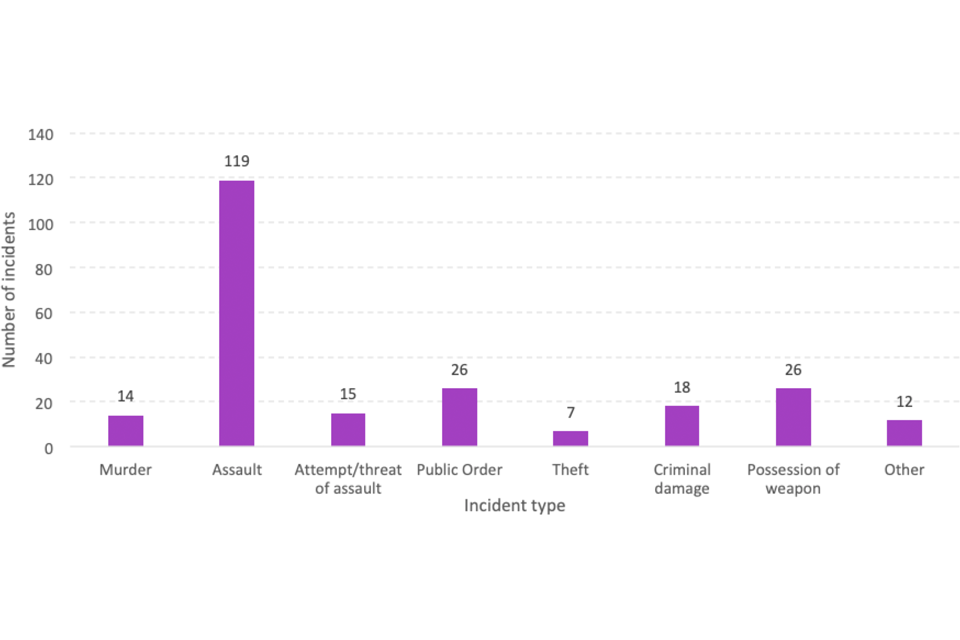
A bar chart breaking down the trigger offences by the incident type. The vast majority of incidents were assaults.
Almost 9 in 10 incidents described in s60 authorisation forms involved the presence or use of a weapon (see Figure 8.3). Looking solely at murders, assaults and attempts or threats of assault, the most common weapon cited was a knife (59%) and over a fifth (21%) of identified weapons referred to were firearms.
Figure 8.3: Presence of a weapon in incidents cited in authorisation forms reviewed
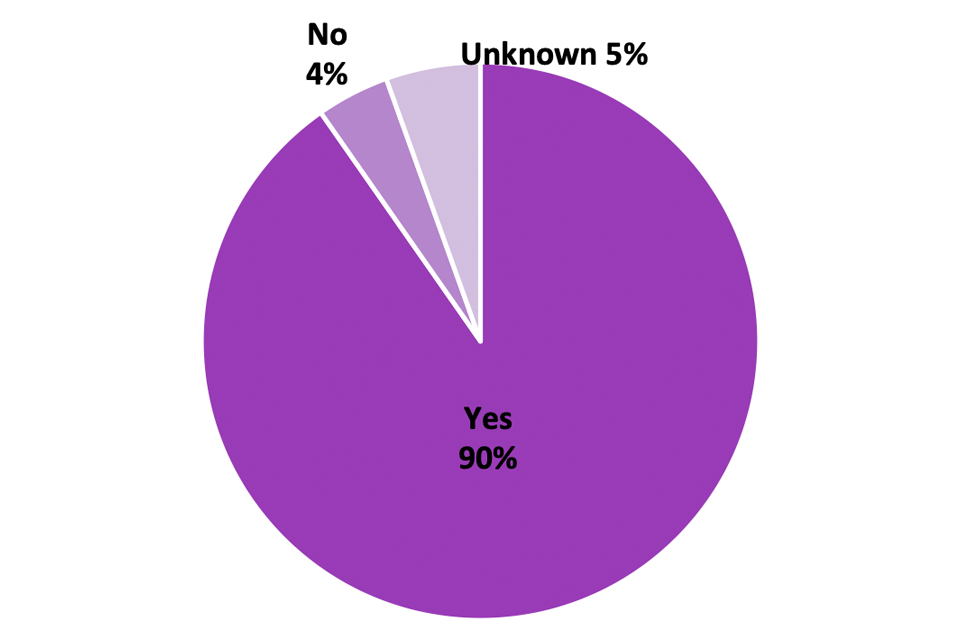
A pie chart showing the proportion of trigger offences in which a weapon was present (90%).
Figure 8.4: Presence of a weapon during murders, assaults and attempts/threats of assault
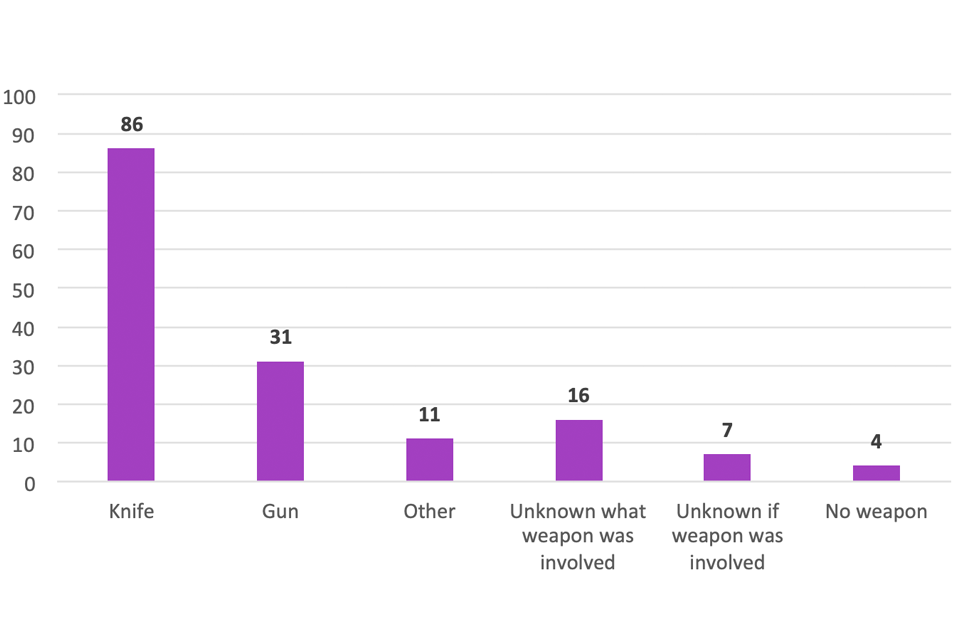
A bar chart showing the weapons used in trigger offences that involved violence or threats. The most commonly cited weapon mentioned was a knife.
8.2 Use of intelligence and data
The quantitative analysis of the rationale for s60 authorisations indicated that the majority of s60s were in response to individual incidents (see Chapter 3). However, the more detailed review of 143 authorisation forms suggested that, regardless of the rationale, police officers often referenced a range of relevant intelligence when making a s60 decision. Often authorisation forms would include references to multiple intelligence reports and incident records. Authorisations that relied solely on intelligence were rare within this sample – less than one in ten authorisations were intelligence-led with no specific reference to a prior incident.
Intelligence was grouped into a small number of discrete categories (see Figure 8.5). By far the most common intelligence material cited related to the nature of local gangs, and the rivalries between them. This was present in around three-quarters of forms reviewed. Less commonly recorded was intelligence on ‘planned’ incidents or violent encounters, such as intelligence that a group of people have arranged to fight at a specific time and location. A handful of authorisations also referenced the use of data analysis as a factor in their decision making. The latter ranged from identifying a hotspot for potential offences to analysis of how the level of crime varied across time of day or day of week, which helped forces to guide how they should best target their resources.
Figure 8.5: Use of intelligence or data analysis
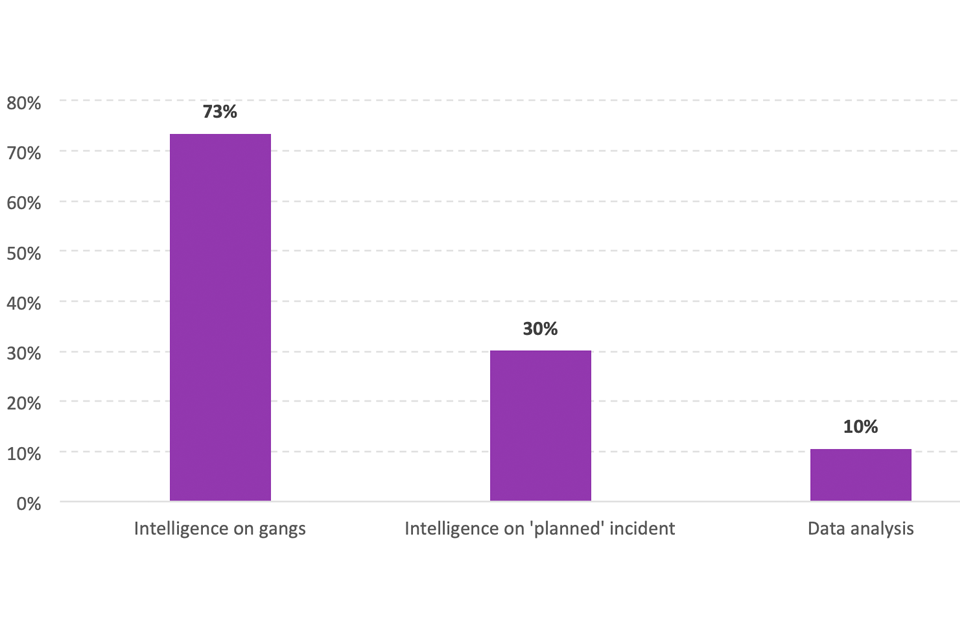
A bar chart showing the type of intelligence drawn up in intelligence-based authorisations. Three-quarters of these authorisations involved intelligence on gangs.
The authorisation form content was also examined to explore if there were any marked differences in the extent to which chief officers and inspectors cited different types of information in the authorisation forms. This revealed that inspectors and chief officers cited the use of gang intelligence more frequently than intelligence relating to a specific anticipated incident. However, it was found to be less common for the inspector-led authorisation forms to refer to the use of wider statistical data, or intelligence on possible future offences, in supporting the case for a s60. Conversely these were more frequently cited in chief officer authorisations. Secondly it was somewhat more common for more chief officer authorisations to include references to alternative tactics than their inspector counterparts. Several factors might be playing out here. The less common references to intelligence around possible future offences might be an artefact of the shift from violence ‘will’ occur to ‘may’ occur, rather than anything related explicitly to authorising officer rank. Or it might be that, in general, for chief officer authorisations in this sample, more effort was put into writing down – rather than simply considering – a wider range of information (future likelihood and quantitative data) to make ‘the case’ to the chief officer.
9. S60 decision making
In the qualitative research (Smith et al., 2023) interviewees articulated the decision-making process around authorisations. In this chapter the decision-making process is analysed using the 143 section 60 (s60) authorisation forms, focusing on 2 aspects:
-
the consideration of alternative and complementary tactics
-
community relations
These themes had been identified as important elements of the decision-making process from the interview analysis. Although there are no national guidelines specifically on when to authorise a s60, the National Decision Model[footnote 40] was identified by some authorising officers as a helpful framework for making s60 decisions. There is some evidence of force-produced written advice on the steps to take when authorising s60s, for instance briefing key stakeholders. As with the previous chapter, these findings cannot be inferred to be representative of all police forces’ decision making. In addition, it is not possible to assume that the absence of information on any aspect of the authorisation indicated that the factor was not considered by the officer preparing the document. It merely indicates that it was not recorded. The split of authorisation forms by rank of officer is given in Figure 9.1. Although forms covered both the pilot and comparison periods, a majority (n = 111) covered pilot period authorisations.
Figure 9.1: Authorisations, by rank
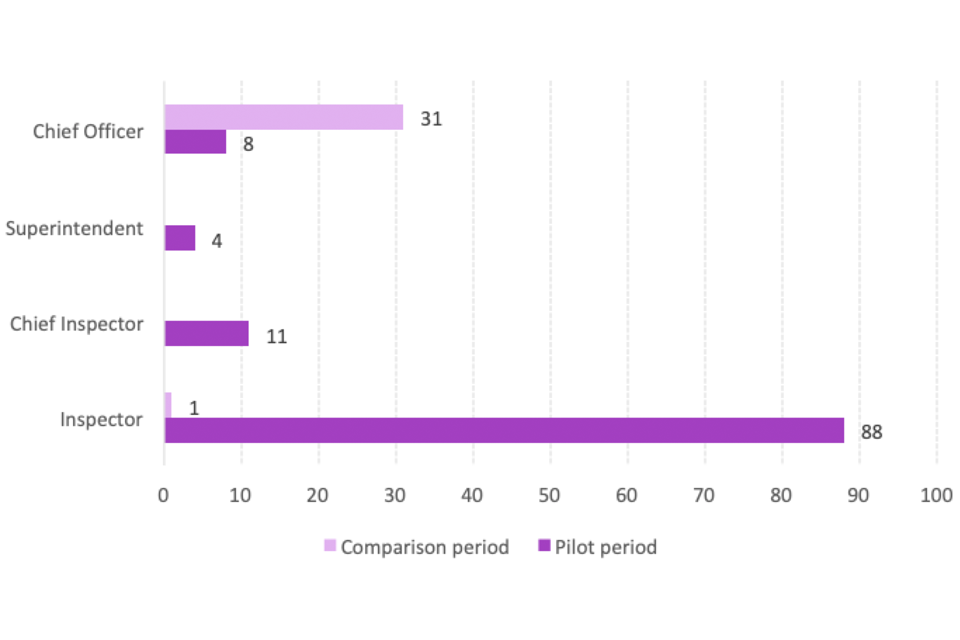
A bar chart showing the number of authorisations by rank for both the pilot and comparison periods. For the pilot period most authorisations were done by inspectors.
9.1 Alternative and complementary tactics
The National Decision Model references the need to consider the appropriateness of particular powers, and alternatives. Just over one quarter of the s60 authorisation forms reviewed make explicit reference to a tactic or approach other than a s60 being considered, with some forms citing multiple alternatives.
The 3 most commonly referenced alternative approaches were searching under section 1 of the Police and Criminal Evidence Act 1984 (s1) powers (which require specific grounds for suspicion of an individual), dispersal orders, and direct engagement with known offenders.
Reasons provided on the forms for rejecting s1 included not knowing the identities of those individuals thought to be at most risk of carrying out offences or fearing that officers would not have the time to develop grounds before a violent incident occurs. These concerns were attributed by the officers to previous related attacks being unprovoked and weapons being concealed. Dispersal orders were almost as frequently cited as s1 stop and searches. Although considered as an alternative tactic to s60s, dispersal orders were also sometimes used alongside s60 authorisations to better manage locations where groups of people were expected to gather.
Direct engagement with offenders manifested itself in a number of ways. Sometimes the approach was described in terms of simply arresting individuals where evidential thresholds could be met or making ‘home visits’ to actively dissuade them from being involved in future violence. Here too, it was possible for offender engagement to be proposed as complementary to, or as an alternative to, a s60 authorisation. A handful of references were made to longer term approaches to address serious violence, but the s60 was invariably considered as being necessary alongside this.
Figure 9.2: Consideration of other tactics

A diagram illustrating the alternative tactics considered to use of a s60 cited within authorisation forms. The 3 specific alternative tactics that were most frequently considered were s1 Police and Criminal Evidence Act 1984 (PACE) searches, direct engagement with the offender and dispersal orders.
9.2 Consideration of community impact and engagement
Just under half of the authorisation forms explicitly referenced community impact issues within the decision-making process. However, both the specific concern, and the ‘community’, varied from form to form. Most commonly mentioned were references that articulated the risk to the local community, if the predicted serious violence took place. Around one quarter of all forms mentioned the positive impact on public confidence that the secondary benefit of increased visible policing in the area would bring. The impact of searching individuals was mentioned less frequently, in around one in ten forms. Where there was evidence of considering community impact, just over half of these authorisation forms considered one form of impact, while the remainder showed evidence of thinking about multiple impacts.
Figure 9.3: Community impact considerations

A diagram illustrating the main types of community issues considered in the authorisations. Community risk and community confidence were the most common themes cited.
The authorisation forms reviewed often recorded occasions when police forces contacted individuals with an interest in the use of s60s, either due to their association with a local area or because of their involvement with a scrutiny group, or similar. As Figure 9.4 shows, the forms most commonly referenced contact was with community scrutiny leads, while a smaller number recorded approaching relevant MPs or local councillors. Fewer still recorded speaking to local members of the community (for example, contacts from local schools and businesses). Community contacts were generally informed about the authorisation rather than asked for their views on a s60 going ahead. However, there were instances when views were sought prior to the decision being taken. Almost 2 in 10 of those forms that referenced discussions with the community mentioned the force had support for that specific s60 being in place. Widespread communication with the community, through social media or force press announcements, was also recorded in the forms.
Figure 9.4: Force communication with community members

A diagram illustrating police contact with the community cited in authorisations. Most of this was undertaken via scrutiny contacts.
The authorisation forms were then examined to see if there were any further differences in the extent to which chief officers and inspectors cited different types of information. This revealed that it was equally as common for authorisations by inspectors and chief officers, to either record consideration of community issues in their decision making, or to contact members of the community to provide information or discuss the authorisation.
10. Concluding remarks
This report has drawn together data from a range of different sources to provide an insight into the relaxations of the use of section 60 stop and searches (s60s). The findings should be considered alongside the detailed qualitative report (Smith et al., 2023) covering police officers’ and community scrutiny leads’ views on the relaxations, and s60 more widely. In this concluding section, the main statistics around the relaxations are reviewed including data on geography and communication of s60s, alongside information from 143 authorisation forms. Where helpful, these have been supplemented with insights from the qualitative analysis. This chapter examines each relaxation in turn except for the change from serious violence ‘will’ occur to ‘may’ occur, as this is not covered directly by the statistical analysis but is explored in the qualitative report.
10.1 Lowering of the authorising rank
It is possible to say with confidence that the relaxations appear to have led to a very marked change in rank profile of authorising officers. Almost all the police forces that used s60s responded to the April rank relaxation by moving to lower ranks authorising s60s in most cases; 85% of authorisations in the pilot period were initially authorised by an officer of the rank of inspector. Just 5% were authorised by a chief officer, the majority of these being in the West Midlands. Eight forces continued to authorise s60s with a chief officer in one or more authorisations. A strong finding from the qualitative research was that forces put in place review processes and safeguards, which allowed senior ranks to input into the decision making of live authorisations or review them retrospectively.
10.2 Timing of authorisations and extensions
There seems to be a clear distinction between the 7 ‘original’ forces in the pilot and the ‘later’ forces (the remaining forces and the British Transport Police (BTP)) in terms of their response to the extension of the initial duration moving from 15 to 24 hours. There was little evidence that the ‘original’ forces changed their duration profile when the change was introduced in August 2019. In the relevant pilot period only 3% of authorisations were between 16 and 24 hours in length for the ‘original’ forces. A different pattern emerged for the ‘later’ forces with 52% of authorisations lasting this long. This finding is consistent with the qualitative research, which suggested awareness of this relaxation was higher for the ‘later’ forces. The average length of initial duration is relatively stable between 10 and 12 hours. Generally, forces seemed to prefer a series of new sequential authorisations to the use of extensions. Extensions rarely took place and there is no evidence to suggest that the relaxations around the timing and officer rank of these increased their use.
10.3 Communication of authorisations using Twitter
The August relaxation on communication of authorisations took away the requirement for s60s to be communicated to the public in advance. However, from the qualitative work it is clear that most authorising officers and stop and search leads felt that communication of authorisations was critical to their execution and served multiple purposes (transparency, reassurance and deterrence). Some of the ‘later’ forces – which had a higher awareness of this relaxation as they received it as part of a wider package of changes – did not formally adopt the policy. Therefore, for several reasons, it would be unexpected to find any evidence of this relaxation being fully embraced by police forces. Although some interviewees acknowledged that speed or special operational conditions would sometimes necessitate not communicating with the public, these occasions were felt to be infrequent. The overall picture is that for the forces analysed, just over half of authorisations were tweeted, and this tended to take place either before or during the authorisation. Although Twitter was often mentioned as a means of communicating with the public in the qualitative research, the Twitter analysis on its own can only provide a limited insight into the impact of the relaxation.
10.4 More focused geographical targeting
There was no explicit relaxation around geographical targeting. However, some officers in the qualitative research suggested that authorisations had become more geographically focused over time, although others challenged this assertion. All except the MPS saw an increase in median size between the comparison period and pilot period. The median size of the MPS authorisation areas decreased between the comparison and pilot periods and the difference was statistically significant. However, it is not possible to attribute this change to the relaxations. What the geographical analysis does reveal is that, the size of authorisation areas varies widely and, within forces, s60 authorisations are often highly concentrated in a small number of locations.
10.5 The relationship between the relaxations and increased usage of s60
Across the pilot period[footnote 41] s60 stop and search volumes went up by around a third. Although this was a smaller percentage increase than for the more voluminous s1 stop and searches (52% increase), which were unaffected by the relaxations. What is clear from the overall data on s60 volumes in the pilot and comparison periods is that, at the force level, year-on-year changes are fluid. The MPS continues to account for the vast majority of s60 searches but beyond this the pattern in other police forces is variable. Some forces did increase their use of s60 during the pilot period but others remained low or non-users. A relatively high using force – West Midlands – recorded large falls in s60 use during the pilot. Implicitly wider force-level policy over the use of s60s can change from year to year and, of course it is impossible to discount the impact of changes in serious violent crime volumes as a factor in driving s60 numbers.
The period covered by the relaxations sees another important change in the wider sphere of serious violence, which is likely to have influenced stop and search numbers. In particular, the Serious Violence Fund distributed additional monies to the 18 police forces that accounted for the majority of knife injury hospital admissions in England and Wales. These forces overlap heavily with those accounting for a large number of stop and searches during the s60 pilot. This combination of changes makes any assessment of the impact of the relaxations on s60 volumes very challenging, particularly given the all-encompassing coverage of the pilot from August 2019.
The qualitative analysis also provides some useful insights into the way that police officers reacted to changes in the conditions that permit the use of s60 over time. The individual relaxations may play some part in encouraging more frequent use of the power and the near universal shift to inspector looks by far the most influential change. However, the interviews imply that what may be more critical is the wider messaging that the relaxations convey, by instilling greater confidence in the use of the power (Smith et al., 2023).
The qualitative and quantitative research was undertaken to help to inform the decision around the pilot relaxations in the use of s60 authorisations. In addition, however, it has also shown how police forces have opted to institute internal review mechanisms alongside the lowering of the authorising rank. The extent to which all forces have an accurate overall picture of their use of s60 is less apparent. To build on this, regular reporting on the distribution of s60s in both time and in individual neighbourhoods would appear to be a useful additional component of internal force-level monitoring and review.
11. Appendix A: Methodological detail
Dataset one: s60 geography and timing data
Information relating to the time or location targeted by the section 60 (s60) authorisations was extracted from data provided by 5 forces[footnote 42] (excluding the British Transport Police (BTP)).[footnote 43] These were sourced from either police force administrative data or, in 2 instances, the relevant data had already been collated due to a Freedom of Information request being submitted to those forces. These data generally contained, for each authorisation: the rank of the authorising officer, the start time and date, and the length and location of the authorisation.
For each authorisation a mixture of open text geographical information and force-generated maps allowed the creation of bespoke digital maps – ‘shapefiles’ – using geographical software (QGIS). The shapefile illustrated the shape, size and geographic location of the boundaries for each s60 authorisation. This enabled the size of the area covered by each s60 authorisation to be calculated.
Where the text description referred to common geographical boundaries like wards, boroughs or post codes, pre-existing shapefiles for those authorisations were used. Where authorisations covered areas with no predefined boundaries (such as specific roads), bespoke shapefiles were created to match the authorised area. In some instances where an authorised area was described in less precise terms, clarification was sought from the police force on its boundaries. Each shapefile was given an identifier that corresponded to an entry for a unique authorisation in the analysts’ database.
A range of methods were used to quality assure the shapefiles, including random spot checks comparing the digitised shapefiles with the original descriptions and maps provided by the forces. Maps with exceptionally large boundaries were also reviewed and verified individually. For the 5 forces, a total of 1,002 authorisations had sufficient information to generate shapefiles, 344 in the year ending March 2019 and 658 in the year ending March 2020, equivalent to 87% of the combined 2-year sample across the 5 forces; 152 authorisations had missing geo-coded data across both years.
Analysis was carried out to calculate the size of the areas authorised with emphasis placed on identifying any differences before and during the pilot or between police forces. The density of authorisations was also assessed to see the extent to which they were concentrated in particular locations.
Dataset 2: s60 Twitter data
To gather information about which s60 authorisations were communicated to the public, searches were conducted using all 650 known official Twitter accounts for the 6 police forces (the 5 forces in dataset one above plus the BTP) from April 2018 to April 2020. These included accounts belonging to the forces, units, boroughs, districts and neighbourhoods. Twitter was chosen for this as, based on discussions with the forces, it was felt to be one of the most commonly used forms of social media. Twitter also allows for accurate analysis of when the s60 was communicated as each tweet is time stamped. This was critical for the analysis as it was important to examine whether the s60 was communicated before, during or after an authorisation. Relevant tweets were identified using key word searches[footnote 44] and the results were linked to the relevant s60 authorisation using administrative data on the time and location of each authorisation. This approach accounted for the majority of the tweets identified. For the police forces with low numbers identified, and for authorisations without a tweet, other tweets were located by reading all the tweets posted on the days surrounding a s60 authorisation.
In one police force area where a relatively low number of tweets were identified, the key word approach was supplemented with a full search of their tweets, looking at both the day of the authorisation and one either side of it. However, this process did not identify any further authorisations. Another force provided data on whether the s60 was publicised or not which was cross-checked on Twitter to ensure the accuracy of that dataset. For the Metropolitan Police Service (MPS), their central Twitter account was searched along with those for all 32 London borough accounts. For boroughs with low proportions of tweets, the ‘people finder’ function was used to identify ways to locate other relevant tweets. For example, Twitter accounts of some of the police neighbourhood teams were searched using the key words. This approach identified tweets for a further 12 authorisations.
The data extracted were recorded in an Excel spreadsheet and included the Twitter account, the date and time stamp and the text contained in the tweet. The authority ID, police force, date of authority, the geography it covered and whether a map was included in the tweet, were all recorded. For the MPS boroughs the authorisation covered was also coded.
For a tweet to be recorded as a communication about an authorisation, it needed to refer to the s60 (in full or abbreviated form) or mention that extra stop and search powers had been granted. In total, tweets were located and attached to 586 of the 1,154 authorisations across the 6 forces, across the 2 years.
Dataset 3: s60 ‘triggers’ and decision-making data
Information on the factors that had been considered when making a s60 decision was extracted from 143 s60 authorisation forms for the years ending March 2019 and March 2020, which were supplied by 5 of the 6 police forces that participated in the qualitative study (Smith et al., 2023). The method of collection and coverage varied by police force, due to factors such as the volume of their authorisations and because of this the analysis should be treated as purely indicative. The use of documentary evidence as a qualitative method – such as authorisation forms – has a long history (see for instance Bowen’s overview of the method, 2009).
While drawing on documents has many advantages, it is not without limitations. One of the main constraints of this analytical approach is the potential bias arising from the structure of the document forms themselves. This encourages certain types of information to be recorded over others, since documents will tend to reflect organisational principles. In addition, since this analysis is focused on decision making in authorisations, special care needs to be taken in inferring that the absence of a written reference equates to its absence from the ‘active’ decision making process.
These forms included information on:
-
what evidence had been considered when making the authorisation decision
-
whether there were sufficient police resources to carry out s60 searches
-
what other tactics could be used instead of, or in addition to, the s60
-
how intelligence or data informed the authorising officer’s decision making
-
the possible impact of the s60 on the community
Sensitive information such as personal data were redacted by the police forces before these forms were shared with the analysts.
Evidence of the factors considered in each authorisation were categorised as either present or not, for example, whether the s60 could access additional police resources or not. These factors were split into more granular categories where possible, for example, recording what specific alternative tactic had been considered instead of a s60. Details of the rationale for the authorisation were also used to categorise s60s into 6 types, based on the nature of the offences, the intelligence preceding the s60 and its purpose.
The authorisation forms were also used to extract data on the trigger incidents relevant to the authorisation. However, these data were incomplete on the forms, with many instead including a crime reference number.
Trigger incidents were analysed in each authorisation; many authorisations referenced multiple incidents and some were relevant to more than one s60 authorisation. These were categorised by the type of offence, whether there was a weapon present and if so, what it was. The analysts considered whether it was possible to analyse data on victim characteristics but too much data were missing to carry out this aspect of the analysis.
12. Appendix B: Resolving data discrepancies
In addition to the quality assurance process described in section 2.3, data discrepancies and other quality assurance issues were dealt with in the following ways:
-
In 6 cases clear duplications of authorisations were identified in the data, therefore one of the 2 authorisations were deleted; 5 duplications were resolved internally however, in one case where there were slightly different timings on otherwise identical authorisations, checks were made with the force on which authorisation to retain
-
Following the Twitter searching, 26 tweets relating to s60 authorisations were found that could not be matched exactly to a known authorisation; for these tweets the following steps were taken:
- For 2 unmatched BTP tweets, authorisations from other forces were examined and the tweets were successfully matched to authorisations in the data using geography and start and end date/time
- Two tweets matched on geography and day of authorisation (but not time) so tweets were matched to those authorisations; the time within the admin data rather than the tweet was accepted as accurate, in 2 cases tweets referred to extensions and so were matched to the original authorisations
- In one case a tweet was not on the same day as a known authorisation, but when the tweet content was examined the tweet had occurred retrospectively and so could be matched accordingly
- For the remaining 19 unmatched tweets, the force was asked to verify whether there was an authorisation that day. In one case the force was able to match the tweet to an authorisation in our data; in 10 cases the force confirmed the authorisation using their own records and the authorisation was added into the data using details given by the force; in 8 cases the force could not confirm an authorisation for that day and so the tweet was considered to have been posted in error and was not included in the data
13. Appendix C: Exploratory regression analysis on s60 search volumes and arrests
Additional exploratory analysis was undertaken to identify which variables are significantly associated with (a) section 60 (s60) search volumes and (b) whether an arrest was made during an authorisation, while controlling for other variables. This analysis used 2 datasets:
-
data from the bespoke s60 statistical data collection covering all police forces in England and Wales for the pilot period[footnote 45]
-
the more detailed data from selected forces that were able to provide more granular data. These data also cover the pilot period only and for this analysis were limited to 5 of the 6 forces[footnote 46]
The analysis was limited to variables that formed part of the 2 collections. For the search volumes model using the bespoke data, 4 predictor variables were considered:
-
the rank of the authorising officer
-
the duration of the authorisation
-
the day of the week
-
the rationale for the authorisation
The analysis on the ‘5-force’ data included these variables and 3 additional variables:
-
the size of the area covered by the authorisation
-
whether the authorisation was tweeted about
-
the time of day the authorisation started
For the arrests model using the bespoke data, 5 predictor variables were considered:
-
the rank of the authorising officer
-
the duration of the authorisation
-
the day of the week
-
the rationale for the authorisation
-
the volume of s60 searches
This analysis on the 5-force data included these variables and the 3 additional variables used in the search volumes model above.
The ethnicity of the person being searched was collected as part of the bespoke data collection and therefore was considered for inclusion in all 4 models. However, as these models focus on the characteristics of the authorisation, rather than on any personal characteristics of those searched it was decided not to include these in the models.
It is likely that unobserved factors, such as those not covered by the data collection, will affect both search volumes and arrests (for example, for search volumes, the characteristics of areas and the resources at officers’ disposal).[footnote 47] The analysis also draws solely on pilot-period data. Both datasets are dominated by MPS authorisations. However, despite these limitations this exploratory analysis helps to provide a better understanding of the key predictors in search volumes and arrests.
The analysis was run in SPSS and an independent rebuild of the main models was undertaken in R. The findings from these closely aligned.
Data
For the search volumes models 713 s60 authorisations were included in the analysis on the bespoke data collection. Eighty-one authorisations were not included because of missing or unlinked data. Nine authorisations that had a duration of over 24 hours were not included due to the low count within that group. A further 2 authorisations were not included, which related to the Notting Hill Carnival, as these were treated as outliers given the very high volumes of searches.
For the ‘5-force’ model 581 authorisations were examined. Sixty-nine authorisations were not included because of missing or unlinked data. The 2 Notting Hill Carnival authorisations mentioned above were not included as part of this. Three authorisations that had a duration of over 24 hours were not included due to the low count within that group.
For the arrests model 654 authorisations were included in the bespoke data collection analysis. In addition to the missing/unlinked exclusions, authorisations exceeding 24 hours and the Notting Hill Carnival outliers, 59 authorisations were also not included as they had 0 searches and therefore no linked outcomes.
In the 5-force model 535 authorisations were included. In addition to the missing/unlinked exclusions and authorisations exceeding 24 hours, 47 authorisations were also not included as they had 0 searches and therefore no linked outcomes.
Table A.C1: Descriptive statistics, bespoke data
| Count of authorisations, searches model (n = 713) | Mean number of searches per authorisation within group (standard deviation) | Count of authorisations, arrests model (n = 654) | % of authorisations within group with at least one arrest | |
|---|---|---|---|---|
| Authorising officer rank | ||||
| Chief Officer | 33 | 27.15 (72.64) | 31 | 32% |
| Inspector | 613 | 15.92(19.91) | 562 | 43% |
| Chief Inspector, Chief Superintendent or Superintendent | 67 | 19.03 (26.09) | 61 | 34% |
| Rationale for authorisation | ||||
| Event or combined rationale involving event | 77 | 23.53 (55.54) | 69 | 46% |
| Following incidents | 383 | 15.44 (19.55) | 348 | 42% |
| Intelligence | 101 | 15.04 (18.49) | 93 | 46% |
| Mixed – incident/intelligence | 152 | 17.64 (16.60) | 144 | 35% |
| Day of the week | ||||
| Monday | 85 | 16.78 (18.73) | 81 | 40% |
| Tuesday | 82 | 13.89 (15.55) | 71 | 41% |
| Wednesday | 108 | 17.29 (42.05) | 96 | 37% |
| Thursday | 106 | 17.97(20.14) | 100 | 40% |
| Friday | 129 | 19.26(25.57) | 124 | 44% |
| Saturday | 117 | 15.62 (17.39) | 105 | 47% |
| Sunday | 86 | 14.86 (26.36) | 77 | 40% |
| Duration of authorisation | ||||
| 0 to 10 hours | 187 | 9.18 (14.43) | 155 | 28% |
| 11 to 15 hours | 455 | 18.97 (27.38) | 434 | 46% |
| 16 to 24 hours | 71 | 22.23 (30.86) | 65 | 45% |
Notes:
- Missing cases, authorisations exceeding 24 hours and Notting Hill Carnival authorisations are not included.
- Searches were not logged for the purposes of this table.
Table A.C2: Descriptive statistics, 5-force data
| Count of authorisations, searches model (n = 581) | Mean number of searches per authorisation within group (standard deviation) | Count of authorisations, arrests model (n = 535) | % of authorisations within group with at least one arrest | |
|---|---|---|---|---|
| Authorising officer rank | ||||
| Chief Officer | 14 | 22.86 (15.50) | 14 | 29% |
| Chief Inspector, Chief Superintendent or Superintendent | 34 | 18.65 (18.90) | 30 | 37% |
| Inspector | 533 | 15.89 (20.31) | 491 | 42% |
| Rationale for authorisation | ||||
| Event or combined rationale involving event | 52 | 19.06 (33.79) | 45 | 47% |
| Following incidents | 313 | 14.51 (18.28) | 284 | 42% |
| Intelligence | 82 | 16.74 (19.74) | 78 | 46% |
| Mixed – incident/intelligence | 134 | 18.76 (17.12) | 128 | 37% |
| Day of the week | ||||
| Monday | 71 | 16.08 (14.74) | 68 | 38% |
| Tuesday | 69 | 14.00 (16.49) | 59 | 41% |
| Wednesday | 90 | 14.00 (14.80) | 81 | 38% |
| Thursday | 86 | 18.07 (19.45) | 83 | 39% |
| Friday | 102 | 20.15 (26.00) | 99 | 48% |
| Saturday | 95 | 14.42 (15.37) | 85 | 47% |
| Sunday | 68 | 15.79 (29.00) | 60 | 38% |
| Duration of authorisation | ||||
| 0 to 10 hours | 166 | 9.61 (15.19) | 141 | 28% |
| 11 to 15 hours | 391 | 18.35 (19.29) | 374 | 46% |
| 16 to 24 hours | 24 | 27.17 (41.79) | 20 | 55% |
| Start time of authorisation | ||||
| 6am to 2:59pm | 160 | 27.06 (29.23) | 153 | 48% |
| 3pm to 8:59pm | 318 | 14.05 (14.18) | 299 | 43% |
| 9pm to 5:59am | 103 | 6.05 (6.78) | 83 | 25% |
| Tweeted | ||||
| Yes | 327 | 16.22 (18.90) | 309 | 39% |
| No | 254 | 16.21 (21.66) | 226 | 45% |
Notes:
- Missing cases, authorisations exceeding 24 hours and Notting Hill Carnival authorisations not included.
- Searches were not logged for the purposes of this table.
- Forces included here are Metropolitan Police Service, Merseyside Police, Kent Police, West Midlands Police, Cheshire Police.
13.1 Findings
Predicting volumes of s60 searches
Bespoke data collection
Table A.C3: Linear regression of logged volume of s60 searches, bespoke data
| Predictor | B | Standard error | Statistical significance | 95% Confidence interval Lower bound | 95% Confidence interval Upper bound |
|---|---|---|---|---|---|
| Duration of authorisation (reference category: 0 to 10 hours) | |||||
| 11 to 15 hours | 0.34 | 0.04 | 0.00 | 0.26 | 0.42 |
| 16 to 24 hours | 0.33 | 0.07 | 0.00 | 0.20 | 0.46 |
| Authorising officer rank (reference category: Chief Officer) | |||||
| Inspector | -0.04 | 0.09 | 0.60 | -0.21 | 0.12 |
| Chief Inspector, Chief Superintendent or Superintendent | -0.03 | 0.10 | 0.81 | -0.22 | 0.18 |
| Rationale for authorisation (reference category: event or combined rationale involving event) | |||||
| Following incidents | -0.05 | 0.06 | 0.42 | -0.17 | 0.07 |
| Intelligence | -0.03 | 0.07 | 0.71 | -0.17 | 0.12 |
| Mixed – incident/intelligence | 0.04 | 0.07 | 0.52 | -0.09 | 0.18 |
| Day of the week (reference category: Wednesday) | |||||
| Monday | 0.07 | 0.07 | 0.28 | -0.06 | 0.21 |
| Tuesday | -0.01 | 0.07 | 0.91 | -0.14 | 0.13 |
| Thursday | 0.08 | 0.06 | 0.20 | -0.04 | 0.21 |
| Friday | 0.13 | 0.06 | 0.04 | 0.00 | 0.25 |
| Saturday | 0.00 | 0.06 | 0.95 | -0.12 | 0.13 |
| Sunday | -0.05 | 0.07 | 0.45 | -0.19 | 0.08 |
| Constant | 0.77 | 0.11 | 0.00 | 0.56 | 0.99 |
Notes:
- n = 713.
- R-square = 0.12. The R-square value indicates how much of the total variation in the number of searches can be explained by the variables in the model.
When all 4 predictor variables were entered into the model, the duration of the authorisation was the only variable found to be statistically significantly associated with search volumes. Generally, the longer the duration of the authorisation, the higher the volume of searches. A significant difference was also found between estimates of the volume of s60 searches resulting from an authorisation commencing on a Friday compared with an authorisation commencing on a Wednesday, where Friday authorisations resulted in a higher volume of searches.
The rank of authorising officer was not found to be a significant predictor of the number of s60 searches resulting from the authorisation. There was no significant difference in estimates of the volume of s60 searches resulting from inspector-led s60 authorisations when compared to Chief Officer-led authorisations. The low R-square value for this model confirms that there are other unobserved variables that affect search volumes.
Five-force data
Table A.C4: Linear regression of logged volume of s60 searches, 5-force data
| Predictor | B | Standard error | Statistical significance | 95% Confidence interval Lower bound | 95% Confidence interval Upper bound |
|---|---|---|---|---|---|
| Duration of authorisation (reference category: 0 to 10 hours) | |||||
| 11 to 15 hours | 0.15 | 0.29 | 0.00 | 0.07 | 0.24 |
| 16 to 24 hours | 0.16 | 0.09 | 0.09 | -0.02 | 0.35 |
| Logged size of the S60 authorisation area | 0.21 | 0.04 | 0.00 | 0.13 | 0.28 |
| Start time of authorisation (reference category: 6am to 2:59pm) | |||||
| 3pm to 8:59pm | -0.25 | 0.04 | 0.00 | -0.34 | -0.17 |
| 9pm to 5:59am | -0.50 | 0.06 | 0.00 | -0.62 | -0.39 |
| Rationale for authorisation (reference category: event) | |||||
| Following incidents | 0.02 | 0.07 | 0.71 | -0.10 | 0.15 |
| Intelligence | 0.10 | 0.08 | 0.18 | -0.05 | 0.25 |
| Mixed – incidents/intelligence | 0.13 | 0.07 | 0.07 | 0.01 | 0.27 |
| Authorising officer rank (reference category: Chief Officer) | |||||
| Chief Inspector, Chief Superintendent or Superintendent | -0.14 | 0.13 | 0.29 | -0.41 | 0.12 |
| Inspector | -0.17 | 0.12 | 0.14 | -0.40 | 0.06 |
| Day of the week (reference category: Wednesday) | |||||
| Monday | 0.10 | 0.07 | 0.15 | -0.04 | 0.23 |
| Tuesday | -0.02 | 0.07 | 0.82 | -0.15 | 0.12 |
| Thursday | 0.08 | 0.06 | 0.20 | -0.04 | 0.21 |
| Friday | 0.15 | 0.06 | 0.02 | 0.03 | 0.27 |
| Saturday | 0.00 | 0.06 | 0.97 | -0.13 | 0.12 |
| Sunday | -0.05 | 0.07 | 0.45 | -0.19 | 0.08 |
| Tweeted (reference category: no) | |||||
| Yes | 0.02 | 0.04 | 0.59 | -0.05 | 0.09 |
| Constant | -0.27 | 0.29 | 0.35 | -0.83 | 0.29 |
Notes:
- n = 581.
- R-square = 0.27.
When all 7 predictor variables were entered into the 5-force model, the size of the area was found to be statistically significantly associated with search volumes. The general pattern was that the larger the area, the higher the volume of searches. Start time was also found to be significantly associated with search volumes, and generally the earlier the start time (in daytime hours) the higher the search volume.
Authorisations lasting between 11 and 15 hours were found to be significantly different to those lasting between 0 and 10 hours.
The rank of authorising officer was not found to be a significant predictor of the number of s60 searches resulting from the authorisation in either model. There was no significant difference in estimates of the volume of s60 searches resulting from chief inspector, chief superintendent or superintendent-led s60 authorisations when compared with chief officer-led authorisations.
Predicting whether an arrest was made during a s60 authorisation
For the arrests model, a linear regression model was initially considered to examine the predictors of the number of arrests. However, it was decided that a more practical approach would be to examine simply whether an authorisation led to one or more arrests compared with no arrests, as most authorisations generated very few arrests.[footnote 48] This therefore favoured a logistic regression model with a binary outcome (1= any arrest, 0= no arrest).
Bespoke data collection
Table A.C5: Logistic regression of whether an arrest was made during a s60 authorisation, bespoke data
| Predictor | B | Standard Error | Odds ratio | Statistical significance |
|---|---|---|---|---|
| Volume of searches | 1.86 | 0.24 | 6.43 | 0.00 |
| Authorising officer rank (reference category: Chief Officer) | 0.09 | |||
| Inspector | 0.60 | 0.43 | 1.82 | 0.17 |
| Chief Inspector, Chief Supt or Supt | 0.04 | 0.52 | 1.04 | 0.94 |
| Rationale for authorisation (reference category: event or combined rationale involving event) | 0.08 | |||
| Following incidents | -0.14 | 0.29 | 0.87 | 0.62 |
| Intelligence | 0.13 | 0.36 | 1.14 | 0.71 |
| Mixed - incident/intelligence | -0.58 | 0.33 | 0.56 | 0.08 |
| Day of the week (reference category: Wednesday) | 0.82 | |||
| Monday | -0.04 | 0.34 | 0.96 | 0.90 |
| Tuesday | 0.07 | 0.34 | 1.07 | 0.85 |
| Thursday | 0.00 | 0.32 | 1.00 | 1.00 |
| Friday | 0.27 | 0.30 | 1.31 | 0.38 |
| Saturday | 0.36 | 0.31 | 1.43 | 0.25 |
| Sunday | 0.20 | 0.34 | 1.22 | 0.56 |
| Duration of authorisation (reference category: 0 to 10 hours) | 0.15 | |||
| 11 to 15 hours | 0.43 | 0.22 | 1.54 | 0.05 |
| 16 to 24 hours | 0.39 | 0.35 | 1.48 | 0.26 |
| Constant | -3.23 | 0.61 | 0.04 | 0.00 |
Note:
- n = 654.
When all 5 variables were entered into the arrests model, the logged volume of searches[footnote 49] was found to be a significant predictor – authorisations with a higher number of searches had a higher likelihood of leading to at least one arrest. This appears to contrast with the general finding that fewer searches per authorisation is associated with a lower no further action rate. However, this analysis looks narrowly at the probability of at least one arrest being made rather than the arrest/no further action rate per authorisation. Overall, rationale was approaching statistical significance at the 0.05 level (p = 0.08). Relative to authorisations that included an event in their rationale, authorisations based on a combination of incident and intelligence had a lower likelihood of arrest.
Five-force data
Table A.C6: Logistic regression of whether an arrest was made during a s60 authorisation, 5-force data
| Predictor | B | Standard error | Odds ratio | Statistical significance |
|---|---|---|---|---|
| Logged volume of searches | 2.04 | 0.30 | 7.71 | 0.00 |
| Rank of authorising officer (reference category: Chief Officer) | 0.14 | |||
| Chief Inspector to Chief Superintendent | 0.41 | 0.76 | 1.51 | 0.59 |
| Inspector | 0.99 | 0.65 | 2.69 | 0.13 |
| Rationale for authorisation (reference category: event or combined rationale involving event) | 0.19 | |||
| Following incidents | -0.15 | 0.36 | 0.86 | 0.67 |
| Intelligence | -0.01 | 0.42 | 0.99 | 0.99 |
| Mixed – incident/intelligence | -0.60 | 0.39 | 0.55 | 0.13 |
| Day (reference category: Wednesday) | 0.63 | |||
| Monday | -0.29 | 0.37 | 0.75 | 0.44 |
| Tuesday | -0.01 | 0.38 | 0.99 | 0.98 |
| Thursday | -0.20 | 0.35 | 0.82 | 0.57 |
| Friday | 0.25 | 0.34 | 1.29 | 0.46 |
| Saturday | 0.29 | 0.36 | 1.33 | 0.42 |
| Sunday | -0.05 | 0.39 | 0.95 | 0.90 |
| Duration of authorisation (reference category: 0 to 10 hours) | 0.23 | |||
| 11 to 15 hours | 0.40 | 0.26 | 1.50 | 0.12 |
| 16 to 24 hours | 0.69 | 0.55 | 2.00 | 0.21 |
| Start time of authorisation (reference category: 6:00am to 2:59am) | 0.43 | |||
| 3pm to 8:59pm | 0.25 | 0.23 | 1.28 | 0.29 |
| 9pm to 5:59am | -0.03 | 0.37 | 0.97 | 0.93 |
| Tweeted | -0.29 | 0.20 | 0.75 | 0.15 |
| Logged size of s60 authorisation area | 0.16 | 0.22 | 1.17 | 0.47 |
| Constant | -4.76 | 1.68 | 0.01 | 0.01 |
Note:
- n = 535.
When all 7 variables were entered into the 5-force arrests model, logged volume of searches was found to be a significant predictor. Authorisations with a higher number of searches, as with the bespoke arrests model, had a higher likelihood of making at least one arrest.
Neither arrest models found inspector-led authorisations to be a predictor of whether an arrest was made during the authorisation.
Neither arrest analyses indicate whether or not the arrest resulted in a charge or, in time, a successful prosecution.
Further models investigated
A number of additional models were run using the datasets but generated limited added value and involved some categories with low counts of authorisations. These are therefore not reported here. A logistic regression was performed to examine the predictors of any outcome (for example, arrest, caution, cannabis warning) compared with all searches resulting in no further action. A multinomial regression was also used to consider authorisations with (a) only no further action (b) at least one arrest or (c) at least one outcome other than arrest. An ordered logit model was also built to examine the volume of arrests in more granularity than the simple binary arrest/no arrest model, for example, no arrests, 1 to 2 arrests and 3 or more arrests. But this added little extra value and had low counts of authorisations within some of the categories.
14. Appendix D: references
Bowen, G. A. (2009) ‘Document analysis as a qualitative research method’, Qualitative research journal, 9 (2), p 27.
Her Majesty’s Inspectorate of Constabulary) (2013) Stop and Search Powers: Are the police using them effectively and fairly? (Accessed 28 October 2020).
Her Majesty’s Inspectorate of Constabulary (2015) PEEL: Police Legitimacy 2015: A national overview. (Accessed 10 May 2020).
Home Office (2014) Best Use of Stop and Search Scheme, 26 August 2014. London: Home Office (Accessed 28 October 2020).
Home Office (2019a) Greater powers for police to use stop and search to tackle violent crime, 31 March 2019. London: Home Office.(Accessed 28 October 2020).
Home Office (2019b) Government lifts emergency stop and search restrictions, 11 August 2019. London: Home Office. Available at: (Accessed 28 October 2020).
Home Office (2019c) Counting Rules for Recorded Crime, published 4 July 2013, updated 19 October 2019. London: Home Office.(Accessed 28 October 2020).
Home Office (2020) Police powers and procedures, England and Wales, year ending 31 March 2020, 27 October 2020. London: Home Office. (Accessed: 28 October 2020).
McCandless, R., Feist, A., Allan, J. and Morgan, N. (2016) Do initiatives involving substantial increases in stop and search reduce crime? Assessing the impact of Operation Blunt 2. London: Home Office.
Nikolovska, M., Johnson, S. D. and Ekblom, P. (2020) ‘“Show this thread”: policing, disruption and mobilisation through Twitter. An analysis of UK law enforcement tweeting practices during the COVID-19 pandemic’, Crime Science, vol. 9 (1), pp 1 to 16.
Smith, V., Dewar, L., Farrugia, D., Diver, M. and Feist A. (2023) The Section 60 Stop and Search Pilot: Interviews with Police Officers and Community Scrutiny Leads. London: Home Office.
Vulliamy, P., Faulkner, M., Kirkwood, G., West, A., O’Neill, B., Griffiths, M. P. and Brohi, K. (2018) ‘Temporal and geographic patterns of stab injuries in young people: a retrospective cohort study from a UK major trauma centre’, BMJ Open. doi: 10.1136/bmjopen-2018-023114.
Weisburd, D. Wooditch, A. Weisburd, S. and Yang, S. M. (2016) Do stop, question, and frisk practices deter crime? Evidence at microunits of space and time. Criminology and public policy. Vol. 15 (1), pp. 31 to 56
-
Greater Manchester Police (GMP), Merseyside, Metropolitan Police Service (MPS), South Wales, South Yorkshire, West Midlands, and West Yorkshire. ↩
-
For the ‘original’ forces (GMP, Merseyside, the MPS, South Wales, South Yorkshire, West Midlands, and West Yorkshire) the pilot period is 1 April 2019 to 31 March 2020. For the ‘later’ forces (the remaining forces and the British Transport Police (BTP)) the pilot period is 12 August 2019 to 31 March 2020. ↩
-
British Transport Police (BTP), Cheshire, Kent, Merseyside, the MPS, West Midlands. ↩
-
In only 1% of all authorisations was the authorising officer rank unknown. ↩
-
Ranging from no searches to 2,138 searches per authorisation. ↩
-
Cheshire, Kent, Merseyside, the MPS, West Midlands. ↩
-
In all cases, a ‘chief officer’ for the purposes of the scheme has the meaning of at least an assistant chief constable, commander of the MPS, or commander of the City of London Police, or above (see Table 1.1). ↩
-
This figure relates to all police forces from April 2019 to March 2020 whereas other totals in this report only relate to the pilot period. ↩
-
The coding was undertaken independently by 2 analysts and the results compared. Any conflicting codes were resolved through discussion. ↩
-
Police forces that entered the pilot period from 11 August may not match across the 2 documents, as searches conducted prior to the pilot period (1 April 2019 to 10 August 2019) are not included from this report. Furthermore, a number of forces had small mismatches across the 2 data collections due to data being pulled from different systems at different times. ↩
-
Greater Manchester Police (GMP), Merseyside, the Metropolitan Police Service (MPS), South Wales, South Yorkshire, West Midlands, and West Yorkshire were placed under pilot conditions from 1 April 2019 (‘Original’ forces). The remaining police forces and the BTP were placed under pilot conditions from 12 August 2019 (‘Later’ forces). ↩
-
For the ‘original’ forces the pilot period is 1 April 2019 to 31 March 2020. For the ‘later’ forces the pilot period is 12 August 2019 to 31 March 2020. ↩
-
Excluding Greater Manchester Police (GMP). ↩
-
The remainder (£35m) was allocated to the preventative strand, with funds driving the formation of Violence Reduction Units to spearhead multi-agency preventative work. £1.6 million of the police funds went towards data improvement exercises in the worst affected forces. ↩
-
Cambridgeshire, Cheshire, City of London, Dorset, Humberside, North Wales, Staffordshire, and Suffolk. ↩
-
Coding was done independently by 2 analysts and any conflicting codes were resolved in discussion. ↩
-
The MPS provided additional data on the reasoning behind ‘not stated’ ethnicity. ↩
-
Based on self-assessed ethnicity and where this is missing, officer-assessed ethnicity for MPS searches. ↩
-
For the ‘original’ forces (Greater Manchester Police (GMP), Merseyside, the Metropolitan Police Service (MPS), South Wales, South Yorkshire, West Midlands, and West Yorkshire) the pilot period is 1 April 2019 to 31 March 2020. For the remaining ‘later’ forces the pilot period is 12 August 2019 to 31 March 2020. ↩
-
Metropolitan Police Service, Merseyside Police, Kent Police, West Midlands Police, Cheshire Police and the British Transport Police. ↩
-
12 August 2019 to 31 March 2020 and the comparison period is 12 August 2018 to 31 March 2019. ↩
-
Data on duration differ slightly between the national dataset and the 6-force dataset given the different data collection methods and subsequent rounding techniques. ↩
-
Where multiple tweets relating to the same authorisation were identified the earliest tweet was selected for analysis. ↩
-
Metropolitan Police Service, Merseyside Police, Kent Police, West Midlands Police, Cheshire Police and the British Transport Police. ↩
-
The August pilot period is 12 August 2019 to 31 March 2020 and the August comparison period is 12 August 2018 to 31 March 2019. ↩
-
For the ‘original’ forces (Greater Manchester Police (GMP), Merseyside, the Metropolitan Police Service (MPS), South Wales, South Yorkshire, West Midlands, and West Yorkshire) the pilot period is 1 April 2019 to 31 March 2020. For the remaining ‘later’ forces the pilot period is 12 August 2019 to 31 March 2020. ↩
-
Lancashire Police and the MPS were unable to link searches and authorisations automatically. A manual linking exercise was conducted for the MPS based on the date and borough of the search, while search data only are provided for Lancashire. Furthermore, officers from the BTP conducted searches under authorisations put in place by another force. These searches are therefore not linked to an authorisation. ↩
-
Factors controlled for include rank of the authorising officer, rationale for the authorisation and the size of the area covered by the authorisation. Full details can be found in Appendix C. ↩
-
This appears to contrast with the general finding that fewer searches per authorisation is associated with a lower no further action rate. However, this analysis looks narrowly at the probability of at least one arrest being made rather than the arrest/no further action rate per authorisation. ↩
-
They often covered multiple stations on the same railway line including the track between 2 locations, or multiple railway ‘assets’ within a defined area. ↩
-
135 s60 authorisation areas were not included due to insufficient information. This included incomplete or imprecise descriptions of boundaries. The authorisations that were not included totalled 90 for the Metropolitan Police Service (MPS), 42 for West Midlands, 2 for Merseyside and 1 for Kent. ↩
-
Here is an example of this boundary [accessed October 2020]. ↩
-
Mann-Whitney U Test was used to test statistical significance, with the null hypothesis of the distribution of s60 authorisation boundary areas showing no difference between the year ending March 2019 and the year ending March 2020. The null hypothesis was rejected (p<0.05). This test was used as the data was non-parametric, had 2 random, independent samples, was measured ordinally and was continuous. ↩
-
With the same principle applying to authorisations that covered more than 2 local authorities (LAs). ↩
-
The same principle was applied across all multiple local authority (LA) authorisations. ↩
-
Combined data for 5 forces over the 2-year period from 1 April 2018 to 31 March 2020. Extreme outliers were defined as any data values which lie more than 3 times the interquartile range below the first quartile or above the third quartile. This covered 35 authorisations with sizes greater than 77.8km2 and 21 authorisations with more than 75 resultant searches. A total of 47 authorisations were removed (slightly less than 5% of the total). ↩
-
Hospital admissions for assault by sharp object from 2012 to 2020 - NHS Digital ↩
-
Data used for NHS Admissions for Injury with a Sharp Object are taken from the England only data as published by NHS Digital. The location is recorded as the patient home address area, rather than the area of the hospital or the location of the incident. ↩
-
For just over three-quarters of offences, a specific individual was named in the form. ↩
-
This is a generic model recommended by the College of Policing as being suitable for use in all decision-making processes within policing. ↩
-
For the ‘original’ forces the pilot period is 1 April 2019 to 31 March 2020. For the remaining ‘later’ forces the pilot period is 12 August 2019 to 31 March 2020. ↩
-
Metropolitan Police Service, Merseyside Police, Kent Police, West Midlands Police, Cheshire Police. ↩
-
The BTP was not included as all their authorisations related to areas around or between stations. Some of these resulted in extended linear areas (for example, between multiple stations on the same line). ↩
-
The principal key words used were ‘section’ ‘60’ ‘s60’ ‘sec60’ ‘section60’. ↩
-
The use of a multi-level model was considered, but rejected, as the number of observations at the police force level were not sufficient and searches were concentrated heavily in the Metropolitan Police Service (MPS) area. ↩
-
The period covered by these data was 1 April 2019 to 31 March 2020 for Merseyside, Metropolitan Police Service (MPS) and West Midlands. For Kent and Cheshire the pilot period covers 12 August 2019 to 31 March 2020. The British Transport Police were not included due to missing data on geographical area size. ↩
-
Due to the irregular and varied size of s60 authorisation areas it was not feasible to link authorisations to other data on the sociodemographic make-up of the areas. ↩
-
Given the focus of s60 authorisations on tackling serious violence, arrests would be the more expected outcome. This analysis therefore focuses only on arrests rather than including other outcomes (for example, community resolutions, cautions). ↩
-
Volume of searches was logged due to the skewed distribution of searches per authorisation. ↩