Reformed functional skills mathematics: evaluation of difficulty
Published 7 July 2022
Applies to England

© Crown copyright 2022
This publication is licensed under the terms of the Open Government Licence v3.0 except where otherwise stated. To view this licence, visit nationalarchives.gov.uk/doc/open-government-licence/version/3 or write to the Information Policy Team, The National Archives, Kew, London TW9 4DU, or email: psi@nationalarchives.gov.uk.
Where we have identified any third party copyright information you will need to obtain permission from the copyright holders concerned.
This publication is available at https://www.gov.uk/government/publications/reformed-functional-skills-mathematics-evaluation-of-difficulty/reformed-functional-skills-mathematics-evaluation-of-difficulty
Authors
- Ellie Keys
- Stephen Holmes
With thanks to
The teachers who participated in this research and provided us with the benefit of their time, insight and expertise.
Executive summary
The reformed versions of functional skills qualifications were available for first teaching from September 2019. The reform of these qualifications followed decisions made by the Department for Education to ensure the qualifications better met employer needs in terms of the knowledge and skills achieved by learners, but not to change the demand of the qualification. Some of the main changes to the functional skills maths qualification were the introduction of a non-calculator paper and a focus on underpinning skills, referring to fundamental mathematical knowledge. These changes aimed to put more emphasis on skills required by both learners and employers, and build the qualifications’ recognition and credibility among employers.
Ofqual’s rules require awarding organisations (AOs) to ensure comparability over time, and with other AOs’ qualifications. The work reported here was carried out in 2019 as part of our technical evaluation of assessment materials for these new qualifications. The study aimed to assess the difficulty of functional skills sample assessments between AOs and compared to legacy functional skills qualifications offered prior to the reforms. This was done using a comparative judgement methodology. We used expert judgement of items to derive estimates of the expected difficulty of functional skills maths items from sample assessments for the reformed qualifications together with items from legacy assessments.
We found that the expected difficulty of items in legacy assessments and reformed sample assessments were very similar. The close similarity of both the average (median) and the overall distribution of item difficulties suggests that AOs have remained consistent when setting the difficulty of their assessments following reform. This is encouraging as the reforms were aimed at introducing improved, new-style content but not to increase demand, which this study suggests has been achieved.
Considering only the reformed qualifications, each AO’s sets of assessments had a clear separation of difficulty between the level 1 and level 2 qualifications. Overall, the assessments were of comparable difficulty across AOs. The findings of this study suggest that using the sample assessments as a guide, AOs will be able to set tests pitched at the appropriate difficulty and with adequate separation between levels. Moderate adjustments of pass boundaries should be sufficient for ensuring comparability between functional skills maths tests between and within AOs.
Introduction
Background
Functional skills mathematics is a qualification available to learners in England. The qualification reflects a demand-led approach, where ‘users’ (learners and employers) are the drivers (Department for Business, Innovation and Skills, 2016). Functional skills qualifications aim to provide learners with the basic academic skills required in everyday life, as well as acting as a foundation for progression to the workplace and further education. The mathematics qualifications are designed to provide useful, real-life context, enabling learners to apply mathematical thinking to solve problems in familiar situations.
Functional skills qualifications are offered at entry level, level 1 and level 2 by several awarding organisations (AOs). While there is some equivalency between functional skills and GCSE qualifications, they differ in several ways. Functional skills can be offered as an on-demand qualification. This means the test can be taken all year round, whenever the student is ready to take the exam, unlike GCSE mathematics, which is only available in the summer series, with a resit opportunity in November. Due to the on-demand nature of functional skills qualifications, AOs who offer this must develop a larger number of assessments than would be required for GCSEs. As well as this, some AOs also offer on-screen assessments in addition to paper-based assessments. Functional skills assessments are graded either pass or fail, unlike GCSEs. Although, similarly the pass mark for each assessment is set independently by awarding organisations. This enables pass boundaries to be adjusted based on the difficulty of individual assessments.
In 2018 the Department for Education announced plans to reform the functional skills maths qualification. These reforms were not intended to change the difficulty of the qualification, as the existing level of demand was considered to be appropriate, but instead to improve the relevance and content of the qualification. The motivation behind this was to build the qualification’s recognition and credibility among employers. The reformed qualification includes increased levels of specific common content, aimed at increasing comparability between awarding organisations’ qualifications, and underpinning skills, aimed at enabling learners to demonstrate more fundamental mathematical knowledge. Underpinning skills are defined as ‘the ability to do maths when not as part of a problem’.
A significant change to the qualification was the inclusion of non-calculator assessments. Prior to the reforms all functional skills maths papers allowed the use of a calculator. Each of the reformed qualifications must be made up of 25% non-calculator tasks and 75% calculator tasks, either in separate papers or as one paper with separate sections.
At the time of writing, functional skills qualifications can be studied as a requirement condition of post-16 funding. Students who achieve a GCSE grade 3 or below in mathematics and/or English will have to undertake further study toward these subjects to be eligible for funding. For those that achieved a grade 2 or below, this does not necessarily need to be a GCSE qualification. These students can instead study for a level 2 functional skills qualification. This demonstrates the importance of ensuring function skills qualifications are comparable, both between AOs as well as with the qualifications offered prior to the reforms. With consideration to the difficulty of functional skills assessments, this comparability is what the current study aimed to investigate.
This work was carried out during the technical evaluation by Ofqual of sample assessment materials, prior to live assessments for the reformed qualifications being made available. The introduction of these assessments was disrupted by the coronavirus (COVID-19) pandemic in 2020 and 2021, and the end date for awarding of legacy functional skills qualifications was extended from 31 August 2020 to 31 July 2021. In addition, in 2020 centre-assessed grades and in 2021 teacher-assessed grades could be used to award functional skills qualifications. However, the evaluation of sample assessment difficulty described here fed through to standard setting within the live reformed qualification assessments.
Study aims
This study aimed to investigate the difficulty of reformed functional skills maths items, from the full set of level 1 and level 2 functional skills maths sample assessments. The primary aim was to consider the range of difficulty between awarding organisations, and within each AO’s set of tests. A secondary aim was to evaluate the difficulty of reformed functional skills assessments compared to the legacy assessments.
A group of current functional skills mathematics teachers judged the difficulty of items by considering how difficult they would be for a typical functional skills maths student to answer. To do this we used a comparative judgement (CJ) methodology. This method refers to the practice of using a holistic evaluation to compare two ‘objects’ (Thurstone, 1927) and gives opportunity to quantify subjective properties, such as perceived quality (Pollitt, 2012), or, in this case, maths difficulty. We have used this method previously for estimating item difficulty in various other evaluations of assessments such as, GCSE maths (Ofqual, 2015), GCSE science (Ofqual, 2017), and AS and A level maths (Ofqual, 2018). The use of comparative judgment enables a consensus view from a group of knowledgeable judges and minimises any individual biases in judgements.
To achieve the comparison between reformed and legacy assessments, data collected from a previous CJ task on a large set of legacy functional skills maths papers was used. This data had been collected for context ahead of reform and is included in this report to provide a frame of reference for the reformed sample assessments.
Method
This study followed the CJ method used in previous research by Ofqual into the difficulty of GCSE and A level maths, GCSE science questions and functional skills maths assessments prior to reforms, where a group of judges determined the difficulty of question items. An item refers to each subpart of a question within a question paper. It is worth noting that the judging of individual items is key to the CJ method. Although, for our purposes, the difficulty of overall assessments was of particular interest, rather than items individually.
Within this study, the group of judges – current functional skills maths teachers – used an online judging platform to remotely select the more difficult item for students to answer from random pairs of items presented side by side on screen. The teachers were required to use their knowledge of a typical student to estimate overall difficulty. This required consideration of factors beyond mathematical difficulty, such as the allowance of a calculator to answer the question, potential familiarity of the context, reading demand and various other elements.
The items used in the study were taken from the sample assessments developed by AOs, all of which had been reviewed as part of the technical evaluation undertaken by Ofqual. At the time of the study, the judges recruited had little teaching experience of the reformed qualifications and so had limited direct experience of how students would react to the style of the reformed questions or the inclusion of non-calculator papers. Therefore, the judges used their experience of the qualification prior to reform to anticipate how difficult students would find the questions.
Each judge saw a random selection of items and each item was judged multiple times against many other items by many judges. Using these judgements, a statistical model was fitted which gave an estimate of difficulty for each item which best explained the patterns of judgements.
Materials
In a previous unpublished study, items from a sample of legacy functional skills maths tests were judged for expected difficulty using the same CJ process as the current study. The items were from 4 to 12 whole tests for each AO, depending on the size of each AO’s qualification entry. In total 1,482 legacy items were judged, from 14 AOs (See Table 1). It is worth noting that not all of these AOs offering functional skills qualifications prior to reform went on to offer the reformed qualification. Using an anchoring technique, described below, the expected difficulty of these items can be compared directly to the expected difficulty of items from the reformed sample assessments in the current study.
The current study consisted of two phases. This was necessary since AOs went through technical evaluation at different times. Since this CJ study was intended partly to provide timely data on sample assessment difficulty to support the technical evaluation process, sample assessments from AOs were judged in two separate CJ exercises. In addition, during the technical evaluation process, items from some AO assessments were revised. New or significantly revised items for phase 1 AOs were included in phase 2. In this way, the final versions of all the items in the sample assessments were judged in one or other phase so that distributions of item expected difficulty for the final sample assessments could be obtained.
In the first phase, items from the complete sample assessments for the first six AOs that began the technical evaluation process were included. This resulted in judgements on a total of 327 items. As well as these items, an additional 100 anchor items from the legacy CJ study were included (see the next section).
A second phase was carried out when the two other AOs submitted their sample assessment materials for technical evaluation. In addition, for some of the phase 1 AOs, new and revised items deemed to have been modified sufficiently for a change to their difficulty to be expected were also included. This resulted in judgements on a total of 111 items (plus the same 100 anchor items). Table 1 summarises the item counts in the different study phases and the final sample assessments.
Table 1: Number of awarding organisations and items included in each phase of the study and the final count of items in the final sample assessments summarised in the results section.
| Study phase | Number of AOs included | Number of Level 1 items | Number of Level 2 items | Total Number of items (anchor items in brackets) |
|---|---|---|---|---|
| Legacy | 14 | 776 | 706 | 1482 |
| Phase 1 | 6 | 172 | 155 | 327 (+ 100) |
| Phase 2 | 2 | 56 | 55 | 111 (+ 100) |
| Final versions | 8 | 217 | 203 | 420 |
Following both phases, the total item counts for the final sample assessments were 217 level 1 items and 203 level 2 items. It is the expected difficulty for these final items that are summarised in the results that follow. We do not include any amended or replaced items from phase 1. Items came from sample assessments from AQA, City and Guilds, Highfield, NCFE, NOCN, OCR and Pearson, with Skillsfirst, Open Awards and FutureQuals working together and sharing the same assessment materials (sometimes referred to as ‘The Consortium’). The awarding organisations are anonymised in the analysis that follows.
Anchor items
One hundred items from the legacy assessments were selected as anchor items in this study. The same anchor items were used for both phases of the current study, allowing items from the legacy study and both phases of the current study to be placed on the same scale and directly compared. These anchor items were selected by placing all legacy items in order of expected difficulty and sampling along this sequence at equally spaced intervals. These items were from all AOs included in the legacy phase and from assessments at both levels 1 and 2.
To analyse the judgement data from CJ exercises, a statistical model is fitted to the judgement data that gives an estimate of difficulty for each item. By using anchor items that have known difficulty values, the scale produced by the analysis is fixed at these anchor points. Because these anchor items were consistent across both phases, items from phase 1 and phase 2 could be ‘slotted in’ to the difficulty scale developed for the legacy items.
Item format
Functional skills maths papers often feature numbered questions with several parts and subparts, each requiring the student to complete a different task or display a different skill, each with a specific set of awardable marks. Each of these subparts is what we refer to as an ‘item’. When displaying each individual item, all parts of the relevant numbered question were included on-screen to ensure judges had the full context. Judges were directed by coloured highlight to the specific item they were required to judge.
Items were edited into a standardised format to ensure that any formatting and layout features would not enable the AO to be identified and thereby potentially influence judgements. Question numbers were also removed, ensuring that judges were unable to assess where in the paper the question featured, in case this could influence the judgement of difficulty. For items taken from non-calculator papers, the fact a calculator would not be permitted when answering the question was clearly stated. This was to ensure judges were able to factor all relevant information about difficulty into their decisions.
Participants and judgement allocation
Functional skills maths teachers responded to an advert to take part in the initial legacy CJ study. In total, 60 respondents took part. A small number were excluded for data quality reasons (see Section 3.1). The others were then approached and offered the opportunity to take part in the current reformed qualifications study. Of those approached, 25 took part in phase 1, with most of these participants carrying on to participate in phase 2. By having the same teachers take part at each stage of the study, consistency of judgements and therefore of item difficulty estimates, was maximised.
In the legacy CJ study, the 60 teachers each completed 540 judgements. The median number of judgements for each item was 34. For the first phase of the reformed study, each of the 25 teachers completed 270 judgements and each item was judged a median of 31 times. In the second phase of the reformed study, 22 teachers took part and each completed 180 judgements and the items were again judged a median of 31 times. Table 2 summarises this information. Following each phase of the study judges were paid for their time.
Procedure
The study was conducted using the online CJ platform, No More Marking. Before starting their allocation of judgements, judges received instructions as to how to use the platform and complete their judgements.
The task involved the presentation of random pairs of items presented side by side on screen. The following prompt was displayed at the top of the screen for all judgements:
‘Which item is more difficult for a typical functional skills student to answer fully?’
Additional clarification regarding the prompt was provided within written instructions sent to the judges. They were encouraged to consider all the various factors that may influence difficulty and use their experience to decide how to weigh up the overall difficulty from all of these factors.
Upon reading and assessing each item, the judges identified which of the 2 items appeared more difficult by clicking on it. The next random pair of items would then be shown. Judges were given a deadline to complete their allocation by, and within this time they could complete their judgements in multiple sessions whenever they chose to.
Analysis
Once each item had been judged against a random sample of other items, a scaled score for each item could be estimated. The R package ‘sirt’ was used to estimate the expected difficulty parameters for each item using the Bradley-Terry model. Custom R code was also used to estimate item and judge infit. The individual item difficulty parameters could then be grouped in different ways so that conclusions could be drawn about the relative difficulty of assessments from different AOs, at different levels and prior to and following reform.
Judge consistency and exclusions
After the initial model fit, judge infit was checked. Infit is a measure of the consistency of the judgements made by a judge compared to the overall model. A high infit indicates that the judge was either inconsistent within their own judgements, or was applying different criteria from the consensus. Misfitting judges were identified and excluded.
Table 2 shows that of the 60 judges that took part in the legacy study, 4 were excluded. In the current study, one of the 25 teacher judges in phase 1 was excluded on the basis of having the highest infit and rapid decision times (2.9 seconds, compared to the median of 24.5 seconds). In phase 2, none of the 22 judges were excluded. The table also shows the range and mean of the median judging times for each judge included in the final analysis. These were relatively consistent across the studies, although slightly longer for the legacy study (perhaps because this was the first time judges had used the software and seen the items in this format). Following removal of misfitting judges, the model was refitted to obtain the final expected item difficulty values for each study.
Table 2: Summary of judges and judgements in each phase of the study.
| Study phase | Number of judges included (misfitting judges in brackets) | Planned number of judgements per judge | Total judgements included in analysis | Judgements per item (median) | Range of median judging time in seconds (mean in brackets) | SSR |
|---|---|---|---|---|---|---|
| Legacy | 56 (4) | 540 | 26,905 | 34.0 | 10 to 60 (31) | 0.88 |
| Phase 1 | 24 (1) | 270 | 5,955 | 31.0 | 7 to 81 (24) | 0.90 |
| Phase 2 | 22 (0) | 180 | 3,960 | 31.0 | 7 to 95 (26) | 0.93 |
The overall reliability of the Bradley-Terry model fit is quantified by a scale separation reliability (SSR) statistic. Technically, this quantifies the ratio of true variance to the observed variance of the model parameters (expected difficulty in this case), and in practice defines how well the values are separated along the scale. The value of this statistic has a value between 0 and 1, and for CJ studies a value greater than 0.8 indicates that the model has produced a consistent scale along which items are clearly distinguished. Following exclusion of misfitting judges, the SSR was 0.88 for the legacy study, 0.90 for phase 1 of the current study and 0.93 for phase 2. These reliability values indicated a consistent scale of difficulty was established in each study phase.
Results
Distributions of expected difficulties for all of the items from the final versions of the reformed sample assessments are shown in the figures in this section as box plots, displaying the median (the bold horizontal line) and inter-quartile range (the box itself) of the expected item difficulties on a logit scale on the y-axis. This probabilistic scale describes the log odds of one item being judged as more difficult than another item. The absolute value is arbitrary, in this case 0 is set equal to the mean of all the items included in the legacy functional skills maths study.
The expected item difficulties have been weighted by the item tariff (maximum mark) by duplicating each item parameter by the number of marks for that item (eg there would be 3 entries for a 3 mark item). Each mark on the paper is therefore treated as a 1-mark item, with the same difficulty for all marks within each judged item.
Expected difficulty of reformed sample assessments
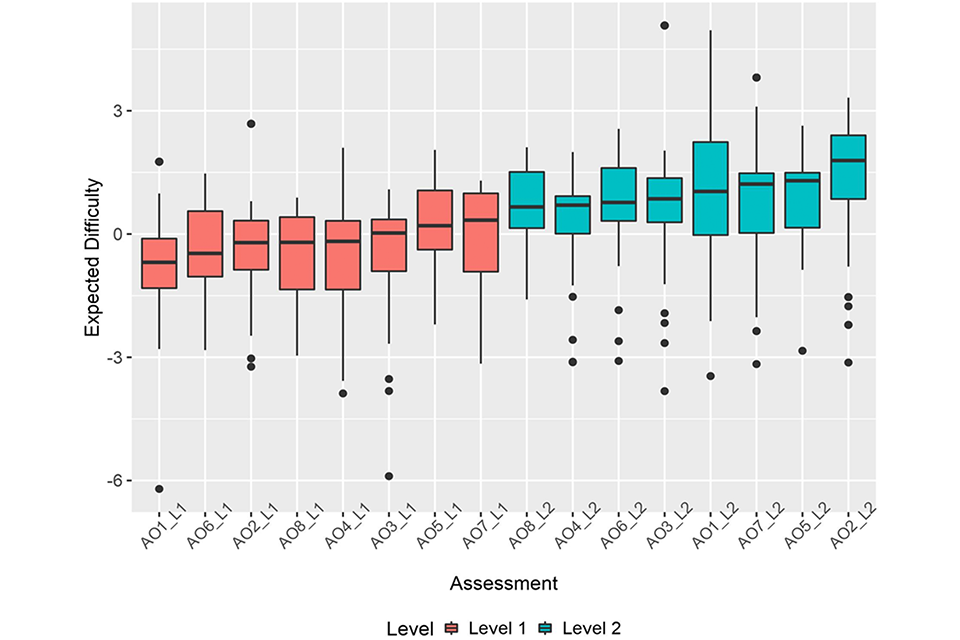
Considering just the reformed sample assessments, when combining all items at the same level for each AO we can see that level 1 and level 2 assessments are ordered logically in terms of their median difficulty. All of the level 2 assessments have a higher median difficulty than the level 1 assessments (see Figure 1). The level 2 assessment medians cover a range from 0.66 to 1.79 with an overall median across all AOs of 0.92, while the level 1 assessment medians cover the range -0.69 to 0.34, with an overall median across all AOs of -0.19. The magnitude of these ranges are similar and there is no overlap of median difficulties, which suggests the levels are clearly separated in difficulty.
Figure 1: Box plots showing median and interquartile ranges of expected item difficulties for each AO separately for both qualification levels.
Comparison of the expected difficulty of legacy and reformed sample assessments
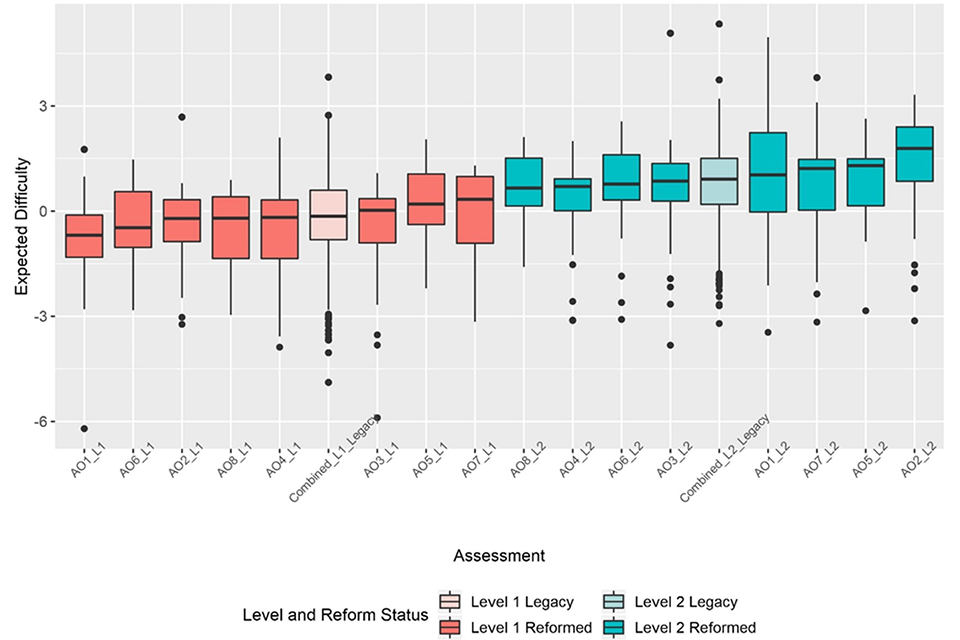
As anchor items were used to create a common scale of estimated difficulty for all items, the reformed items’ scores can be plotted alongside the legacy items’ scores and a direct comparison can be made. This comparison is shown in Figure 2, which plots reformed assessments by level and AO as well as the distribution of all legacy items, combined across awarding organisations.
These legacy difficulty values sit in the middle of the range of reformed qualifications at both levels, suggesting the AOs have remained generally consistent in setting the difficulty of their qualifications following reform.
Figure 2: Box plots showing median and interquartile ranges of expected item difficulties for each AO at both qualification levels, including distributions of legacy items from all AOs combined for both levels.
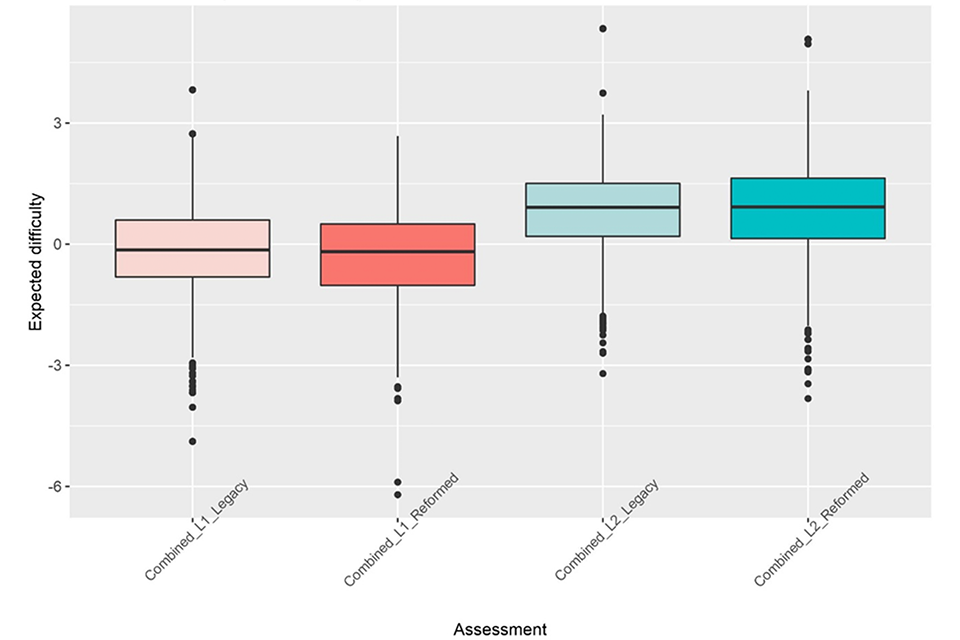
This equivalence between legacy and reformed item difficulty is further demonstrated when all reformed items are combined across AOs and compared to the legacy items (Table 3 and Figure 3). The median difficulty for reformed maths items is 0.05 lower than that of the legacy items for level 1, and 0.01 higher for level 2. These differences are negligible and indicate that AOs have maintained the difficulty of their assessments following the reform process.
Table 3: Median expected difficulty for items from all AOs at each level for the legacy and reformed assessments. The difference between them is also given.
| Qualification level | Legacy | Reformed | Difference |
|---|---|---|---|
| Level 1 | -0.14 | -0.19 | -0.05 |
| Level 2 | 0.91 | 0.92 | 0.01 |
This also suggests the inclusion of new content, such as underpinning skills and requiring mathematical problem solving without the use of a calculator, has not affected difficulty. This is encouraging, as these changes introduced through the reform were not aimed at increasing the difficulty of the qualification.
Figure 3: Box plots showing median and interquartile ranges of expected item difficulties of legacy and reformed items combined across AOs for each level.
Comparison of difference between levels for each awarding organisation’s reformed sample assessments
When considering how much difference there is between the two qualification levels within each AO’s set of tests, there is a range from 0.84 (AO3) to 2.00 (AO2). This suggests that all of the AOs have a reasonable degree of separation between the difficulty of their qualification levels (see Table 4).
Table 4: Median expected difficulty of level 1 and level 2 reformed assessments and the differences between levels for each AO.
| Awarding organisation | Level 1 | Level 2 | Difference between levels |
|---|---|---|---|
| AO3 | 0.02 | 0.86 | 0.84 |
| AO8 | -0.20 | 0.66 | 0.86 |
| AO7 | 0.34 | 1.22 | 0.88 |
| AO4 | -0.18 | 0.70 | 0.88 |
| AO5 | 0.20 | 1.30 | 1.10 |
| AO6 | -0.47 | 0.77 | 1.24 |
| AO1 | -0.69 | 1.04 | 1.73 |
| AO2 | -0.21 | 1.79 | 2.00 |
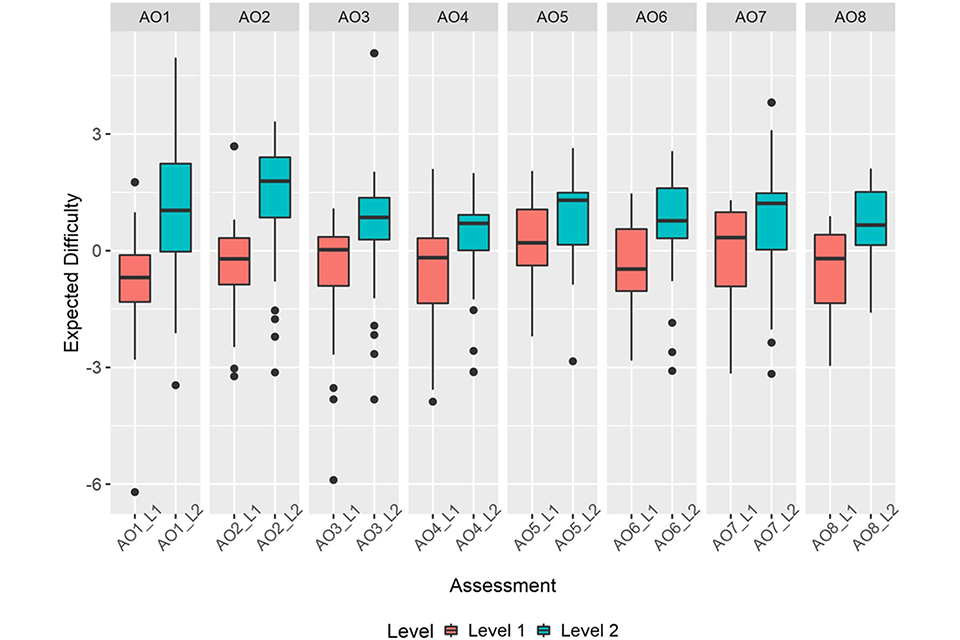
However, there may be some varying interpretations of the required difference between levels. Some AOs appear to have set their levels further apart than others, with different degrees of item difficulty overlap between levels (see Figure 4). Some have substantial overlap, suggesting some of their level 1 items are of similar difficulty to their level 2 items, whereas other AOs have little overlap between levels. It is worth noting that setting assessments where all items have precisely the same difficulty is challenging. The varying degrees of overlap could be accounted for by appropriately set pass boundaries.
Figure 4: Box plots showing median and interquartile ranges of expected item difficulties of reformed assessments at each level grouped for each AO.
Expected difficulty across paper type within each awarding organisation’s reformed sample assessments
Within the new specification of functional skills maths, each AO must include calculator and non-calculator tasks at each level. All AOs separated the tasks into two papers, one for which a calculator was allowed, and one where it was not. Table 5 shows the number of items, the average number of available marks and the time allocated per paper. This demonstrates the requirement for non-calculator tasks to make up 25% of the assessment for the qualification, while calculator tasks must make up the remaining 75%. As the non-calculator papers are significantly shorter than the calculator papers in terms of the number of items, the conclusions drawn about the overall difficulty of these papers may be less robust than those at whole-qualification level.
We note that our judges were making a prediction as to how difficult their students would find these new kinds of tasks. As experienced functional skills maths teachers they should be well-placed to make such a judgement. In support of this we analysed consistency of judgements for the different item types. The Bradley-Terry model outputs standard errors for each item difficulty, which are indicative of the consistency in the judgements made for each item. The average standard error for calculator items was 0.50 compared to 0.51 for non-calculator items. This suggests that despite the lack of familiarity the judges had with teaching non-calculator items, their consistency of judgement was very similar for both types of item.
Table 5: Average number of items, available marks and time allocation for the calculator and non-calculator reformed sample assessments at each level, grouped by AO.
| Sample assessment | Mean number of items per paper | Mean marks per paper | Mean time allocated per paper (minutes) |
|---|---|---|---|
| Level 1 Non-Calculator | 9.3 | 16 | 30 |
| Level 1 Calculator | 17.9 | 48 | 88 |
| Level 2 Non-Calculator | 7.9 | 16.8 | 30 |
| Level 2 Calculator | 17.5 | 50.5 | 92 |
When considering the individual calculator and non-calculator papers across levels and AOs (Figure 5), most AOs have reasonable separation between the papers at different levels. However, there are some AOs with less separation between papers at different levels. It is also apparent that for some AOs, one of the Level 2 papers has lower judged difficulty than a Level 1 paper (AO4, AO8).
There is also a range of differences between calculator and non-calculator papers at the same level across the AOs, with the smallest difference being 0.11 (AO7 Level 2 and AO5 level 2) and the largest 1.74 (AO4 level 1). The full table of differences can be seen below (Table 6). This suggests there are some differences in how AOs separated content and allocated item difficulty across the calculator and non-calculator papers within each level. This is understandable, as while AOs were required to included certain subject content and non-calculator tasks, they were able to take different approaches in how the content was split across the different task-types.
Figure 5: Box plots showing median and interquartile ranges of expected item difficulties for individual papers grouped by AO for each level and paper type (calculator or non-calculator).
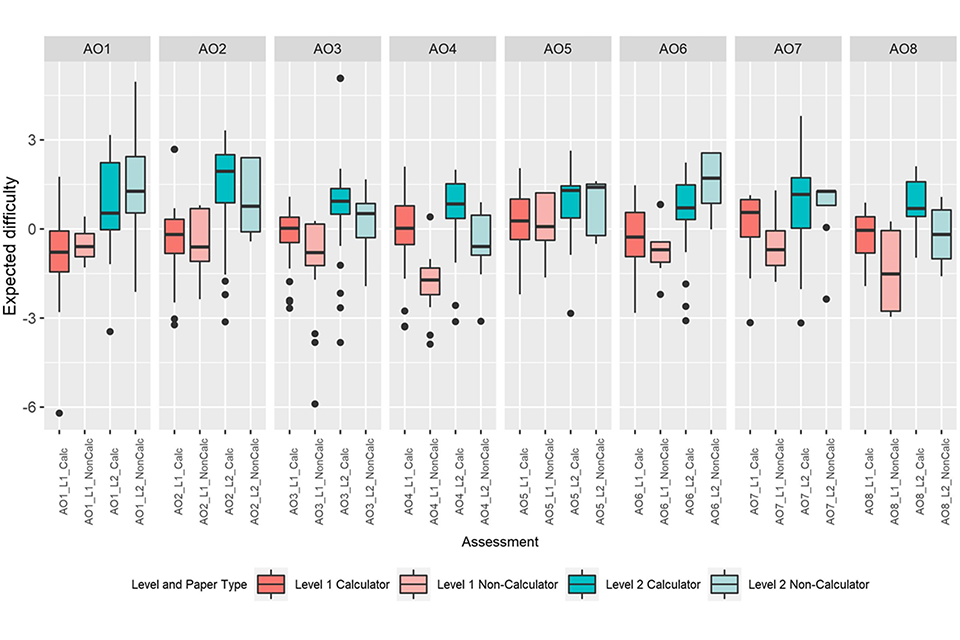
Table 6: Expected difficulty of individual papers at each level and the absolute differences between them, grouped by AO.
| Awarding organisation | Level | Calculator | Non-calculator | Absolute difference |
|---|---|---|---|---|
| AO1 | Level 1 | -0.78 | -0.59 | 0.19 |
| AO1 | Level 2 | 0.53 | 1.27 | 0.74 |
| AO2 | Level 1 | -0.19 | -0.61 | 0.42 |
| AO2 | Level 2 | 1.94 | 0.77 | 1.17 |
| AO3 | Level 1 | 0.02 | -0.80 | 0.82 |
| AO3 | Level 2 | 0.93 | 0.52 | 0.41 |
| AO4 | Level 1 | 0.02 | -1.72 | 1.74 |
| AO4 | Level 2 | 0.84 | -0.59 | 1.43 |
| AO5 | Level 1 | 0.27 | 0.08 | 0.19 |
| AO5 | Level 2 | 1.30 | 1.40 | 0.10 |
| AO6 | Level 1 | -0.27 | -0.70 | 0.43 |
| AO6 | Level 2 | 0.71 | 1.71 | 1.00 |
| AO7 | Level 1 | 0.56 | -0.70 | 1.26 |
| AO7 | Level 2 | 1.16 | 1.27 | 0.11 |
| AO8 | Level 1 | -0.05 | -1.51 | 1.46 |
| AO8 | Level 2 | 0.69 | -0.19 | 0.88 |
There are differences between AOs in terms of which paper type is more difficult at each level. For some AOs the calculator paper was judged to be more difficult, while for others the non-calculator paper was judged to be more difficult. Generally, this trend is consistent across levels for each AO, however some have a harder calculator paper at level 1 and a harder non-calculator at level 2 (AO7, AO5, AO6).
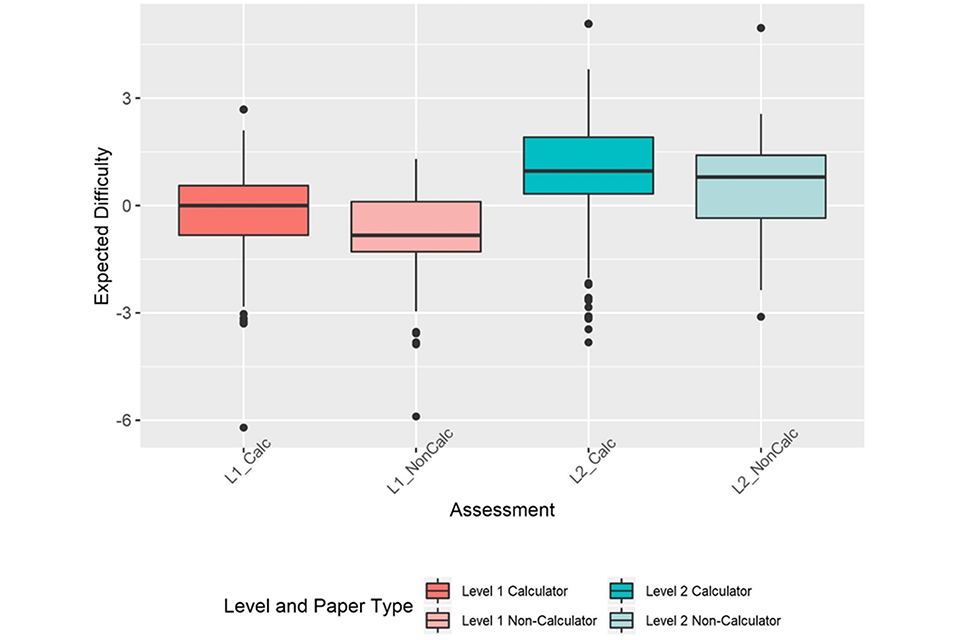
As previously stated, due to the smaller number of items and judgements supporting non-calculator papers there may be more uncertainty in these comparisons, compared to differences found when considering the whole assessment (both papers together). However, when all items are combined across AOs into levels 1 and 2, we can see that overall there is a trend for calculator papers to be more difficult at both levels (Figure 6). The overlap between calculator and non-calculator papers within a level is greater than any cross-level overlaps.
Although there is some variation, most AOs do have reasonable separation between calculator and non-calculator tests at different levels, although there is sufficient variation in item difficulty within a level for there to be some overlap between levels. This suggests that overall, the AOs have appropriately set their test difficulty, given that different pass thresholds can be used to account for moderate differences in assessment difficulty.
Figure 6: Box plots showing median and interquartile ranges of expected item difficulty of reformed assessments for all AOs at each level split by paper type (calculator or non-calculator).
Discussion and conclusions
Our key finding is that the median and distribution of expected item difficulties for the reformed sample assessments are comparable to the those of the legacy assessments prior to reform. When considering difficulty across all items from all AOs, there was almost no change in median expected item difficulty. This suggests that AOs have maintained the difficulty of their assessments, while also ensuring inclusion of the new content.
When considering the assessments from individual AOs, there was a clear separation of difficulty between reformed level 1 and level 2 sample assessments. The median item difficulty of the most difficult level 1 assessment was 0.32 lower on the scale than that of the least difficult level 2 assessment, which suggests reasonable separation of difficulty between the levels. Within each AO, there was also clear separation between levels, however, some AOs had larger differences between levels than others.
When considering the individual papers, the differences between levels were slightly less consistent. There were some differences between, and in some cases within AOs, in terms of which paper was more difficult at each level. Several AOs had a more difficult calculator paper at level 1 and more difficult non-calculator paper at level 2. However, it is worth noting that non-calculator papers always have fewer items than calculator papers. This means the expected item difficulty distributions for these papers are based on fewer items and judgements, therefore, the value of the median item difficulty may be less robust than that for calculator papers. However, when items from all AOs are combined within a qualification level, there is a clear trend for calculator papers to be judged as more difficult than non-calculator papers at both levels.
Non-calculator questions were a new requirement for the reformed qualifications. While only speculation, it may be that this pattern has emerged because AOs were concerned about making the non-calculator papers too hard (or at least appearing to be too hard) for students, resulting in them designing these questions with simpler calculations than questions in the calculator papers.
The papers included within this study were sample papers, meaning they will never be used in live assessment, but are instead a benchmark, or template, for the style and structure of the live papers. The findings of this study suggest that using the sample papers produced as a guide, AOs will be able to set assessments pitched at the appropriate level of difficulty and with adequate separation between levels. The setting of pass boundaries should be appropriate to control for the small differences in paper difficulty and ensure comparability between functional skills maths assessments between, and within, AOs.
Overall, the difficulty of functional skills mathematics qualifications appears to be consistent with legacy qualifications and adequately comparable across AOs. This is encouraging as reforms were aimed at introducing improved, new-style content but not to increase demand, which this study suggests has been achieved in the sample assessments.
References
Department for Business, Innovation and Skills (2016). Impact of Poor English and Maths Skills on Employers: Literature Review (BIS Research paper number 267).
Ofqual. (2015). A Comparison of Expected Difficulty, Actual Difficulty and Assessment of Problem Solving across GCSE Maths Sample Assessment Materials.
Ofqual. (2017). GCSE science: An evaluation of the expected difficulty of items.
Ofqual. (2018). A level and AS mathematics: An evaluation of the expected item difficulty.
Pollitt, A. (2012). The method of adaptive comparative judgement. Assessment in Education: principles, policy & practice, 19(3), 281-300.
Thurstone, L. L. (1927). A law of comparative judgment. Psychological review, 34(4), 273.