Emissions measurement and reporting: Technical report and insights for the public sector in England (HTML)
Published 21 October 2026
Applies to England

© Crown copyright 2026
This publication is licensed under the terms of the Open Government Licence v3.0 except where otherwise stated. To view this licence, visit nationalarchives.gov.uk/doc/open-government-licence/version/3 or write to the Information Policy Team, The National Archives, Kew, London TW9 4DU, or email: psi@nationalarchives.gov.uk.
Where we have identified any third party copyright information you will need to obtain permission from the copyright holders concerned.
This publication is available at https://www.gov.uk/government/publications/public-sector-emissions-measurement-and-reporting-guidance/emissions-measurement-and-reporting-technical-report-and-insights-for-the-public-sector-in-england-html
1. Introduction
Public sector energy and emissions
Central government and the wider public sector have an important leadership role to play as Britain becomes a clean energy superpower and continues the transition to a net zero economy. As we seek to move away from fossil fuels to enhance energy security, reduce energy bills and accelerate toward net zero, public sector organisations need access to finance and the capacity and capability to act. They also need the right incentives and information to help them identify energy, carbon and bill saving opportunities.
Energy and emissions measurement and reporting can help to provide this information. However, there are a wide range of approaches within a landscape that is evolving quickly, so this can be a complex issue to navigate, especially for organisations that lack capacity and capability.
This report aims to explain emissions measurement and reporting broadly; outlining different approaches and explaining their different features and components and providing insights on these topics to help public sector organisations to better understand and navigate the emissions measurement and reporting landscape and identify and use approaches which can help them to reduce their energy use and emissions. The report focuses particularly on energy and emissions measurement and reporting as it relates to energy use in and emissions from buildings.
In 2024, UK net territorial greenhouse gas emissions totalled 371 million tonnes of carbon dioxide equivalent (MtCO2e). Around 21% were direct emissions from the buildings sector, of which 11% were from the public sector.[footnote 1] This means that public sector buildings were directly responsible for around 2% of total UK net greenhouse gas emissions in 2024.
The majority of operational emissions from public sector buildings relate to energy use, for heating and electrical loads. The public sector is responsible for 5% of total electricity use in the UK.[footnote 2] These emissions are expected to be abated by switching from fossil fuel to low carbon heating, including heat pumps and heat networks, and installing or using renewable electricity sources whilst the grid also decarbonises. Energy efficiency improvements will also help to reduce bills, improve comfort, minimise energy consumption and ensure that heating is efficient.
Public sector buildings vary significantly in ways that influence energy consumption and emissions, including age, usage, construction methods and heating systems, all of which impact the appropriate technical solutions for reducing emissions, energy consumption and bills. Organisations are diverse too, with differing structures and capabilities, and there is an acute problem in the public sector with asset maintenance backlogs and poorly insulated and hard-to-treat buildings. The majority of the non-domestic building stock will still be operational in 2050 and therefore requires treatment to realise bill savings, meet our legally binding emissions targets, and to support delivery of the clean power mission.
As explained above, most emissions from public sector buildings relate to energy consumption. Energy and emissions are relevant throughout the report, but for simplicity the phrase emissions measurement and reporting is often used, and energy only specified where this is meaningful.
Measuring and reporting energy consumption and emissions can help public sector organisations to reduce their energy bills, energy consumption, and GHG emissions from their buildings, by providing the information needed to identify bill saving opportunities and opportunities to save energy and carbon.
However, guidance on how public sector organisations should measure and report their energy consumption and emissions can be difficult to navigate, especially for organisations that lack capacity and capability.
This document therefore aims to provide insights on energy consumption and emissions measurement and reporting for the public sector in England.
Report structure
The report is structured as follows:
- Chapter 1 introduces background and context around public sector emissions measurement and reporting
- Chapter 2 sets out further context including; public sector emissions measurement and reporting challenges that should be considered by those interacting with it, information on the current greenhouse gas accounting landscape, including relevant academic research, and information on emissions measurement and reporting approaches within financial reporting frameworks
- Chapter 3 explains how emissions measurement and reporting approaches can be configured, including key components, mechanisms of change and data granularity
- Chapter 4 explains the concept of measurement breadth and provides insights on common approaches to this
- Chapter 5 explains and provides insights on common measurement methods
- Chapter 6 explains the concept of organisational boundaries and explores common approaches to this
- Chapter 7 explains different approaches to reporting mechanisms to support data collection
- Chapter 8 explains some common approaches to publication and verification of emissions data
2. Context, public sector challenges and the greenhouse gas accounting landscape
This chapter provides information on emissions measurement and reporting in general, seeking to provide a high-level explanation of the discipline to public sector organisations, so that they can engage with it more easily. The key issues covered in this chapter are:
- an overview of emissions measurement and reporting
- introducing the concept of mechanisms of change.
- public sector emissions measurement and reporting challenges
- the wider greenhouse gas accounting landscape, including academic research
- emissions measurement and reporting within financial reporting frameworks
Overview
Emissions measurement and reporting is a powerful enabler of energy-related action, with different methodologies and frameworks used to produce different data. Overall, this report is targeted at public sector organisations seeking to measure and report energy use in and emissions from buildings, but the examples below demonstrate the breadth of ways that emissions measurement and reporting can be, and is, used across the economy.[footnote 3]
Broader examples of using emissions measurement and reporting:
- National emissions inventories: The UK’s GHG Inventory tracks and monitors the UK’s territorial emissions and underpins the UK’s national and international reporting requirements for greenhouse gases and many other countries have similar inventories. These are used by governments to track and manage progress toward climate goals, and to help formulate policies, and they act as an important accountability mechanism. National emissions inventories commonly use different methodologies and datasets than corporate inventories
- Facilitating carbon pricing and trading: Emissions measurement and reporting is an essential component of emissions trading schemes, also known as cap-and-trade systems. These place a cap on the amount of greenhouse gases that can be emitted and allows those in scope of the scheme to choose between purchasing carbon allowance certificates or reducing their emissions, creating a market which allows the most cost-effective emissions reductions to be realised first.[footnote 4] It can also support Carbon Border Adjustment Mechanisms (CBAMs) that account for the carbon cost of producing imported goods in order to prevent carbon leakage, supporting global progress towards net zero
- Policy framework to grow the market for low carbon industrial products: The government has published a consultation on a framework of policies to build the market for low carbon industrial products alongside the Clean Energy Industries Sector Plan as part of the Industrial Strategy. These policies will use embodied emissions measurement and reporting to enable buyers to identify and compare lower carbon industrial products and give producers confidence that there will be demand for their lower carbon products, with an initial focus on the steel, cement, and concrete sectors
- Corporate emissions reporting: Through frameworks such as Streamlined Energy and Carbon Reporting (SECR), organisations are required to measure and disclose their energy use and greenhouse gas emissions. This reporting aims to improve transparency, support informed decision-making, and encourage emissions reductions across participants. By embedding emissions data into annual reporting cycles, reporting frameworks such as SECR help drive improvements in energy efficiency, supports cost savings, and strengthens accountability to investors, regulators, and the public. Over time, this contributes to behavioural change within organisations and supports the UK’s wider transition to a low-carbon economy
Whilst this report is targeted at public sector organisations seeking to measure and report energy use in and emissions from buildings, it is important to recognise that there are many applications for emissions measurement and reporting that will be needed across the public sector and the wider economy. Any emissions measurement framework is most likely to deliver its intended objectives where the approach selected has been designed with a purpose and mechanism for achieving that purpose, and both of these are aligned to those objectives.
Relative to other organisational reporting methods, like financial reporting, emissions reporting can be seen as less mature. Like financial reporting, different approaches to emissions reporting can be used for different purposes, but the distinct methods and approaches are not as comprehensively or clearly set out as they are for more mature reporting disciplines, and there is a lack of standardisation in how organisations approach emissions reporting even for the same purpose.
To gain a better understanding of the existing emissions measurement and reporting landscape in the public sector, and how it can drive decarbonisation, DESNZ commissioned research delivered by Energy Saving Trust (EST) to systematically review and map a range of emissions reporting frameworks, the decarbonisation outcomes they enable, and to assess the different measurement approaches underlying these frameworks.[footnote 5]
This analysis identified 8 different mechanisms of change through which emissions measurement and reporting help drive emissions reductions but also noted that existing frameworks have not always been designed and deployed with a clear mechanism to support decarbonisation in mind. These mechanisms are shown in Figure 1.
Figure 1. Mechanisms by which public sector emissions reporting facilitates decarbonisation
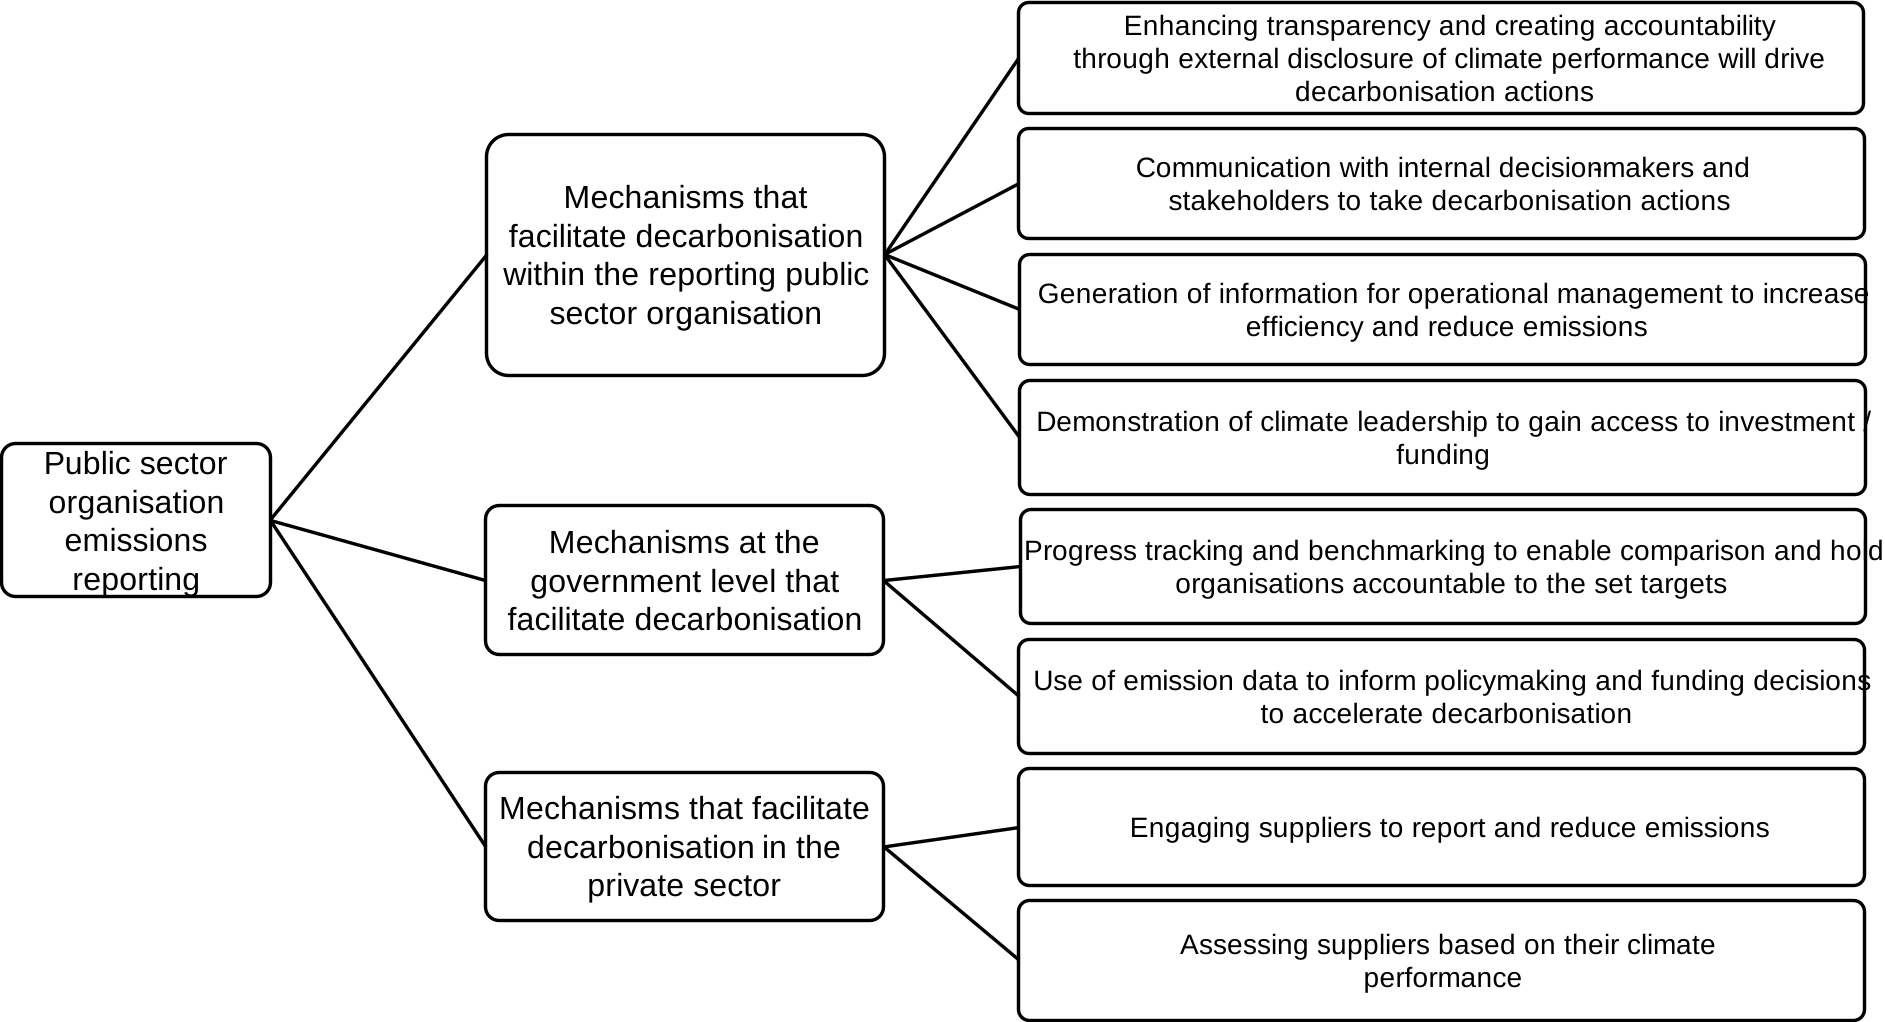
Description of figure 1: Diagram showing the mechanisms by which public sector emissions reporting facilitates decarbonisation.
Public sector organisation emissions reporting:
- Mechanisms that facilitate decarbonisation within the reporting public sector organisation:
- Enhancing transparency and creating accountability through external disclosure of climate performance will drive decarbonisation actions
- Communication with internal decision-makers and stakeholders to take decarbonisation actions
- Generation of information for operational management to increase efficiency and reduce emissions
- Demonstration of climate leadership to gain access to investment / funding
- Mechanisms at the government level that facilitate decarbonisation:
- Progress tracking and benchmarking to enable comparison and hold organisations accountable to the set targets
- Use of emission data to inform policymaking and funding decisions to accelerate decarbonisation
- Mechanisms that facilitate decarbonisation in the private sector:
- Engaging suppliers to report and reduce emissions
- Assessing suppliers based on their climate performance
These mechanisms of change are referred to throughout the report, including to explain how different approaches to emissions measurement and reporting are suited to drive change through a particular mechanism. This can help organisations to align their reporting objectives with ways of driving change and specific approaches that deliver on these.
The next section of this chapter moves on to explain some of the other content from the EST research, on challenges faced by public sector organisations seeking to measure and report their emissions.
Public sector emissions measurement and reporting challenges
DESNZ-commissioned research delivered by the Energy Saving Trust (EST) found that public sector organisations face multiple challenges when measuring and reporting emissions. These are set out below.
The landscape
The current emissions measurement and reporting landscape for the public sector can be complex to navigate, especially for organisations lacking capability.
Reviews have shown that most existing frameworks are based on the Greenhouse Gas Protocol (GHGP) in some way, including use of the GHGP Corporate Accounting and Reporting Standard which provides a methodology for developing corporate emissions inventories. However this Standard is designed to leave decisions to the discretion of reporting organisations, which can exacerbate inconsistencies in how the frameworks are applied.
This report, in conjunction with the EST research and the Energy System Catapult’s ‘Public Sector Decarbonisation Guidance’ [footnote 6] can help public sector organisations to better understand the emissions measurement and reporting landscape, and which approaches apply to them and are best suited to delivering their reporting objectives.
Capacity and capability
There are various skills gaps in the public sector in relation to emissions measurement and reporting, some of which can disproportionately impact smaller organisations. According to the EST research, in small organisations, emissions measurement and reporting often falls as an extra responsibility to an individual with a separate full-time role, where they are unlikely to have the skills and experience required to effectively deliver emissions measurement and reporting. This can be exacerbated by approaches with more complex measurement and reporting requirements, and other situational factors. For example, where measurement and reporting consists of collecting energy meter or bill data, which is readily available and known to be accurate, and then preparing a report which requires minimal processing for different presentations of data, this can be more straightforward. However, issues with meter or bill data, or requirements for extensive data processing to achieve desired presentations or insights, will be likely to make the responsibility more challenging.
These challenges will be relevant for larger organisations too, but larger organisations may be expected to have greater resources including dedicated staff with the capacity and capability to expertly measure and report a range of emissions. There can be other challenges for large organisations though, relating to the scope and breadth of activity and therefore data to be managed. This might include navigating complex estates and organisational structures when seeking to obtain, process and share data, when setting boundaries, and designing reports to meet wide-ranging needs of different internal stakeholders.
The activities of the organisation and range of emissions produced will also impact how challenging they are to measure and report. Emissions measurement and reporting for energy consumption in buildings is typically more straightforward than for other emissions sources an organisation may seek to capture, with added complexity expected in these cases, where accurate consumption data and emissions conversion factors may not be readily available (see chapter 5).
Data accessibility and quality and resource constraints
Two other key challenges highlighted by the research were around data accessibility and resource constraints.
In relation to data accessibility and quality the research observed that these challenges often resulted from siloed working across different departments or teams, meaning that data needed to be sought from different areas of organisations, which can be exacerbated by complexity in developing data sharing processes and tools. Overall, this results in a reduction in the precision of emissions measurement and reporting.
The research also noted that resource constraints pose a challenge, particularly within smaller organisations where resources are already stretched with competing priorities. This is not a situation that will have improved since the research was carried out in 2024.
The current greenhouse gas accounting landscape
The GHG accounting landscape is evolving quickly, including due to developments in sustainability reporting in financial reporting frameworks. At this intersection of emissions and financial reporting, academic research is being carried out assessing the approaches being used. Being aware of the research landscape can help organisations to understand how emissions measurement and reporting might evolve in future and start adopting any learnings in their own activities. This section of the report seeks to capture some of the key points from this research.
Much of this research focuses on the GHGP, reflecting one review which found that 52 documents identified from an initial 5 ‘seed’ documents, including from the International Financial Reporting Standards (IFRS), Carbon Disclosure Project (CDP), Science Based Targets Initiative (SBTi) and the Task Force on Climate-Related Financial Disclosures (TCFD), were all in some way derived from the GHGP.
The first issue discussed is not specific to the GHGP but relates to 2 broad approaches to GHG accounting: attributional and consequential, and a failure to follow one of these consistently.[footnote 7] Attributional accounting methods create inventories of emissions for example, corporate GHG inventories or national GHG inventories. It is a method for quantitatively assigning responsibility for emissions and removals to an accounting subject. Consequential accounting is a fundamentally different type of GHG accounting method, which aims to quantify the change in emissions caused by decisions or interventions. Examples of when this approach might be best used include when looking to assess the potential impact of policy decisions or looking to understand the potential emissions resulting from a future product or the impact of a business level decision on the emissions outside of an organisational boundary.[footnote 8]
One of the concerns around current practice is that practitioners may misapply attributional methods to questions that are better suited to consequential methods, for example how much a mitigation action reduces emissions. The research shows that this can lead to poor climate outcomes, for example where the consequential impacts of a decision have not been considered, outside of the boundary within which emissions are being attributed.
The GHGP primarily describes an attributional approach, though it does recommend the use of project-level accounting (a form of consequential accounting) if there is concern that the attributional approach does not reflect the change caused by mitigation actions. The GHGP has published a number of consequential accounting standards, including the GHG Protocol for Project Accounting and the Policy and Action Standard. It is worth noting that, when applicable, consequential methods should always be used separately, to complement attributional methods, rather than combined within attributional methods.
When measuring energy use in and emissions from buildings, an attributional approach can help public sector organisations to measure their own operations in a consistent and comparable way, rather than seeking to understand cross-organisational impacts of specific products, projects and actions. A consequential approach would be better suited to, for example, understanding embodied emissions in construction, across the lifecycle of the relevant products.
Specifically considering the GHGP, the academic literature highlights a range of limitations, including[footnote 9]:
- Biased disclosures – the GHGP provides organisations with flexibility in a range of areas, which has benefits but can also allow for emissions reports to be biased or manipulated.
- Obscuring aggregation – actual and estimated, and past and future, emissions are intentionally included but not distinguished, which can hinder meaningful comparison of organisations and obscure actual changes in emissions and an organisation’s contribution to these.
- Ambiguous responsibility – the GHGP does not establish a unique attribution of emissions to firms, they are instead estimated and reported multiple times by different organisations, which can hinder comparisons and confuse decision-making. The GHGP recognises the issue of double counting, but it should be noted that as well as giving rise to issues, it can also give multiple organisations an incentive to act and seek to abate emissions.
- Incomplete coverage – organisations can choose their organisational and operational boundaries, allowing them to control the range of emissions they report, hindering the comparability of reports.
- Fragmented reports – the GHGP considers comparability most in terms of periods of data within an organisation, while financial accounting views comparability mostly as a means of comparing similarities and differences across organisations. This creates challenges due to the choices available to organisations when reporting, and the breadth, content and accuracy of reporting can vary significantly between organisations who are all using the GHGP. This is acknowledged within the standards themselves and on its own does not present an issue. However, practice has evolved over time in a way that means the GHGP is often used for or wanted to be used for comparability, and there are concerns among researchers about how the GHGP is often being used for a purpose it is not suitable for, in its current form.
- Limited verifiability – because of inherent uncertainties, estimates and complexities in GHG reporting, emissions reporting is hard to assure and is generally not seen as a helpful metric to compare across different companies (where different assumptions, estimates and uncertainties will affect reporting in different ways in each entity). However, when considering the same reporting entity over time it is more likely that the assumptions, estimates and uncertainties will affect year on year reporting in a similar manner, so trend analysis may be possible and may provide useful insights.
Stemming from these and other issues, researchers highlight concerns that GHG accounting practices are inadequate for providing managers, investors and other stakeholders with the information needed to make informed decisions, and the research community is actively seeking to develop solutions to these issues.
Measurement and reporting of Scope 3 emissions is another area where researchers note several issues. This is explored further in chapter 4, with the summary assessment that whilst the issues are meaningful for the useability of scope 3 data, there is still strong consensus for its usefulness when used appropriately.
Sustainability reporting within financial reporting frameworks
The following section of this chapter focuses on sustainability reporting within financial reporting frameworks, which have and continue to be a key driver of progress and innovation in emissions measurement and reporting more broadly.
In 2015, the Financial Stability Board (FSB) established the Task Force on Climate-related Financial Disclosures (TCFD) to develop recommendations for more effective climate-related disclosures that support more informed decision making and, in turn, enable stakeholders to better understand concentrations of carbon-related assets and exposures to climate-related risks. The disclosures aim to promote the management of climate-related financial risks and opportunities across the economy and financial system.
HMT has since published guidance on TCFD for the public sector, as incorporating climate-related disclosures into public sector bodies’ annual reports enhances decision-making by providing critical insights into future risks and opportunities through horizon scanning. This helps organisations strategically plan and build climate resilience, providing greater transparency for stakeholders, improving risk management and enhancing response efforts. HMT is responsible for setting requirements for central government annual reports and accounts and has mandated TCFD-aligned disclosures for large central government bodies. The TCFD framework requires disclosure of Scope 1 and Scope 2 GHG emissions, and, where material to primary users, Scope 3 emissions.
Separate to public sector reporting requirements, the Department for Business, Innovation, Science and Trade (BIST) has been considering endorsement of new International Sustainability Standards Board (ISSB) standards for sustainability reporting in the private sector. These standards build on the recommendations of the TCFD. IFRS S1 establishes the foundation for the sustainability disclosure framework, setting out high level disclosure requirements for any sustainability-related topic. IFRS S2 is the first topic-specific standard and sets out more detailed disclosures on climate-related risks and opportunities. Both standards limit disclosure of information to matters that are useful to users of general-purpose financial reports in making decisions on providing resources to the entity. Broadly the ISSB standards aim to promote international reporting standardisation across the private sector. IFRS S2 requires companies to report their emissions in accordance with the GHGP.
Beyond the ISSB, there are other key sustainability reporting standard setters, including the International Public Sector Accounting Standards Board (IPSASB) and the Global Reporting Initiative (GRI). IPSASB has adapted IFRS S2 for the public sector, publishing its first Sustainability Reporting Standard (SRS 1) on climate, to which HMT responded during consultation. The GRI takes an alternative approach, considering sustainability impacts beyond financial materiality. HMT, alongside other relevant authorities, is monitoring developments in the private sector and from these international standard setters, to assess their suitability for UK public sector annual reports and accounts.
Integrating sustainability and emissions reporting into financial reporting reflects the fact that sustainability, and climate change specifically, has a financial component. Leveraging financial frameworks, markets and drivers is an important and impactful way of delivering sustainability and climate outcomes. Emissions reporting in this context involves organisations disclosing climate-related risks and opportunities that could reasonably be expected to affect cash flows, access to finance, or cost of capital over the short, medium or long term. This involves measuring and reporting GHG emissions in the annual report.
This practice is becoming increasingly prevalent as investors, shareholders and regulators demand greater transparency about the environmental impact of businesses, and how environmental factors can impact businesses. Increased transparency is generally helpful in driving best practice and emissions reductions.
The maturity and reach of financial reporting frameworks can enable the rapid adoption of new incorporated emissions reporting elements in the private sector, and in our engagement, we have seen that this type of corporate emissions reporting is already driving thinking and behaviours on emissions measurement and reporting in the public sector, to some extent.[footnote 10]
This can be beneficial, both by raising awareness of the need for emissions measurement and reporting generally, and, noting that it still is not commonplace, driving more organisations to do more than they might have done otherwise.
However, it is not the case that all public sector organisations should necessarily adopt the same or similar approaches to emissions reporting as those incorporated within corporate financial reporting frameworks. Future cash flows and enterprise value, key considerations in the private sector, are often less relevant for public sector reporting, where long-term service delivery and policy outcomes are the primary focus.
HMT and other relevant authorities intend to take public sector considerations into account when considering the future adoption of private sector financial reporting frameworks, including in the adoption of any future sustainability reporting standard. As part of this, they intend to assess whether any adaptations are necessary to ensure these frameworks are appropriate for the UK public sector.
The purpose of reporting and the intended mechanism by which it drives change should determine how emissions are measured and reported. For example, a sustainability or estates management professional may seek to use energy and emissions data to reduce operational emissions and energy consumption. The mechanisms by which reporting can help to deliver this outcome may not be best supported by financial reporting requirements that focus on future financial value. Nonetheless, whatever the objectives of the reporting organisation, awareness of developments in sustainability reporting in financial reporting frameworks can help to inform choices and drive good practice.
Chapter conclusions
- There are many approaches to emissions measurement and reporting
- These can deliver change through different mechanisms
- Reporting objectives are most likely to be met where the right approach is selected
- Reporting organisations can benefit from an awareness of the emissions measurement and reporting landscape, including:
- common challenges for public sector organisations
- the greenhouse gas accounting research landscape
- sustainability reporting within financial reporting
3. Emissions measurement and reporting key components
Chapter 2 provided an overview of emissions measurement and reporting in general. Chapters 3 to 8 provide more detailed explanations of the different components that most frameworks include, starting in this chapter with an introduction to the components, and further explanations of mechanisms of change that can be relevant to public sector organisations, and of data granularity, a key distinguishing feature of different approaches.
Framework components
As part of surveying the landscape of emissions measurement and reporting approaches, the EST research identified the components that make up emissions measurement and reporting frameworks and mapped them in a schematic. The components and associated options from this schematic are summarised below in Table 1.
Table 1: components and associated sub-options from EST schematic
| Components | Options | Chapter |
|---|---|---|
| Requirement | – Regulated – Market driven – Voluntary |
Not covered |
| Data granularity | – Organisation level – Site/building level – Meter/sub-meter level |
Chapter 3 |
| Measurement breadth | – Non-GHGP – Scope 1 – Scope 2 – Partial Scope 3 – Full Scope 3 |
Chapter 4 |
| Emissions sourcing | – Process – Extractive sourcing – Renewable sourcing – Sustainable sourcing – Market based |
Not covered - this report focuses on GHGP based approaches to measurement breadth. |
| Measurement method | – Direct measurement – Estimation via emission factors – Hybrid approach – Modelling |
Chapter 5 |
| Reporting frequency | – One-off – Quarterly – Annual |
Chapter 8 |
| Verification | – Required third party – Internal – Suggested peer review |
Chapter 8 |
| Data collection format | – Excel spreadsheet – Online portal – No format provided |
Chapter 7 |
| Output format | – Dashboard – Report – Suggested table |
Chapter 8 |
| Emissions reduction planning | – Report against previous action – Provided target – Self-generated target – Emissions reduction strategy – Climate mitigation strategy – None |
Not covered – this report focuses on emissions measurement and reporting only (rather than e.g. targets and strategies that it can be applied around). |
| Target audience | – Parliament[footnote 11] – Government – Client – Internal – Public disclosure |
Chapter 9 |
Mechanisms of change
Chapter 2 introduced the 8 mechanisms of change (MOCs) identified in the EST research, through which public sector emissions measurement and reporting can lead to emissions reductions (see figure 1, chapter 2).
MOCs are a key consideration because they link the design of frameworks to outcomes, ensuring that design choices reflect the outcomes sought and how measurement and reporting will lead to these. In this section the 3 MOCs that can be most relevant for public sector organisations seeking to measure and report energy use in and emissions from buildings, are explained further.
Generation of information for operational management to increase efficiency and reduce emissions
This MOC is most relevant for organisations seeking to reduce energy use in and emissions from their buildings.
To reduce bills, energy consumption and emissions from buildings, organisations need data:
- Firstly, organisations need data as they seek to understand energy consumption and emissions at a strategic, estate-wide level, to inform strategy development, target-setting and prioritisation, enabling the selection of specific buildings and sites to intervene at, and in an appropriate order
- Next, more granular data is needed on individual sites and buildings so that energy consumption and emissions can be understood in detail and interventions to reduce emissions and energy consumption can be designed. This might include upgrades to building fabric and installation of renewable heat and in some cases renewable electricity generation
- Finally, granular energy and emissions data are required on an ongoing basis as part of business as usual, so that energy savings can be measured accurately, attributed to the correct buildings where projects have been installed and energy consumption and emissions can be managed and optimised
Where organisations seek information that can help them to manage and reduce their energy consumption in and emissions from buildings, they should select approaches to emissions measurement and reporting that seek to drive change by providing organisations with data required to operationally manage emissions and energy consumption. These can be distinguished from approaches that seek to drive change in other ways, for example approaches that drive change through accountability do not require such granular data as those that seek to drive change through operational management.
Communication with internal stakeholders
Reducing emissions from buildings, through reducing the associated energy consumption, relies on internal stakeholders like board members and senior leaders in an organisation prioritising and allocating funding towards these outcomes. To make those decisions, they require data to make them aware of the problem, the possible solutions, and their costs and benefits. The use of recognised frameworks and standards, can further help provide assurance about the quality and accuracy of the data.
Similar to the examples noted above, frameworks seeking to drive change through this mechanism can be distinguished from those working through operational management, in that they require less granular data; board members and senior leaders do not require the same information that energy managers do.
Enhanced transparency and creating accountability
The EST research found that all emissions reporting frameworks rely to a certain extent on enhancing transparency and creating accountability – whether internally, to the government, to parliament, to investors or funders, or to the general public – as a mechanism to drive change and decarbonisation actions, as performance can be measured against data. Furthermore, transparency and accountability are relevant for all existing frameworks given they all make emissions levels more transparent to some audience, thereby providing a reference point for accountability.
Accountability can sit at different places within an organisation and where/who is accountable will determine the audience to whom they are accountable. For example, an internal sustainability manager/energy manager is likely to be responsible for efficient energy consumption and reporting within an organisation, and the organisation will hold them accountable. Alternatively, an executive team and/or governance boards are responsible for the environmental sustainability of an organisation as a whole and their accountability applies both internally to staff and externally to clients, the public and investors.
Where measuring and reporting emissions seeks to create transparency and accountability, it is key to consider where that accountability sits and who the audience benefiting from transparency is, to determine what sort of data and reporting approach is most likely to deliver on this.
Data granularity
Energy consumption and emissions data can be measured and reported at different levels. In this section we explain different levels of data granularity using organisational level, site/building level and meter/sub-meter level as reference points.
Different approaches to emissions measurement and reporting work best with different levels of data granularity. More granular data can be more helpful in designing targeted efforts to decarbonise and improve energy efficiency, but these approaches can also create more complexity and additional steps for organisations.
The difference between these levels of data granularity is described below:
-
Organisation level: The majority of frameworks require emissions data at the organisational level, as this level of information is deemed sufficient for the purpose of bringing transparency and tracking progress on organisations’ climate performance. This is focussed on central reporting for a collection of interconnected bodies feeding up their organisational hierarchy. This can be done at 2 different levels:
- Primary level: In the public sector, this would be equivalent to the Department of Health and Social Care reporting for some or all of the health sector, and the Ministry of Defence for the defence sector
- Secondary level: This would be equivalent to an NHS trust in the health sector or a front-line command in defence, capturing all the sites and or buildings under that organisation
- Site/building level: Focused on sub-organisational emissions measurement and reporting at a building or site-level, which can then be aggregated up organisational hierarchies, to support centralised reporting. For example, measuring the emissions at each site and hospital within an NHS trust.
- Meter/sub-meter level: Focused on emissions measurement and reporting at a meter and sub-meter level within a site or building, including for different equipment on site. This tends to be the most granular emissions measurement and reporting approach possible, capturing data on energy consumption of specific areas and equipment. For many organisations which occupy space within a building, sub-metering can be an effective means of measuring and calculating emissions directly attributable to them. Sub-meter level monitoring could also be used to assess the effectiveness of an energy efficiency measure
An illustration of these approaches to data granularity can be seen in Figure 2.
Figure 2. Approaches to data granularity illustrated across key sectors
| Approach | Health | DESNZ | Defence |
|---|---|---|---|
| Organisation (primary) level | Department of Health and Social Care | Department for Energy Security and Net Zero | Ministry of Defence |
| Organisation (secondary) level | NHS Trust | Arm’s Length Body (ALB) | Front line commands and enabling organisations (e.g. Defence Equipment & Support (DE&S) |
| Site/building | Site or building level e.g. a specific hospital | Site or building level e.g. office block | Site or building level e.g. individual barracks, naval bases and airfields |
| Meter or sub-meter | Meter or sub-meter within site/building | Meter or sub-meter within site/building | Meter or sub-meter within site/building |
Data granularity – further considerations
As explained above it is important that the level of data granularity used in emissions measurement and reporting is suited to the approach being used and how it is intended to drive change. Data granularity is also impactful in relation to other areas that reporting organisations are likely to want to consider:
Reporting burden:
More granular data is generally more burdensome to collect than less granular data, because it will include more datapoints and also in relation to systems, processes and infrastructure requirements.
Organisation level data on energy consumption and direct emissions from buildings can generally be taken from energy bill data (in conjunction with conversion factors for emissions). This is more straightforward and less burdensome than collecting site-level data, which would require the same process across sites in scope, with meter/sub-meter level granularity being the most burdensome due to another increase in datapoints, and also more complex infrastructure and systems required in terms of the physical meters and any software and processes used for capturing so much data.
It can be helpful to consider added burden however, or burden relative to resources. For example, an organisation with comprehensive metering, sub-metering and building energy management systems may actually find measuring and reporting energy consumption and emissions at this level of granularity less burdensome relatively than a primary school with little resource finds generating organisation level reports.
Consistency and comparability:
Increased data granularity supports consistency and comparability of data within and across organisations, by improving confidence that consistent measurement methods are being used and by allowing more granular and therefore accurate comparisons of subjects.
Conclusion
This chapter introduced common components of emissions reporting frameworks, provided further explanation of the mechanisms of change that are likely to be most relevant to public sector organisations seeking to measure and report energy use in and emissions from building, and provided some explanation and consideration of different levels of data granularity that can be used.
The next chapter provides a more detailed explanation of another important framework component, measurement breadth.
4. Measurement breadth
Introduction to measurement breadth
This chapter explains the concept of measurement breadth, and how organisations can determine which emissions to measure, including across different categories of emissions. It is distinct from setting an organisational boundary, which is covered in chapter 7.
Emissions scopes can be used to distinguish different emissions. The term was established by the GHGP which defines 3 scopes (as shown in table 2):
- Scope 1 emissions occur from sources that are owned or controlled by a company, for example from combustion in owned or controlled boilers and vehicles
- Scope 2 emissions occur from the generation of purchased electricity, steam and heating / cooling
- Scope 3 emissions are the remaining indirect emissions (after Scope 2) occurring from sources in a company’s value chain that are owned or controlled by other companies
Table 2: Emissions scope categories
| Scope category | Emission source |
|---|---|
| Scope 1 – direct emissions from sources owned or controlled by the company | – Stationary combustion sources e.g. Emissions from a gas boiler, incinerators – Mobile combustion sources e.g. Emissions released during the combustion of fuels in transport i.e. cars, trucks, ships – Process emissions e.g. Emissions released during physical or chemical processes – Fugitive emissions e.g. Unintentional release of gases often from equipment or leaks |
| Scope 2 – indirect emissions from purchased energy | – The generation of electricity, heat or steam from non-owned sources |
| Scope 3 – indirect upstream and downstream emissions not owned or controlled by the company (Upstream) |
– Purchased goods and services – Capital goods – Fuel- and energy-related activities (not included in Scope 1 or Scope 2) – Upstream transportation and distribution – Waste generated in operations – Business travel – Employee commuting – Upstream leased assets |
| Scope 3 – indirect upstream and downstream emissions not owned or controlled by the company (Downstream) |
– Downstream transportation and distribution – Processing of sold products – Use of sold products – End-of-life treatment of sold products – Downstream leased assets – Franchises – Investments |
Most frameworks use the GHGP scope categories when defining measurement breadth and in the remainder of the chapter we further explain some of the key considerations around measuring and reporting against each of the emissions scopes.
Scope 1 emissions
Scope 1 emissions come from sources owned or controlled by the organisation. Measuring and reporting Scope 1 emissions can help provide organisations with information and incentives needed to manage their own emissions and energy consumption. Scope 1 emissions are generally directly controlled by public sector organisations and will not be abated by other actors. Abating these emissions by replacing fossil-fuel boilers with low-carbon alternatives has similar energy security benefits to the Clean Power 2030 target as it can reduce the public sector’s vulnerability to volatile global fossil fuel markets.
Though Scope 1 emissions from mobile combustion sources and process emissions are less significant sources of public sector emissions, these are still important for organisations to manage to achieve net zero and clean power 2030. This is covered in more detail in the ‘Net Zero Government Initiative: UK Roadmap to Net Zero Government Emissions’ report.[footnote 12]
Treating mobile sources supports the government’s commitment for 100% of the central government car and van fleet to be zero emission by 2027, and the manifesto commitment to phase out the sale of new internal combustion engine (ICE) cars by 2030, with all new cars and vans being fully zero emission by 2035.[footnote 13] [footnote 14] Related to this, it is worth noting that fleet-related emissions will increasingly be accounted for in Scope 2 measurement, due to use of EV charge points on buildings.
Process emissions (see Table 2 for more details) will not be relevant for many public sector organisations, but for some organisations these will be a significant part of their total emissions. These can in some cases be in scope of policies like the UK Emissions Trading Scheme, and Climate Change Agreements.
Any emissions measurement and reporting will increase the burden compared to doing nothing, but Scope 1 measurement and reporting is the most straightforward and can be feasible for organisations with limited capacity and capability.
Finally, measuring and reporting Scope 1 emissions offers good alignment with wider emissions measurement and reporting frameworks in both the public and private sectors.
Scope 2 emissions
Scope 2 emissions are those resulting from the generation of purchased energy, commonly grid electricity. As well as reducing energy bills locally through reduced consumption, organisations reducing their Scope 2 emissions can have system-wide benefits that will help Britain to become a clean energy superpower. Whether this is through boosting renewable generation or reducing peak demand and the cost of transitioning to clean power, reducing electricity consumption or moving to renewable electricity can help to break our dependence on volatile fossil-fuel markets and improve energy affordability and lower bills for all consumers. High energy bills are a big challenge for schools, hospitals, leisure centres and other parts of the public sector, diverting money from service delivery. Measuring and reporting Scope 2 emissions can help organisations to reduce their energy consumption and transition to renewable generation, reducing bills and emissions.
Reducing Scope 2 emissions is also a key enabler in reducing Scope 1 emissions from buildings by:
- reducing energy bills to make low carbon heating more affordable
- reducing heat demand that must be met by low carbon replacements for fossil fuel heating
- improving the efficiency and performance of heating systems
Although organisations cannot operationally manage the emissions resulting from consumption of grid electricity, which are controlled by electricity generators, Scope 2 data is key to enabling the operational management of energy consumption.
Similarly, it will be important for organisations to be mindful of where reductions in Scope 2 emissions result from action they have taken, versus grid decarbonisation, to avoid complacency and enable good decisions to be made.
The burden on organisations is similar for Scope 1 and 2 emissions, which is supported by findings in the EST research that interviewees generally found this straightforward to measure and report.
Scope 1 and 2 emissions are also similar in terms of alignment with wider emissions measurement and reporting frameworks, with both commonly included.
Scope 3 emissions
Measuring and reporting Scope 3 emissions can be a powerful tool for delivering increased understanding of value-chain emissions, identifying opportunities for reducing an organisation’s Scope 3 accounts, and creating market pressure towards abatement of Scope 3 emissions at source. Compared to measuring Scope 1 and 2 emissions though, it can be harder to measure Scope 3 emissions, with more issues around data accessibility, quality and accuracy. Ultimately this can impact how the data can best be used. In addition, as Scope 3 emissions by definition capture emissions that are outside of an organisation’s own control, using the data to improve environmental outcomes is more difficult.
When dealing with large scale contracts, the Procurement Policy Note 06/21 does require some public sector organisations to obtain certain categories of Scope 3 data.[footnote 15] For some organisations, addressing Scope 3 emissions can be key to mitigating negative environmental impacts arising from their activities, and it is important that organisational policies and choices address value chain emissions. National Highways has gone further than this, committing to specific targets for its Scope 3 emissions in its net zero plan.[footnote 16]
National Highways has committed to cutting emissions from maintenance and construction by 2040. They are one of the UK’s largest buyers of construction materials and the emissions from the maintenance and construction of their network led to emissions of around 439,000 tCO2ce in 2024/25.[footnote 17] This presents a significant opportunity to catalyse Britain’s construction industry to deliver the Committee on Climate Change’s call for the construction industry to be largely decarbonised by 2040. So, for an organisation like this, with substantial market influence in a high carbon sector, targeted Scope 3 reporting can be a powerful tool for decarbonisation. The methodology which underpins a framework is important to consider. For example, methodologies like consequential project level analyses may in some cases be better suited to understanding and making decisions regarding value chain emissions, for example the Local Transport Quantifiable Carbon Guidance published by DfT.
Whilst it can be important and useful to measure and report Scope 3 emissions, these are the most challenging to measure and in many cases the burdens imposed may be disproportionate to the benefits, for example where benefits are simply reduced accounts of Scope 3 emissions without actual environmental benefits.
Compared to Scope 1 and 2 data, Scope 3 data is generally less accurate, because:
- Whilst the method of combining activity or consumption data with an emissions factor is common, generally these inputs are less available and reliable for Scope 3 emissions than for Scopes 1 and 2. This results in less granular and specific information, which is relatively less useful and more difficult to use well
- More specifically, GHG data for individual goods and services is often difficult to obtain, so organisations typically take a measure of consumption or some proxy. For example, amount of petrol purchased, or miles driven, or more often a broad area of spend grouped by industry classification for upstream goods and services and sales for downstream goods and services is combined with an emissions factor based on an industry average which may not be accurate for a specific product(s) within that industry
- This lack of granularity is impactful when comparing organisations, or the same organisation over time. Comparisons will only be meaningful where they take into account the underlying granularity of the relevant data. For example, if a company moves its consumption to a less polluting supplier within an industry but reports Scope 3 emissions based on an industry average emissions factor, the real-world change will not be reflected in their data, and comparing its emissions before and after the change in supplier will not be meaningful. Where industry average emissions factors are used, changes are only reflected where the change allows for a different industry average emissions factor to be used, for example when moving business travel from flights to trains
- Scope 3 data can also require more expertise to interpret, with a greater risk of perverse incentives arising. For example, a measurement approach based on spend data combined with an industry average emissions factor can suggest that cheaper suppliers are less polluting and should be purchased from, whereas in reality low-carbon production often carries a premium. Essentially, the emissions data that is commonly captured for Scope 3 is often inadequate in providing accurate enough information to make informed decisions about which actions will lead to a reduction of emissions in both the company account and in practice and for this reason it is also poorly suited for setting targets
- Scope 3 reporting by design does not measure something that is comparable to Scope 1 reporting: as Scope 3 emissions relate to upstream supply and downstream consumption these may have been generated in the past or be generated in the future, though the reporting entity’s relevant activity takes place in the reporting year. Scope 1 and 2 reporting on the other hand only includes emissions generated in the reporting year
- Scope 3 measurement and reporting approaches can involve counting the same unit of emissions many times in the accounts of multiple companies. Concerns from some researchers about this are that it leads to assigning accountability to too many organisations, which they equate to assigning no one responsibility for anything.[footnote 18] It is not yet clear that alternative solutions have been fully developed, but the concern remains among some academics that Scope 3 measurement and reporting is poorly suited to attributional measurement and reporting approaches
- Lastly, ownership and control of the emission sources sit outside the reporting company, and for abatement to occur action is required by the company that owns and controls the emission source – thereby the reporting company is not in control of the emissions at source, and whilst it can reduce its Scope 3 account and create a market signal incentivising abatement through procurement choices, it cannot directly abate the emissions. Although this is like Scope 2 emissions in the fact that organisations cannot operationally manage the emissions resulting from consumption of grid electricity, a key difference is that Scope 2 data is key to enabling the operational management of energy consumption
Organisations commonly compare the total size of their Scope 1 and 3 emissions, which can lead to ineffective or misinformed decisions where these do not consider these important issues, and the differences between what they measure compared to Scope 1 emissions.
However, whilst measuring and reporting Scope 3 emissions can be challenging, there is common consensus that there is value in doing so, in particular to identify emissions hotspots in an organisation’s value chain, enabling further assessment of how to and whether it can be cost-effective to address these.[footnote 19]
Further, many of the challenges regarding the accuracy and availability of Scope 3 data can be mitigated where suppliers provide details of the emissions embodied in the products they supply, enabling more accurate and straightforward measurement and reporting of upstream Scope 3 emissions.
Scope 3 emissions have been included in some initiatives for the largest private sector organisations. In the private sector, Scope 3 emissions disclosures may enable better investor assessment of environmental risks and long-term sustainability. For example, HMG published UK Sustainability Reporting Standards (UK SRS), based on ISSB Standards, in February 2026. UK SRS provides for Scope 3 reporting where the information is deemed material to primary users, with the aim of disclosing information to investors about climate-related risks and opportunities. In addition, the Transition Plan Taskforce’s (TPT) recommendations state that best practice transition planning should consider Scope 3 emissions, and disclosures of any Scope 3 emission targets should be disclosed in line with its disclosure framework, which is being incorporated into the ISSB’s suite of guidance materials. In its manifesto, the government committed to mandating transition planning for UK-regulated financial institutions and FTSE100 companies and the government has recently consulted on options to take forward climate-related transition plan requirements in order to provide the market with credible and decision-useful information. The government is considering the TPT disclosure framework as part of this work. Some UK private sector organisations are also required to report their Scope 3 emissions related to business travel through the Streamlined Energy and Carbon Reporting (SECR) framework.
Conclusion – Scope 3
Scope 3 measurement and reporting can be a powerful tool for delivering increased understanding of value-chain emissions, identifying opportunities for reducing organisations’ Scope 3 accounts, and creating market pressure towards abatement of Scope 3 emissions.
Data limitations must however be recognised, and often Scope 3 data may not be well suited to external reporting to facilitate comparisons between organisations, or the same organisation over time, or setting targets and publishing performance towards these. However, it can help identify and monitor hotspots within a company’s overall value chain, which can be explored further by looking past industry-average data to identify meaningful options to consume cleaner goods and services or to reduce demand for particular goods or services.
5. Measurement methods
This chapter explains the approaches that can be used for measuring the amount of greenhouse gases emitted by a process.
Introduction to measurement methods
There are 3 main measurement methods:
- direct measurement
- estimation using activity data and emissions factors
- emissions factors, and modelling
It is worth noting that definitions of these methods can vary.
Direct measurement
Direct measurement involves physically monitoring the flowrate or concentration of emissions directly at source. Methods can vary depending on the process, with some variations in cost and accuracy. Overall direct measurement can be considered the most accurate due to resulting certainty that actual physical emissions have been measured, but also the most burdensome, due to the equipment and resources required for testing. For these reasons it is not a commonly used method.
Estimation using activity data and emissions factors
Estimation using emissions factors involves multiplying activity data, relating to a process or consumption of a good or service etc., by an emissions factor, to derive the emissions caused by that activity. While less accurate in that measurement is not direct, estimation is less burdensome and more accessible, which can facilitate more comprehensive reporting. The accuracy of this method depends on the accuracy of the input data, which can vary significantly. For gas combustion for heating (Scope 1) accurate activity data is easily available via metering and bills and reliable emissions factors exist too. This is similar for consumption of grid electricity (Scope 2) though emissions factors can be slightly less accurate as grid averages are used. When seeking to estimate Scope 3 emissions, accurate data is less available. Spend data is commonly used as a proxy for activity data, which can be product or even sector level, with emissions factors (where available) often being based on industry averages.
Modelling
Modelling of emissions captures all other methods of estimation using proxy data. Examples include benchmarking approaches where emissions from a building might be modelled based on estimates from a similar building with inputs modified to reflect difference in building materials, floorspace and occupancy. The burden and accuracy of modelling approaches vary with the sophistication of the approach and accuracy of input data. Modelling can be particularly useful when you do not have access to activity data or where activity data is unreliable.
Conclusions
There are a range of measurement methods that can be used for measuring the emissions relating to a particular source or process. Generally, accuracy and burdensomeness are proportionally related, and organisations will want to consider the level of precision and granularity that their reporting outcomes and mechanisms of change require and tailor the measurement methods used accordingly.
Notably direct measurement is very burdensome compared to modelled approaches, and is unlikely to be proportionate other than for very large sources or where high degrees of accuracy are required.
Modelled approaches can vary significantly in accuracy depending on their sophistication and the quality of the underlying data. For Scope 1 and 2 emissions for example, the emissions factors can be very accurate and when combined with accurate activity data, produce a reliable report with relatively low burden. However, the most appropriate approach will depend on each organisation and its breakdown of emissions.
Modelled approaches can vary significantly in accuracy depending on their sophistication and the quality of the underlying data. For scope 1 and 2 emissions for example, the emissions factors can be very accurate and when combined with accurate activity data, produce a reliable report with relatively low burdensomeness. However, the most appropriate approach will depend on each organisation and its breakdown of emissions.
6. Organisational boundaries, including leases
Introduction to setting organisational boundaries
Organisational boundaries define the operations that should be included when organisations measure and report their emissions. Setting a clear boundary enables organisations to be clear on which services and activities are to be included in the inventory, consistent across reporting cycles, and transparent about what is included and excluded.
Common approaches to setting organisational boundaries
Organisational boundaries are defined in the GHGP as “the boundaries that determine the operations owned or controlled by the reporting company”.[footnote 20] It outlines 2 main approaches – a control approach and an equity share approach:
-
Control approach: Under the control approach, the GHGP specifies that companies should account for all emissions from operations where they have control. This includes facilities that they own and operate themselves, as well as those they operate under a lease, contract, or agreement. The control approach has 2 subcategories:
- Operational control: defined as having “the full authority to introduce and implement its operating policies at the operation”. Under the operational control approach, a company accounts for 100% of emissions from operations over which it or one of its subsidiaries has operational control Financial Control: relates to the authority over an operation’s financial and operating policies with a view to gaining economic benefits from its operations. This approach defines the organisational boundaries for emissions reporting based on which entities the organisation has financial control over. An organisation accounts for 100% of the GHG emissions over which it has financial control
- Equity share approach: is where an organisation accounts for GHG emissions from operations and assets according to its share of equity in the operation. The equity share reflects economic interest, which is the extent of rights an organisation has to the risks and rewards flowing from an operation. Under this approach an organisation would include all of the emissions from wholly owned operations, and a percentage of emissions from shared operations based on their stake
There are also examples of reporting frameworks that deviate from the approaches laid out in the GHGP. For instance, the Welsh Net Zero Carbon Reporting Guide sets out a service-based approach that is bespoke for the public sector in Wales. This method categorises emissions on a sub-sector basis by the type of service or activity (such as transportation, waste management, healthcare) provided by each type of public sector organisation (Welsh Government, local authorities, Health Trusts etc.) rather than strictly by legal ownership or operational control.
Considerations for public sector organisations
Like other components of reporting frameworks, the different options for setting an organisational boundary should be matched to the organisation’s desired reporting outcomes and the mechanisms by which reporting is to deliver these.
For example where an organisation seeks to use the information to make operational changes to reduce emissions and energy consumption, an operational control approach can work well by specifically holding the organisation accountable in respect of its operations, and providing information on areas that it has operational control over, whereas an equity share or financial control approach would see areas that the organisation may not have operational control over included in the reports.
Conversely where reporting seeks to deliver change by making a private company accountable to shareholders and investors, an equity share or financial control approach can help to deliver this, by ensuring that operations relevant to an organisation’s value are included in the reports, even where these are not operationally controlled by the reporting organisation.
Separately, if organisations are intending to also use their emissions data to support financial reporting, they may want or need to follow financial accounting rules to draw their organisational boundaries. While this is not the same as following a financial control approach as per the GHGP, there may also be examples where following a financial control approach is most appropriate for an organisation.
It is also important to note that the wider landscape does not describe a single prevailing approach to organisational boundaries:
- SECR outlines the 3 GHGP approaches but does not prescribe one
- IFRS S2 implies entities should follow one of the GHGP’s 3 boundary definitions
- IFRS S1 requires that entities use the same boundaries as the financial statements
Whilst an operational control approach can be most relevant for public sector organisations in many cases, applying it can also be particularly complex due to complex ownership structures:
For example, it is quite common to have collaborative agreements between public sector and private sector companies known as Public-Private Partnerships (PPPs). These are long-term agreements between the government and a private partner, where the private partner delivers and funds public services using a capital infrastructure asset.
These have been used to build or operate hospitals and schools and were designed to transfer project development and management risks to the private sector while delivering projects quickly. However, historic results were mixed, and current guidance emphasises the importance of considering costs and benefits over the whole life of a project.
Note that, PPPs involve collaboration between public sector and private sector companies and can have different levels of operational control for each party. Emissions reporting would need to/could take into account the specific contract arrangements to consider apportioning of emissions. Even where operational control exists, it can be the case that the organisation still does not have control over emissions. This is because the GHGP definition of operational control requires having authority to influence and manage the operating policies and activities of an organisation. This is often the same as having control of decisions which lead to decarbonisation but not always.
Leased assets
Leased assets can present complications when setting emissions reporting boundaries and will be relevant for many organisations.
Different types of leasing arrangements exist, with a range of decision-making structures. This means that there is huge variety in who might control decisions that impact emissions in a leasehold arrangement. Broadly, leases are either operating or finance leases. Operating leases tend to be shorter with the lessor retaining ownership and responsibility for maintenance, repairs and insurance, whereas finance leases see the lessee bear the costs of maintenance and insurance with the chance to buy the asset at the end of the lease.
These and other variations can therefore give rise to a range of situations when deciding how to report emissions:
- a number of public sector organisations might occupy the same building with variations in the proportion of the building that they occupy.
- a public sector organisation might lease an asset to an organisation outside the public sector to deliver a public service
- 2 or more public sector organisations might occupy the same leased building from another public sector organisation or a private sector organisation
- a public sector organisation might lease an asset to/from a private sector organisation, for a use unrelated to public service
- a public sector organisation might not have access to activity data needed for emissions reporting, from assets that it is the lessee in
So, it can be complex for an organisation to understand which leased assets to include when measuring and reporting emissions. Key challenges include determining who holds operational control, where contractual and practical arrangements can be complex and layered.
Access to data can be challenging for owner-occupiers and the addition of further parties with complex relationships can make this even more challenging. Double counting is also a concern. It is common for multiple public sector organisations to occupy the same premises in different proportions, and these may be leased from another public sector organisation, or the private sector. Therefore, decisions need to be made about who reports, and all parties need to be aware of how others are handling the reporting if they are to avoid double counting. Our early engagement has shown there is precedent in these situations for public sector organisations to arrange between themselves who reports.
Conclusion
There are a range of approaches to setting organisational boundaries. Where possible the chosen approach should match the desired reporting outcomes and mechanisms by which reporting is to deliver this. Organisations should be mindful of common complexities and challenges inherent to the different approaches, for example in determining where operational control rests.
7. Data collection
Introduction to data collection
Data collection describes the mechanism used to gather and collate data and generally involves some type of tool. The EST research found that across the frameworks surveyed, there were 3 main approaches to data collection tools:
- No tool provided
- Tool provided – spreadsheet
- Tool provided – online portal
This chapter considers the relative merits of each, as well as practical examples of their use.
Data collection tool: considerations
Providing a data collection tool is typically common practice for emissions reporting frameworks in the public sector as it facilitates data capture and the conversion of activity data to estimated emissions, reducing barriers to action and the burdens on organisations where they do not have existing tools or the capability to create these.
Providing a tool can also help to drive accountability through consistency, by increasing the likelihood that organisations are using the same input data and emissions factors.
Key considerations when determining what type of tool to use, include software costs, user interface, ease of development, ease of data entry, ease of modification and shareability. Information on these factors needs to be weighed up so that development and maintenance costs are proportionate.
Spreadsheet tools, for example, are likely to require lower technical expertise to execute and use and incur lower short-term costs due to its comparative simplicity. However, spreadsheet tools are likely to need regular updates to remain current and may be lower quality than tools created with alternative web-based software.
This compares with web-based dashboards which may require slightly more upfront costs and skills to generate (possibly requiring external expertise) but may produce a more user friendly and visually appealing product.
A mixture of approaches exists in current frameworks. Most private sector frameworks do not specify the tool that organisations should use, but the provision of a tool appears more common in the public sector.
The public sector currently uses a combination of web-based and spreadsheet tools to manage its data collection. Defra, for example, uses a spreadsheet tool for data collection for the GGCs. This decision is based on value for money considerations and functionality. This compares with the Welsh Government, who use a web-based tool to support reporting.[footnote 21] This allows organisations to more easily analyse and use data but carries additional costs to develop.
Ultimately, the decision on what tool public sector organisations should use will be driven by resourcing, intended use cases and value for money considerations.
Conclusions
There are several approaches organisations can take towards data collection when seeking to measure and report their emissions. Key considerations for organisations when determining what type of tool to use include; software costs, user interface, ease of development, ease of data entry, ease of modification and shareability. When seeking to select a data collection tool, key pros and cons in relation to different methods should be tested against these factors.
8. Publication and verification
This chapter introduces and explains different approaches to publication and verification of emissions data.
Publication is used to refer to the act of sharing collected data with an external audience. Verification is used to refer to the review and quality assurance of collected emissions data to ensure its accuracy and support transparency, accountability and internal decision-making.
Publication
Broadly, emissions reports can either be published or unpublished. Like other elements of emissions measurement and reporting, the best approach can be determined by considering the reporting outcomes sought, and mechanisms by which these are to be delivered.
Using reports internally without publishing would align with approaches seeking to drive emissions reduction through operational change, or through internal accountability, where the audience and users might be energy managers responsible for identifying and delivering the relevant operational changes needed, or more senior internal decision makers who determine strategies and prioritise actions.
Publication on the other hand ensures that organisations’ energy consumption and emissions performance are transparent over time, creating external accountability and incentive for organisations to act. This is supported by the EST research which highlighted that public disclosure of emissions is seen to lead to a faster reduction in emissions because of the transparency it enables. It also promotes consistency by highlighting inconsistencies and shows leadership.
All of these factors can be amplified by a centrally managed and enforced process. For example, regular aggregated updates on total public sector emissions are published through the UK territorial greenhouse gas statistics[footnote 22], which are also used to monitor progress towards the UK’s climate targets.
The Welsh Government centrally supports publication of emissions data whereas frameworks like TCFD do not have a central publication function and instead recommend publishing climate related materials alongside existing financial filings.
Publishing data requires extra effort for reporting organisations, however, the additional effort required for publication compared to generating emissions data is often negligible. Furthermore, a decentralised approach with flexibility over format, helps to reduce the burden for organisations that might otherwise find this prohibitive, or have existing processes that can be retained.
The audience for published information may vary across the sector however, as public sector organisations are diverse. Publishing organisations should consider the expected audience for their reports and ensure that data provided gives a suitable view of organisational performance.
Verification
Verification of emissions data helps improve the accuracy and credibility of reported emissions data, maximising its usefulness for a range of purposes.
The following approaches to verification are most common:
- Internal verification: Reporting tools (chapter 8) may be designed to check data input or organisations may internally review emissions data, considering issues such as whether emissions factors used are accurate, whether measurement tools have produced accurate data and whether it has been recorded accurately, and whether third parties (where appropriate) have provided realistic emissions data
- Peer review: Staff, ideally with relevant expertise or experience in working with data, internal to an organisation (or in another organisation in the same sector) consider and scrutinise emissions data to confirm whether data is accurate and identify errors to be corrected
- Independent third-party review: External contractors or organisations may be used to perform independent reviews of data. These contractors typically specialise in data reviews and provide an external perspective on the quality of data. External verification approaches typically incur costs to organisations
- No verification: Organisations may not verify emissions data. However, this may limit the validity of the data produced and make data publications less trustworthy
Conclusions
Publication and verification are key to improving both the accuracy and credibility of reported emissions data.
There are various approaches organisations can take to verifying their emissions data, including; internal verification, peer review and independent third-party review. Across existing frameworks such as SECR, Welsh and Scottish reporting frameworks, external verification of data is not required but is recommended. Organisations should consider these different levels of verification, their benefits and what assurance they can provide, whilst weighing this against any potential burdens these different options may create.
On publication, internal reporting can be an effective tool for driving operational change and strengthening accountability within organisations, while publication enhances transparency, creates external accountability, and can accelerate emissions reductions. The most effective approach for different organisation may combine both approaches, supported by proportionate, flexible processes that reflect organisational capacity and audience needs. Ultimately, ensuring that emissions data is used meaningfully (whether internally or externally) is key to driving sustained progress on decarbonisation.
-
DESNZ (2025) ‘Provisional UK greenhouse gas emissions statistics 2024’. Note: Emissions reported by sector on a source basis. Emissions from electricity and fuel supply are allocated their own sectors rather than where the electricity and fuels are used. The full Territorial Emissions Statistics (TES) sector definition is Buildings and product uses. ↩
-
Figure taken from ‘Digest of UK Energy Statistics (DUKES): electricity’, Table 5.1 using row 50, compared with row 27 ,to calculate public sector electricity use. ↩
-
This is not a comprehensive list but serves to illustrate the range of approaches. ↩
-
This is not specifically relevant to public sector buildings as they are not part of the UK ETS, but for industry that is covered by the ETS and CBAM, emissions measurement can facilitate the operation of the scheme. ↩
-
DESNZ (2024) ‘Emissions measurement and reporting approaches for the public sector’ ↩
-
Energy Systems Catapult (2021) ‘Public Sector Decarbonisation Guidance’ ↩
-
Matthew Brander (2022) ‘The most important GHG accounting concept you may not have heard of: the attributional-consequential distinction’ ↩
-
Michael Gillenwater (2025) ‘What is an “emission reduction”? And when you should be you avoiding saying “reduced”?’, GHG Management Institute, January 2025 ↩
-
Gunther Glenk (2024) ‘Decision-Useful Carbon Information’ (June 30, 2024), TRR 266 Accounting for Transparency Working Paper Series No. 121; and Gunther Glenk (2025) ‘Corporate Carbon Accounting: Current Practices and Opportunities for Research’, Foundations and Trends in Accounting, Vol. 19 No. 3-4 ↩
-
Stefan Reichelstein and others (2025) ‘An Accounting Architecture for CO2-Statements’, TRR 266 Accounting for Transparency Working Paper Series No. 197 ↩
-
Parliament wasn’t explicitly listed as a target audience in the EST research but has been added here as it is a key audience for annual reports and accounts in the public sector. ↩
-
DESNZ (2023) ‘Net Zero Government Initiative: UK roadmap to net zero government emissions’ ↩
-
DfT (2024) ‘Government fleet commitment’ ↩
-
DfT (2025) ‘Phasing out sales of new petrol and diesel cars from 2030 and supporting the ZEV transition: summary of responses and joint government response’ ↩
-
Government Commercial Function (2021) ‘Procurement Policy Note 06/21: Taking account of Carbon Reduction Plans in the procurement of major government contracts’ ↩
-
National Highways (2021) ‘Net zero highways: Our 2030 / 2040 / 2050 plan’ ↩
-
National Highways (2025) ‘Net zero highways plan: 2025 update’ (PDF) ↩
-
Michael Gillenwater (2023) ‘What is Greenhouse Gas Accounting? Fitting to purposes (N.2)’, GHG Management Institute, March 2023 ↩
-
DESNZ (2024) ‘UK greenhouse gas emissions reporting: Scope 3 emissions - summary of responses’ ↩
-
Greenhouse Gas Protocol (2015) ‘GHG Protocol Corporate Accounting and Reporting Standard (Revised Edition)’ ↩
-
Welsh Government (2021) ‘Public sector net zero reporting guide’, updated May 2026 ↩
-
DESNZ (2025) ‘Final UK greenhouse gas emissions statistics: 1990 to 2023’ ↩