Where we have identified any third party copyright information you will need to obtain permission from the copyright holders concerned.
This publication is available at https://www.gov.uk/government/publications/public-appointments-data-report-202425/public-appointments-data-report-202425-html
Introduction
The data in this report covers public appointments made by United Kingdom Government Ministers to the bodies and offices listed in the Schedule to the Public Appointments Order in Council. These appointments are regulated by the Commissioner for Public Appointments and are referred to as regulated roles.
The report‘s primary focus is on the data on public appointees that were in post as of 31 March 2025 as well as data collected on appointments processes that were run from 1 April 2024 to 31 March 2025.
This is the first public appointments annual data report that uses data collected through the public appointments digital service as its primary source of information. Historical data is included in order to provide context however caution is advised when using this data given the changes to data collection methodology.
Information is correct at the time of report production. Please refer to the statistical note at the end of this report for more detailed information about the data collection and presentation methodology.
Section 1: Headline Facts and Figures
The public appointments data report shows that during the 2024-25 reporting year:
449 new appointments were made by UK government ministers.
10,538 applications were submitted through the public appointments digital service.
Ministerial departments took an average of 212 days to complete an appointment.
12% of appointments were completed within three months of the closing date.
On the 31 March 2025, there were 3,915 public appointees, holding 4,033 public appointments. Of those who provided diversity information:
52% were female.
13% were from an ethnic minority.
4% declared themselves as having a disability.
62% were based outside of London and the South East.
27% were from a working class background.
Section 2: Campaign Duration
2.1 Campaign Duration, Overall Performance
In 2024-25:
On average, ministerial departments took 212 days to complete a public appointment campaign. This compares to an average of 148 days in 2023-24 (figure 2.1.1).
Of departments that ran more than one campaign, the Ministry of Defence took the fewest number of days on average (117 days), followed by the Department for Business and Trade (141 days) and the Department for Health and Social Care (177 days). Scotland Office completed a single campaign in 84 days (figure 2.1.2).
12% of appointments were completed within three months of the closing date (figure 2.1.4). This compares to 11% in 2023-24.
Individual office holder appointments took the longest to complete on average (319 days), based on four campaigns (table 2.1.6). For definitions of appointment types, see explanatory note 2.
Figure 2.1.1: Average number of days between closing date and offer accepted, 2024-25 and 2023-24
Year
Days
2024-25
212
2023-24
148
Explanatory Note 1: Campaign Duration
Under the Governance Code on Public Appointments, ministerial departments should aim to conclude each appointment process within three months of a competition closing.
The public appointments digital service collects data on the time it takes to run appointment campaigns. Campaign duration is calculated as the number of days between the closing date and the date that the first offer of appointment is accepted by a successful candidate for the campaign.
As set out in the General Election Guidance 2024, public appointments that required approval by the Prime Minister, and other public appointments that were likely to prove sensitive, were frozen until after the 2024 general election, except in exceptional circumstances.
Figure 2.1.2: Average number of days between closing and offer accepted by ministerial department, 2024-25
Department
Total
Scotland Office
84
Ministry of Defence
117
Department for Business and Trade
141
Department of Health and Social Care
177
HM Treasury
179
Cabinet Office
187
Home Office
187
Department for Education
198
Northern Ireland Office
201
Department for Work and Pensions
207
Department for Science, Innovation and Technology
212
Department for Environment, Food and Rural Affairs
216
Ministry of Justice
219
Department for Culture, Media and Sport
232
Department for Energy Security and Net Zero
232
Department for Transport
251
Ministry of Housing, Communities and Local Government
267
Foreign, Commonwealth and Development Office
273
Table 2.1.3: Average number of days between closing and offer accepted by department, 2024-25 and 2023-24
Ministerial Department
2024-25
2023-24
Cabinet Office
187
125
Department for Business and Trade
141
202
Department for Energy Security & Net Zero
232
180
Department for Science, Innovation & Technology
212
262
Department for Culture, Media and Sport
232
150
Department for Education
198
135
Department for Environment, Food & Rural Affairs
216
125
Department for Transport
251
203
Department for Work and Pensions
207
194
Department of Health and Social Care
177
178
Foreign, Commonwealth & Development Office
273
163
HM Treasury
179
116
Home Office
187
155
Ministry of Defence
117
129
Ministry of Housing, Communities & Local Government
267
103
Ministry of Justice
219
127
Northern Ireland Office
201
84
Scotland Office
84
No campaigns
UK Export Finance
No campaigns
133
Figure 2.1.4: Percentage of campaigns completed within 3 months, 2024-25 and 2023-24
Year
Campaign completed within three months
Campaign not completed within three months
2024-25
12%
88%
2023-24
11%
89%
Table 2.1.5: Number and percentage of campaigns completed within 3 months by ministerial department, 2024-25
Ministerial Department
Total number of campaigns
Percentage completed
Number completed
Percentage not completed
Number not completed
Cabinet Office
6
50%
3
50%
3
Department for Business and Trade
5
20%
1
80%
4
Department for Energy Security & Net Zero
4
0%
0
100%
4
Department for Science, Innovation & Technology
4
0%
0
100%
4
Department for Culture, Media and Sport
17
6%
1
94%
16
Department for Education
10
10%
1
90%
9
Department for Environment, Food & Rural Affairs
14
7%
1
93%
13
Department for Transport
9
0%
0
100%
9
Department for Work and Pensions
6
0%
0
100%
6
Department of Health and Social Care
12
25%
3
75%
9
Foreign, Commonwealth & Development Office
3
0%
0
100%
3
HM Treasury
2
0%
0
100%
2
Home Office
9
11%
1
89%
8
Ministry of Defence
2
50%
1
50%
1
Ministry of Housing, Communities & Local Government
7
0%
0
100%
7
Ministry of Justice
39
13%
5
87%
34
Northern Ireland Office
2
0%
0
100%
2
Scotland Office
1
100%
1
0%
0
Table 2.1.6: Average number of days between closing and offer accepted by appointment type, 2024-25 and 2023-24
Appointment type
2024-25
2023-24
Chair (or equivalent)
187
136
Member (or equivalent)
215
151
Individual Office Holder
319
144
Explanatory Note 2: Appointment Types
Regulated roles are classified into three appointment types: chairs (or equivalent), members (or equivalent) and individual office holders.
Chairs (or equivalent) are responsible for strategic leadership of the board of an organisation and for ensuring its overall effectiveness and delivery against agreed purpose and objectives. They may also be the chair of a non-statutory advisory board or expert panel.
Members (or equivalent) support the Chair in their leadership of the board and provide appropriate scrutiny and challenge to the executive of the organisation. They are often referred to as a non-executive director (NED) or non-executive board member (NEBM).
Individual Office Holders are public appointees who have been appointed to undertake a specific function on behalf of its appointing authority. They are not supported by other non-executive members. Examples include the Children’s Commissioner.
Table 2.1.7: Percentage of appointments completed within 3 months by appointment type, 2024-25
Appointment type
Campaign completed in three months
Campaign not completed in three months
Chair (or equivalent)
20%
80%
Member (or equivalent)
10%
90%
Individual Office Holder
0%
100%
2.2 Campaign Duration, Performance by Stage
In 2024-25:
The average number of days between campaign stages (table 2.2.1) was:
Closing and sift: 29 days
Sift and interview: 50 days
Interview to the offer of appointment being accepted: 133 days
The Ministry of Defence (7 days), Department for Environment, Food and Rural Affairs (14 days) and the Department for Business and Trade (17 days) averaged the fewest number of days between closing and sift (figure 2.2.2).
The Cabinet Office (19 days), the Department for Business and Trade (21 days) and the Northern Ireland Office (25 days) averaged the fewest number of days between sift and interview (figure 2.2.3).
HM Treasury (62 days), the Department of Health and Social Care (65 days) and the Ministry of Defence (81 days) averaged the fewest number of days from interview to the offer of appointment being accepted (figure 2.2.4).
Table 2.2.1: Average number of days between campaign stages, 2024-25 and 2023-24
Campaign stage
2024-25
2023-24
Closing and sift
29
25
Sift and interview
50
37
Interview to offer accepted
133
87
Figure 2.2.2: Average number of days between closing and sift by ministerial department, 2024-25
Department
Total
Ministry of Defence
7
Department for Environment, Food and Rural Affairs
14
Department for Business and Trade
17
Foreign, Commonwealth and Development Office
18
Ministry of Justice
25
Department for Transport
26
Department for Science, Innovation and Technology
27
Department for Work and Pensions
27
Home Office
27
Department of Health and Social Care
31
Northern Ireland Office
32
Department for Energy Security and Net Zero
33
Department for Education
34
Department for Culture, Media and Sport
44
Ministry of Housing, Communities and Local Government
49
Cabinet Office
54
HM Treasury
78
Figure 2.2.3: Average number of days between sift and interview by ministerial department, 2024-25
Department
Total
Cabinet Office
19
Department for Business and Trade
21
Northern Ireland Office
25
Department for Science, Innovation and Technology
28
Home Office
29
Ministry of Defence
29
Department for Energy Security and Net Zero
35
Department for Transport
38
HM Treasury
39
Department for Environment, Food and Rural Affairs
39
Ministry of Justice
51
Department for Education
59
Ministry of Housing, Communities and Local Government
61
Foreign, Commonwealth and Development Office
64
Department for Work and Pensions
66
Department for Culture, Media and Sport
72
Department of Health and Social Care
81
Figure 2.2.4: Average number of days between interview and offer accepted by ministerial department, 2024-25
Department
Total
HM Treasury
62
Department of Health and Social Care
65
Ministry of Defence
81
Department for Business and Trade
104
Department for Education
105
Cabinet Office
114
Department for Culture, Media and Sport
116
Department for Work and Pensions
127
Home Office
132
Northern Ireland Office
145
Ministry of Justice
153
Department for Science, Innovation and Technology
157
Ministry of Housing, Communities and Local Government
158
Department for Environment, Food and Rural Affairs
163
Department for Energy Security and Net Zero
165
Department for Transport
187
Foreign, Commonwealth and Development Office
191
Table 2.2.5: Average number of days between campaign stages by appointment type, 2024-25
Appointment type
Closing and sift
Sift and interview
Interview and offer accepted
Chair (or equivalent)
29
46
112
Member (or equivalent)
29
51
135
Individual Office Holder
27
33
259
Section 3: Diversity of Public Appointees
Explanatory Note 3: Diversity Data Collection
The government collects data about the characteristics and backgrounds of public appointees, including information about people’s educational and professional backgrounds, to make sure that we are attracting a broad range of people to public appointment roles and that our selection processes are fair for everyone.
All diversity data percentages relate to public appointees in post as of 31 March of the reporting year. For individual metrics, if the number of responses relate to groups of less than five individuals, then the data has either been removed from the report, or merged with other groups of less than five individuals. This is to ensure that individuals cannot be identified.
Unless otherwise stated, the government analysis function’s harmonised standards are used to collect this data, in order to improve the consistency, comparability and coherence of our data and statistics.
For benchmarking, the report uses ‘economically active’ data from the Office for National Statistics (ONS). Further information is provided in the general statistical note at the end of the report.
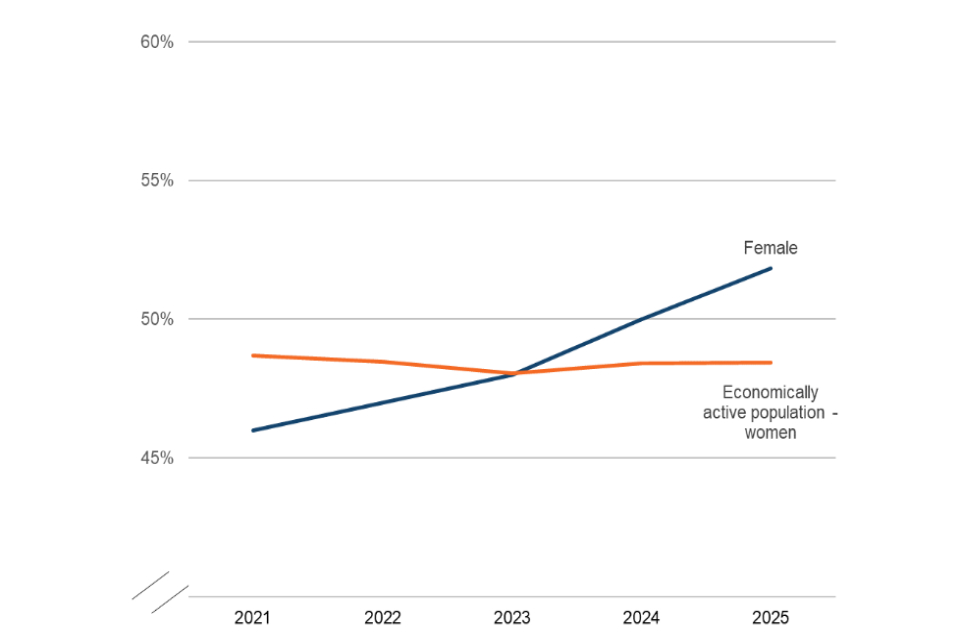
3.1 Diversity of Public Appointees - Sex
We hold data on the sex of 58% of appointees. Of these, as of 31 March 2025:
52% (1,389) were female, compared to 50% in 2024 and 48% in 2023 (figures 3.1.1, 3.1.2 and 3.1.3).
The Northern Ireland Office (75%) and the Ministry of Justice (57%) have the highest percentage of female public appointees (figure 3.1.4).
Women held 45% of chair appointments, 52% of member appointments and 69% of individual office holder appointments (figure 3.1.5).
Figure 3.1.1 Percentage of female and male public appointees, 2025
Gender
%
Female
52%
Male
48%
Figure 3.1.2 Percentage of female public appointees, 2021 to 2025
Year
Female
Economically active population women
2025
52%
48%
2024
50%
48%
2023
48%
48%
2022
47%
48%
2021
46%
49%
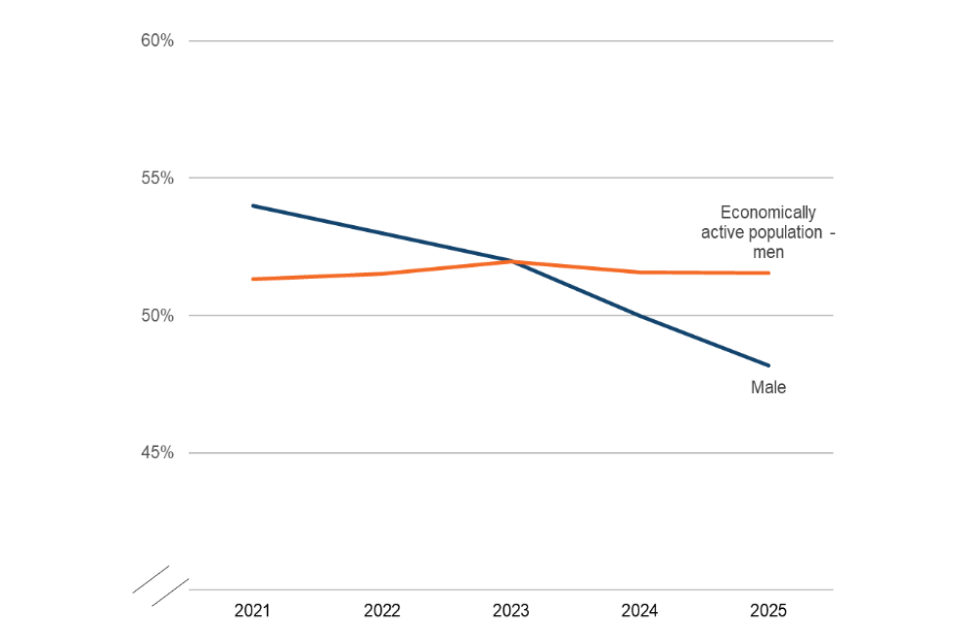
Figure 3.1.3 Percentage of male public appointees, 2021 to 2025
Year
Male
Economically active population men
2025
48%
52%
2024
50%
52%
2023
52%
52%
2022
53%
52%
2021
54%
51%
Figure 3.1.4: Percentage of female public appointees by ministerial department, 31 March 2025
Department
%
Northern Ireland Office
75%
Other departments
65%
Ministry of Justice
57%
Department for Science, Innovation and Technology
53%
Department for Work and Pensions
53%
Ministry of Housing, Communities and Local Government
52%
Home Office
51%
Department for Culture, Media and Sport
49%
Department for Education
49%
Department of Health and Social Care
45%
Department for Transport
44%
Department for Environment, Food and Rural Affairs
38%
Cabinet Office
33%
Department for Business and Trade
33%
Ministry of Defence
32%
Department for Energy Security and Net Zero
21%
‘Other departments’: Foreign Commonwealth and Development Office; HM Treasury; Scotland Office; UK Export Finance.
Figure 3.1.5: Percentage of female and male public appointees by appointment type, 31 March 2025
Category
Female
Male
Chair
45%
55%
Member
52%
48%
Individual Office Holder
69%
31%
Table 3.1.6: Percentage of female public appointees by appointment type, 2021 to 2025
Year
Percentage Chair (or equivalent)
Percentage Member (or equivalent)
Percentage Individual Office Holder
2025
45%
52%
69%
2024
33%
50%
No data available
2023
36%
49%
No data available
2022
35%
48%
No data available
2021
33%
48%
No data available
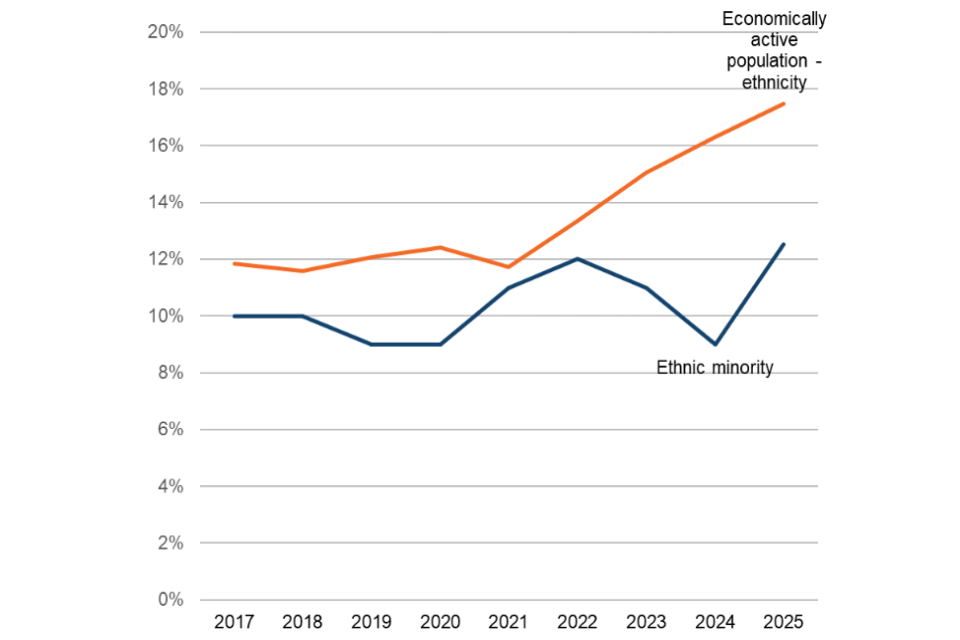
3.2 Diversity of Public Appointees - Ethnicity
We hold data on ethnicity for 51% of appointees. Of these, as of 31 March 2025:
13% (293) were from an ethnic minority background, compared to 9% in 2024 and 12% in 2023 (figures 3.2.1 and 3.2.2).
The Cabinet Office (20%), the Department for Culture, Media and Sport (19%) and the Ministry of Housing, Communities and Local Government (18%) have the highest percentage of public appointees from an ethnic minority background (figure 3.2.3).
8% of chairs were from an ethnic minority background, 13% of members and 18% of individual office holders (figure 3.2.4).
Figure 3.2.1 Percentage of public appointees from an ethnic minority background, 2025
Ethnicity
%
Ethnic Minority
13%
White
87%
Figure 3.2.2: Percentage of public appointees from an ethnic minority background, 2017 to 2025
Year
Ethnic minority
Economically active population - ethnicity
2017
10%
12%
2018
10%
12%
2019
9%
12%
2020
9%
12%
2021
11%
12%
2022
12%
13%
2023
11%
15%
2024
9%
16%
2025
13%
17%
Figure 3.2.3: Percentage of public appointees from an ethnic minority background by ministerial department, 31 March 2025
Department
%
Cabinet Office
20%
Department for Culture, Media and Sport
19%
Ministry of Housing, Communities and Local Government
18%
Department of Health and Social Care
16%
Department for Business and Trade
16%
Ministry of Justice
12%
Home Office
12%
Department for Work and Pensions
10%
Department for Education
9%
Other departments
8%
Department for Environment, Food and Rural Affairs
8%
‘Other departments’: Department for Energy Security and Net Zero; Department for Science, Innovation and Technology; Department for Transport; Foreign, Commonwealth and Development Office; HM Treasury; Ministry of Defence; Northern Ireland Office; Scotland Office; UK Export Finance
Figure 3.2.4: Percentage of public appointees from an ethnic minority background by appointment type, 31 March 2025
Category
Ethnic minority
White
Chair
8%
92%
Member
13%
87%
Individual Office Holder
18%
82%
Table 3.2.5: Percentage of public appointees from an ethnic minority background by appointment type, 2021 to 2025
Year
Percentage Chair (or equivalent)
Percentage Member (or equivalent)
Percentage Individual Office Holder
2025
8%
13%
18%
2024
12%
9%
No data available
2023
9%
12%
No data available
2022
8%
12%
No data available
2021
8%
11%
No data available
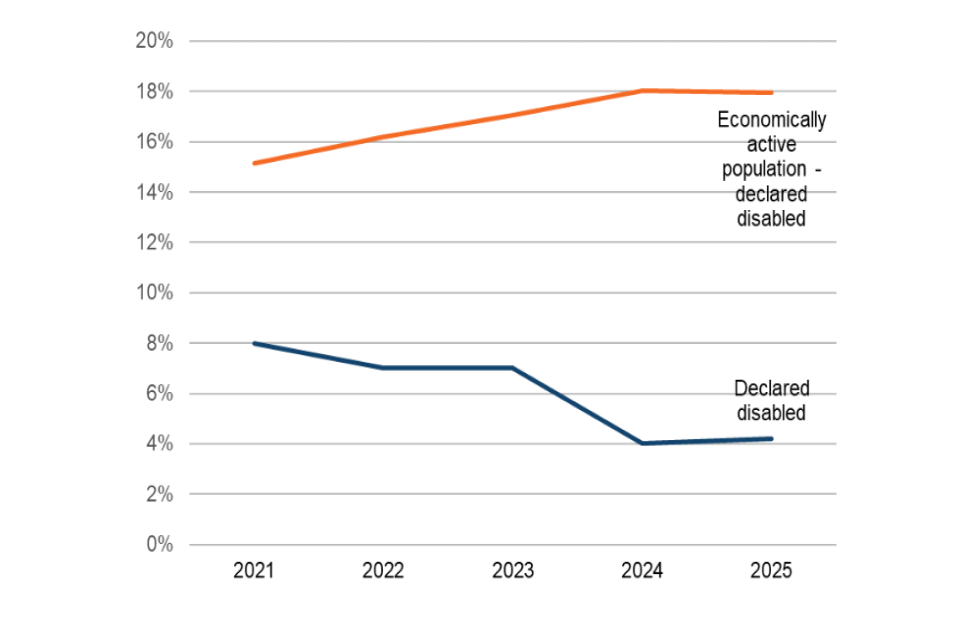
3.3 Diversity of Public Appointees - Disability
We have data on disability for 50% of appointees. Of these, as of 31st March 2025:
4% (97) have a declared disability, compared to 4% in 2024 and 7% in 2023 (figures 3.3.1 and 3.3.2).
The Department for Transport (15%) has the highest number of public appointees with a declared disability, followed by the Ministry of Defence (7%) (figure 3.3.3).
4% of both chairs and members have a declared disability (see figure 3.3.4)
Figure 3.3.1: Percentage of public appointees that have a declared disability, 2025
Category
%
Declared disabled
4%
Declared non disabled
96%
Figure 3.3.2: Percentage of public appointees that have a declared disability, 2021 to 2025
Year
Declared disabled
Economically active population declared disabled
2025
4%
18%
2024
4%
18%
2023
7%
17%
2022
7%
16%
2021
8%
15%
Figure 3.3.3: Percentage of public appointees that have a declared disability by ministerial department, 31 March 2025
Department
%
Department for Transport
15%
Ministry of Defence
7%
Department of Health and Social Care
5%
Department for Education
5%
Department for Culture, Media and Sport
4%
Department for Environment, Food and Rural Affairs
4%
Ministry of Justice
4%
Other departments
4%
‘Other departments’: Cabinet Office; Department for Business and Trade; Department for Energy Security and Net Zero; Department for Science, Innovation and Technology; Department for Work and Pensions; Foreign, Commonwealth and Development Office; HM Treasury; Home Office; Ministry of Housing, Communities and Local Government; Northern Ireland Office; Scotland Office; UK Export Finance
Figure 3.3.4: Percentage of public appointees that have a declared disability by appointment type, 31 March 2025
Category
Declared disabled
Declared non disabled
Chair
4%
96%
Member
4%
96%
3.4 Diversity of Public Appointees - Region
We have data on location for 54% of appointees. Of these, as of 31 March 2025:
62% (1,537) of all public appointees were based outside London and the South East, compared to 55% in 2024 and 65% in 2023 (table 3.4.1 and figure 3.4.2) .
The Ministry of Defence (85%) has the highest percentage of public appointees are based outside of London and the South East, followed by the Department for Environment, Food and Rural Affairs (68%) and the Department for Transport (66%) (figure 3.4.3).
56% of chairs were based outside London and the South East, alongside 63% of members and 54% of individual office holders (figure 3.4.4).
Table 3.4.1: Percentage of public appointees by region, 2023 to 2025
Region
2025
2024
2023
East Midlands
8%
8%
8%
East of England
9%
8%
9%
London
20%
15%
21%
North East
5%
5%
4%
North West
9%
10%
8%
Northern Ireland
2%
1%
2%
Scotland
3%
3%
3%
South East
19%
19%
13%
South West
10%
11%
11%
Various
Less than 1%
Less than 1%
No data available
Wales
3%
4%
4%
West Midlands
7%
8%
9%
Yorkshire and the Humber
4%
7%
7%
Figure 3.4.2: Percentage of public appointees based inside and outside London and the South East on 31 March, 2023 to 2025
Year
Inside London and the South East
Outside London and the South East
2025
38%
62%
2024
45%
55%
2023
35%
65%
Figure 3.4.3: Percentage of public appointees based outside London and the South East by ministerial department, 31 March 2025
Department
%
Ministry of Defence
85%
Other departments
71%
Department for Environment, Food and Rural Affairs
68%
Department for Transport
65%
Ministry of Justice
64%
Department for Education
63%
Department for Energy Security and Net Zero
59%
Department for Work and Pensions
56%
Department of Health and Social Care
53%
Department for Science, Innovation and Technology
53%
Department for Business and Trade
52%
Home Office
50%
Ministry of Housing, Communities and Local Government
48%
Cabinet Office
47%
Department for Culture, Media and Sport
41%
‘Other departments’: Foreign Commonwealth and Development Office; HM Treasury; Scotland Office; Northern Ireland Office; Scotland Office; UK Export Finance.
Figure 3.4.4: Percentage of public appointees based inside and outside London and the South East by appointment type, 31 March 2025
Category
Inside London and the South East
Outside London and the South East
Chair
44%
56%
Member
37%
63%
Individual Office Holder
46%
54%
Table 3.4.5: Public appointees based outside London and the South East by appointment type, 2023 to 2025
Year
Percentage Chair (or equivalent)
Percentage Member (or equivalent)
Percentage Individual Office Holder
2025
56%
63%
54%
2024
46%
66%
No data available
2023
58%
66%
No data available
3.5 Diversity of Public Appointees - Socio-Economic Background
Data on the socio-economic background of public appointees was collected for the first time in 2024-25. Using the Social Mobility Commission’s guidance, we are reporting on three key questions as there is a clear methodology in place to analyse and benchmark this data. The questions are:
Parental Occupation: When you were aged about 14, what was the occupation of the main or highest income earner?
School type: Which type of secondary school did you attend for the most time between the ages of 11 and 16?
Free School Meals: If you finished school after 1980, were you eligible for free school meals at any time between the ages of 11 and 16?
18% of appointees provided information on socio-economic background. Of these, as of 31 March 2025:
67% of public appointees were from a professional background, with 27% being from a working class background (figure 3.5.1).
The Northern Ireland Office (58%) has the highest percentage of public appointees from a working class background, followed by the Ministry of Housing, Communities and Local Government (43%) (figure 3.5.2).
17% of public appointees attended an independent or fee paying school (table 3.5.3).
20% of public appointees were eligible for free school meals (table 3.5.6).
Figure 3.5.1: Percentage of public appointees by parental occupation, 31 March 2025
Category
%
Professional backgrounds
67%
Intermediate backgrounds
6%
Working class backgrounds
27%
Figure 3.5.2: Percentage of public appointees from a working class background by ministerial department, 31 March 2025
Department
%
Northern Ireland Office
58%
Ministry of Housing, Communities and Local Government
43%
Department for Work and Pensions
36%
Ministry of Justice
34%
Department for Education
34%
Ministry of Defence
32%
Department for Energy Security and Net Zero
29%
Department for Transport
27%
HM Treasury
25%
Department for Environment, Food and Rural Affairs
24%
Home Office
23%
Department for Business and Trade
23%
Department of Health and Social Care
21%
Department for Culture, Media and Sport
18%
Other departments
16%
‘Other departments’: Cabinet Office; Department for Science, Innovation and Technology; Foreign Commonwealth and Development Office; ; Scotland Office; Scotland Office; UK Export Finance.
Table 3.5.3: Percentage of public appointees by secondary school type, 31 March 2025
Year
Percentage independent or fee paying school
Percentage other types of secondary school
2025
17%
83%
Figure 3.5.4: Percentage of public appointees by secondary school type and appointment type, 31 March 2025
Category
Independent or fee-paying school
Not an independent or fee-paying school
Chair
24%
76%
Member
16%
84%
Individual Office Holder
24%
76%
Figure 3.5.5: Percentage of public appointees that attended an independent or fee paying school by ministerial department, 31 March 2025
Department
%
Department for Culture, Media and Sport
27%
Department for Business and Trade
20%
Department for Environment, Food and Rural Affairs
19%
Ministry of Defence
18%
Department for Energy Security and Net Zero
18%
Department for Work and Pensions
16%
Other departments
12%
Department of Health and Social Care
11%
Ministry of Justice
8%
Department for Education
8%
‘Other departments’: Cabinet Office; Department for Science, Innovation and Technology; Department for Transport
Table 3.5.6: Percentage of public appointees that were eligible for free school meals, 31 March 2025
Year
Percentage eligible
Percentage not eligible
Percentage don’t know
2025
20%
77%
3%
3.6 Diversity of Appointments Made in 2024-25
Explanatory note 5: Diversity of appointments made in-year
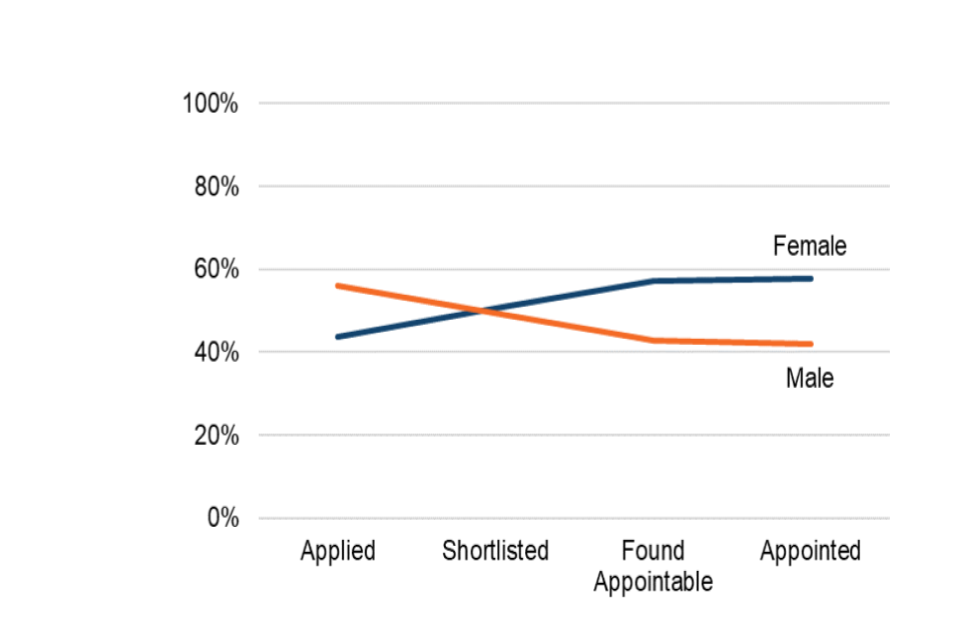
The public appointments digital service records the diversity data of applicants at four different stages of the appointment process. These stages are:
Applied: This is the first stage of the appointment process. All candidates that submit an application are included in this stage.
Shortlisted: Candidates that are shortlisted for an interview.
Found appointable: Candidates found appointable for a role (as assessed by the Advisory Assessment Panel).
Appointed: Candidates that are appointed to a role.
The purpose of providing data by application stage is to show the diversity characteristics of candidates at different stages of the appointment process. The percentages between stages cannot be compared as they relate to different groups of candidates.
Within the 2024-25 financial year, for those that provided diversity information:
58% of public appointments were made to female candidates (table 3.6.1 and figure 3.6.2).
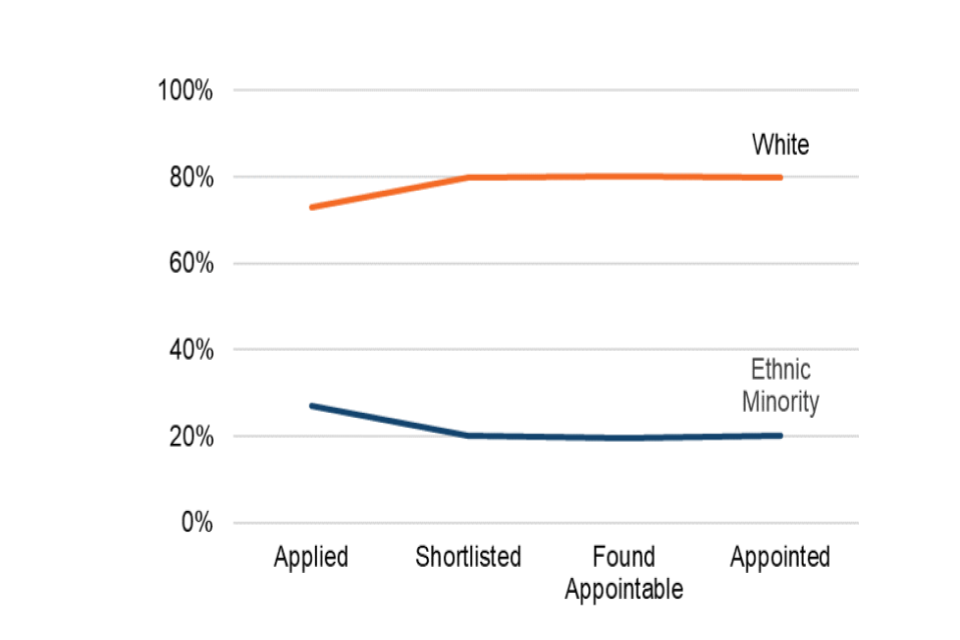
20% of public appointments were made to candidates from an ethnic minority background (table 3.6.3 and figure 3.6.4).
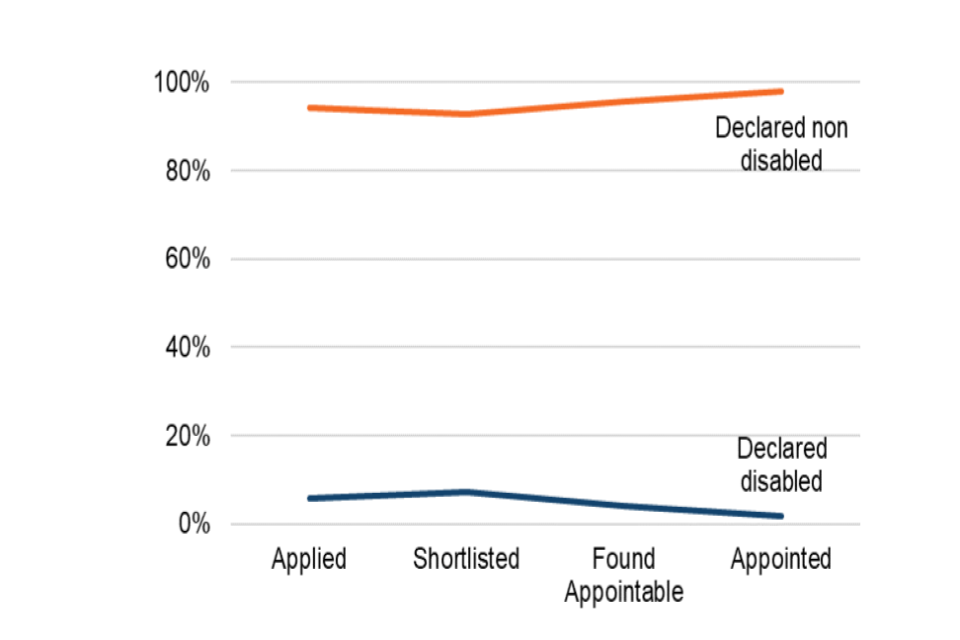
2% of public appointments were made to candidates who declared a disability (table 3.6.5 and figure 3.6.6).
59% of public appointments were made to candidates who are outside of London and the South East (table 3.6.7 and figure 3.6.8).
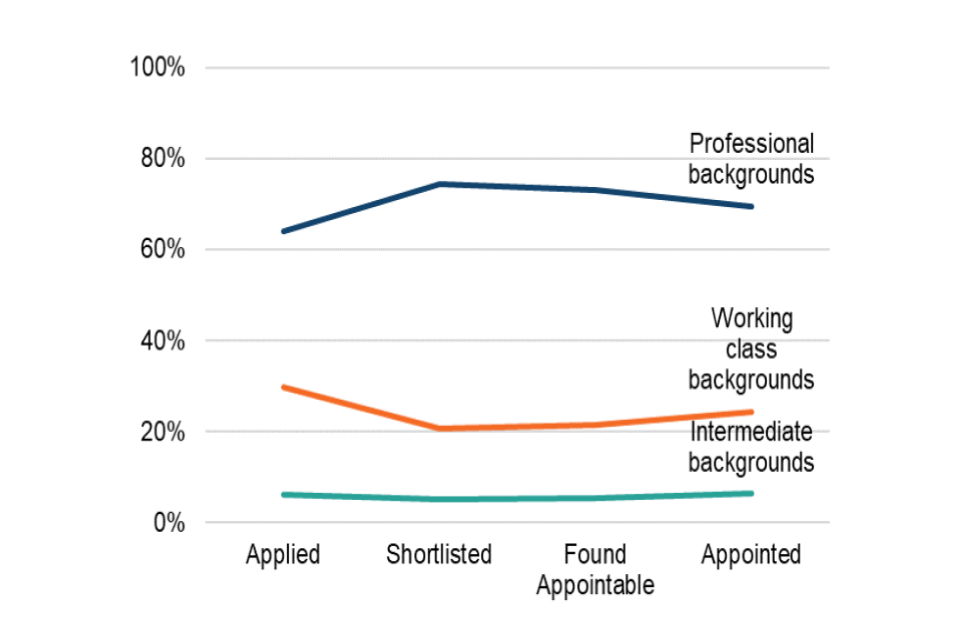
24% of public appointments were made to candidates from a working class background (table 3.6.9 and figure 3.6.10).
Table 3.6.1: Percentage of female and male candidates by campaign stage
Application stage
Percentage female
Percentage male
Applied
44%
56%
Shortlisted
51%
49%
Found Appointable
57%
43%
Appointed
58%
42%
Figure 3.6.2: Percentage of female and male candidates by campaign stage
Sex
Applied
Shortlisted
Found Appointable
Appointed
Female
44%
51%
57%
58%
Male
56%
49%
43%
42%
Table 3.6.3: Percentage of candidates from ethnic minority and white backgrounds, by campaign stage
Application stage
Percentage ethnic minority
Percentage white
Applied
27%
73%
Shortlisted
20%
80%
Found Appointable
20%
80%
Appointed
20%
80%
Figure 3.6.4: Percentage of ethnic minority and white candidates by campaign stage
Ethnicity
Applied
Shortlisted
Found Appointable
Appointed
Ethnic Minority
27%
20%
20%
20%
White
73%
80%
80%
80%
Table 3.6.5: Percentage of candidates that have declared a disability by campaign stage
Application stage
Percentage declared a disability
Percentage not declared a disability
Applied
6%
94%
Shortlisted
7%
93%
Found Appointable
4%
96%
Appointed
2%
98%
Figure 3.6.6: Percentage of candidates that declared a disability by campaign stage
Disability
Applied
Shortlisted
Found Appointable
Appointed
Declared disabled
6%
7%
4%
2%
Declared non disabled
94%
93%
96%
98%
Table 3.6.7: Percentage of candidates inside and outside of London and the South East by campaign stage
Application stage
Percentage inside of London & South East
Percentage outside London & South East
Applied
44%
56%
Shortlisted
45%
55%
Found Appointable
40%
60%
Appointed
41%
59%
Figure 3.6.8: Percentage of candidates inside and outside of London and the South East by campaign stage
Region
Applied
Shortlisted
Found Appointable
Appointed
Inside of London & South East
44%
45%
40%
41%
Outside London & South East
56%
55%
60%
59%
Table 3.6.9: Percentage of candidates whose parents are from professional, intermediate and working class backgrounds by campaign stage
Application stage
Percentage professional backgrounds
Percentage intermediate backgrounds
Percentage working class backgrounds
Applied
64%
6%
30%
Shortlisted
74%
5%
21%
Found Appointable
73%
5%
21%
Appointed
70%
6%
24%
Figure 3.6.10: Percentage of candidates whose parents are from professional, intermediate and working class backgrounds by campaign stage
Region
Applied
Shortlisted
Found Appointable
Appointed
Professional backgrounds
64%
74%
73%
70%
Intermediate backgrounds
6%
5%
5%
6%
Working class
backgrounds
30%
21%
21%
24%
Section 4: Candidate Feedback
All candidates that apply for a public appointment through the public appointments digital service are asked to provide feedback at the end of the process. Under the Governance Code on Public Appointments, ministerial departments are responsible for engaging with candidates and providing a good service to individuals who have applied for appointments.
Explanatory Note 6: Candidate Feedback
All candidates are asked the following two questions:
Overall, how would you rate your experience of the application process?
How informed did you feel throughout the application process?
Candidates shortlisted for interview are also asked:
How would you rate the interview process?
Each question is scored 1-5 (with 1 being the lowest and 5 being the highest) so total feedback scores are between 2-10 for non-shortlisted candidates and 3-15 for shortlisted candidates.
In 2024-25:
391 feedback responses were submitted by candidates.
Average feedback scores were 6.2 out of 10 for candidates not shortlisted for interview and 11.5 out of 15 for candidates shortlisted for interview (table 4.2).
The Ministry of Justice (7.9 out of 10) and the Department of Health and Social Care (7.3 out of 10) received the highest average feedback score from candidates not shortlisted for interview (figure 4.3).
The Department for Business and Trade (13.5 out of 15), the Cabinet Office (13.4 out of 15) and the Department for Environment, Food and Rural Affairs (13.3 out of 15) received the highest average feedback score from candidates shortlisted for interview (figure 4.4).
Table 4.1: Total number of feedback responses received from candidates, 2023-24 to 2024-25
Year
Shortlisted
Not shortlisted
2024-25
96
295
2023-24
15
98
Table 4.2: Average feedback score from candidates shortlisted and not shortlisted, 2023-24 to 2024-25
Year
Average score given by candidates not shortlisted (out of 10)
Average score given by shortlisted candidates (out of 15)
2024-25
6.2
11.5
2023-24
5.4
10.4
Figure 4.3: Average feedback score from candidates that were not shortlisted by ministerial department in 2024-25
Department
Score
Ministry of Justice
7.9
Department of Health and Social Care
7.3
Department for Business and Trade
6.8
Ministry of Housing, Communities and Local Government
6.5
Department for Energy Security and Net Zero
6.5
HM Treasury
6.3
Department for Transport
6.2
Department for Environment, Food and Rural Affairs
6.2
Department for Education
6.2
Department for Science, Innovation and Technology
6.2
Foreign Commonwealth and Development Office
6.0
Department for Culture, Media and Sport
5.9
Department for Work and Pensions
5.9
Cabinet Office
5.6
Home Office
5.0
Ministry of Defence
4.3
Figure 4.4: Average feedback score from shortlisted candidates by ministerial department in 2024-25
Department
Score
Department for Business and Trade
13.5
Cabinet Office
13.4
Department for Environment, Food and Rural Affairs
13.3
Department of Health and Social Care
11.5
Department for Education
11.5
Ministry of Justice
11.4
Ministry of Defence
11.3
Home Office
11.1
Department for Science, Innovation and Technology
10.5
Department for Work and Pensions
10.3
Ministry of Housing, Communities and Local Government
9.5
Department for Culture, Media and Sport
9.0
Department for Transport
7.5
Section 5: Public Appointment Headcount
On 31 March 2025:
There were 3,915 public appointees in post, holding 4,033 public appointments (table 5.1 and figure 5.2). Some public appointees hold multiple public appointments, as the time commitment for each role can vary.
3,698 public appointments (92%) were member (or equivalent) roles. 229 were chairs (or equivalent) and 106 were individual office holders (table 5.3).
2,194 (54%) of all appointments were in bodies and offices sponsored by the Ministry of Justice (figure 5.4).
The five departments with the highest number of public appointees (Ministry of Justice, Department for Culture Media and Sport, Ministry of Defence, Department for Environment, Food and Rural Affairs and Department of Health and Social Care) account for 65% of all public appointments.
Table 5.1: Total number of public appointments, 2021 to 2025
Year
Total number of public appointments
2025
4,033
2024
3,855
2023
4,356
2022
4,473
2021
4,638
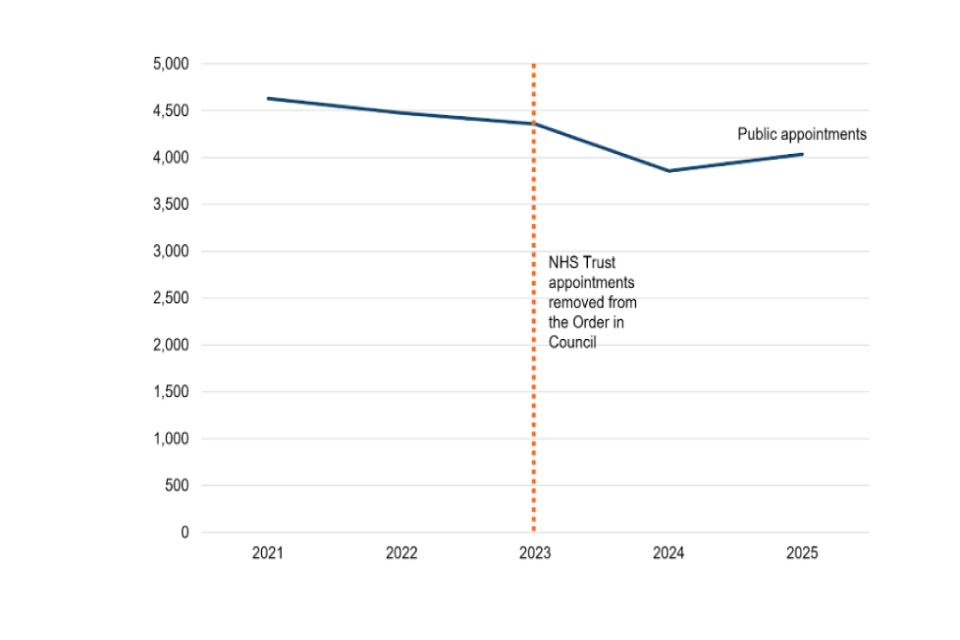
Figure 5.2: Total number of public appointments, 2021 to 2025
Label
Public Appointments - Total
2021
4,628
2022
4,473
2023
4,356
2024
3,855
2025
2,169
Explanatory Note 6: Public Appointment Headcount
The number of public appointments and public appointees varies from year to year due to planned and unplanned departures, changes to the composition of boards and the creation and closure of public bodies and offices.
All data in this section relates to the number of public appointments (as opposed to public appointees) on the 31 March of the given year.
Table 5.3: Total number of public appointments by appointment type, 2021 to 2025
Year
Chairs (or equivalent)
Members (or equivalent)
Individual Office Holders
2025
229
3,698
106
2024
320
3,535
Data not collected
2023
306
4,050
Data not collected
2022
349
4,127
Data not collected
2021
356
4,282
Data not collected
Figure 5.4: Total number of public appointments by ministerial department, 31 March 2025
Department
Total
Ministry of Justice
2,194
Department for Culture, Media and Sport
358
Ministry of Defence
234
Department for Environment, Food and Rural Affairs
200
Department of Health and Social Care
175
Department for Business and Trade
165
Department for Education
119
Home Office
97
Department for Work and Pensions
80
Department for Transport
79
Cabinet Office
67
Ministry of Housing, Communities and Local Government
62
Department for Energy Security and Net Zero
58
Northern Ireland Office
44
HM Treasury
41
Department for Science, Innovation and Technology
28
Foreign Commonwealth and Development Office
21
UK Export Finance
8
Scotland Office
2
Attorney General’s Office
1
Figure 5.5: Total number of public appointments by ministerial department, excluding Ministry of Justice delegated roles, 31 March 2025
Department
Total
Ministry of Justice
598
Department for Culture, Media and Sport
358
Ministry of Defence
234
Department for Environment, Food and Rural Affairs
200
Department of Health and Social Care
175
Department for Business and Trade
165
Department for Education
119
Home Office
97
Department for Work and Pensions
80
Department for Transport
79
Cabinet Office
67
Ministry of Housing, Communities and Local Government
62
Department for Energy Security and Net Zero
58
Northern Ireland Office
44
HM Treasury
41
Department for Science, Innovation and Technology
28
Foreign Commonwealth and Development Office
21
UK Export Finance
8
Scotland Office
2
Attorney General’s Office
1
Explanatory Note 7: Ministry of Justice delegated roles
Under the Governance Code on Public Appointments, ministers may, where they have the power to do so, choose to delegate responsibility for certain appointments to the appropriate body in question to run and make appointments.
Ministers at the Ministry of Justice have delegated responsibility for the following appointments:
Advisory Committees of Justices of the Peace
Independent Monitoring Boards of any prison or young offender institution (members)
Lay Observers, appointed in accordance with section 81(1)(b) of the Criminal Justice Act 1991
Multi Agency Public Protection Arrangement Lay Advisors (with the exception of the final appointment decision, which remains with ministers)
The responsibility for these appointments was delegated by ministers because of the volume and local nature of these roles, but ministers remain accountable for them.
Table 5.6: Total number of public appointments by ministerial department, 2021 to 2025
Ministerial Department
2025
2024
2023
2022
2021
Attorney General’s Office
1
1
1
1
1
Cabinet Office
67
79
52
60
63
Department for Business and Trade
165
157
See explanatory note 8
See explanatory note 8
See explanatory note 8
Department for Energy Security & Net Zero
58
71
See explanatory note 8
See explanatory note 8
See explanatory note 8
Department for Science, Innovation & Technology
28
32
See explanatory note 8
See explanatory note 8
See explanatory note 8
Department for Business, Energy & Industrial Strategy
See explanatory note 8
See explanatory note 8
93
167
213
Department for Culture, Media and Sport
358
357
327
383
378
Department for Education
119
119
119
122
131
Department for Environment, Food & Rural Affairs
200
205
211
214
213
Department for Transport
79
105
75
80
86
Department for Work and Pensions
80
69
64
71
75
Department of Health and Social Care
175
171
604
607
622
Foreign, Commonwealth & Development Office
21
39
35
40
44
HM Treasury
41
45
35
36
39
Home Office
97
110
126
137
124
Ministry of Defence
234
207
265
255
300
Ministry of Housing, Communities & Local Government
62
55
50
68
61
Ministry of Justice
2,194
1,991
2,259
2,196
2,267
Northern Ireland Office
44
35
31
30
30
Scotland Office
2
1
2
0
3
UK Export Finance
8
6
7
7
7
Total
4,033
3,855
4,356
4,473
4,638
Explanatory Note 8: Machinery of Government Changes
The Ministry of Housing, Communities & Local Government was called the Department for Levelling Up, Housing and Communities between September 2021 and July 2024.
The Department for Business, Energy & Industrial Strategy was split to form the Department for Business and Trade (DBT), the Department for Energy Security and Net Zero (DESNZ) and the Department for Science, Innovation and Technology (DSIT) in February 2023.
Department of Health and Social Care data for 31 March 2021, 2022 and 2023, includes NHS Trust appointments that are no longer on the Order in Council.
Section 6: Appointments Made in 2024-25
In 2024-25:
449 new appointments were made by UK government ministers in 2024-25 (figure 6.1).
Of these appointments, 379 (84%) were for member (or equivalent) roles (figure 6.2).
Over half of all new appointments were made by the Ministry of Justice and the Department for Culture Media and Sport (figure 6.3).
Figure 6.1: Total number of new appointments made in 2024-25 and 2023-24
Year
Total
2024-25
449
2023-24
414
Figure 6.2: New appointments made by appointment type, 2024-25
Category
Total
Chair
43
Member
379
Individual Office Holder
27
Figure 6.3: New appointments made by each ministerial department, 2024-25
Department
Total
Ministry of Justice
197
Department for Culture, Media and Sport
51
Department for Environment, Food and Rural Affairs
30
Home Office
28
Department of Health and Social Care
26
Department for Education
23
Department for Business and Trade
23
Ministry of Housing, Communities and Local Government
13
Department for Work and Pensions
12
Cabinet Office
12
Department for Transport
11
Department for Energy Security and Net Zero
7
Ministry of Defence
6
HM Treasury
4
Northern Ireland Office
3
Department for Science, Innovation and Technology
2
Scotland Office
1
Section 7: Applications Submitted in Year
The public appointments digital service was launched in 2023. In 2024-25, 10,538 applications for regulated roles were submitted through the digital service. The figures exclude withdrawn applications and applications made outside of the digital service, for example via executive search.
Figure 7.1: Total number of applications submitted through the public appointments digital service, 2024-25 and 2023-24
Year
Total
2024-25
10,538
2023-24
7,136
Statistical Note: Data Collection and Reporting Methodology
1. The Governance Code on Public Appointments sets out the process and principles that should underpin all public appointments made to bodies and offices listed in the Public Appointments Order in Council (PDF, 241KB). Public appointments to bodies and offices listed on the Order in Council are regulated by the independent Commissioner for Public Appointments.
2. The data in this report covers public appointments made by United Kingdom government ministers to the bodies and offices listed in the Schedule to the Public Appointments Order in Council.
3. The public appointments digital service is the online portal on gov.uk which candidates use to search and securely apply for public appointment roles. The service is the primary source of data for this report. Supplementary data has been collected from the Ministry of Justice on delegated appointments (see explanatory note 7). In order to produce this report, data was extracted from the digital service on the following dates:
Section 2: 10th September 2025
Section 3.1-3.5 and section 5: 2nd April 2025 (with the exception of MOJ delegated appointments as this data is not collected or held on the digital service)
Section 3.6, section 6 and section 7: 9th July 2025
Section 4: 10th July 2025.
4. Information (including but not limited to diversity data) is collected from candidates as part of the online application process via the ‘Apply for a Public Appointment’ portal. This information is then securely stored within the public appointments digital service. For candidates that are appointed to a role, a snapshot of their data is taken on the 31st March each year to ensure that there is a standardised and consistent basis for reporting. Both applicants and incumbents (individuals that hold public appointments) are able to review and amend their data prior to the snapshot being taken via their online account.
5. Prior to the introduction of the public appointments digital service in 2023, data was manually collated and submitted to the Cabinet Office by ministerial departments. The digital service should ensure greater consistency and reliability of data in future reporting years.
6. Historical data is included in order to provide context for this year’s report. Caution is advised when making direct comparisons with historical data given the change in the way data is collected. In addition, some data is being published for the first time, as the amount and quality of data held on the public appointments digital service continues to expand.
7. Values in this report are rounded to the nearest whole number (with the exception of candidate feedback scores) which may result in discrepancies in bar graphs.
8. It is important to note that:
Campaign duration: (section 2): Campaigns completed in three months are those with a duration of 90 days or less. Those not completed in three months have a duration of more than 90 days.
For campaign stage data, a limited number of campaigns were excluded from the analysis due to data inconsistencies.
Diversity of public appointees (section 3):
Diversity data figures are strongly influenced by the Ministry of Justice as they make up 54% of public appointees.
Headcount values relating to diversity characteristics based on fewer than five responses are not shown in this report to protect individual confidentiality and because the numbers are too small to draw reliable conclusions. However, these figures are included in totals and in the ‘other departments’ groups in graphs and tables. Where 0% is specified, it indicates a nil response.
Percentage breakdowns for diversity only include responses that provided known information about a given characteristic and do not include those who chose ‘prefer not to say’. This means, for example, the total ethnic background sample excludes those who did not provide this data or who chose the ‘prefer not to say’ option.
Ethnic minority refers to any non-white ethnic group.
Following the introduction of the two stage question on disability in 2020 (in line with the government analysis function’s harmonised standards) but prior to the introduction of the public appointments digital service, some ministerial departments continued to ask candidates the single stage question. Within this report only data relating to the two stage question is included.
Diversity data relating to Ministry of Justice delegated roles is not held on the public appointments digital service and so is provided by them. Diversity of appointments made in 2024-25 excludes appointments made to these delegated roles.
For the purposes of benchmarking, data in section 3 is presented alongside official data published by the ONS. This report benchmarks the diversity of public appointments against the UK’s “economically active” population. According to the ONS, “economically active” refers to people aged 16 or over who are either in employment or unemployed during a specific reference week. This means they are active participants in the labour market, whether they have a job, are self-employed, are unpaid family workers, or are actively looking for work.
Candidate care (section 4):
Data is based on the date that the feedback form was last updated.
Appointments made in 2024-25 (section 6):
Data is included based on the date that an appointee accepted their offer of appointment. In previous years the appointee’s start date was used.
Applications submitted in year (section 7):
The number of applications is a count of applications submitted, not the total number of applicants. Each application submitted by a single person is counted separately.
Response Rates
Sex
Department
Response Rate: Sex
Cabinet Office
61%
Department for Business and Trade
77%
Department for Culture, Media and Sport
85%
Department for Education
95%
Department for Energy Security & Net Zero
54%
Department for Environment, Food & Rural Affairs
68%
Department for Science, Innovation & Technology
54%
Department for Transport
45%
Department for Work and Pensions
89%
Department of Health and Social Care
95%
Foreign Commonwealth & Development Office
15%
HM Treasury
37%
Home Office
55%
Ministry of Defence
40%
Ministry of Housing, Communities & Local Government
58%
Ministry of Justice
53%
Northern Ireland Office
68%
Scotland Office
50%
UK Export Finance
43%
All Departments
65%
Disability
Department
Response Rate: Disability
Cabinet Office
52%
Department for Business and Trade
70%
Department for Culture, Media and Sport
75%
Department for Education
92%
Department for Energy Security & Net Zero
52%
Department for Environment, Food & Rural Affairs
66%
Department for Science, Innovation & Technology
54%
Department for Transport
43%
Department for Work and Pensions
79%
Department of Health and Social Care
93%
Foreign Commonwealth & Development Office
14%
HM Treasury
34%
Home Office
54%
Ministry of Defence
32%
Ministry of Housing, Communities & Local Government
52%
Ministry of Justice
46%
Northern Ireland Office
64%
Scotland Office
50%
UK Export Finance
38%
All Departments
53%
Ethnicity
Department
Response Rate: Ethnicity
Cabinet Office
54%
Department for Business and Trade
72%
Department for Culture, Media and Sport
77%
Department for Education
93%
Department for Energy Security & Net Zero
52%
Department for Environment, Food & Rural Affairs
68%
Department for Science, Innovation & Technology
54%
Department for Transport
43%
Department for Work and Pensions
81%
Department of Health and Social Care
93%
Foreign Commonwealth & Development Office
14%
HM Treasury
37%
Home Office
54%
Ministry of Defence
32%
Ministry of Housing, Communities & Local Government
53%
Ministry of Justice
45%
Northern Ireland Office
64%
Scotland Office
50%
UK Export Finance
38%
All Departments
53%
Region
Department
Response Rate: Region
Cabinet Office
48%
Department for Business and Trade
53%
Department for Culture, Media and Sport
61%
Department for Education
74%
Department for Energy Security & Net Zero
50%
Department for Environment, Food & Rural Affairs
60%
Department for Science, Innovation & Technology
54%
Department for Transport
39%
Department for Work and Pensions
71%
Department of Health and Social Care
76%
Foreign Commonwealth & Development Office
5%
HM Treasury
22%
Home Office
49%
Ministry of Defence
26%
Ministry of Housing, Communities & Local Government
47%
Ministry of Justice
54%
Northern Ireland Office
50%
Scotland Office
50%
UK Export Finance
63%
All Departments
54%
Sources
The information in this report has been derived from the following data sources:
The ‘Apply for a Public Appointment’ digital service;